A pair of congenic mice for imaging of transplants by positron emission tomography using anti-transferrin receptor nanobodies
- Program for Cellular and Molecular Medicine, Boston Children’s Hospital, Harvard Medical School, United States
- Unité de Recherche en Physiologie Moléculaire, Namur Research Institute for Life Sciences (NARILIS), Université de Namur, Belgium
- CBS2 University of Montpellier, France
- University of Barcelona, Spain
- Laboratory for Therapeutic and Diagnostic Antibodies, KU Leuven Campus Gasthuisberg O and N2, Belgium
- Dana-Farber Cancer Institute, Harvard Medical School, United States
- VIB Center for Brain and Disease Research, KU Leuven Campus Gasthuisberg O and N5, Belgium
Figures
Figure 1 with 1 supplement
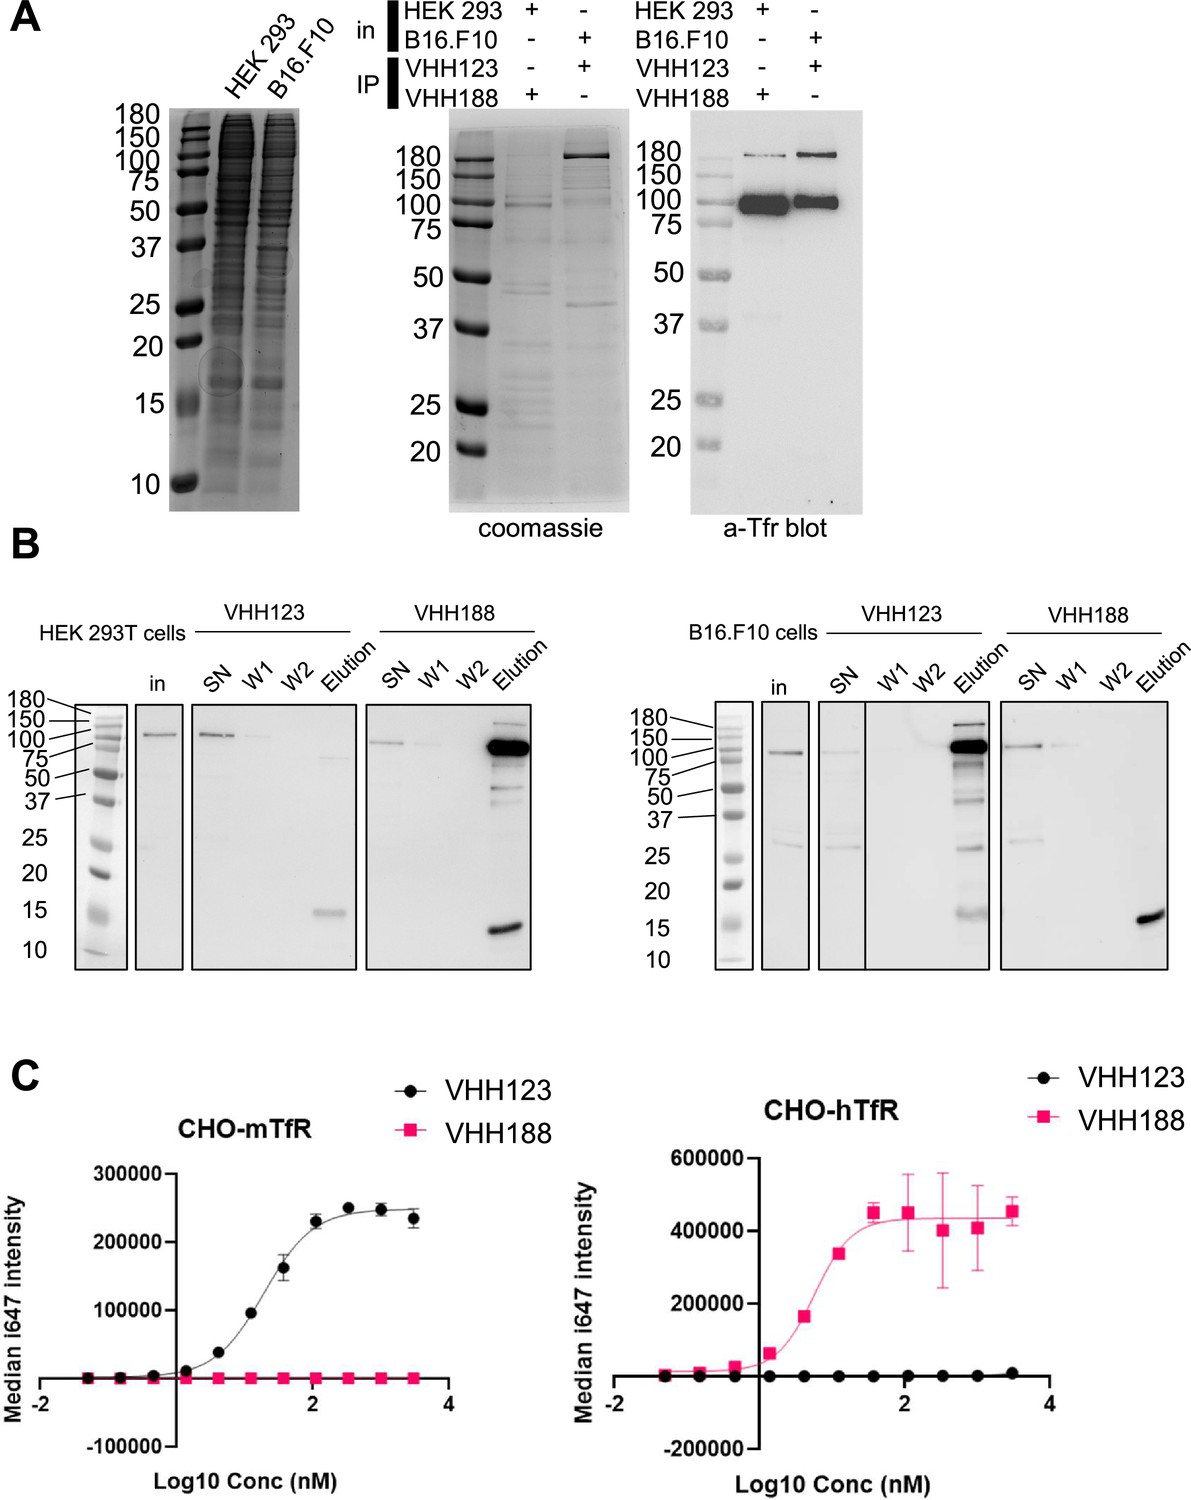
Binding specificities of VHH123 and VHH188.
(A) Left-most panel: Coomassie staining of an SDS-PAGE gel showing the input cell lysates used in immunoprecipitation experiments depicted in the next panels. Middle panel: lysates as shown on left-side panel were incubated with nanobody-coated paramagnetic beads overnight. Beads were then washed five times then boiled in SDS sample buffer before loading on SDS-PAGE. This panel shows Coomassie staining of SDS-PAGE of the bead eluates. In: input lysates. IP: Nanobody used for immunoprecipitation. Right panel: the same eluates as in middle panel were run on SDS-PAGE gel then transferred to a PVDF membrane. Membrane was blocked, stained using a mouse monoclonal anti-transferrin receptor (TfR) (cross-reactive for human and mouse), washed then stained with an anti-mouse-HRP secondary monoclonal. See Methods section for more details. Experiment repeated a total of two times. (B) Cell lines were incubated with 35S-labeled Met before performing the same immunoprecipitation procedure as described in A, with the exception that the beads were washed only twice before elution in Laemmli buffer. SDS-PAGE was run with input cell lysate (in), unbound fraction (SN), washes (W1 and W2), and eluates for each condition before transfer to a PVDF membrane. Membrane was blocked, stained using a mouse monoclonal anti-TfR (cross-reactive for human and mouse), washed then stained with an anti-mouse-HRP secondary monoclonal. Experiment repeated a total of two times. (C) Flow cytometry characterization of the specificity of VHH123 and VHH188. CHO cells overexpressing either the mouse isoform of TfR (mTfr, left panel) or human isoform (hTfr, right panel) were labeled with serial dilutions of either Flag-tagged VHH123 or VHH188. I647-fluorescently labeled anti-FLAG IgG was used to detect the presence of either VHH at the cell surface by flow cytometry. Experiment repeated a total of two times.
-
Figure 1—source data 1
PDF file containing original gels and western blots for Figure 1A and B, indicating the relevant bands and treatments.
- https://cdn.elifesciences.org/articles/104302/elife-104302-fig1-data1-v1.zip
-
Figure 1—source data 2
Original files for gels and western blots displayed in Figure 1A and B.
- https://cdn.elifesciences.org/articles/104302/elife-104302-fig1-data2-v1.zip
Figure 1—figure supplement 1
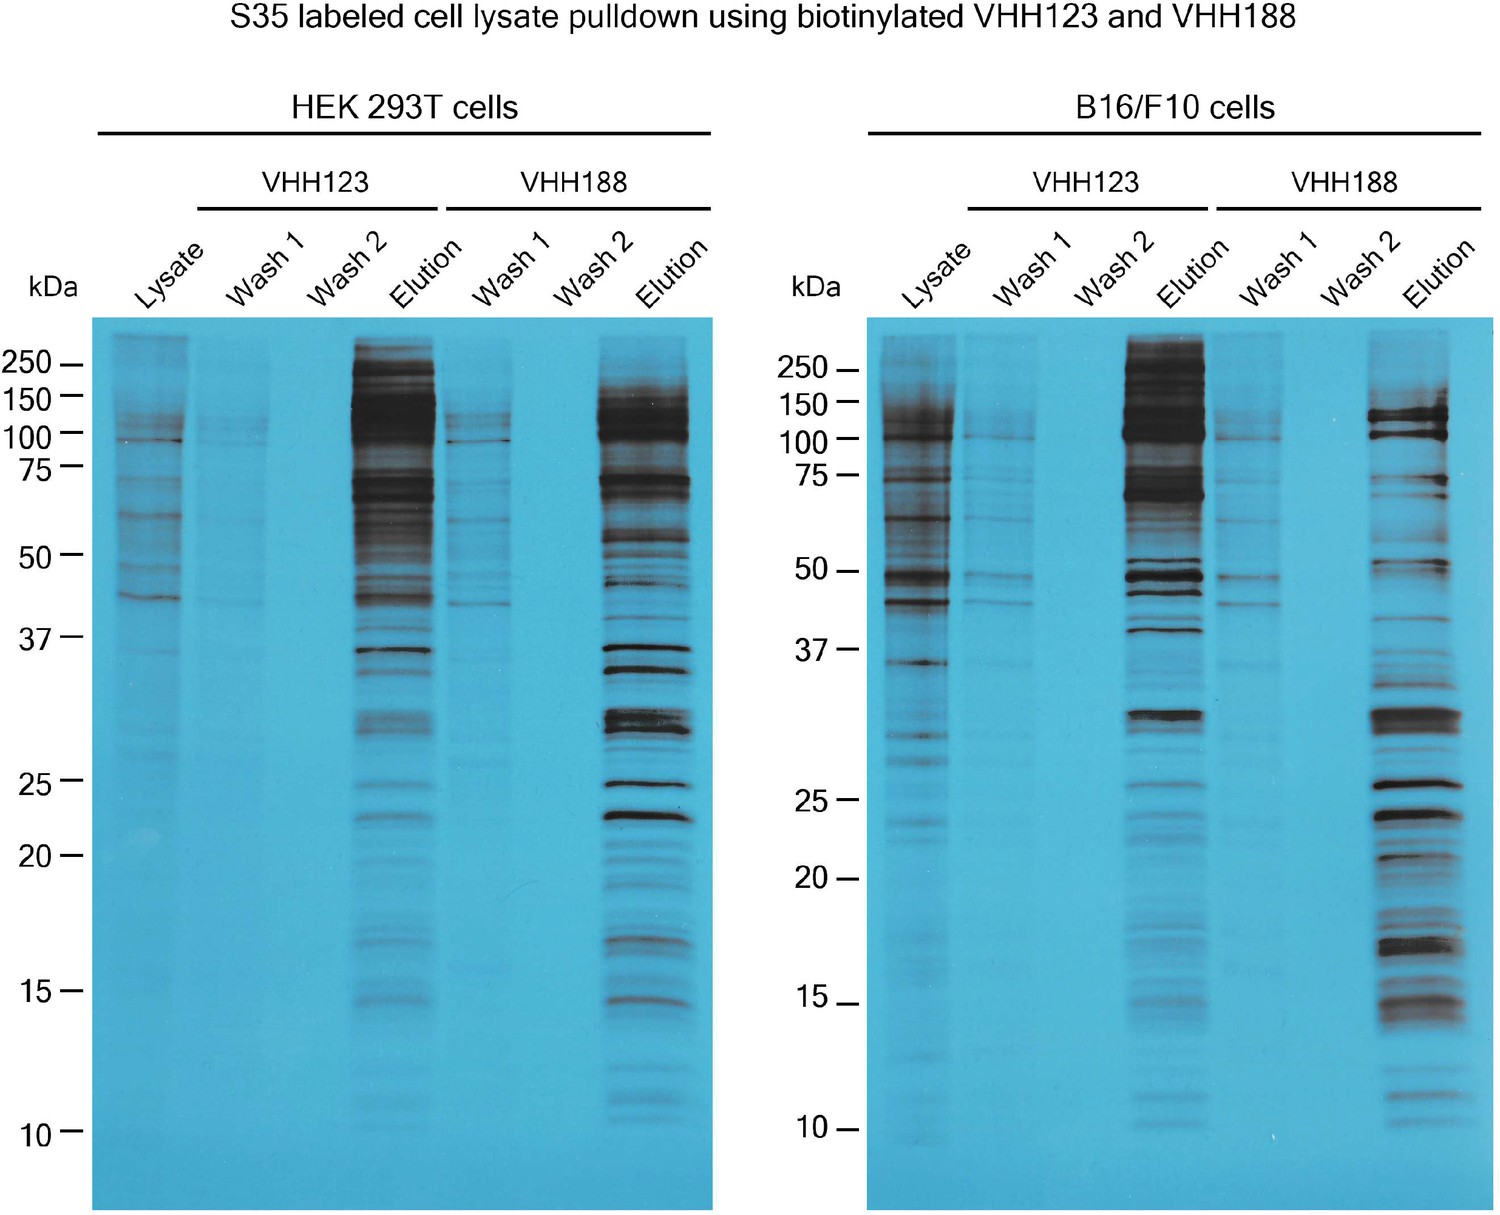
Autoradiograph of 35S labeled lysates of HEK 293T cells and B16.
F10 cells that were used in pull-down experiments for Figure 1B. Cell lines were incubated with 35S-labeled Met before incubation (see methods) with nanobody-coated paramagnetic beads overnight (VHH123 or VHH188 as shown above corresponding lanes). Beads were then washed two times then boiled in Laemmli buffer before loading on SDS-PAGE. SDS-PAGE was run with input cell lysate (lysate), washes 1 and 2 and eluates for each condition. Gel was then prepared for autoradiography (see methods) before being placed on top of an X-ray film. Gel and film were stored together at –80 °C for 24 hr before developing.
-
Figure 1—figure supplement 1—source data 1
PDF file containing the original autoradiograph film scan of Figure 1—figure supplement 1, indicating the relevant bands and treatments.
- https://cdn.elifesciences.org/articles/104302/elife-104302-fig1-figsupp1-data1-v1.zip
-
Figure 1—figure supplement 1—source data 2
Original file of the autoradiograph film scan of Figure 1—figure supplement 1.
- https://cdn.elifesciences.org/articles/104302/elife-104302-fig1-figsupp1-data2-v1.zip
Figure 2 with 6 supplements
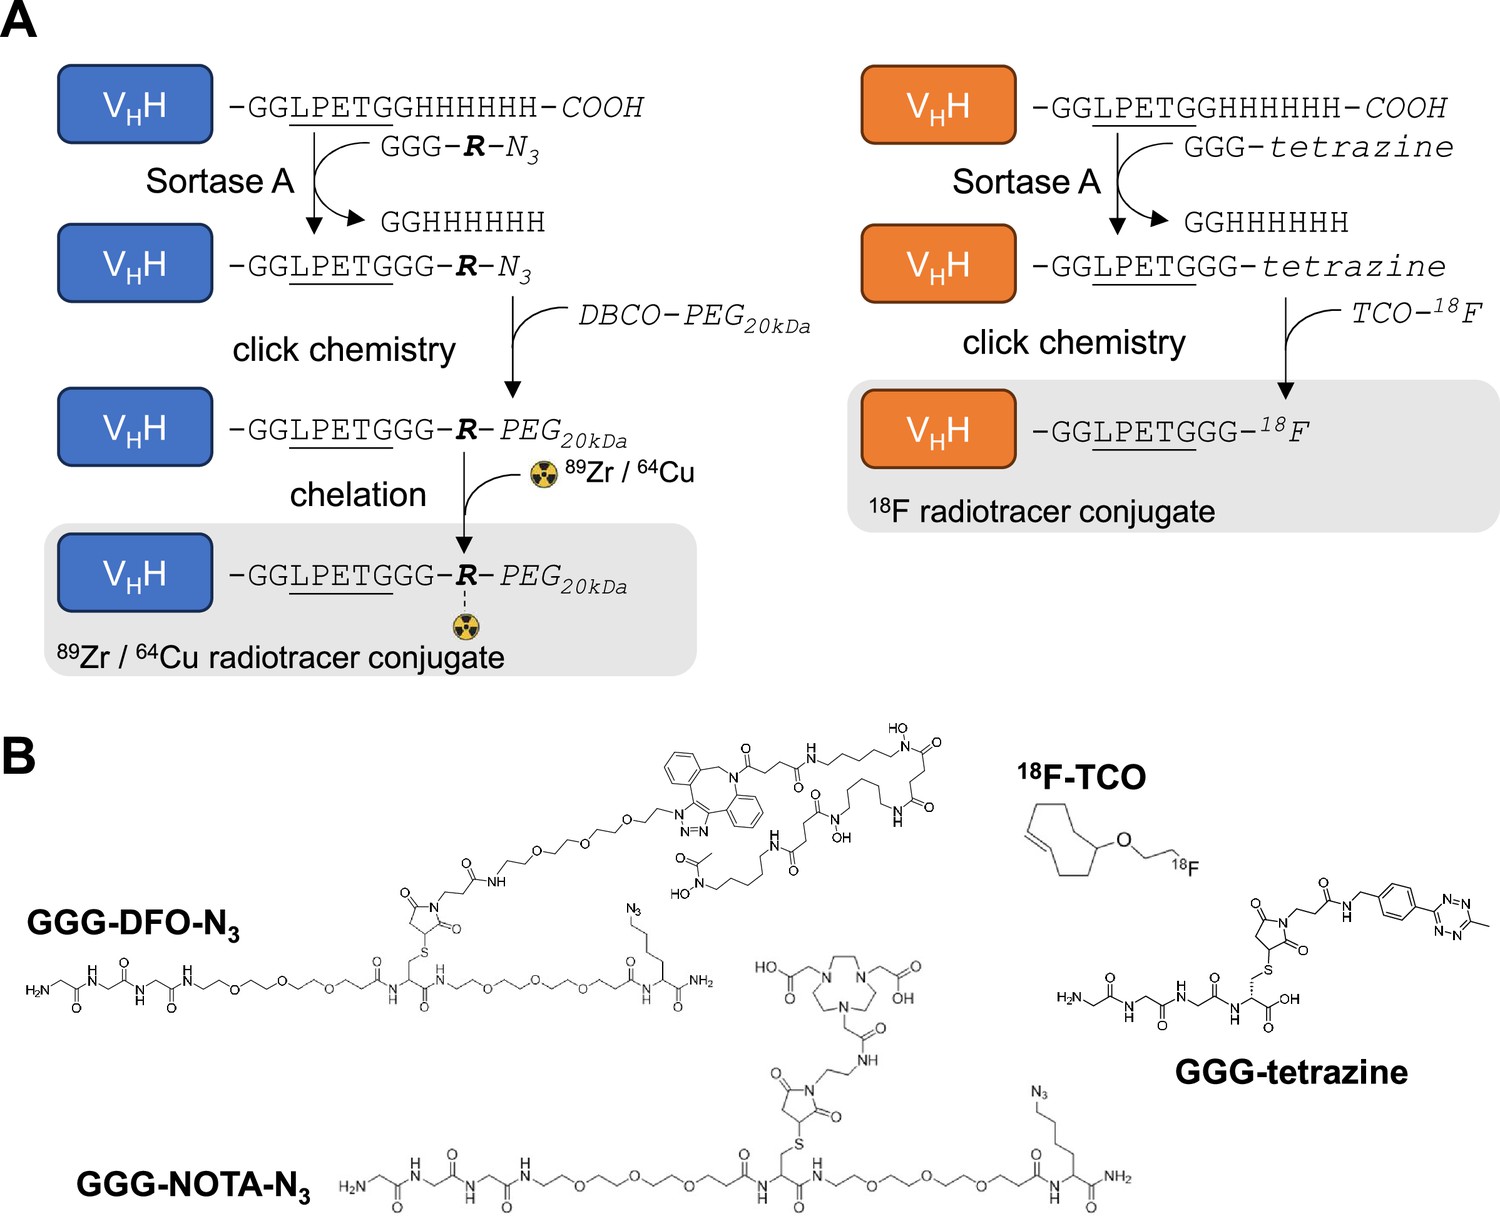
Radiolabeling strategy.
(A) Schematic of sortase A and click-chemistry steps to generate each radio-conjugate used in this study. Capital letters denote amino acids, unless if written in italic where they denote chemical groups or elements. Bold italic ‘R’ represents either DFO (deferoxamine) or NOTA (2,2′,2”-(1,4,7-triazacyclononane-1,4,7-triyl)triacetic acid). DBCO: dibenzocyclooctyne, PEG20kDa: polyethylene-glycol (20kDa mw), TCO: trans-cyclooctene. Underlined is the LPETG Sortase A cleavage site consensus motif. See Figure 2—figure supplement 3 for detailed methods. (B) Structures of GGG-nucleophiles used in sortase A-mediated conjugations (GGG-DFO-N3, GGG-NOTA-N3 , and GGG-tetrazine). The 18F-TCO click-chemistry partner of GGG-tetrazine is also depicted. These structures were synthesized as described methods and Figure 2—figure supplements 5 and 6.
Figure 2—figure supplement 1
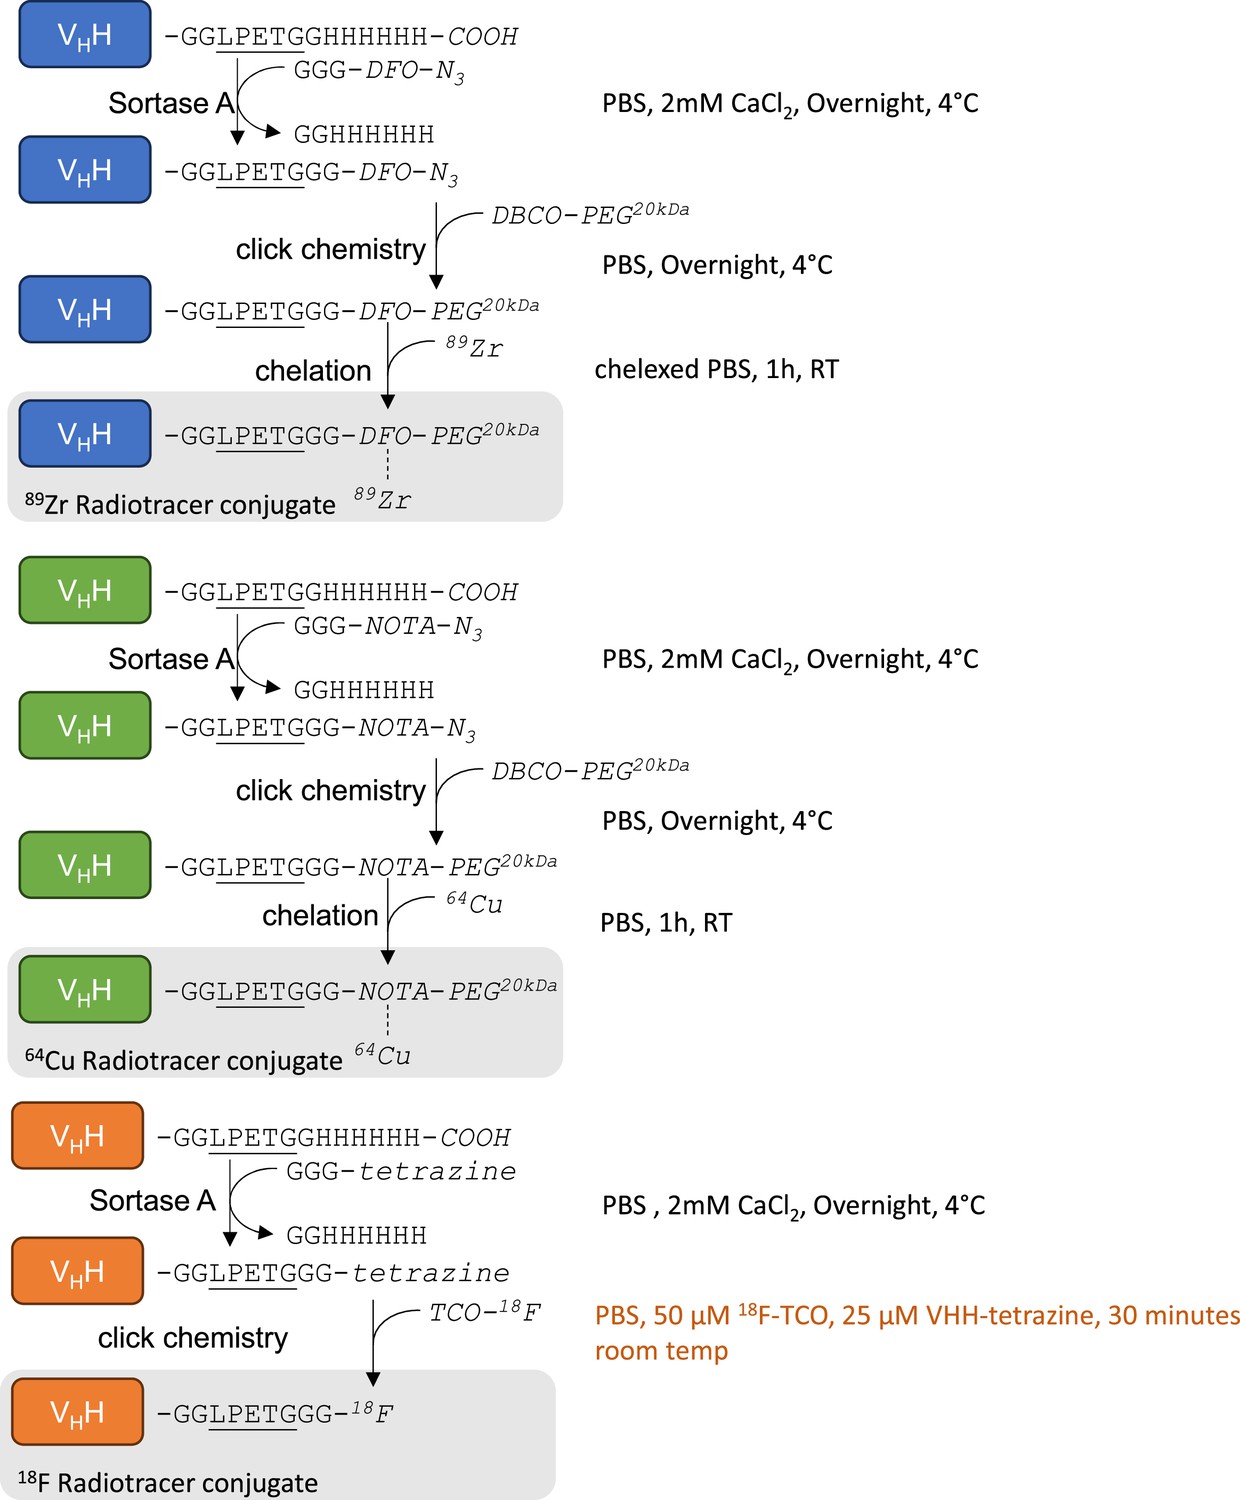
Schematic representation of each step required to generate 89Zr-based (blue), 64Cu-based (green), and 18F-based (orange) VHH conjugates.
Capital letters denote amino acids, unless written in italic where they denote chemical groups or elements. Each reaction condition is noted on the right hand of each reaction. DFO: deferoxamine, NOTA: 2,2′,2”-(1,4,7-triazacyclononane-1,4,7-triyl)triacetic acid, PEG: poly-ethylene-glycol, TCO: trans cyclo-octene, DBCO: dibenzocyclooctyne. See methods for details.
Figure 2—figure supplement 2
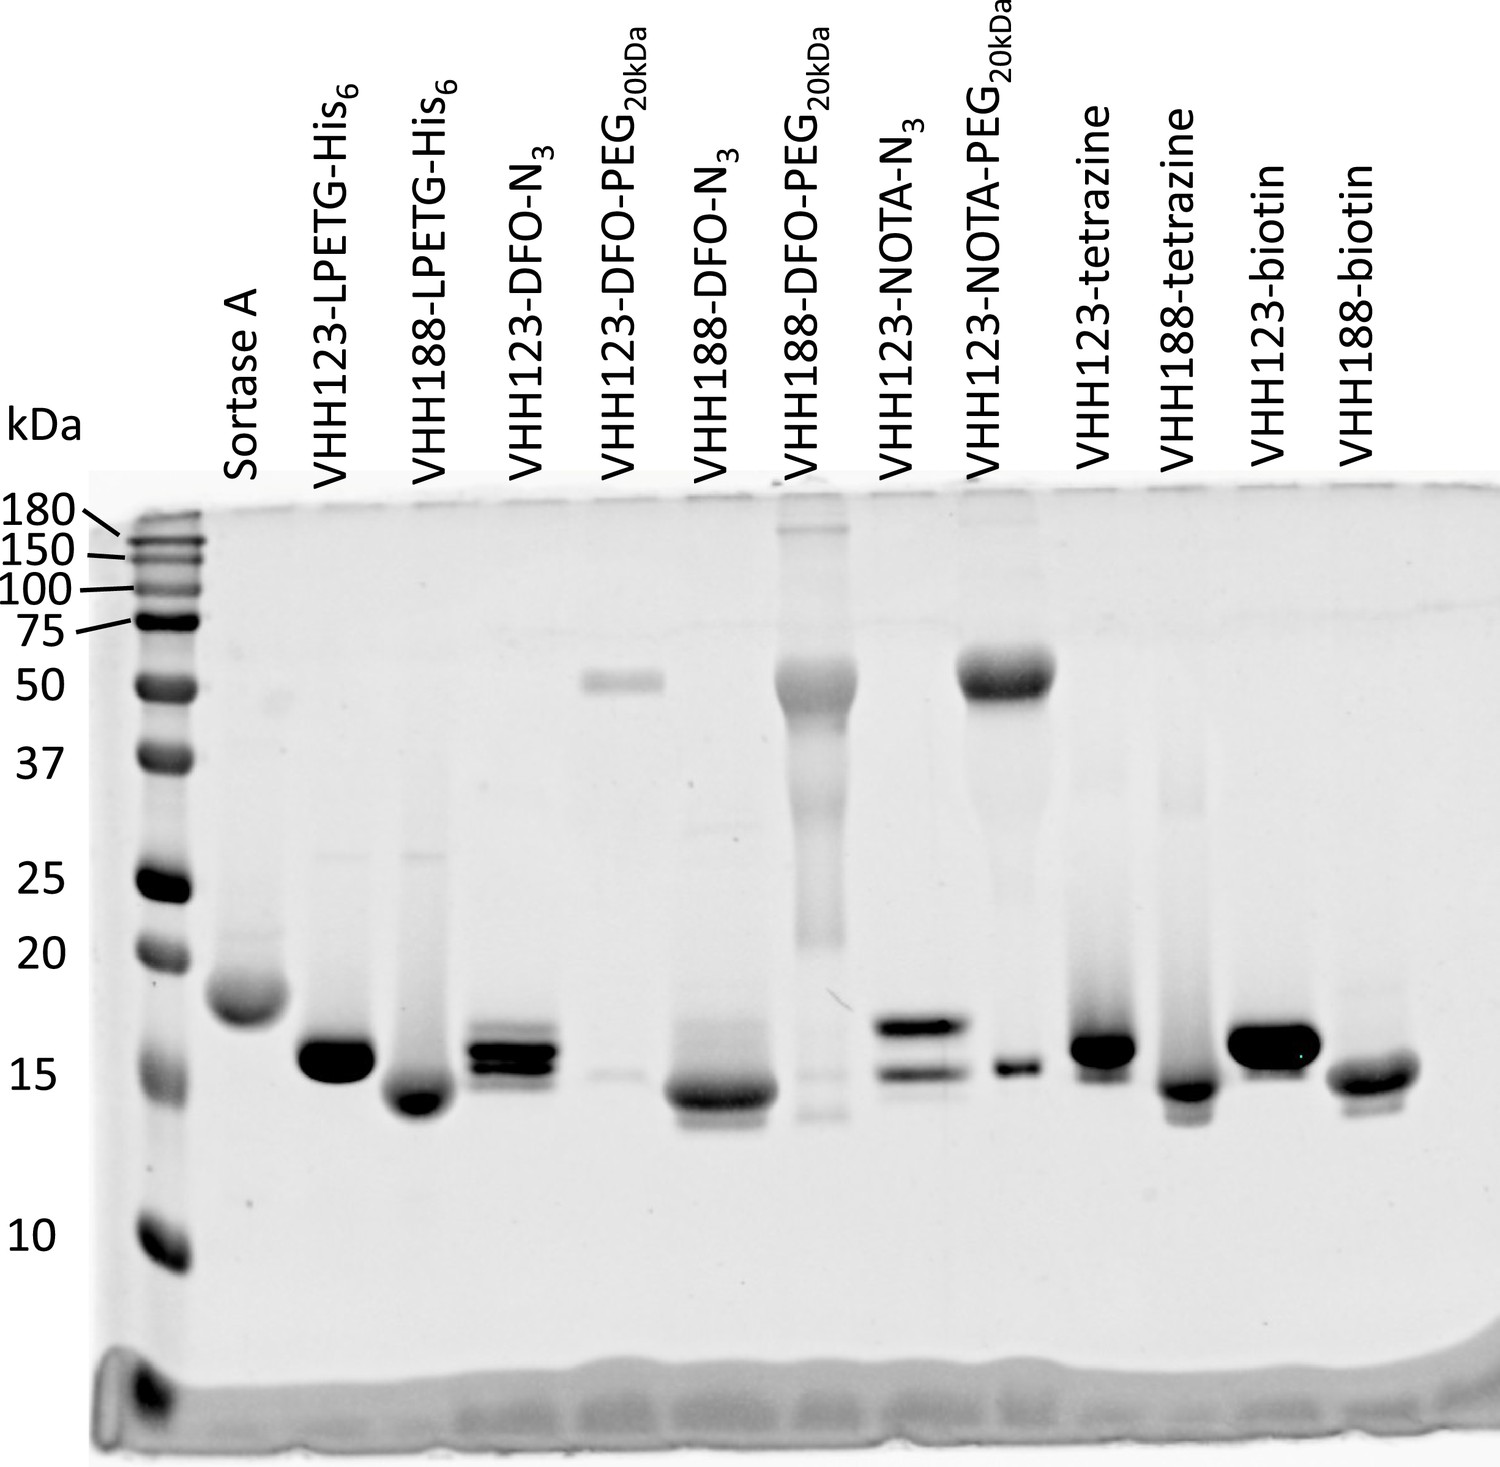
SDS-PAGE followed by Coomassie Blue stain, showing the individual constructs used throughout this work, as purified and concentrated post-sortase A transpeptidation and post DBCO-PEG20kDa click-chemistry conjugation when performed.
Sortase A expected mw: 17.8 kDa. For expected mw of other constructs, see Figure 2—figure supplement 2—source data 3 file.
-
Figure 2—figure supplement 2—source data 1
PDF file containing the original gel of Figure 2—figure supplement 2, indicating the relevant bands and treatments.
- https://cdn.elifesciences.org/articles/104302/elife-104302-fig2-figsupp2-data1-v1.zip
-
Figure 2—figure supplement 2—source data 2
Original file for the gel presented in Figure 2—figure supplement 2.
- https://cdn.elifesciences.org/articles/104302/elife-104302-fig2-figsupp2-data2-v1.zip
-
Figure 2—figure supplement 2—source data 3
LC/MS mass measurement data for compounds shown in Figure 2—figure supplement 2.
- https://cdn.elifesciences.org/articles/104302/elife-104302-fig2-figsupp2-data3-v1.zip
Figure 2—figure supplement 3
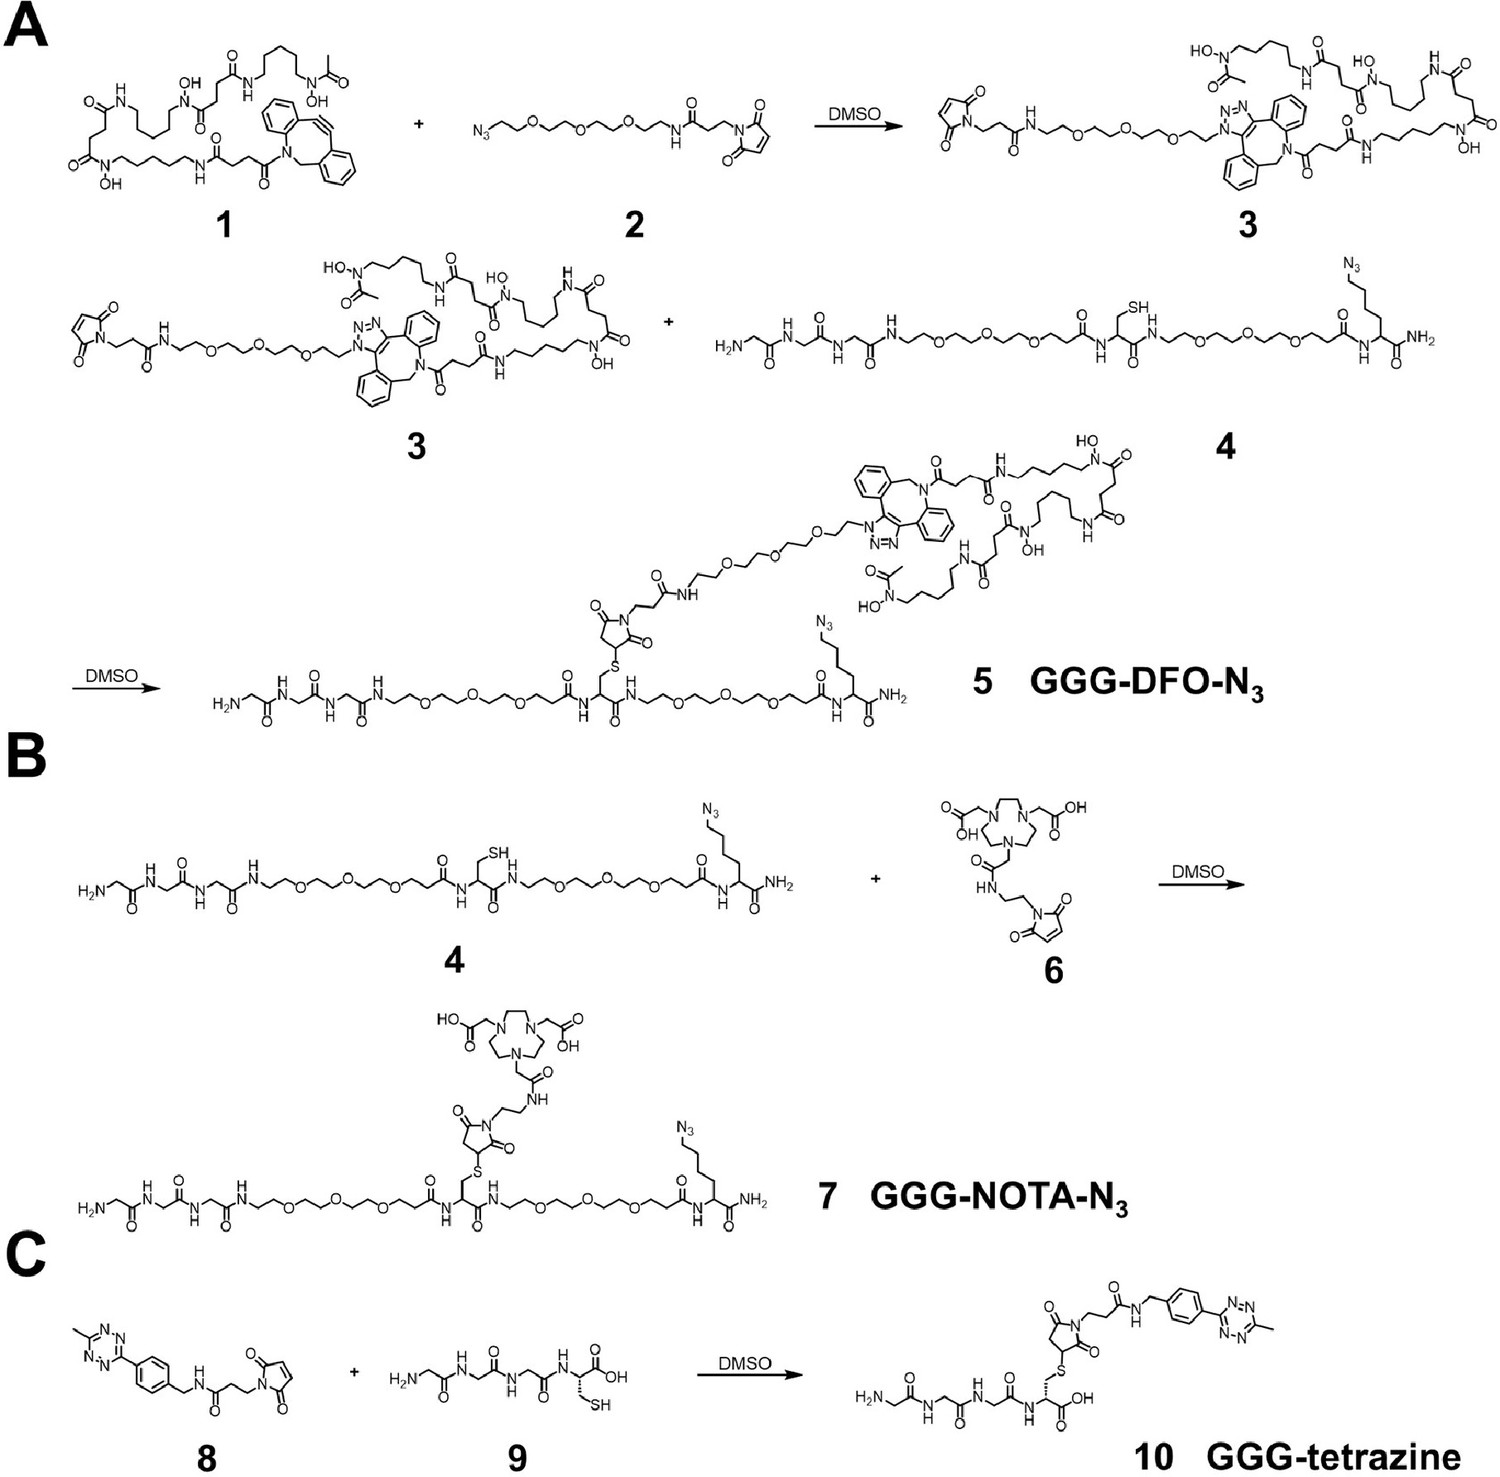
Synthetic schemes of labeling reagents.
(A) Synthesis of a triglycine- and azido-modified deferoxamine (DFO) (GGG-DFO-N3) as a sortase-ready radioisotope zirconium-89 (89Zr) chelator. Polyethylene glycol (PEG) spacers were incorporated to enhance molecular flexibility and water solubility while minimizing potential interactions, such as steric hindrance, among different moieties. (B) Synthesis of a triglycine- and azido-modified NOTA (GGG-NOTA-N3) as a sortase-ready radioisotope Copper-64 (64Cu) chelator. (C) Synthesis of a triglycine-modified tetrazine as a sortase-ready click chemistry handle.
Figure 2—figure supplement 4
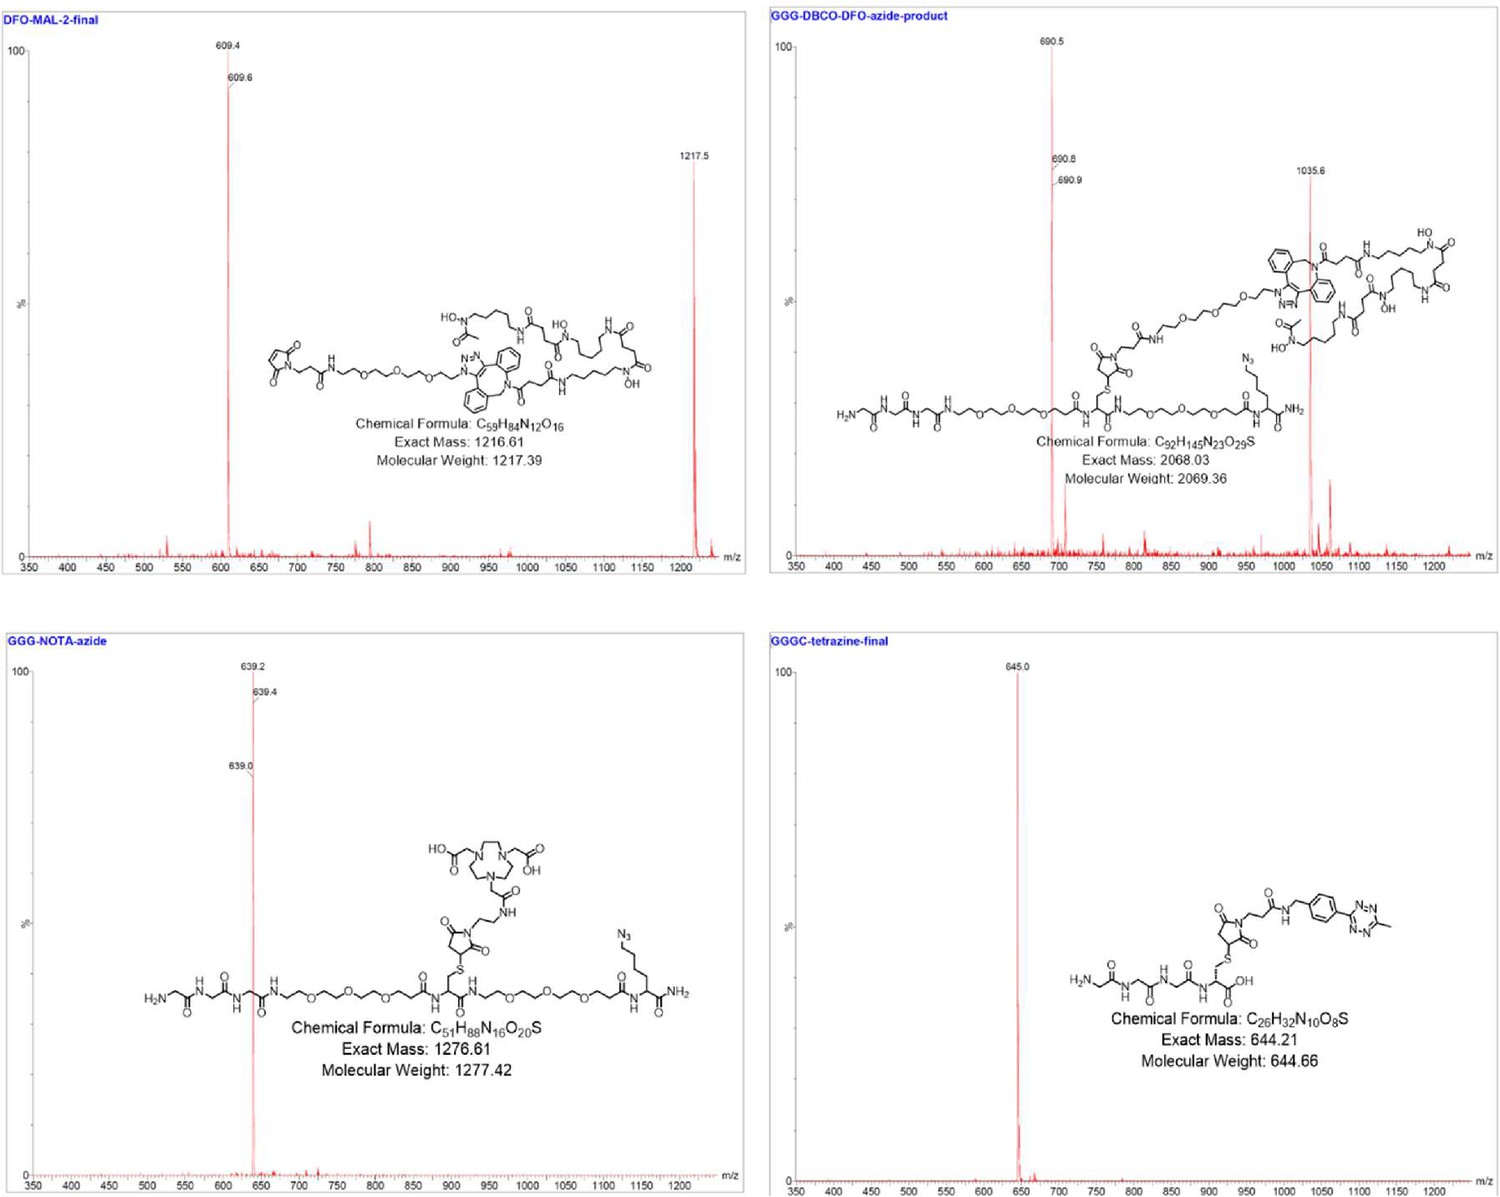
Mass spectra of the labeling reagents shown Figure 2—figure supplement 3.
Figure 2—figure supplement 5
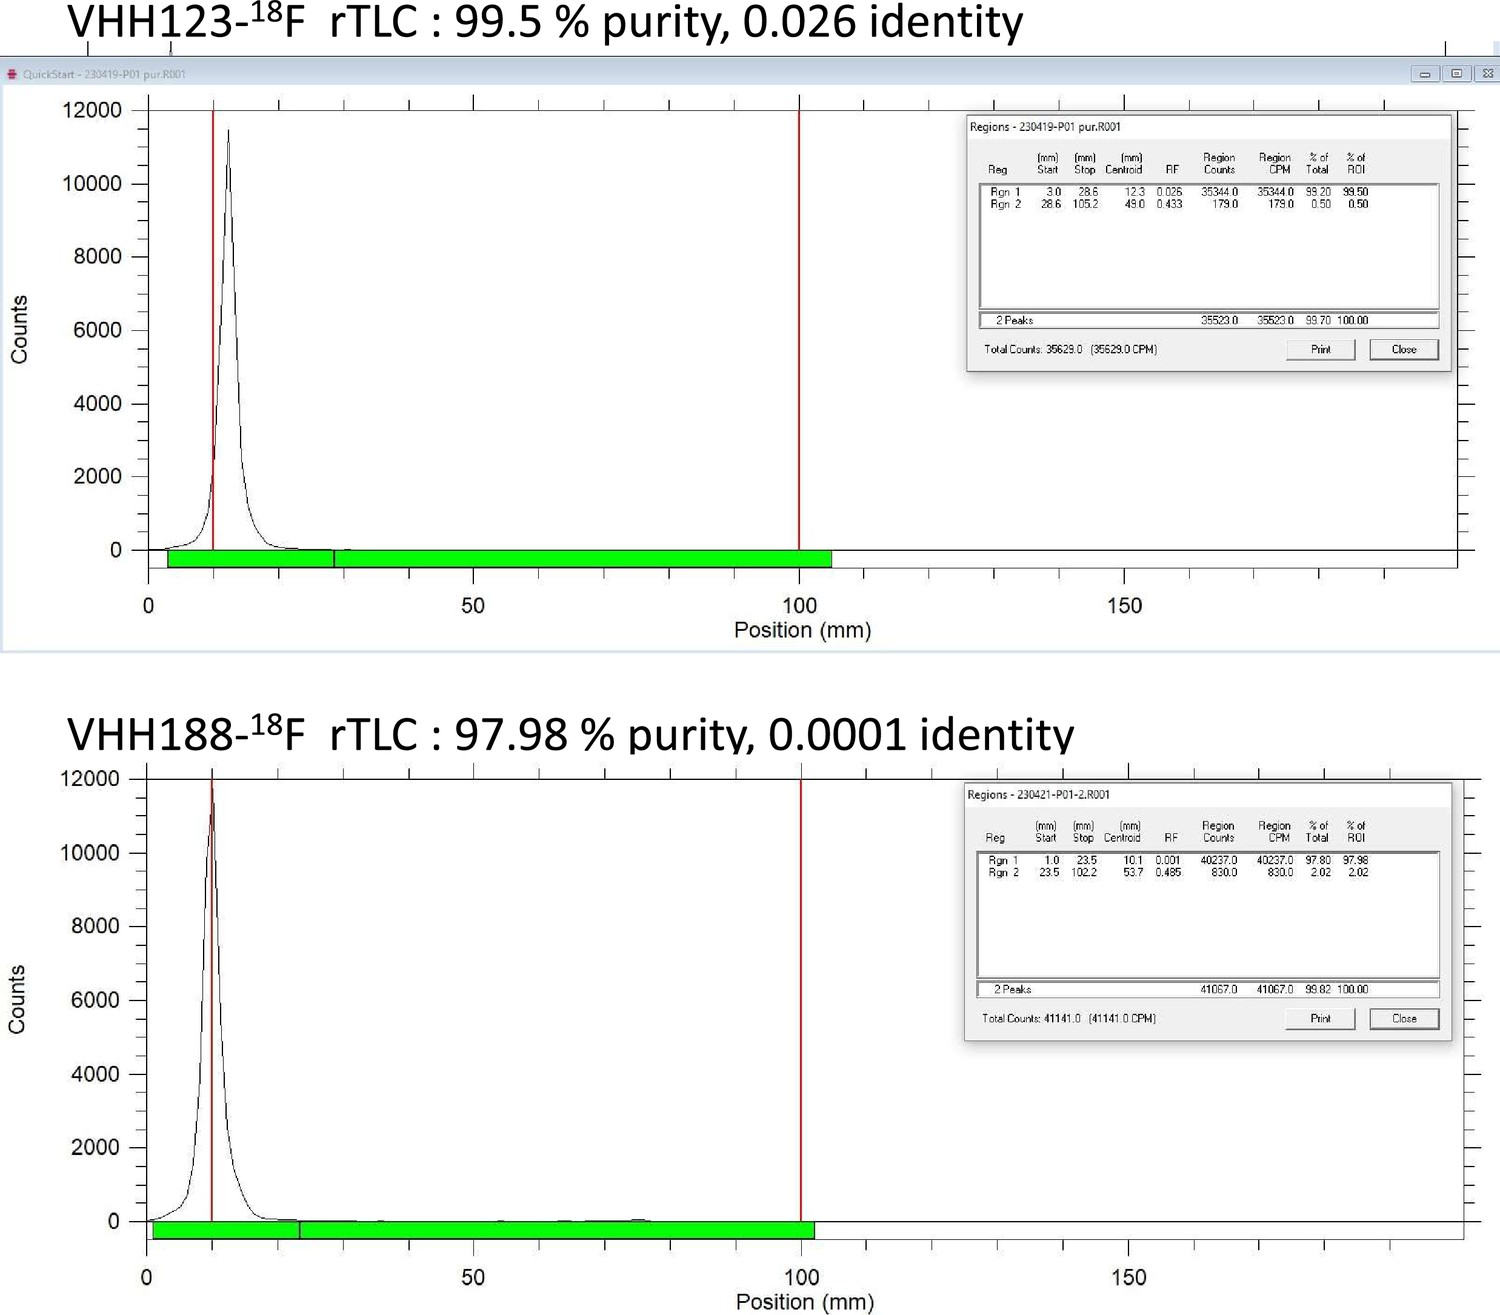
Radio-Thin Layer Chromatography QC data for VHH-18F constructs.
Figure 2—figure supplement 6
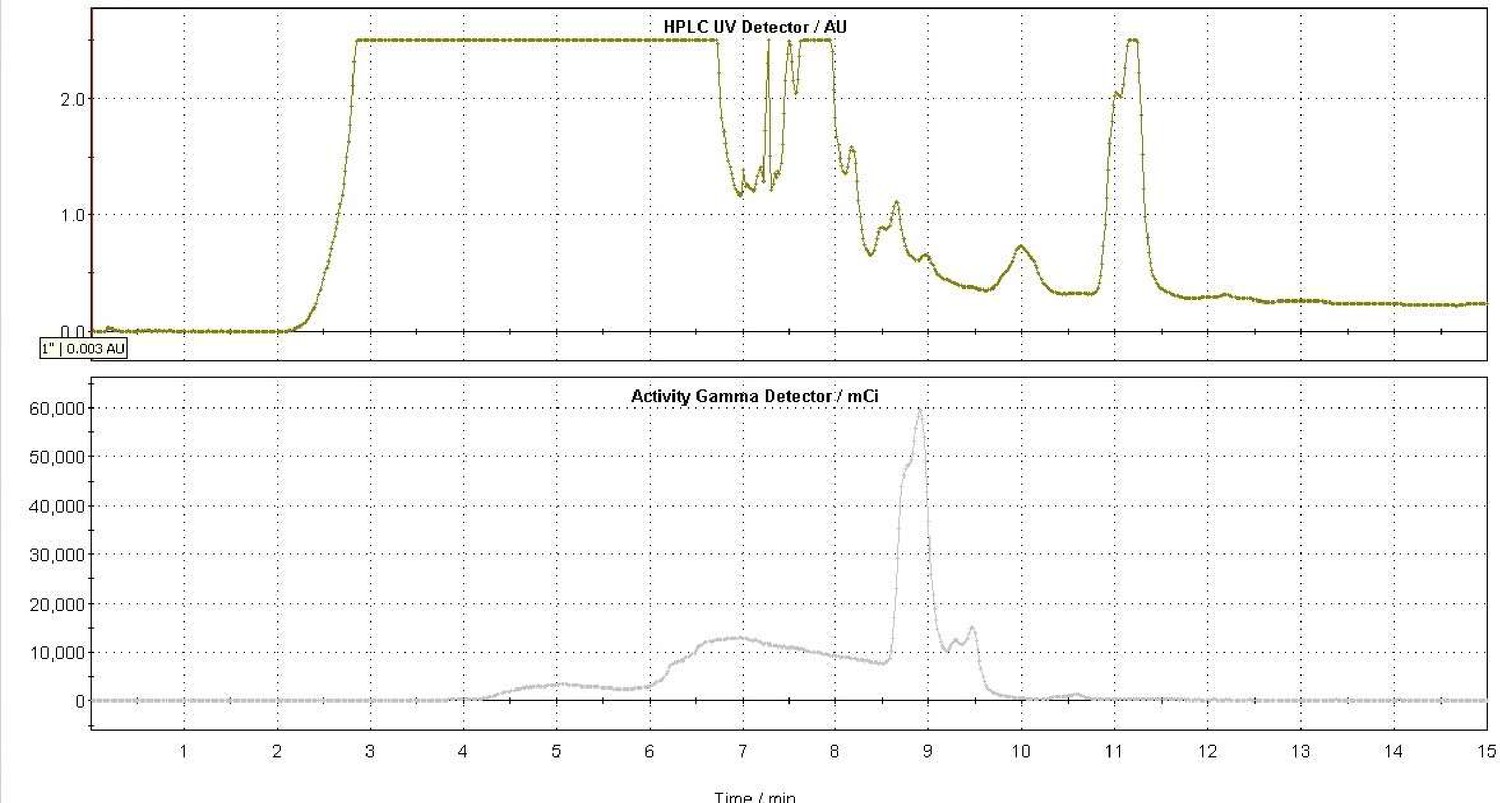
Semi-preparative HPLC gamma chromatogram of 18F-TCO (collected from 8.5 to 9.2 min).
Figure 3 with 2 supplements
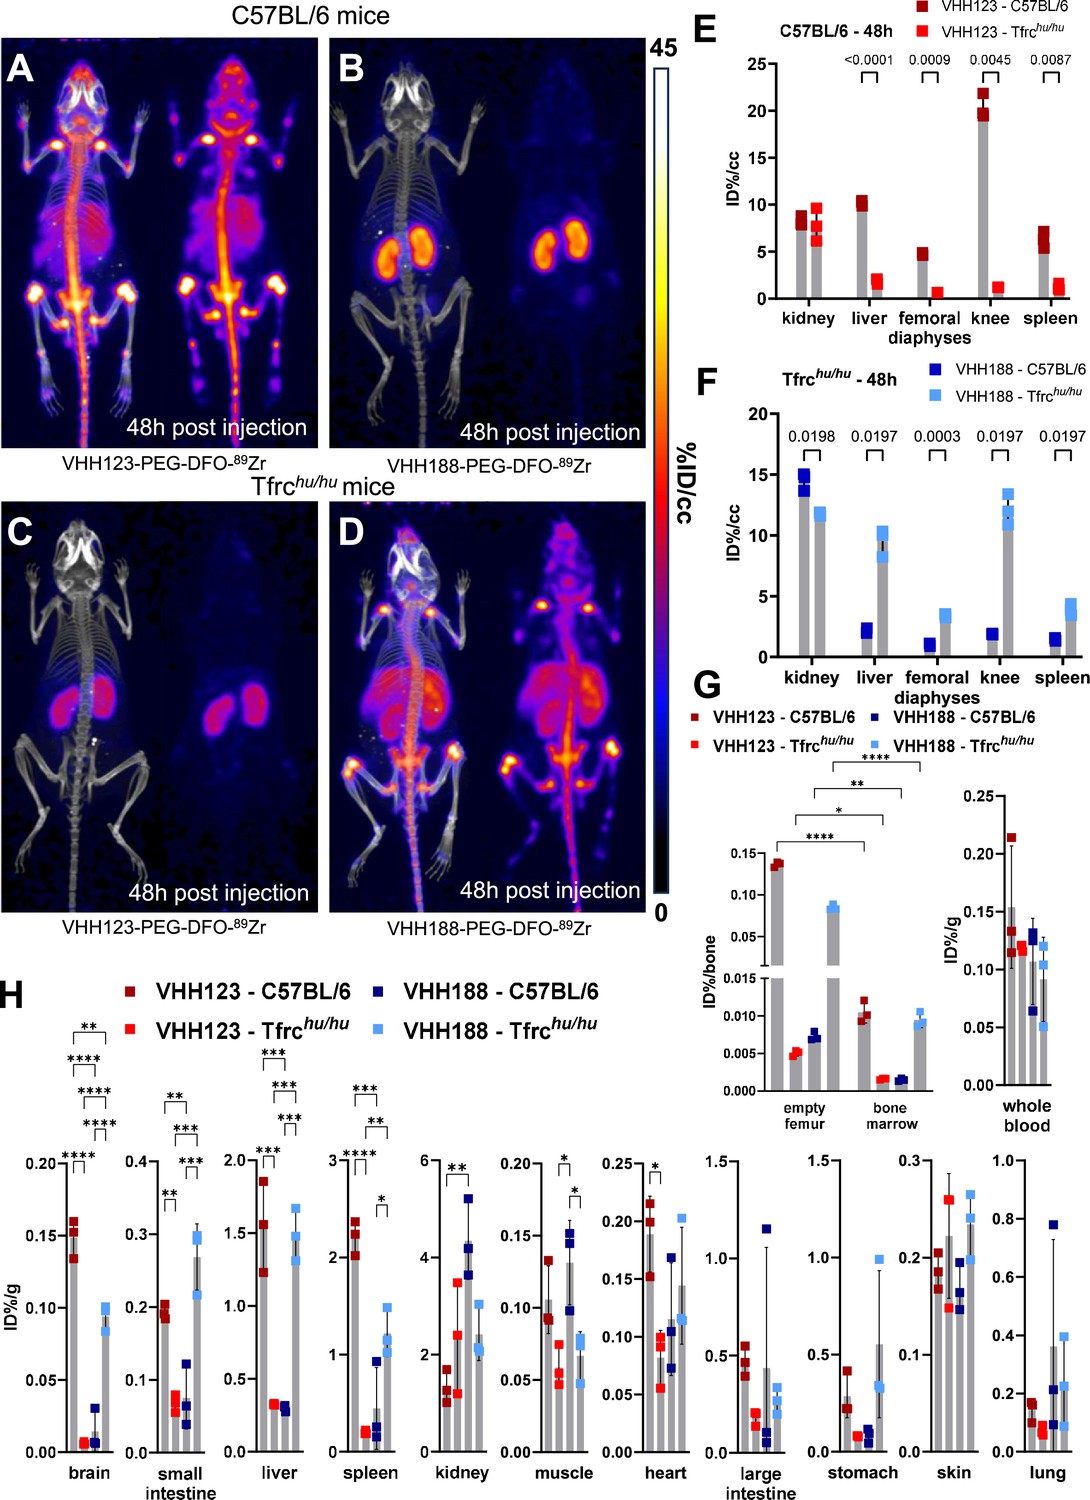
Biodistribution of 89Zr-labelled anti-TfR VHHs.
(A–D) C57BL/6 and Tfrchu/hu mice were injected with 3.7 MBq (100 µCi) of either VHH123-PEG(20 kDa)-DFO-89Zr or VHH188-PEG(20 kDa)-DFO-89Zr by retro-orbital injection. The mice were imaged by PET/CT at several timepoints post-injection. Shown here at the maximum intensity projection images acquired at 48 hr post-injection of the conjugate. Each panel comprises maximum intensity projection (MIP) overlayed with CT signal on the left, and PET MIP alone on the right. PET intensity scale is displayed on the right (%ID/cc). All repeats (=1 mouse) shown are from one experiment out of two replicates. The VHH123 /Tfrchu and VHH188/C57BL6 groups were used as negative controls for VHH binding. N=3 mice per group. (A) C57BL/6 mouse injected with the VHH123-based conjugate. (B) C57BL/6 mouse injected with the VHH188-based conjugate. (C) Tfrchu/hu mouse injected with the VHH123-based conjugate. (D) Tfrchu/hu mouse injected with the VHH188-based conjugate. Experiment performed with 3 mice per condition, with one mouse shown as representative of each condition. (E) Region Of Interest (ROI) analysis of images acquired from mice as shown in A and C and all repeats thereof. The mean ID%/cc is plotted for each ROI and mouse repeat. (F) Same as E, but for images acquired from mice as shown in B and D and all repeats thereof. (G) Left graph: Ex vivo activity measurement of flushed femurs (thus mineral bone) and the bone marrow they contained, 72 hr post radiotracer injection as in A-D. Each dot represents measurement of one mouse on a scale of injected dose percentage per bone (ID%/bone). Right graph: ex vivo activity measurement of 20 µL of whole blood. Each dot represents the activity from one mouse, on a scale of injected dose percentage per gram of tissue (ID%/g). Bars show SD. (H) Ex vivo activity measurements from different tissues, performed at 72 hr post-radiotracer injection. No capillary depletion was performed. Each dot represents one measurement from one mouse on a scale of ID%/g. Bars show SD.
-
Figure 3—source data 1
PET/CT images of all repeats (mice) from the experiment shown in Figure 3.
- https://cdn.elifesciences.org/articles/104302/elife-104302-fig3-data1-v1.zip
Figure 3—figure supplement 1
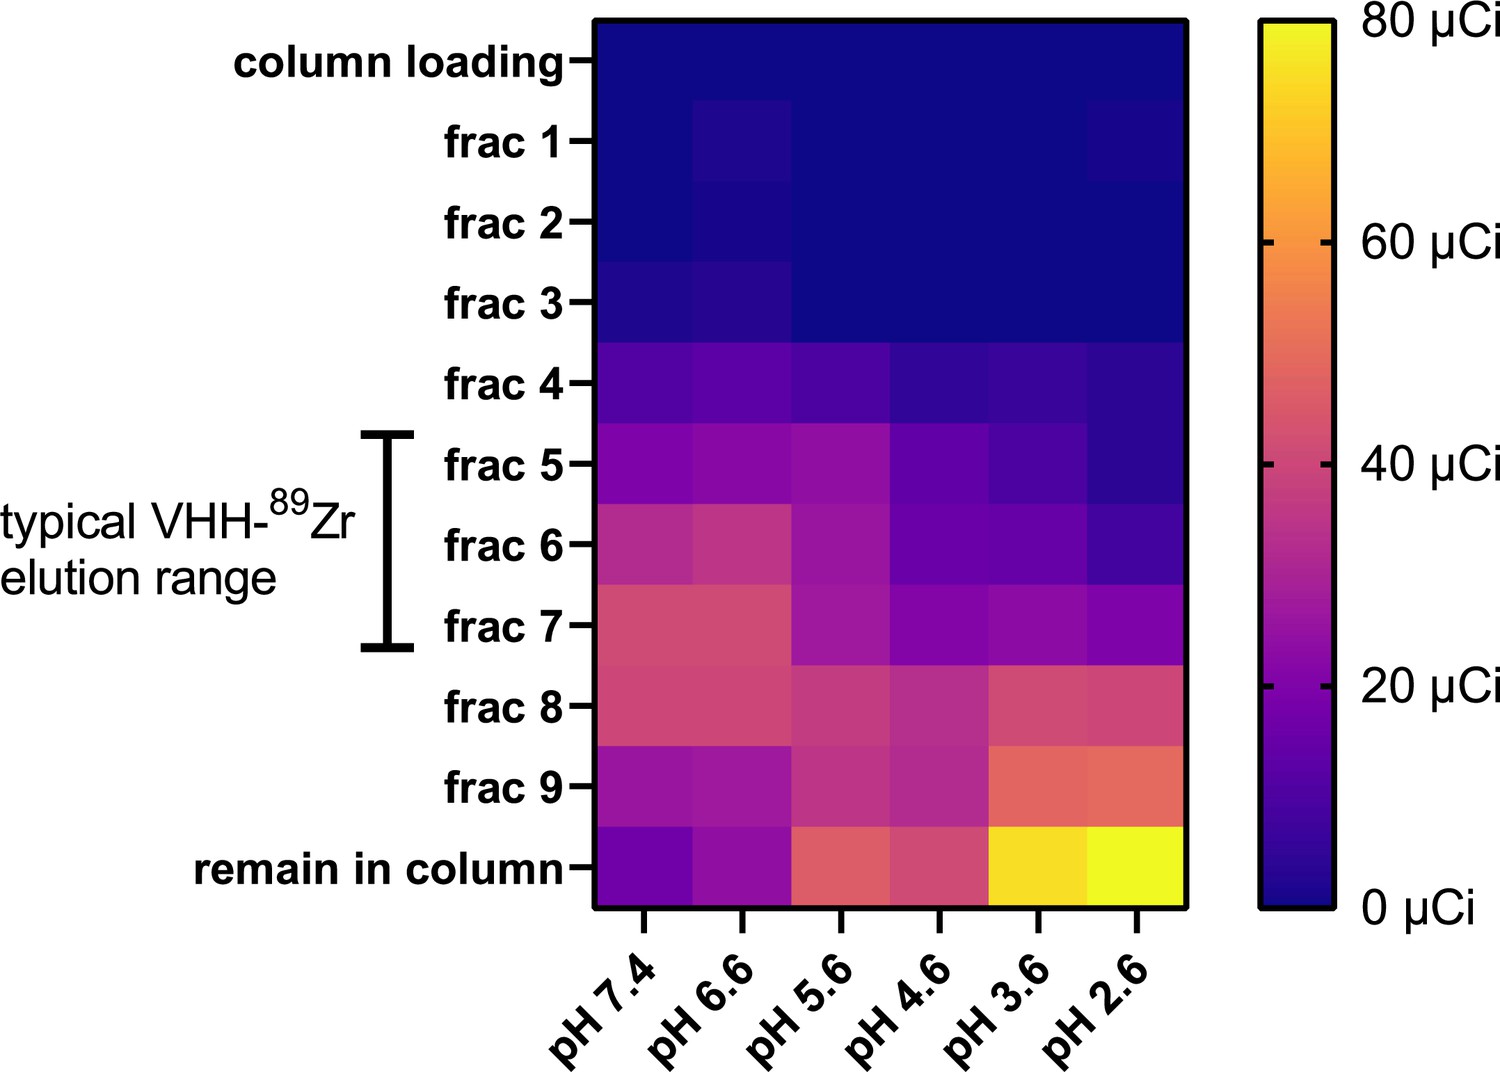
185 MBq (5 mCi) of 89Zr-oxalate stock solution was obtained from the Cyclotron Lab at UW Madison, USA.
Stock solution was put at a neutral pH of 7.5 by successive addition of 90% of stock volume of 2.0 M Na2CO3 and 400% stock volume of HEPES 0.5 M. VHH123-PEG-DFO was conjugated to 89Zr at a neutral pH of 7.4 by adding 44.4 MBq (1.2 mCi) of pH neutralized 89Zr to 120 µg of VHH123-PEG-DFO in chelexed PBS, put in a microcentrifuge tube for 1 hr at room temperature on an agitator. The mixture was then split into six tubes (200 µCi each), and diluted 1/15 (v/v) in citrate-sodium phosphate buffer of varying pH: 7.4, 6.6, 5.6, 4.6, 3.6, and 2.6. The conjugation mixture was then immediately passed onto a PD-10 gravity size exclusion chromatography column (Cytiva) pre-equilibrated with citrate-sodium phosphate buffer of same pH used to dilute the VHH conjugate. Fractions of 600 µL were collected by addition of citrate-sodium phosphate buffer of same pH and each fraction was measured for radioactivity using a dosimeter (AtomLab 500, Biodex). Shown is a heat map of measured radioactivity from each fraction collected. ‘column loading:’ flowthrough from column displaced by application of the reaction mixture to the column. ‘remain in column:’ residual radioactivity measured from the whole column post-elution. Brackets on the left indicate the typical elution fraction range of a VHH-radiometal conjugate post successful conjugation.
Figure 3—figure supplement 2
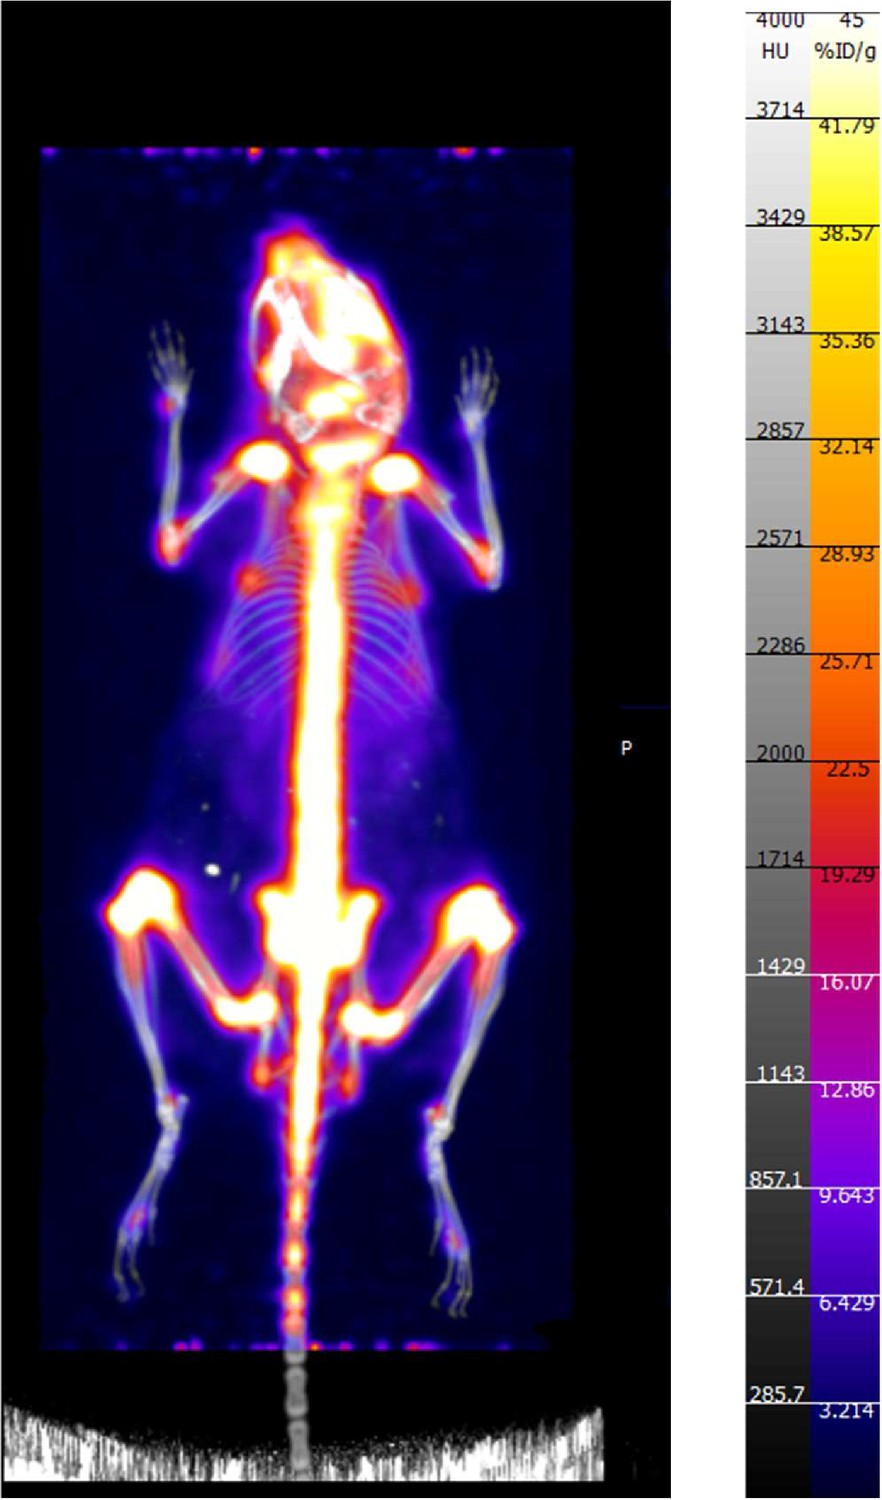
PET/CT of one female C57BL/6 mouse that received 2.775 MBq (75 µCi) of 89Zr as a free element (unchelated/unconjugated) alongside 75×108 gold chiral nano-particles.
This image exclusively shows the signal generated by the accumulation of free 89Zr in a mouse. The co-injection of gold nano-particles was done in relation to another work published by our group, but where this data was not included (Lee et al., 2023).
Figure 4
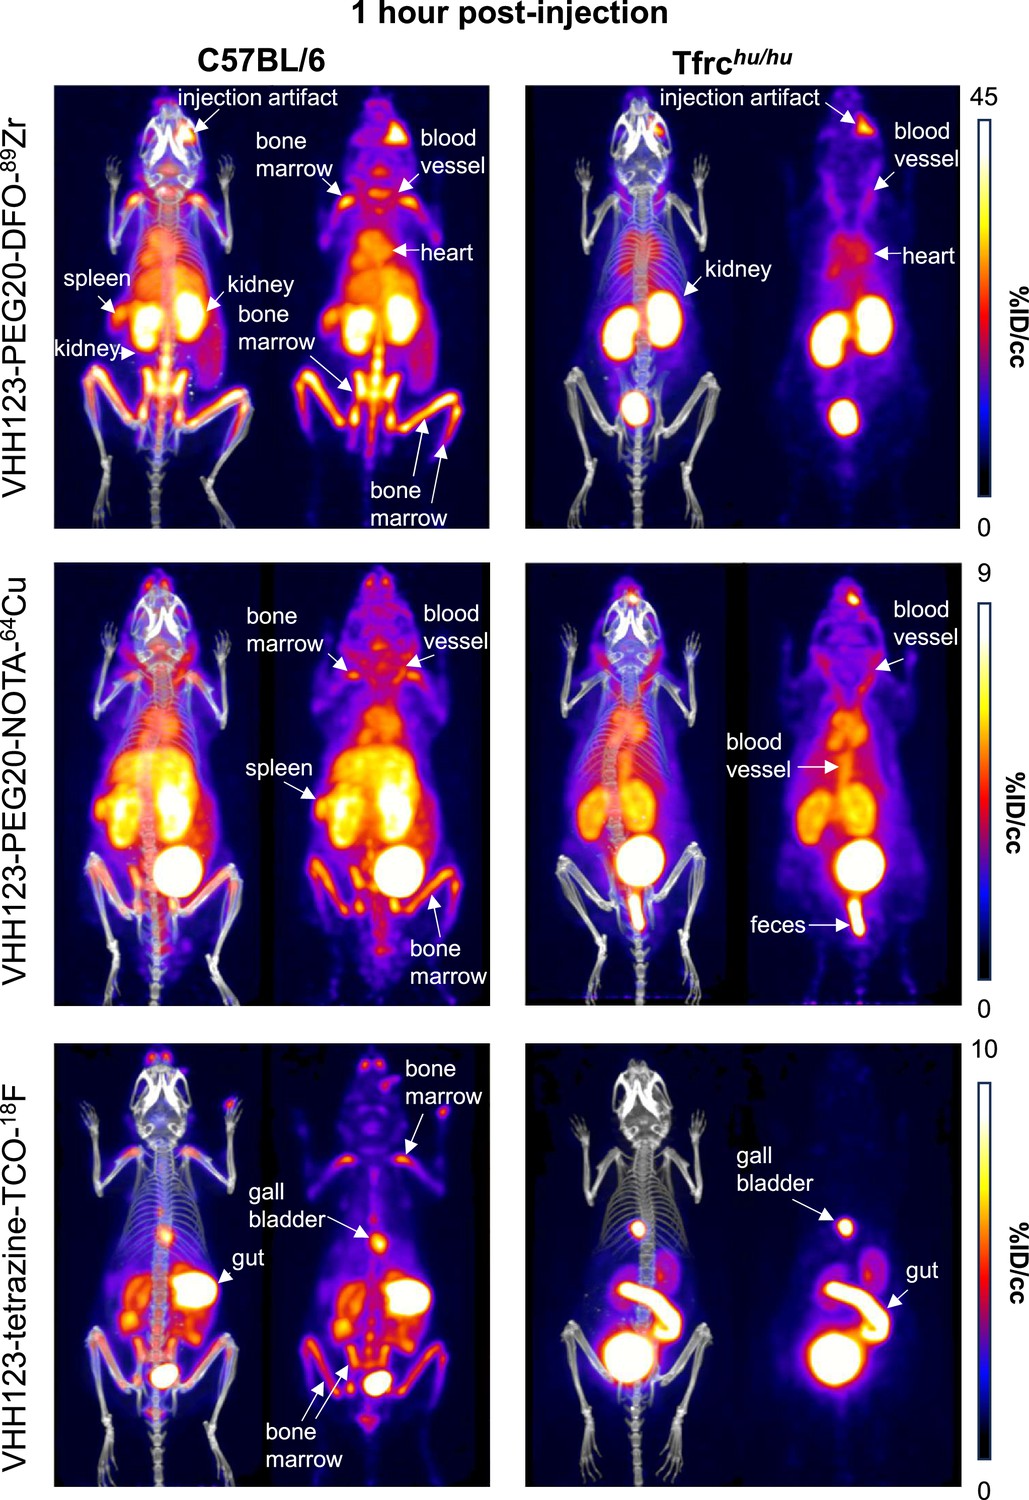
Comparison of the PET signals acquired 1 hour after injection of 89Zr, 64Cu and 18F-labelled VHH123.
C57BL/6 mice (left column) and Tfrchu/hu mice (right column) were injected with 3.7 MBq (100 µCi) of different VHH-123-PEG(20 kDa) based conjugates as indicated on the left side of the panels. PET/CT images were acquired for each condition at 1 hr post-injection. Each panel comprises maximum intensity projection (MIP) overlayed with CT signal on the left, and PET MIP alone on the right. Positron emission tomography (PET) intensity scales are displayed on the right of each row (%ID/cc). This figure pools the representative pictures obtained from three independently performed sets of experiments where one specific VHH123-radiolabeled conjugate was tested per experiment. Three C57BL/6 mice were imaged in each experiment for each condition, and two Tfrchu/hu mice were imaged in each experiment for each condition, save for the 64Cu condition where three Tfrchu/hu mice were imaged. Experiments using the 89Zr and 64Cu radioisotopes have been replicated twice, and the experiment using 18F was performed once. All groups with Tfrchu/hu mice were used as negative controls for VHH123 binding.
-
Figure 4—source data 1
PET/CT images of all repeats (mice) from the experiment shown in Figure 4.
- https://cdn.elifesciences.org/articles/104302/elife-104302-fig4-data1-v1.zip
Figure 5
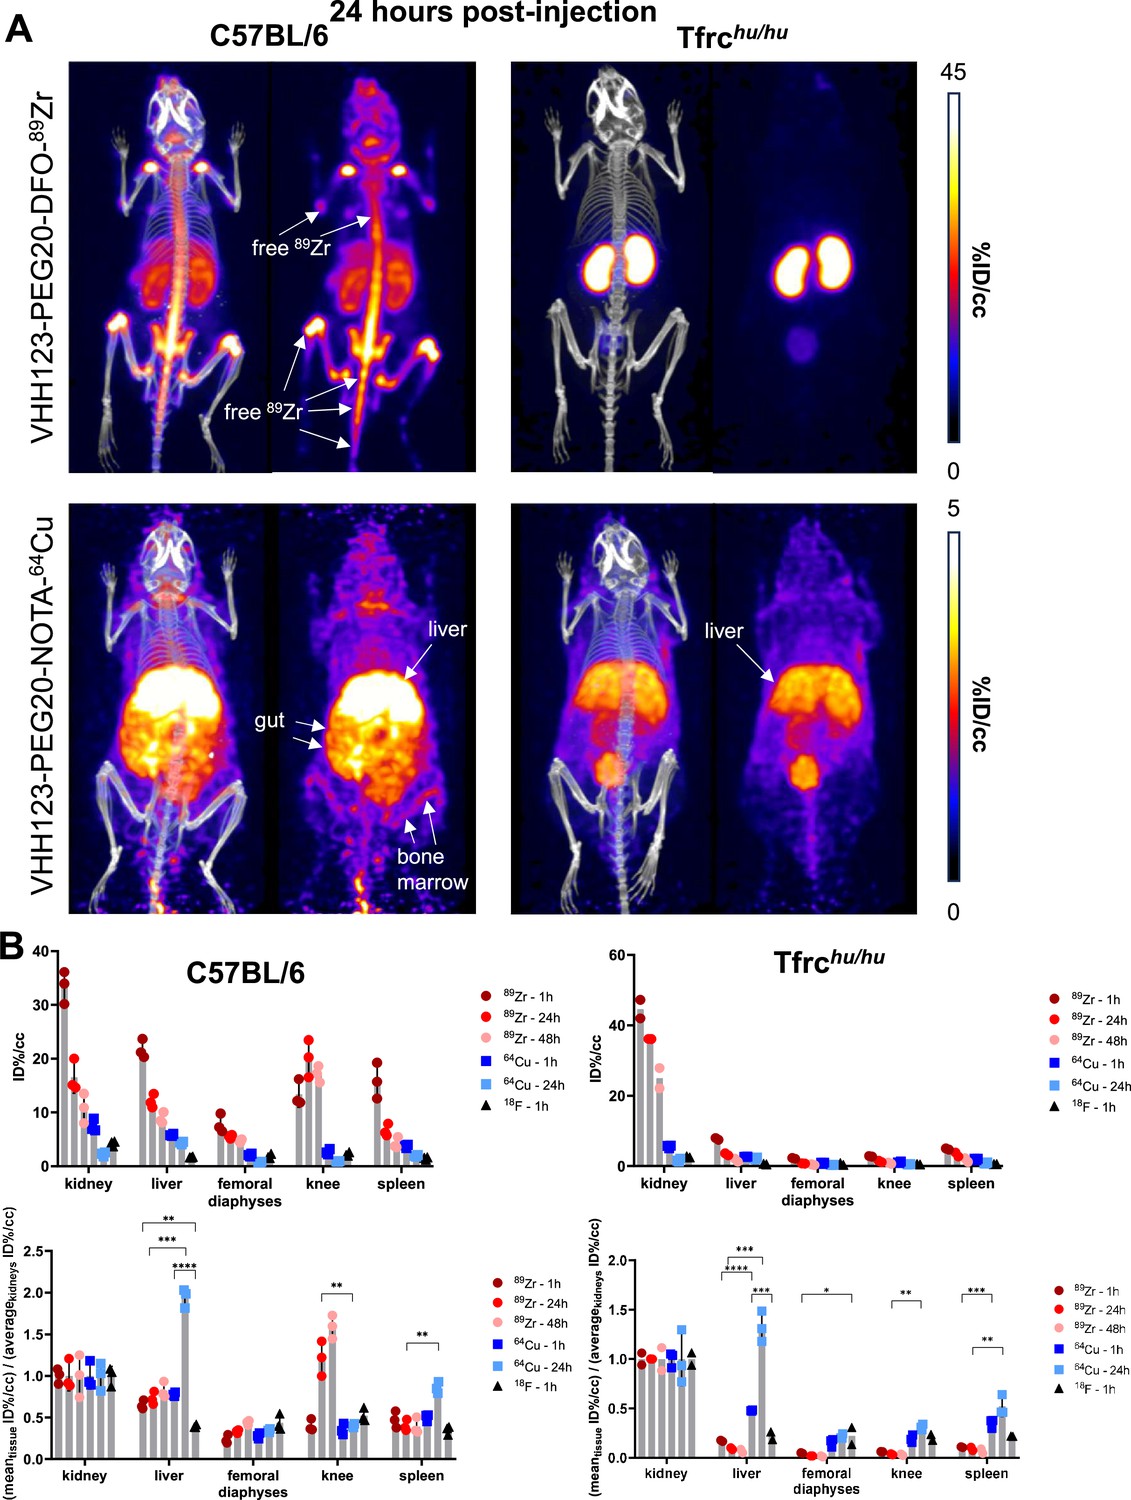
Comparison of the PET signals acquired 24 hours after injection of 89Zr and 64Cu-labelled VHH123.
(A) PET/CT images of the same mice as shown in Figure 4 but acquired at 24 hr post-injection. Each panel comprises maximum intensity projection (MIP) overlayed with CT signal on the left, and PET MIP alone on the right. Positron emission tomography (PET) intensity scales are displayed on the right of each row (%ID/cc). This figure pools the representative pictures obtained from three independently performed sets of experiments where one specific VHH123-radiolabeled conjugate was tested per experiment. Three C57BL/6 mice were imaged in each experiment for each condition, and two Tfrchu/hu mice were imaged in each experiment for each condition, save for the 64Cu condition where three Tfrchu/hu mice were imaged. Experiments using the 89Zr and 64Cu radioisotopes have been replicated twice, and the experiment using 18F was performed once. All groups with Tfrchu/hu mice were used as negative controls for VHH123 binding. (B) Region of interest (ROI) analysis of images acquired from mice as shown in all panels of Figures 4 and 5A, and all repeats thereof, and organized as: left column – C57BL/6, right column – Tfrchu/hu. Top row: each point represents the mean ID%/cc for one mouse. Bottom row: same data as in the graph above, but each point represents the mean ID%/cc of a specific tissue normalized to the average ID%/cc values found in the kidneys of the same group.
-
Figure 5—source data 1
PET/CT images of all repeats (mice) from the experiment shown in Figure 5.
- https://cdn.elifesciences.org/articles/104302/elife-104302-fig5-data1-v1.zip
Figure 6
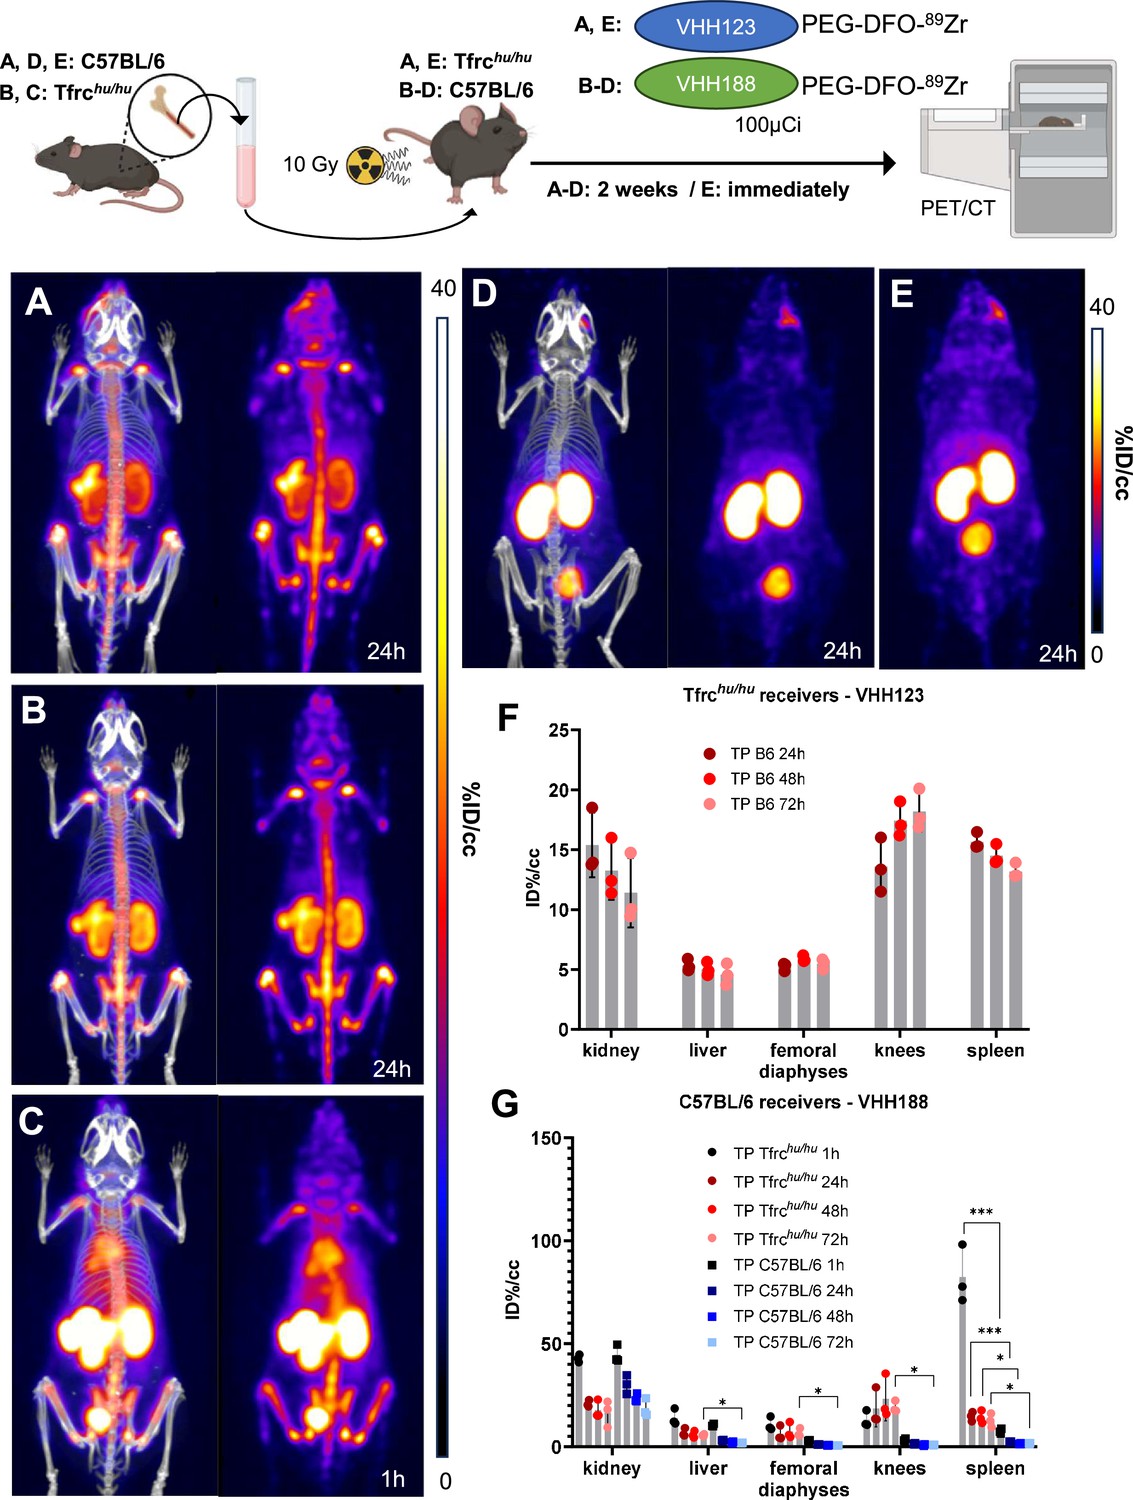
89Zr-labeled anti-TfR VHHs enable PET/CT tracking of transplanted bone marrow cells.
Top: cartoon depicting the experimental procedure: bone marrow was harvested from the femur of C57BL/6 (A, D, and E) or Tfrchu/hu (B and C) mice before transplantation into three lethally irradiated (10 Gy) Tfrchu/hu (A and E) or C57BL/6 (B, C, and D) mice. These mice were then injected with 3.7 MBq (100 µCi) of VHH123-PEG(20 kDa)-DFO-89Zr (A and E) or VHH188-PEG(20 kDa)-DFO-89Zr (B, C, and D) immediately (E) or 2 weeks post-transplantation (A, B, C, and D) and positron emission tomography (PET)/CT images were acquired at several timepoints thereafter. Bottom: PET/CT maximum intensity projections (MIP) that were deemed the most representative of each condition are shown. Each panel comprises maximum intensity projection (MIP) overlayed with CT signal on the left, and PET MIP alone on the right. All repeats (1 repeat = 1 mouse) are from one experiment out of two replicated experiments. Each group has three mice. Groups D and E were control groups (specificity and timepoint, respectively). (A): MIP of one Tfrchu/hu recipient mouse acquired 2 weeks after C57BL/6 bone marrow transplantation and 24 hr after radiotracer injection. (B): MIP of one C57BL/6 mouse acquired 2 weeks after Tfrchu/hu bone marrow transplantation and 24 hr after radiotracer injection. (C) Same as B, but imaged 1 hr after radiotracer injection. (D) MIP of one C57BL/6 mouse acquired 2 weeks after C57BL/6 (isogenic) bone marrow transplantation and 24 hr after radiotracer injection. (E) MIP of one Tfrchu/hu recipient mouse injected with radiotracer immediately after C57BL/6 bone marrow and imaged 24 hr thereafter. Two cohorts were set up separately to perform the PET/CT imaging immediately after bone marrow transplantation or two weeks thereafter. PET intensity scales are displayed on the right of each panel (%ID/cc). (F) ROI analysis of images acquired from mice as shown in panel A, and all repeats and imaging timepoints thereof. Error bars show SD. (G) Region of interest (ROI) analysis of images acquired from mice as shown in panels B, C, and D and all repeats and imaging timepoints thereof. Error bars show SD.
-
Figure 6—source data 1
PET/CT images of all repeats (mice) from the experiment shown in Figure 6.
- https://cdn.elifesciences.org/articles/104302/elife-104302-fig6-data1-v1.zip
Figure 7
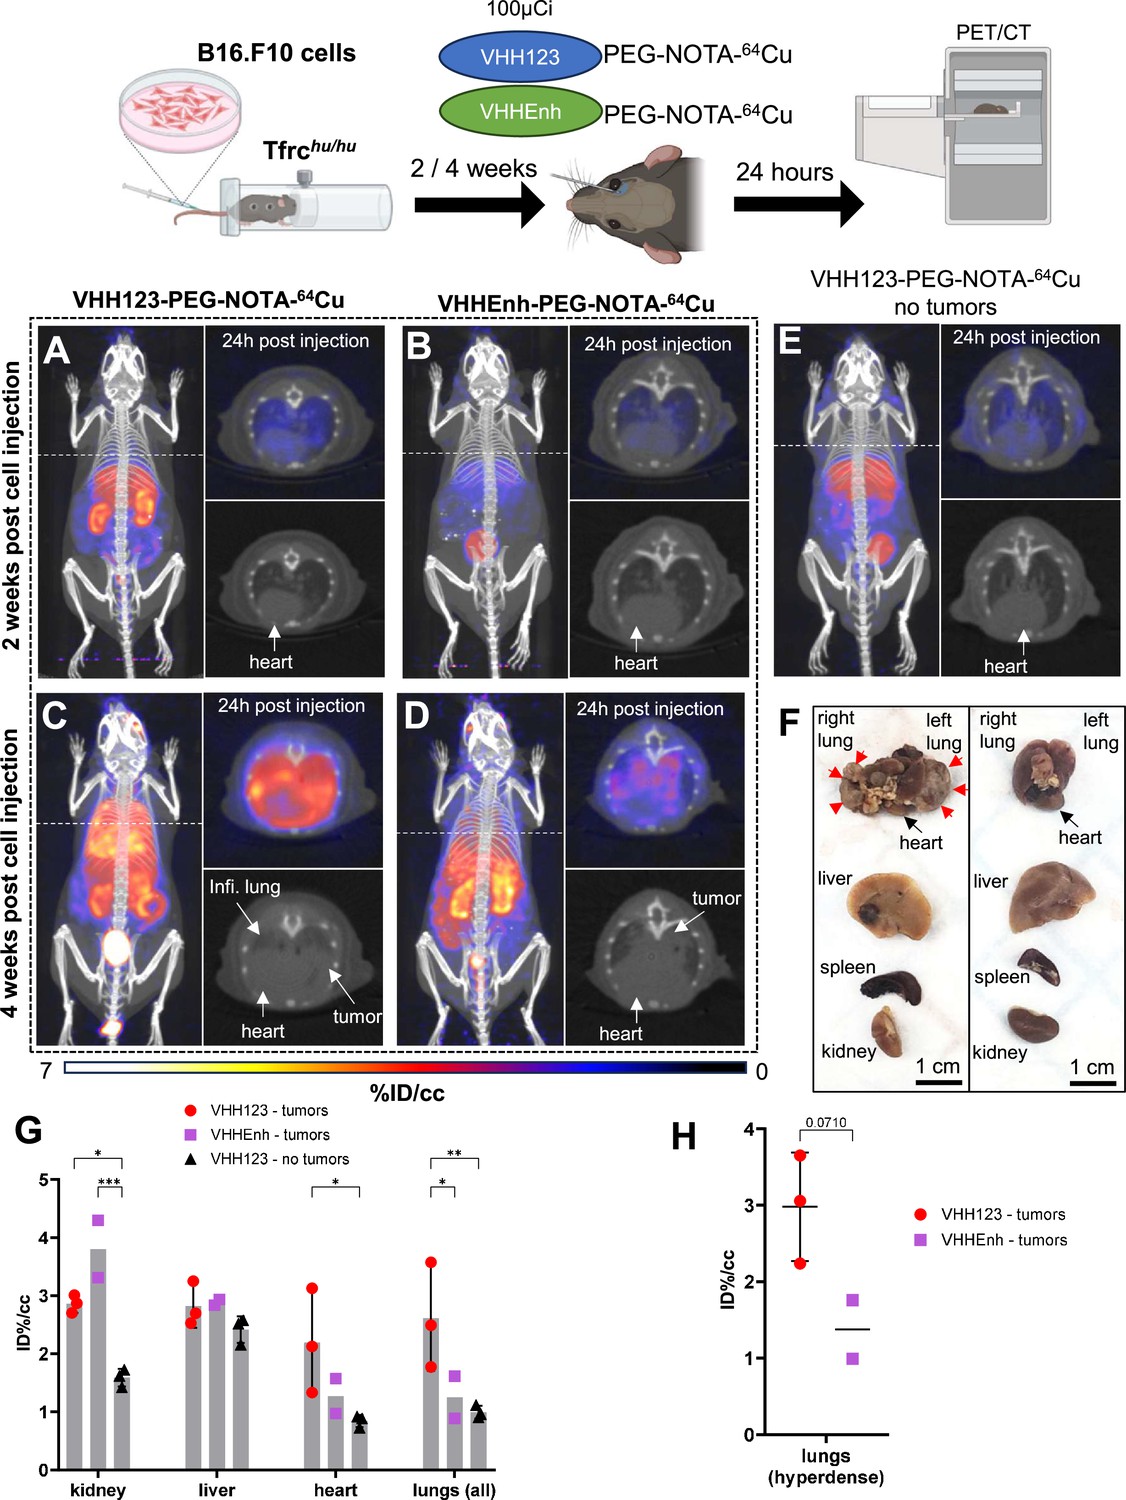
64Cu-labeled VHH123 enables the detection of B16.F10 lung metastases by PET/CT.
Top: cartoon depicting the experimental procedure: 5×10⁴ B16.F10 mouse melanoma cells were transfused to Tfrchu/hu mice by tail-vein injection. 2 and 4 weeks later, the mice were injected with 3.7 MBq (100 µCi) of either VHH123-PEG(20 kDa)-NOTA-64Cu or VHHEnh-PEG(20 kDa)-NOTA-64Cu radiotracers before PET/CT imaging. All repeats (1 repeat = 1 mouse) shown are from one experiment, performed once. (A–E) Maximum Intensity Projections (MIP) and lung traverse sections of one representative mouse out of three for each experimental condition at the 2 weeks timepoint post B16.F10 cell transfusion (except for E: no B16.F10 cells were injected). Images were acquired 24 hr post-radiotracer injection. Positron emission tomography (PET) intensity scale is displayed on the right (%ID/cc). (A) MIP of a Tfrchu/hu mouse imaged with VHH123-PEG-NOTA-64Cu 2 weeks post B16.F10 cell transfusion. (B) MIP of a Tfrchu/hu mouse imaged with VHHEnh-PEG-NOTA-64Cu 2 weeks post B16.F10 cell transfusion (non-specific VHH control). (C) MIP of a Tfrchu/hu mouse imaged with VHH123-PEG-NOTA-64Cu 4 weeks post B16.F10 cell transfusion. (D) MIP of a Tfrchu/hu mouse imaged with VHHEnh-PEG-NOTA-64Cu 4 weeks post B16.F10 cell transfusion (non-specific VHH control). (E) MIP of a Tfrchu/hu mouse imaged with VHH123-PEG-NOTA-64Cu that did not receive any tumor cells (no tumor control). (F) Photographs of dissected organs from Tfrchu/hu mice euthanized at 4 weeks post B16.F10 cell infusion and 96 hr post radio-tracer injection (left) and from control mice that received no cells 96 hr post radio-tracer injection (right). RL: right lung, LL: left lung, H: heart, Li: liver, Sp: spleen, Ki: kidneys. Organs are from the same respective mice as shown in C. Red arrows delimit necrotic and hyperdense tumors growing out of the right and left lung. (G) Region of interest (ROI) analysis of images acquired from mice as shown in panels C, D, and E. Each dot represents the mean ID%/cc of a specific ROI for one mouse. Error bars show SD. No error bars are shown for the VHHEnh – tumor group as n=2 (one mouse died before imaging). (H) ROI analysis of hyperdense lung tissue as visualized by CT on images acquired from mice as in panels C and D. Each point shows the mean ID%/cc of one mouse. Error bars show SD. No error bars are shown for the VHHEnh – tumor group as n=2.
-
Figure 7—source data 1
PET/CT images of all repeats (mice) from the experiment shown in Figure 7.
- https://cdn.elifesciences.org/articles/104302/elife-104302-fig7-data1-v1.zip
Figure 8
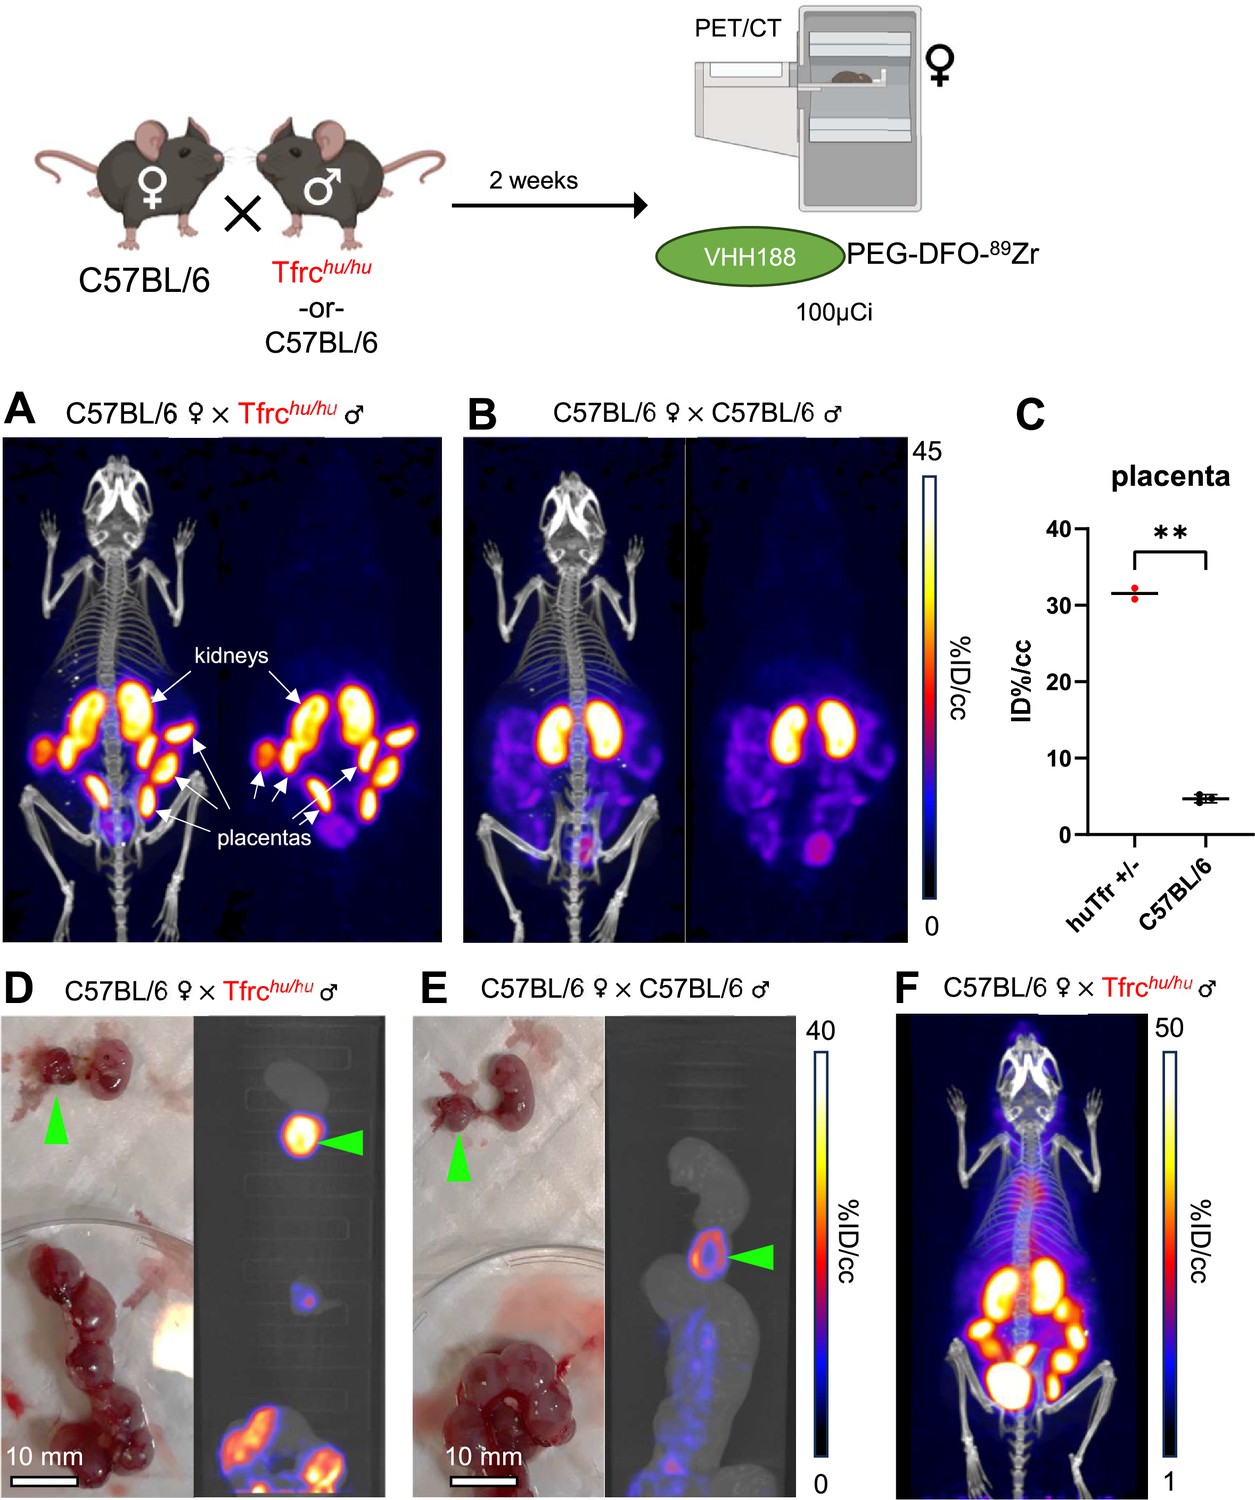
89Zr-labeled VHH188 enables the detection of TfR at the blood-placenta barrier level by PET/CT.
Top: cartoon depicting the experimental procedure: 8–12 week-old C57BL/6 females were mated in pairs with a single 12-week-old Tfrchu/hu or C57BL/6 male. 2 weeks post-fertilization (confirmed by observing vaginal plugs), the females are injected retro-orbitally with 3.7 MBq (100 µCi) of VHH188-PEG(20 kDa)-DFO-89Zr. Experiment performed twice, all repeats included (1 repeat = 1 mouse). (A) PET/CT (left) and PET (right) maximum Intensity Projections (MIP) of one female carrying Tfrchu/wt embryos, imaged 24 hr after injection of the radiotracer. (B) PET/CT (left) and PET (right) MIP of one female carrying C57BL/6 wild-type embryos (control group), imaged 24 hr after injection of the radiotracer. Positron emission tomography (PET) intensity scale for A and B is displayed on the right (%ID/cc).(C) Region of interest (ROI) analysis of images acquired from mice as shown in panels A and B. Each dot represents the mean ID%/cc of the placenta for one mouse. Error bars show SD. No error bars are shown for the Tfrchu/wt condition as n=2 (2 out of 4 females had plugs 2 weeks prior but were not gestating at time of imaging). (D) Left side panel: photograph of dissected embryos from the euthanized female carrying Tfrchu/wt embryos, 72 hr post radiotracer injection. Right side panel: medial PET/CT section of a 50 mL tube containing the dissected embryos as shown on the left panel. The green arrows highlight the placenta of one embryo. (E) Left side panel: photograph of dissected embryos from the euthanized female carrying wild-type C57BL/6 embryos, 72 hr post radiotracer injection. Right side panel: medial PET/CT section of a 50 mL tube containing the dissected embryos as shown on the left panel. The green arrows highlight the placenta of one embryo. PET intensity scale for D and E is displayed on the right (%ID/cc). (F) PET/CT MIP of one female carrying Tfrchu/wt embryos, imaged 1 hr after injection of the radiotracer. PET intensity scale is displayed on the right (%ID/cc). Experiment performed twice. Total of n=2 mice in B6 × Tfrchu/hu group and n=3 in B6 × B6 group.
-
Figure 8—source data 1
PET/CT images of all repeats (mice) from the experiment shown in Figure 8.
- https://cdn.elifesciences.org/articles/104302/elife-104302-fig8-data1-v1.zip
Tables
Table 1
Summary of peptides identified from LC/MS/MS analysis of the gel sections from Figure 1A, middle panel.
Transferrin receptor 1 is highlighted in bold. See Supplementary file 1 for full dataset.
| Species | Unique | Total | Protein | UniProt | Gene | mw (kDa) | Coverage % | Subcell. Loc. | |
|---|---|---|---|---|---|---|---|---|---|
| VHH188/HEK cell lysate | human | 87 | 273 | Transferrin receptor protein 1 | P02786 | TFRC | 84.82 | 68.60% | Membrane |
| 54 | 189 | Nucleolin | P19338 | NCL | 76.57 | 46.80% | Cytoplasm | ||
| 51 | 76 | Nucleolar RNA helicase 2 | Q9NR30 | DDX21 | 87.29 | 56.70% | Nucleus | ||
| 44 | 50 | Epiplakin | P58107 | EPPK1 | 555.32 | 11.90% | Cell junction | ||
| 42 | 57 | ATP-dependent RNA helicase A | Q08211 | DHX9 | 140.87 | 36% | Mitochondrion | ||
| 42 | 50 | ATP-dependent RNA helicase DHX30 | Q7L2E3 | DHX30 | 133.85 | 39.50% | Nucleus | ||
| 36 | 45 | Myosin-9 | P35579 | MYH9 | 226.39 | 21.60% | Cytoplasm | ||
| 31 | 63 | 60 S ribosomal protein L4 | P36578 | RPL4 | 47.67 | 51.50% | Cytoplasm | ||
| VHH123 /B16 .F10 cell lysate | mouse | 237 | 623 | Myosin-9 | Q8VDD5 | Myh9 | 226.23 | 69.20% | Cytoplasm |
| 128 | 244 | CAD protein | B2RQC6 | Cad | 243.08 | 59.60% | Nucleus | ||
| 79 | 111 | Unconventional myosin-Va | Q99104 | Myo5a | 215.4 | 44.60% | n/a | ||
| 73 | 96 | Dedicator of cytokinesis protein 7 | Q8R1A4 | Dock7 | 241.29 | 39.70% | Unknown | ||
| 60 | 68 | Plectin | Q9QXS1 | Plec | 533.86 | 18.10% | Cell junction | ||
| 55 | 257 | Actin, cytoplasmic 1 | P60710 | Actb | 41.71 | 66.90% | Cytoplasm | ||
| 55 | 156 | Transferrin receptor protein 1 | Q62351 | Tfrc | 85.68 | 59.80% | Membrane | ||
| 50 | 58 | Dystonin | Q91ZU6 | Dst | 833.7 | 9.60% | Cytoplasm |
Key resources table
| Reagent type (species) or resource | Designation | Source or reference | Identifiers | Additional information |
|---|---|---|---|---|
| Strain, strain background (Mus musculus) | C57BL/6 J | The Jackson Laboratory | 000664; RRID:MGI:2159769 | |
| Strain, strain background (Mus musculus) | C57BL/6-Tfrctm1(TFRC)Bdes/J | The Jackson Laboratory; Wouters et al., 2022 | 038212; hAPI KI; Tfrchu/hu ; RRID:IMSR_JAX:038212 | Strain donated to Jackson Labs by Dr. M. Dewilde and colleagues |
| Peptide, recombinant protein | Anti-mouse transferrin receptor nanobody | Wouters et al., 2020 | VHH123; Nb63 | |
| Peptide, recombinant protein | Anti-human transferrin receptor nanobody | Wouters et al., 2022 | VHH188; Nb188 | |
| Cell line (Mus musculus) | B16-F10 | ATCC | B16-F10; CRL-6475; RRID:CVCL_0159 |
Additional files
-
Supplementary file 1
Contains every peptide identified by LC/MS as in Table 1.
- https://cdn.elifesciences.org/articles/104302/elife-104302-supp1-v1.xlsx
-
MDAR checklist
- https://cdn.elifesciences.org/articles/104302/elife-104302-mdarchecklist1-v1.docx
Download links
A two-part list of links to download the article, or parts of the article, in various formats.
Downloads (link to download the article as PDF)
Open citations (links to open the citations from this article in various online reference manager services)
Cite this article (links to download the citations from this article in formats compatible with various reference manager tools)
A pair of congenic mice for imaging of transplants by positron emission tomography using anti-transferrin receptor nanobodies
eLife 14:RP104302.
https://doi.org/10.7554/eLife.104302.3


