HERV activation segregates ME/CFS from fibromyalgia while defining a novel nosologic entity
- Escuela de Doctorado, Catholic University of Valencia, Spain
- National Health Service, Manises Hospital, Spain
- Institute for Neuro-Immune Medicine, Dr. Kiran C. Patel College of Osteopathic Medicine, Nova Southeastern University, United States
- Department of Pathology, School of Health Sciences, Catholic University of Valencia, Spain
Figures
Figure 1 with 1 supplement
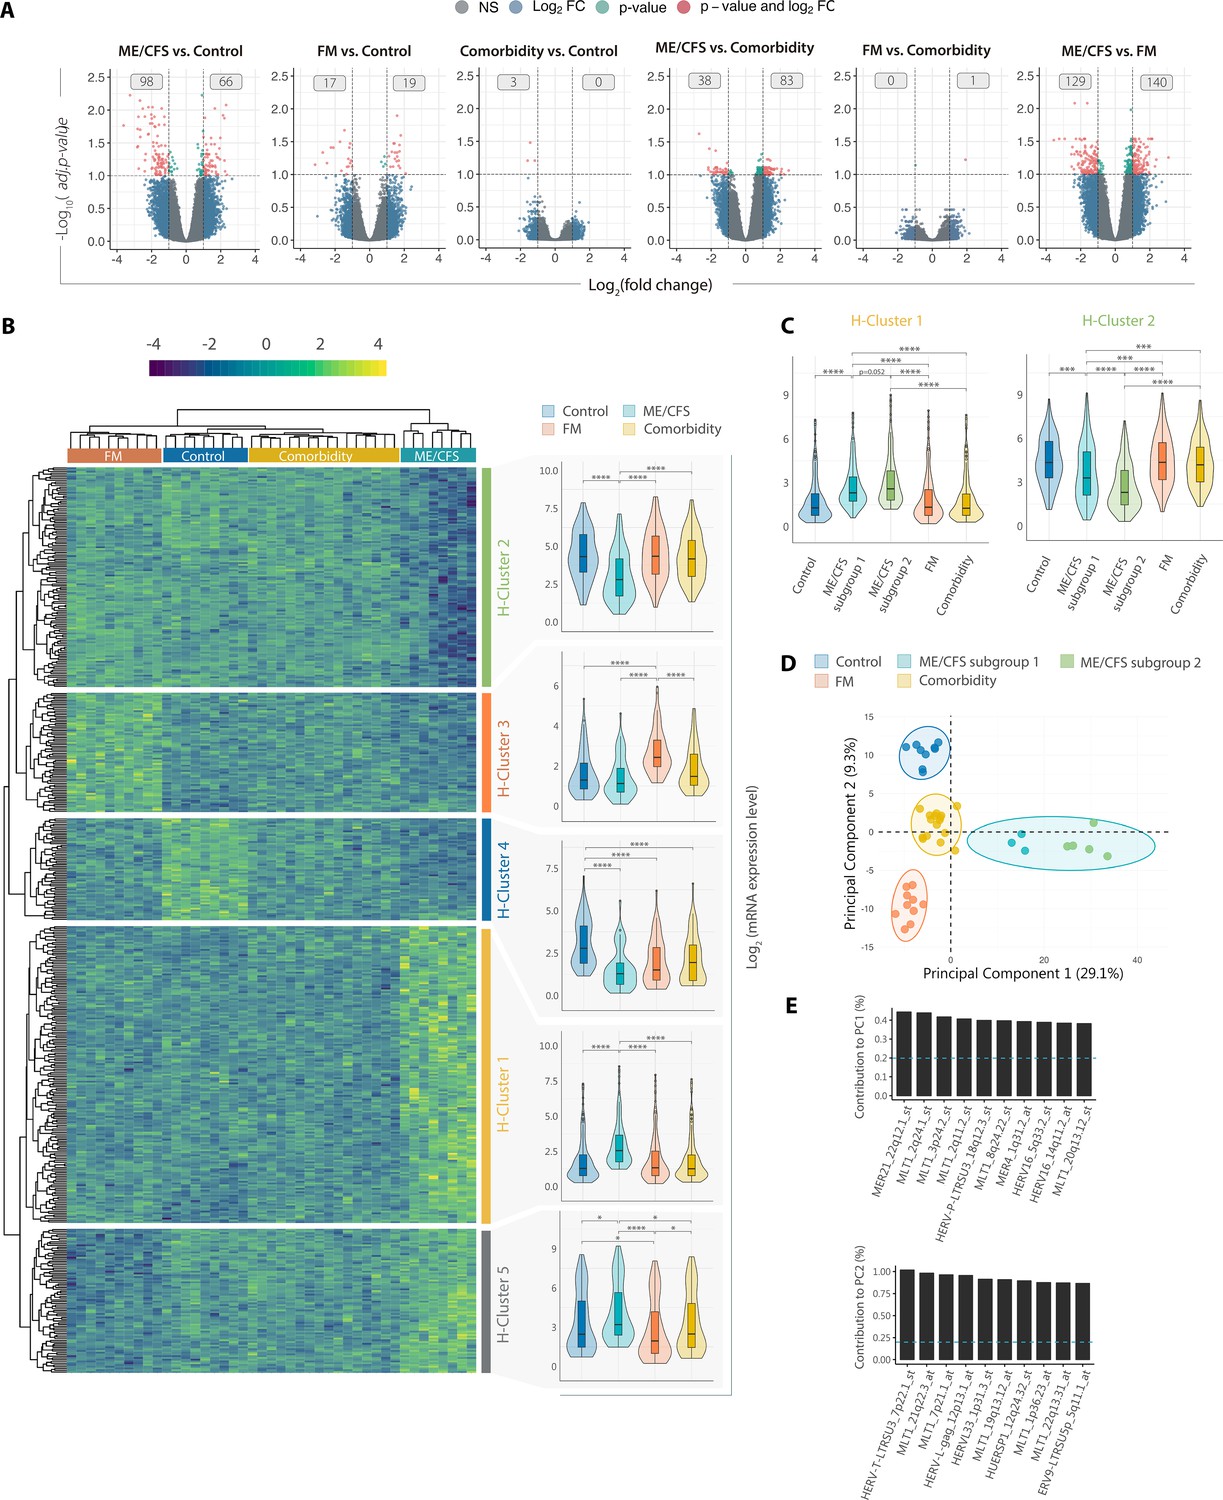
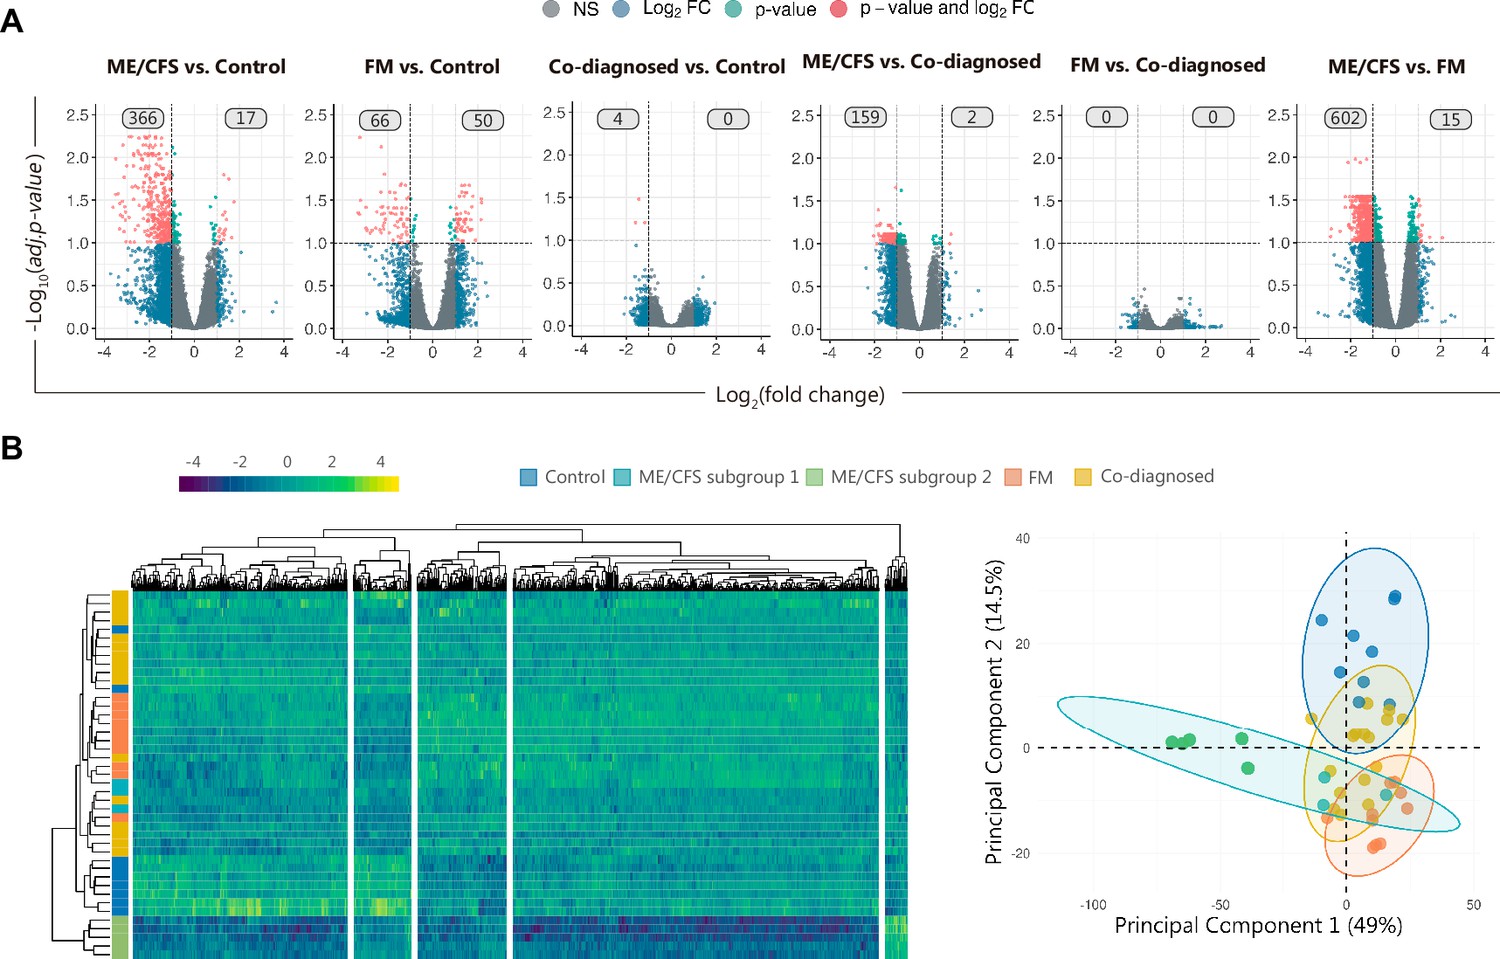
DE of HERV elements discriminates myalgic encephalomyelitis/chronic fatigue syndrome (ME/CFS), fibromyalgia (FM), and co-diagnosis.
(A) Volcano plots showing log2(fold changes) and the adjusted p-values for all HERV assessed with HERV-V3 microarray for each set of groups, as indicated. Red dots indicate DE HERV (FDR <0.1 and |log2FC| >1). Gray boxes show numbers of overexpressed or underexpressed HERV elements. (B) HERV expression heatmap and cluster analysis of ME/CFS (n = 8, green), FM (n = 10, orange), co-diagnosed (n = 16, yellow), and healthy control (n = 9, blue) samples. The heatmap includes all HERV probes displaying significant DE between at least two of the compared groups (FDR <0.1 and |log2FC| >1). Clusters 1–4 correspond to groups of HERV probes displaying significant over/under-expression in at least one group. Box and violin plots summarize the distribution and expression levels of the DE probes in each cluster per study group. The scaled mean expression value (z-score) for each HERV probe is plotted. Box plots show the median z-score value and the first and third quartiles. (C) Box and violin plots for Clusters 1 and 2 differentiating ME/CFS subgroups 1 and 2. (D) Principal component analysis of DE HERV. (E) Bar plot of top 10 DE HERV with greater influence/contribution to principal component 1 (PC1) or principal component 2 (PC2). Statistical tests: unpaired two-sample Wilcoxon test with Benjamini–Hochberg p-value correction (***p < 0.001, ****p < 0.0001).
Figure 1—figure supplement 1
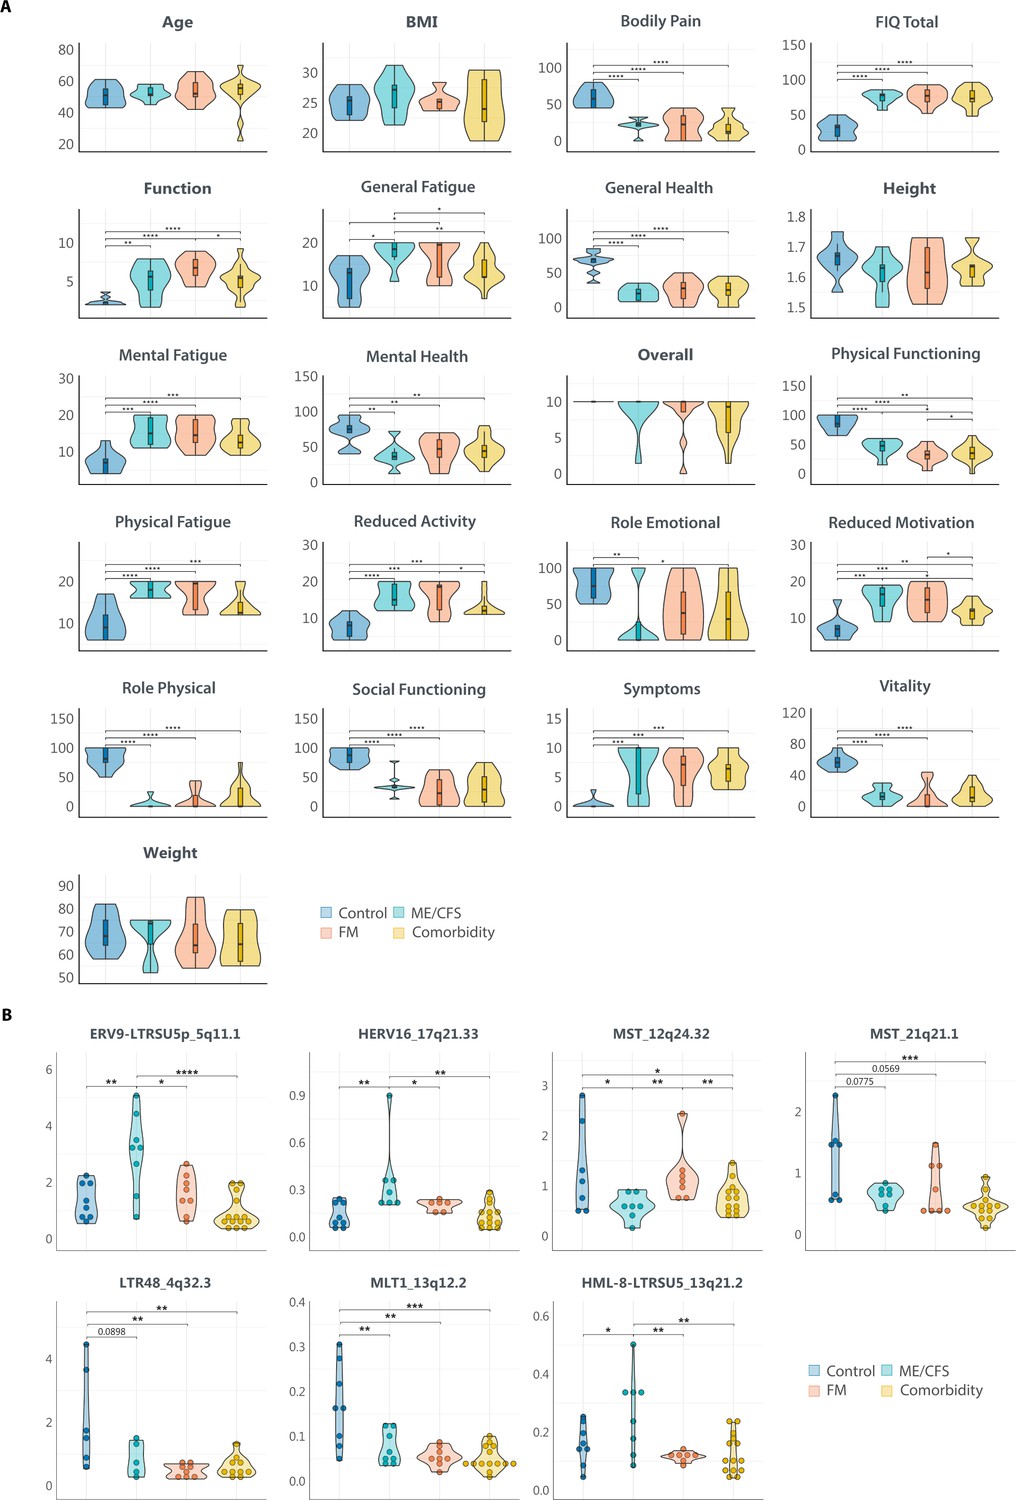
Differences between patients and controls.
(A) Clinical data for participating subjects. Violin plots summarize the distribution for demographic variables (age, BMI, and weight), Fibromyalgia Impact Questionnaire (FIQ) subdomains (Function, Overall, and Symptoms) or total FIQ; for Multi Fatigue Inventory (MFI) subdomains (GF: general fatigue, Pfa: physical fatigue, RA: reduced activity, RM: reduced motivation, and MF: mental fatigue), and for Short-Form-36 Health Survey (SF-36) subdomains (PF: physical functioning, RP: role physical, BP: bodily pain, GH: general health, VT: vitality, SF: social functioning, RE: role emotional, and MH: mental health). Variables are ordered alphabetically. (B) Validation of DE HERV loci by RT-qPCR. Violin plots summarize the distribution and expression level of ΔΔCt values for each sample in each study group. Statistical tests: unpaired two-sample Wilcoxon test with Benjamini–Hochberg p-value correction (*p < 0.05, **p < 0.01, ***p < 0.001, ****p < 0.0001).
Figure 2 with 4 supplements
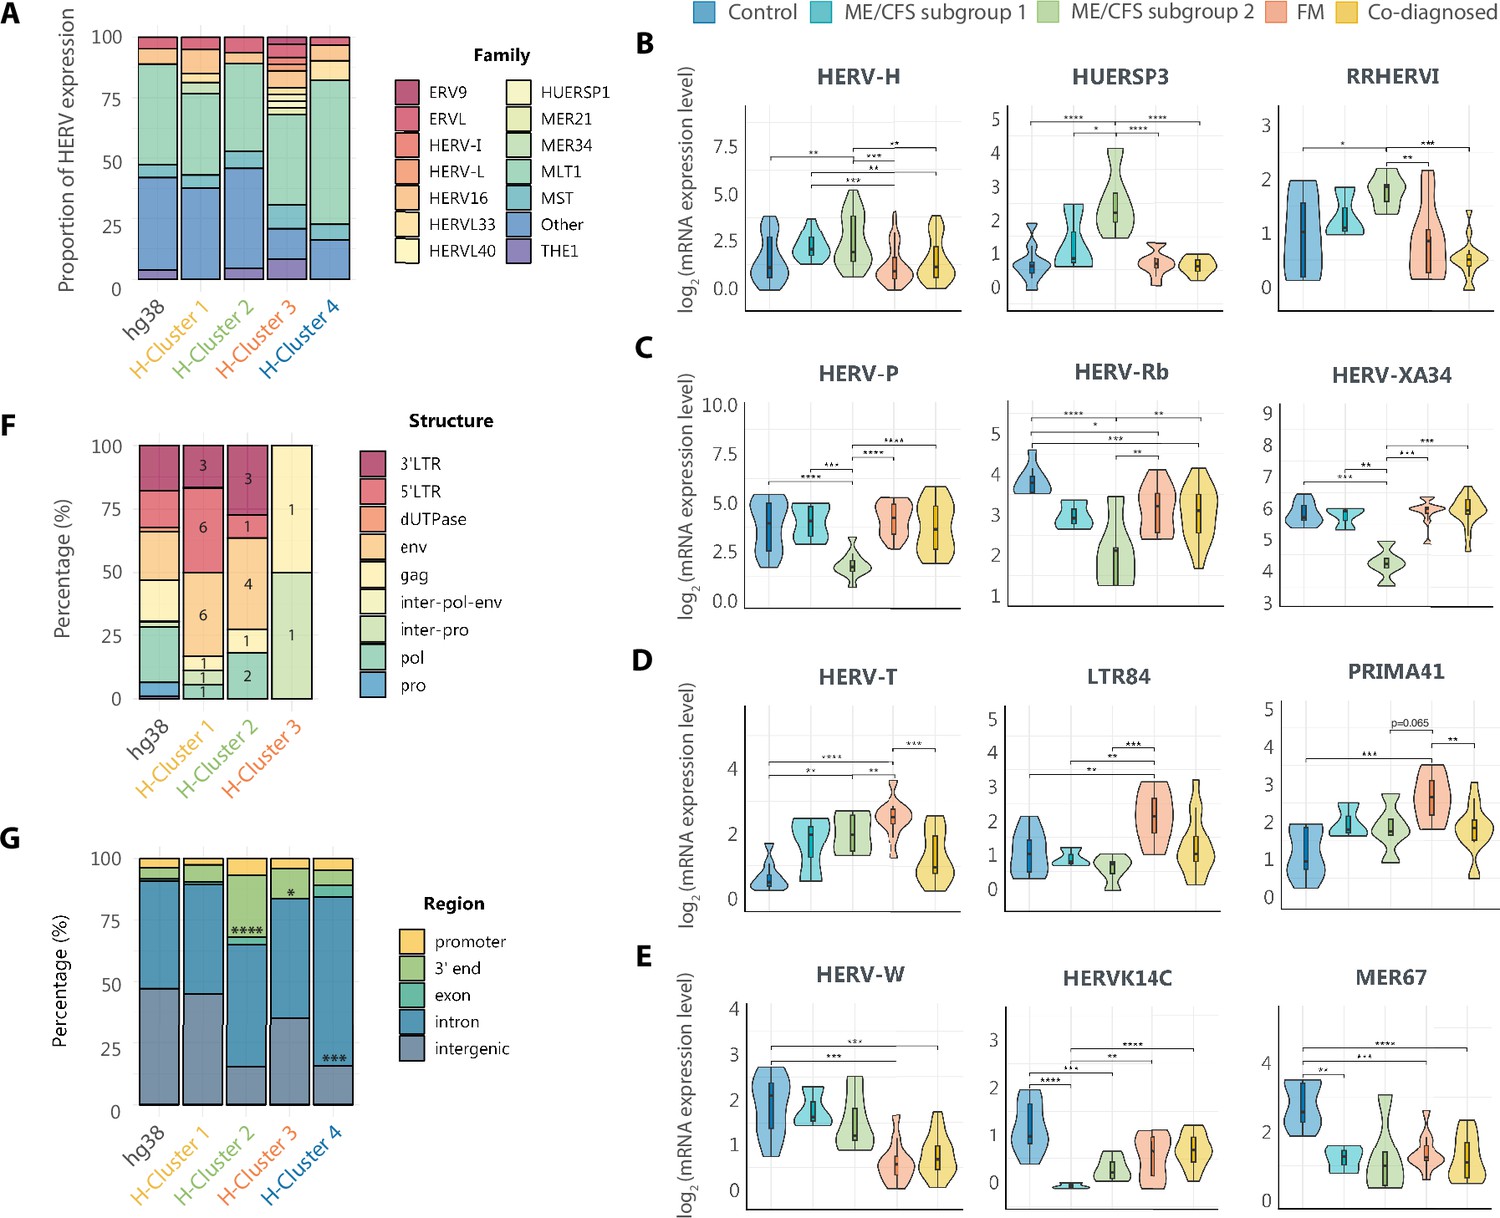
Diverse solitary long terminal repeat (LTR) families are deregulated in myalgic encephalomyelitis/chronic fatigue syndrome (ME/CFS), fibromyalgia (FM), and co-diagnosed conditions.
(A) Relative contribution of HERV families to each cluster, calculated as the proportion of HERV loci assigned to each family relative to total HERV loci in each cluster. Families with a representation of at least 2.5% are shown. Main HERV families (B) downregulated in ME/CFS, FM and co-diagnosed groups (Cluster 4), (C) upregulated in ME/CFS (Cluster 1), (D) downregulated in ME/CFS (Cluster 2), and (E) upregulated in FM (Cluster 3). Box and violin plots summarize distributions and expression levels of the different HERV probes belonging to the same family in the different study groups. The scaled mean expression value (z-score) for each HERV probe is plotted. Box plots show the median z-score value and the first and third quartiles. (F) Proportion of HERV subdomains expressed by cluster. (G) Genomic context of the DE HERV loci by cluster. Statistical tests: Fisher’s exact test, t-test or Wilcoxon test with Benjamini–Hochberg p-value correction (*p < 0.05, **p < 0.01, ***p < 0.001, ****p < 0.0001).
Figure 2—figure supplement 1
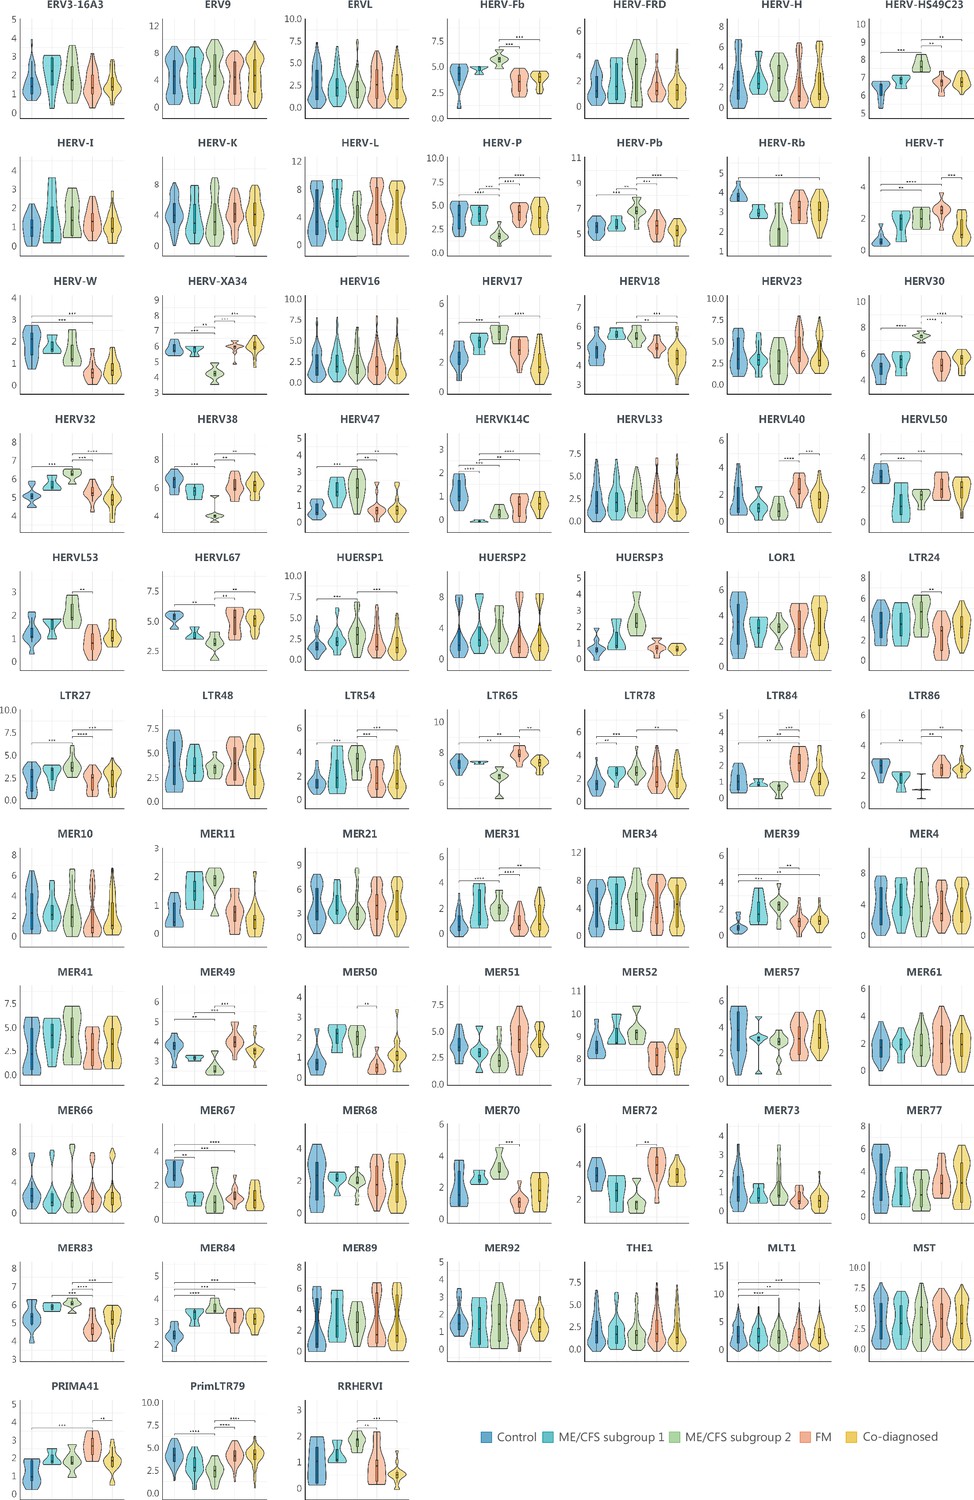
DE HERV families by study group.
Violin plots summarize the distribution and expression levels of HERV probesets (log2(mRNA expression level)) from a specific family for each sample in each study group. Statistical tests: unpaired two-sample Wilcoxon test with Benjamini–Hochberg p-value correction. (*p < 0.05, **p < 0.01, ***p < 0.001, ****p < 0.0001).
Figure 2—figure supplement 2
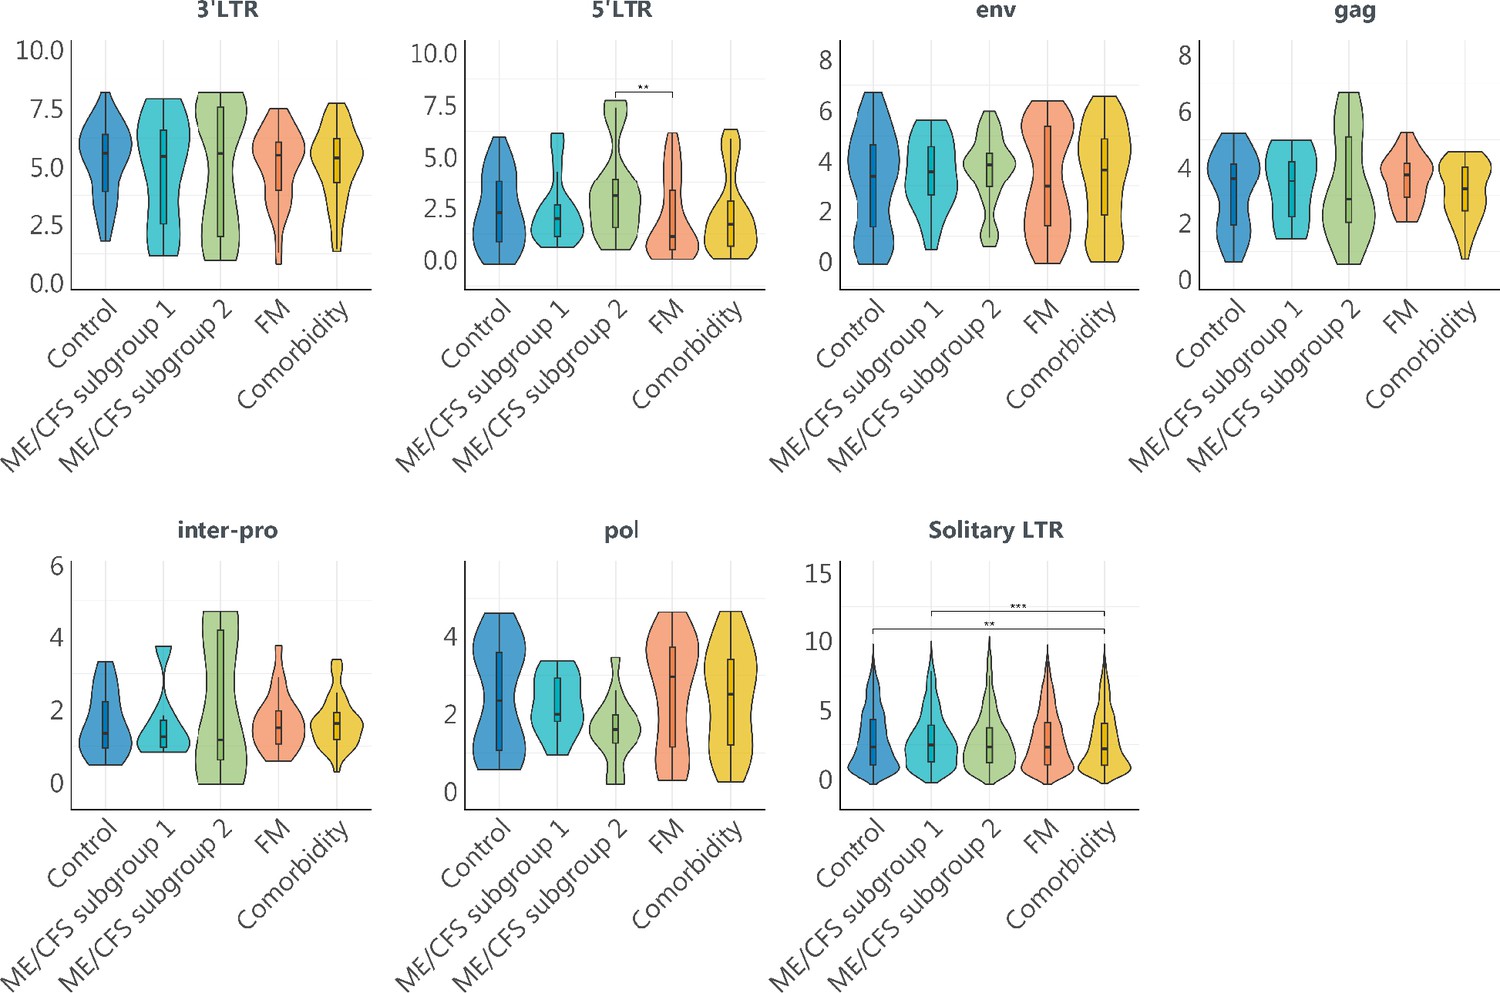
DE HERV structures by study group.
Violin plots summarize the distribution and expression levels of HERV probesets (log2(mRNA expression level)) from a specific HERV structure for each sample in each study group. Statistical tests: unpaired two-sample Wilcoxon test with Benjamini–Hochberg p-value correction (**p < 0.01, ***p < 0.001).
Figure 2—figure supplement 3
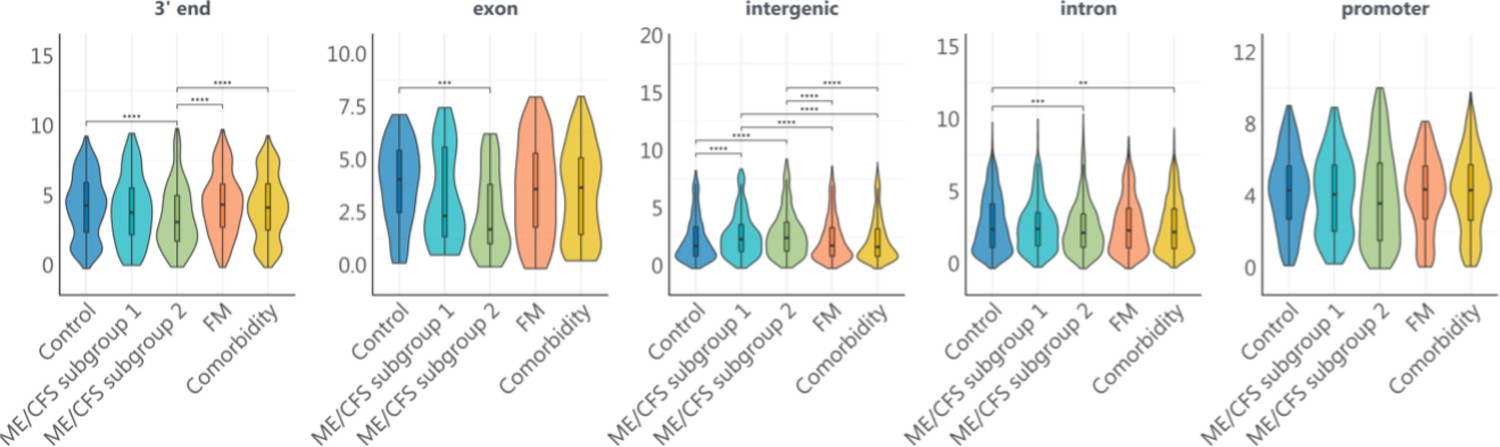
DE HERV genomic location by study group.
Violin plots summarize the distribution and expression levels of HERV probesets (log2(mRNA expression level)) from a specific HERV structure for each sample in each study group. Statistical tests: unpaired two-sample Wilcoxon test with Benjamini–Hochberg p-value correction (, **p < 0.01, ***p < 0.001, ****p < 0.0001).
Figure 2—figure supplement 4
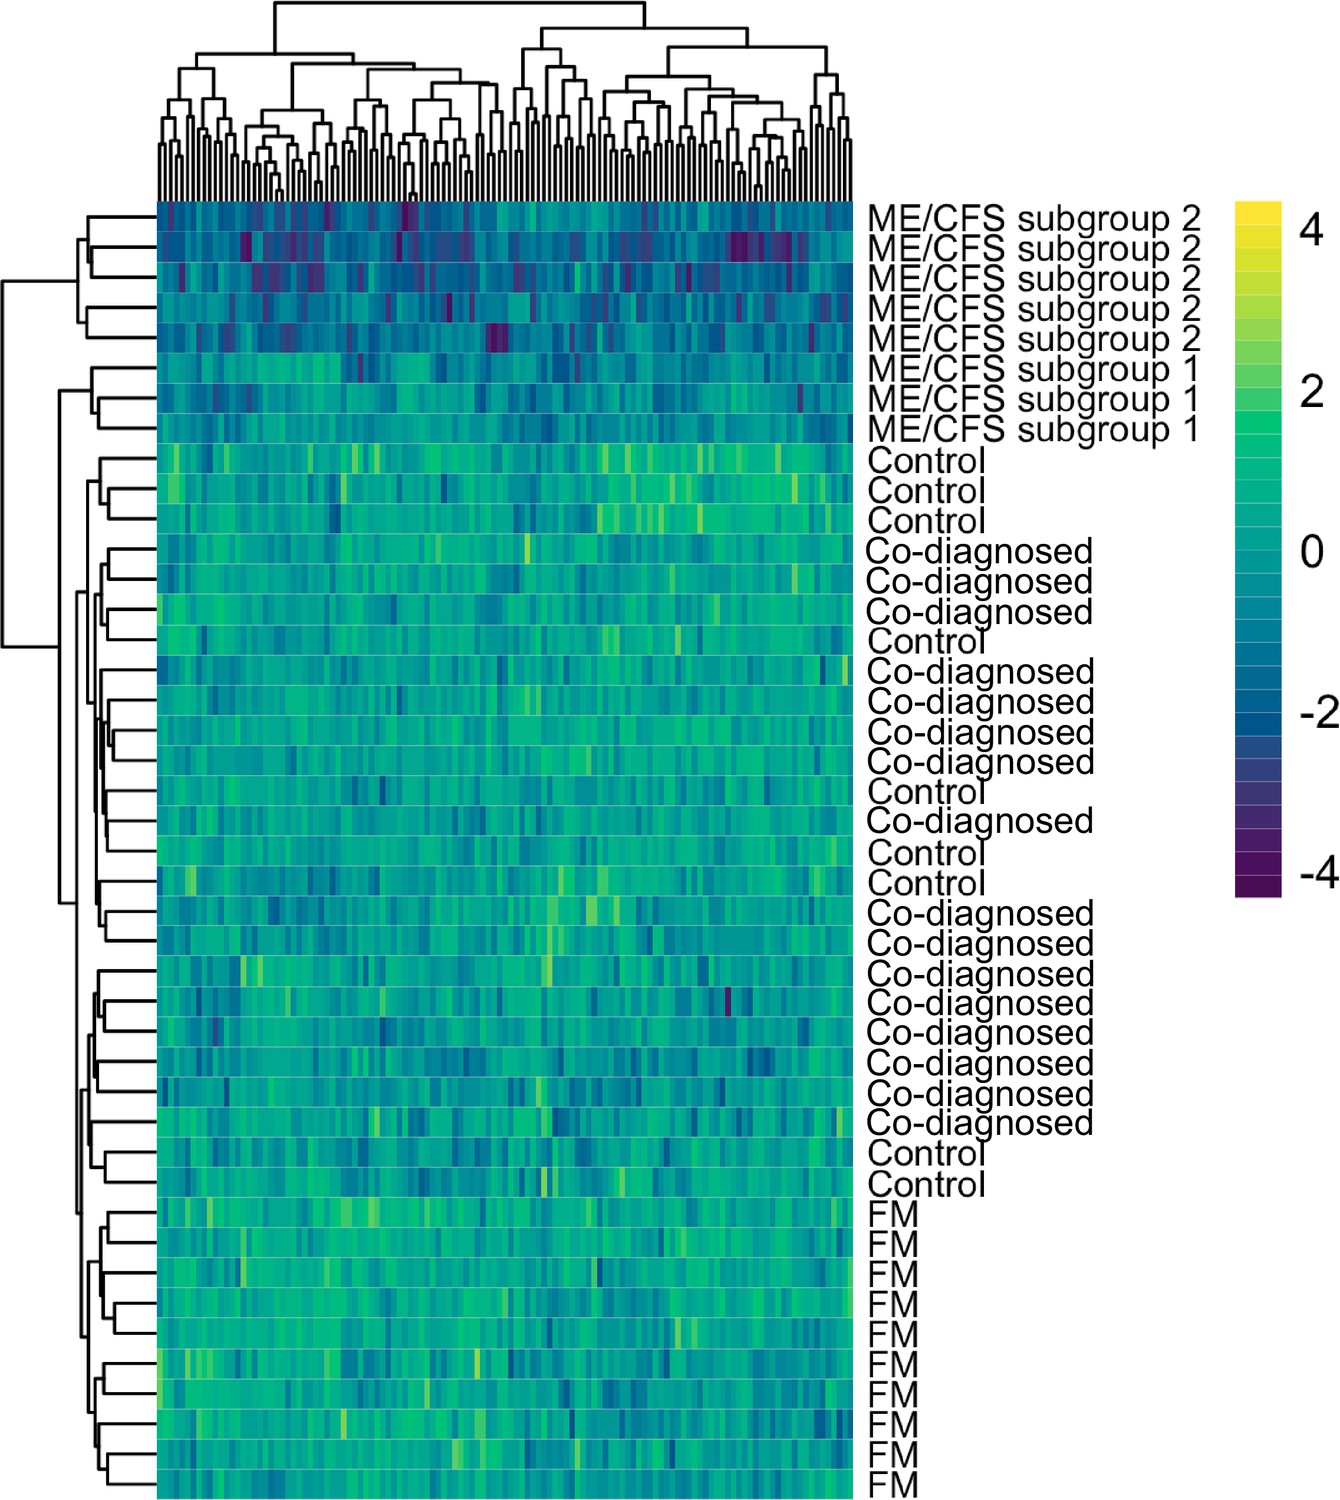
Intergenic solo long terminal repeat (LTR) DE across study groups.
Intergenic solo LTR expression heatmap of myalgic encephalomyelitis/chronic fatigue syndrome (ME/CFS) (n = 8, green), fibromyalgia (FM) (n = 10, orange), co-diagnosed (n = 16, yellow), and healthy control (n = 9, blue) samples. The heatmap includes all solo LTR probes displaying significant DE between at least two of the compared groups (FDR <0.1 and |log2FC| >1).
Figure 3 with 1 supplement
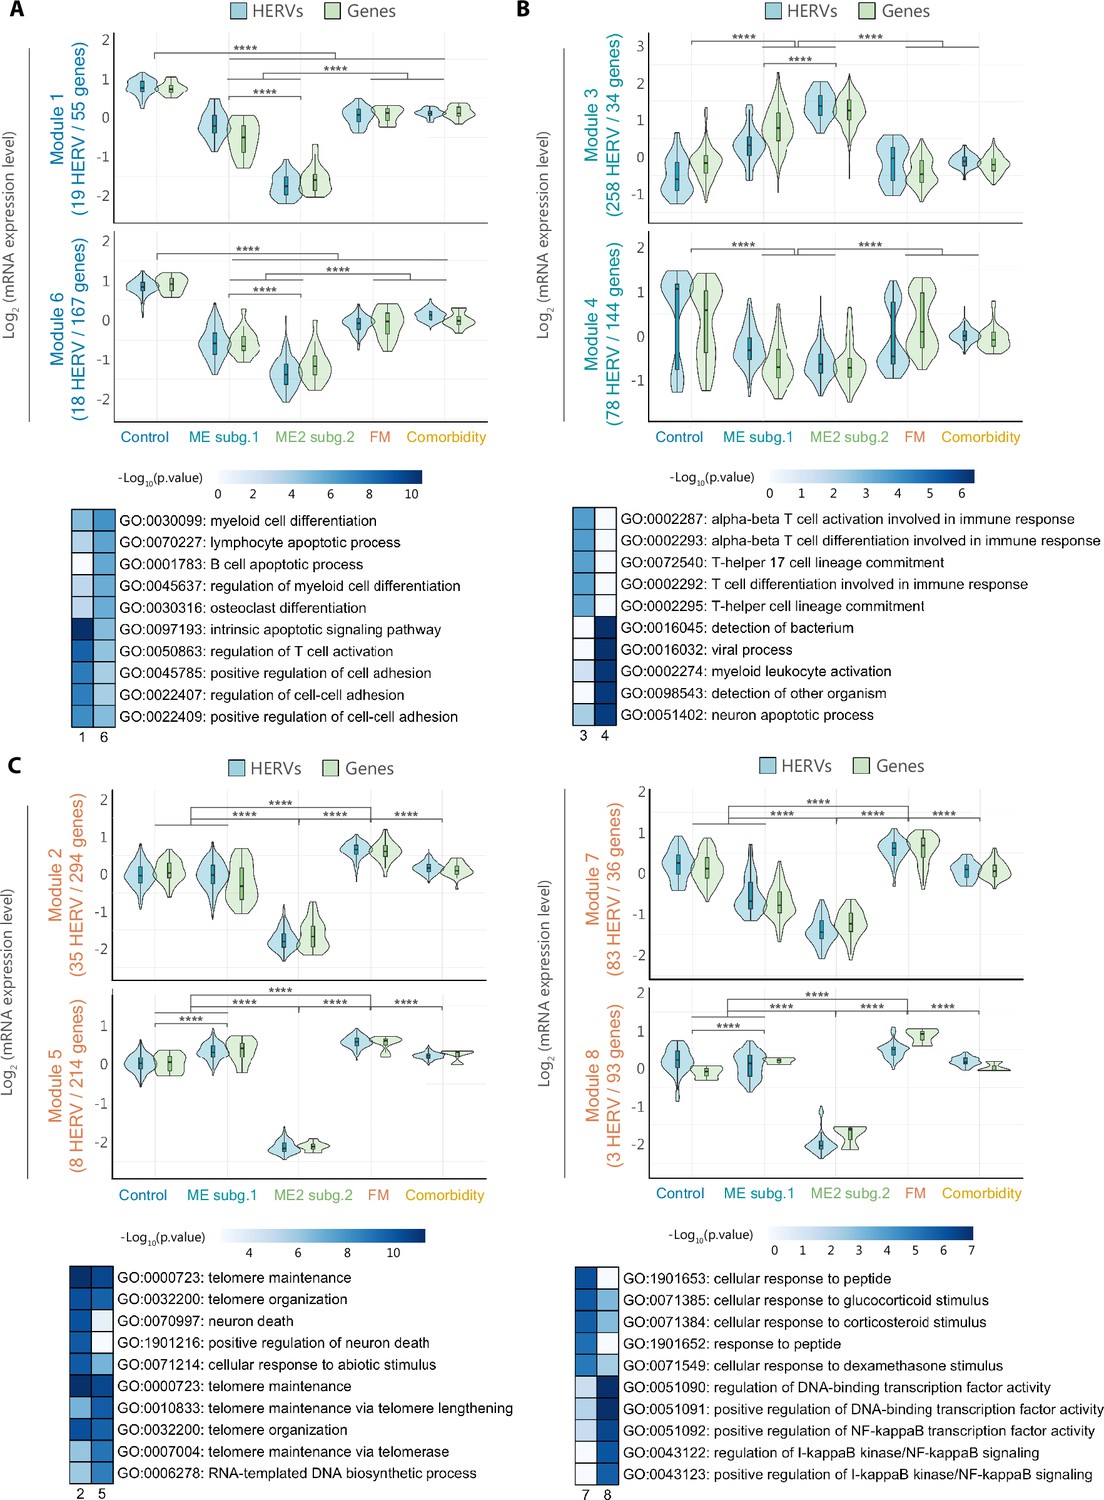
HERV expression correlates with immune-response genes.
Hierarchical clustering of DE HERV and genes (FDR <0.1 and |log2FC| >1) providing eight modules with highly correlated expression levels. Box and violin plots summarize the distribution and expression level of the different HERV (blue) and gene (green) probes in Modules (A) 1 and 6, (B) 3 and 4, and (C) 2, 5, 7, and 8, per study group. The scaled mean expression value (z-score) for each HERV and gene probe sets are plotted. Box plots show the median z-score values with first and third quartiles. Statistical tests: Wilcoxon test (****p < 0.0001).
Figure 3—figure supplement 1
Differential gene expression for myalgic encephalomyelitis/chronic fatigue syndrome (ME/CFS), fibromyalgia (FM), and comorbidity groups.
(A) Volcano plots showing the log2(fold change) and the adjusted p-value for all the genes assessed by HERV-V3 microarray in each comparison by condition. Red dots indicate differentially expressed genes (FDR <0.1 and |log2FC| >1). Gray boxes indicate the number of upregulated and downregulated HERVs. (B) Gene expression heatmap and principal component analysis (PCA) of ME/CFS (n = 8), FM (n = 10), comorbidity (n = 16), and healthy control (n = 9) samples. Sample groups are color-coded in green, orange, yellow, and blue, respectively. The heatmap and PCA include all gene probes displaying significant differential expression between at least two groups (FDR <0.1 and |log2FC| >1).
Figure 4 with 1 supplement
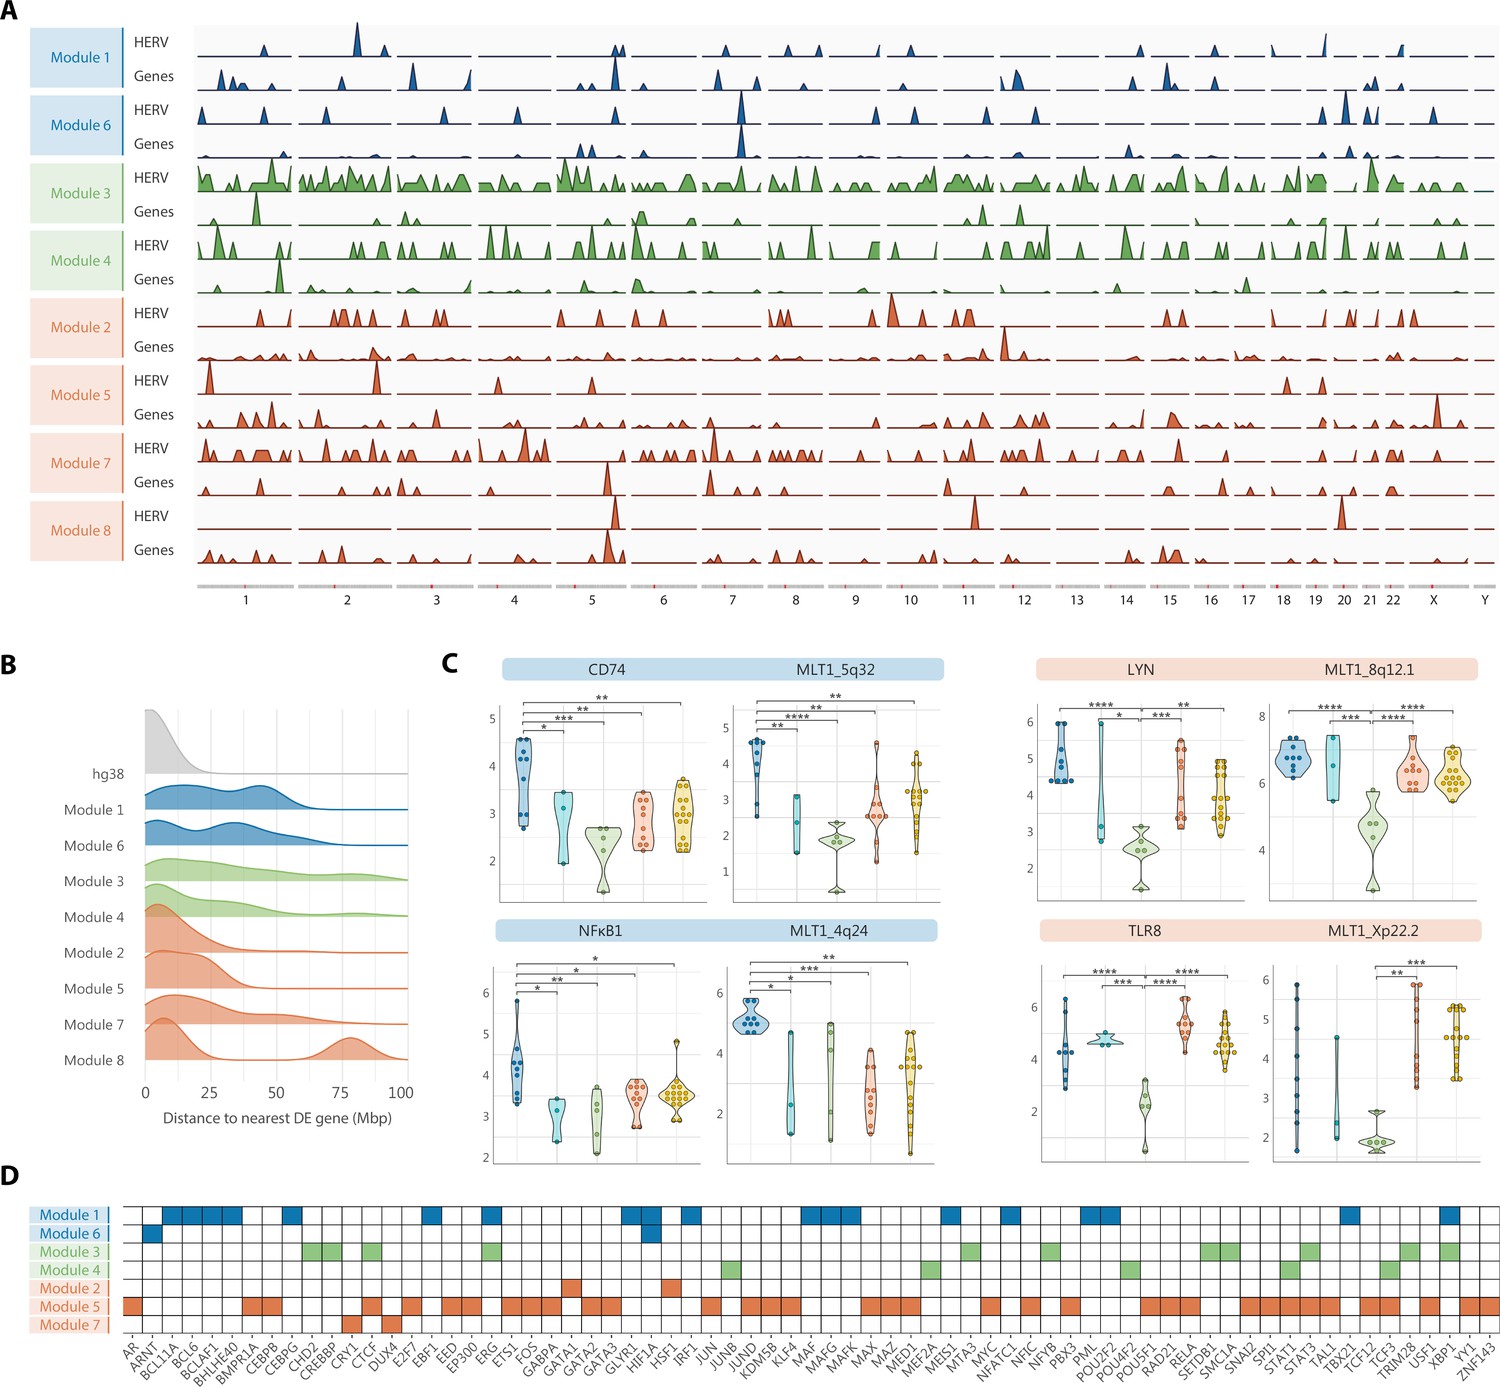
DE HERV sequences and DE immune-response genes are majorly independently transcribed.
(A) Genomic distribution of HERV, and genes encompassed in Modules 1 through 8. (B) Genomic distance between DE HERV and their nearest DE genes per module, plotted as density curves illustrating the distribution of distances from 0 to 100 million base pair (Mbp). (C) Violin dot plots showing the distribution and expression levels of some examples of co-localized HERV loci and genes in myalgic encephalomyelitis/chronic fatigue syndrome (ME/CFS) subgroup 1 (n = 3), ME/CFS subgroup 2 (n = 5), FM (n = 10), co-diagnosed (n = 16), and healthy control (n = 9) samples. Blue and orange highlighted headings indicates the pair HERV/gene belonged to Modules 1 or 6, or Modules 2, 5, 7, or 8, respectively. (D) Heatmap of enriched transcription factor binding sites (TFBS) in HERV loci of Modules 1 through 7. Module 8 did not show significant enrichment of TFBS. Statistical tests: Wilcoxon test (*p < 0.05; **p < 0.01, ***p < 0.001, ****p < 0.0001).
Figure 4—figure supplement 1
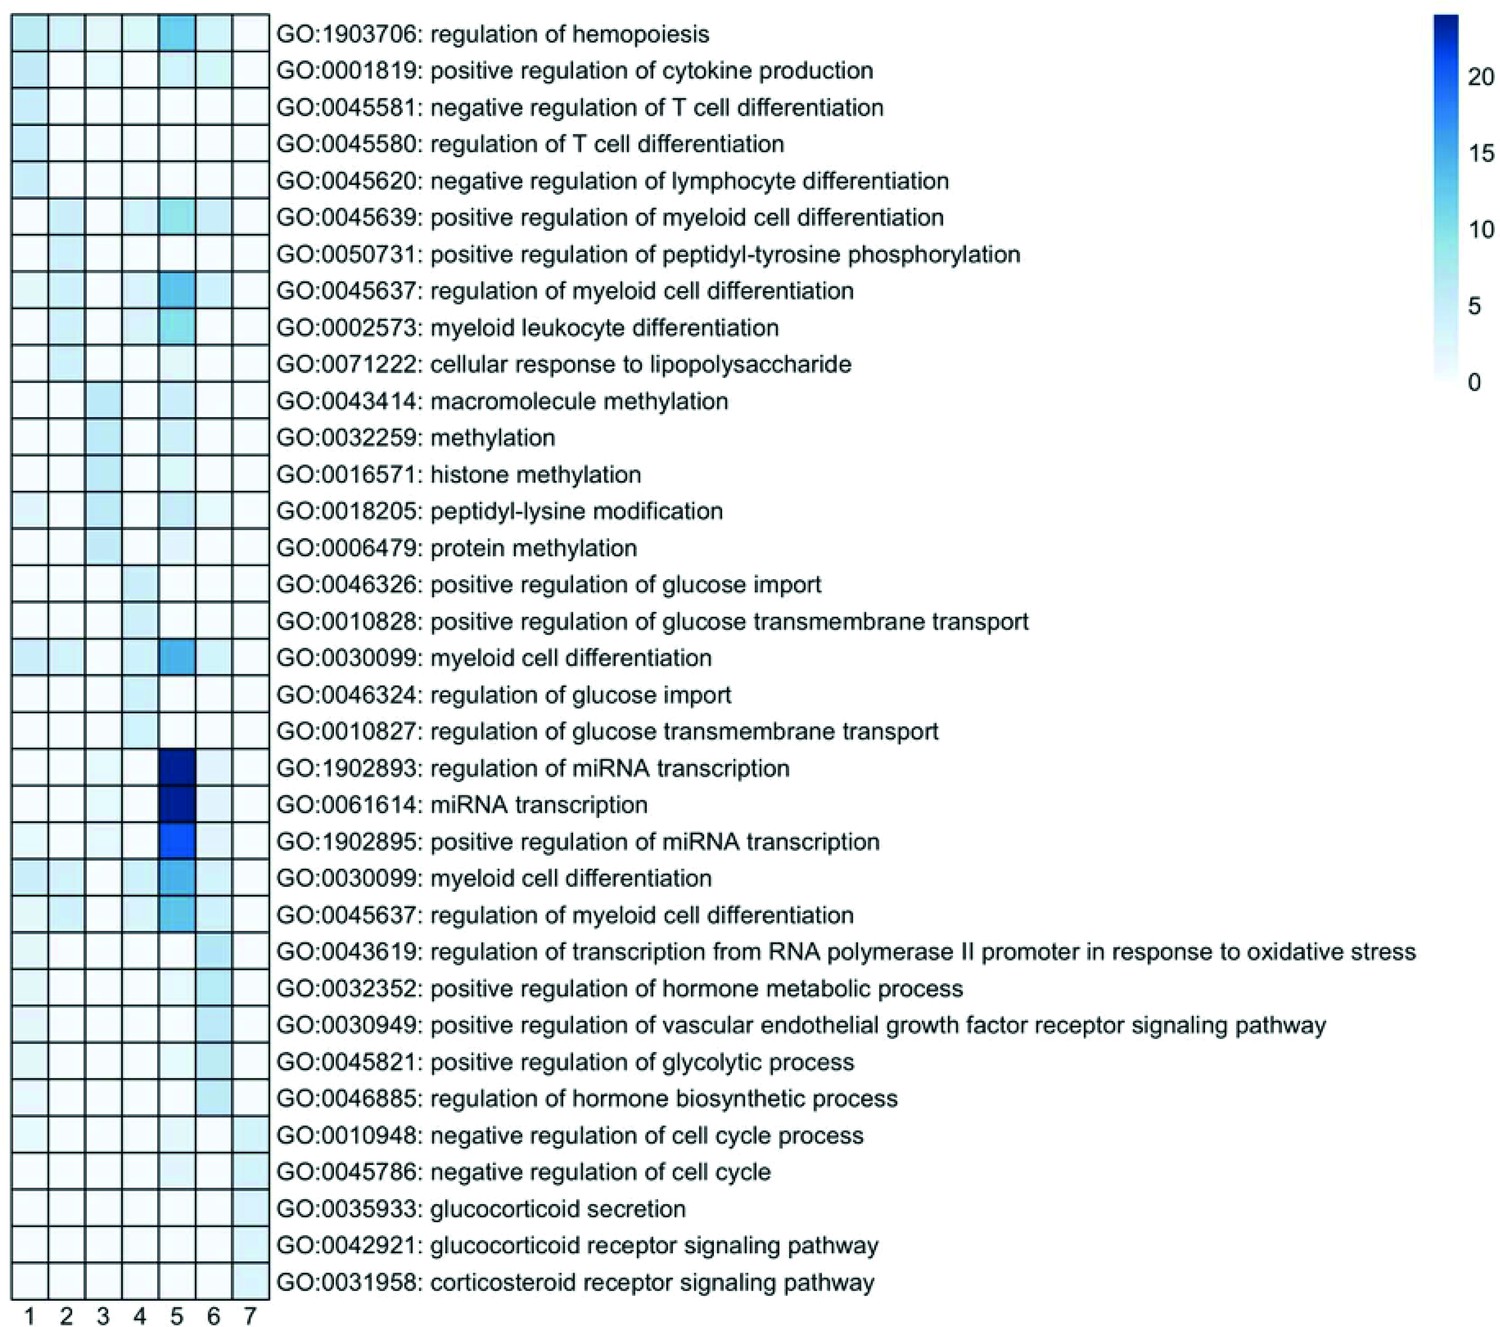
Gene ontology analysis of transcription factors binding sites enriched in HERV loci of Modules 1–7.
Figure 5
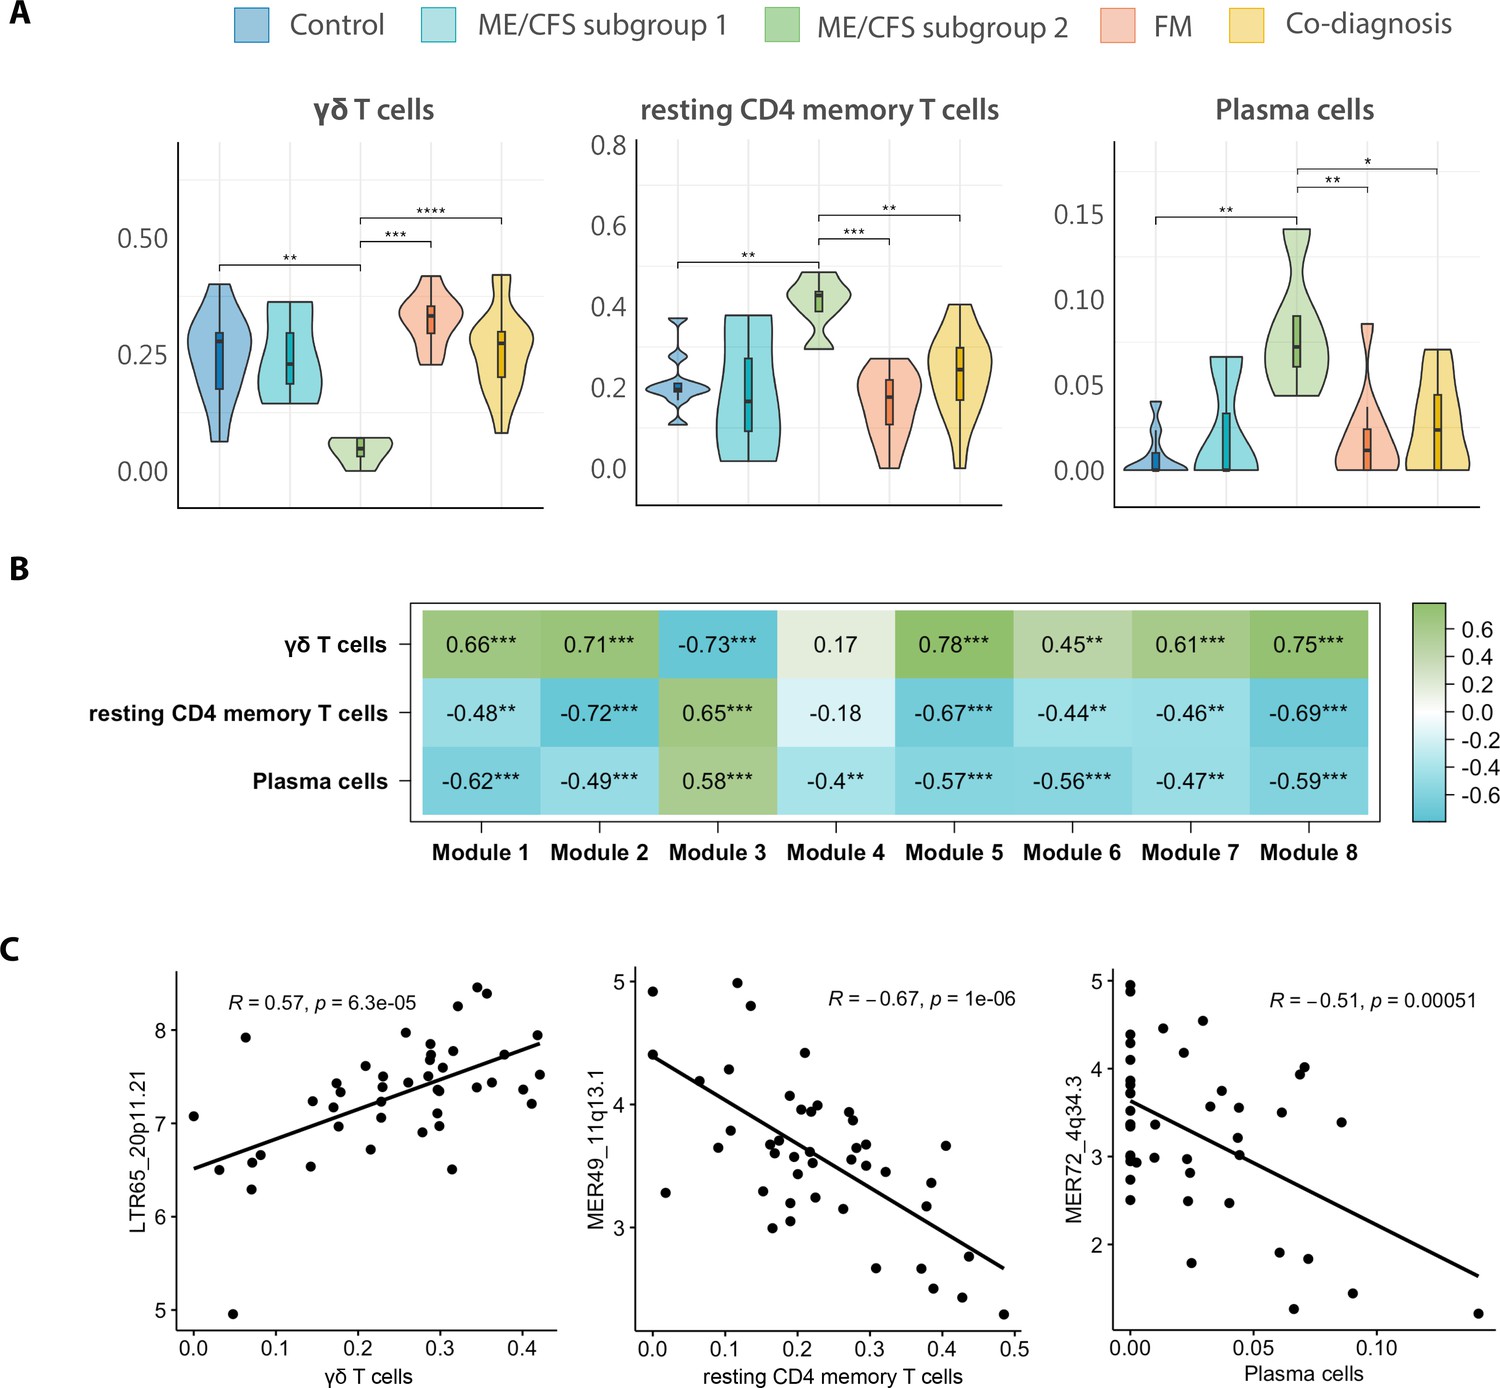
HERV fingerprints correlate with immune cell profiles.
(A) Measurements of immune cell proportions by CIBERSORTx per study group (n = 8 myalgic encephalomyelitis/chronic fatigue syndrome [ME/CFS], n = 10 fibromyalgia [FM], n = 16 co-diagnosed, n = 9 controls). (B) Association between modules and immune cell proportions was evaluated by correlating eigengenes from each module with cell proportion values obtained from CIBERSORTx analysis. Boxes show Pearson correlation values and associated p-values (*p < 0.05, **p < 0.01, ***p < 0.001, ****p<0.0001) between gene expression levels of each module and quantity of cells from each specific type. A value of 1 (green) and –1 (blue) quantify strongest positive and negative correlations, respectively, while 0 (white) shows no correlation. (C) Scatter plots between top HERV loci expression levels and immune cell proportion as measured by CIBERSORTx. Pearson correlation coefficients and associated p-values are shown in plots. Correlation 95% confidence intervals are: 0.33–0.74 for LTR65_20p11.21 versus γδ T cells, –0.81 to –0.46 for MER49_11q13.1 versus resting CD4 memory T cells, and –0.70 to –0.25 for MER72_4q34.3 versus plasma cells.
Figure 6
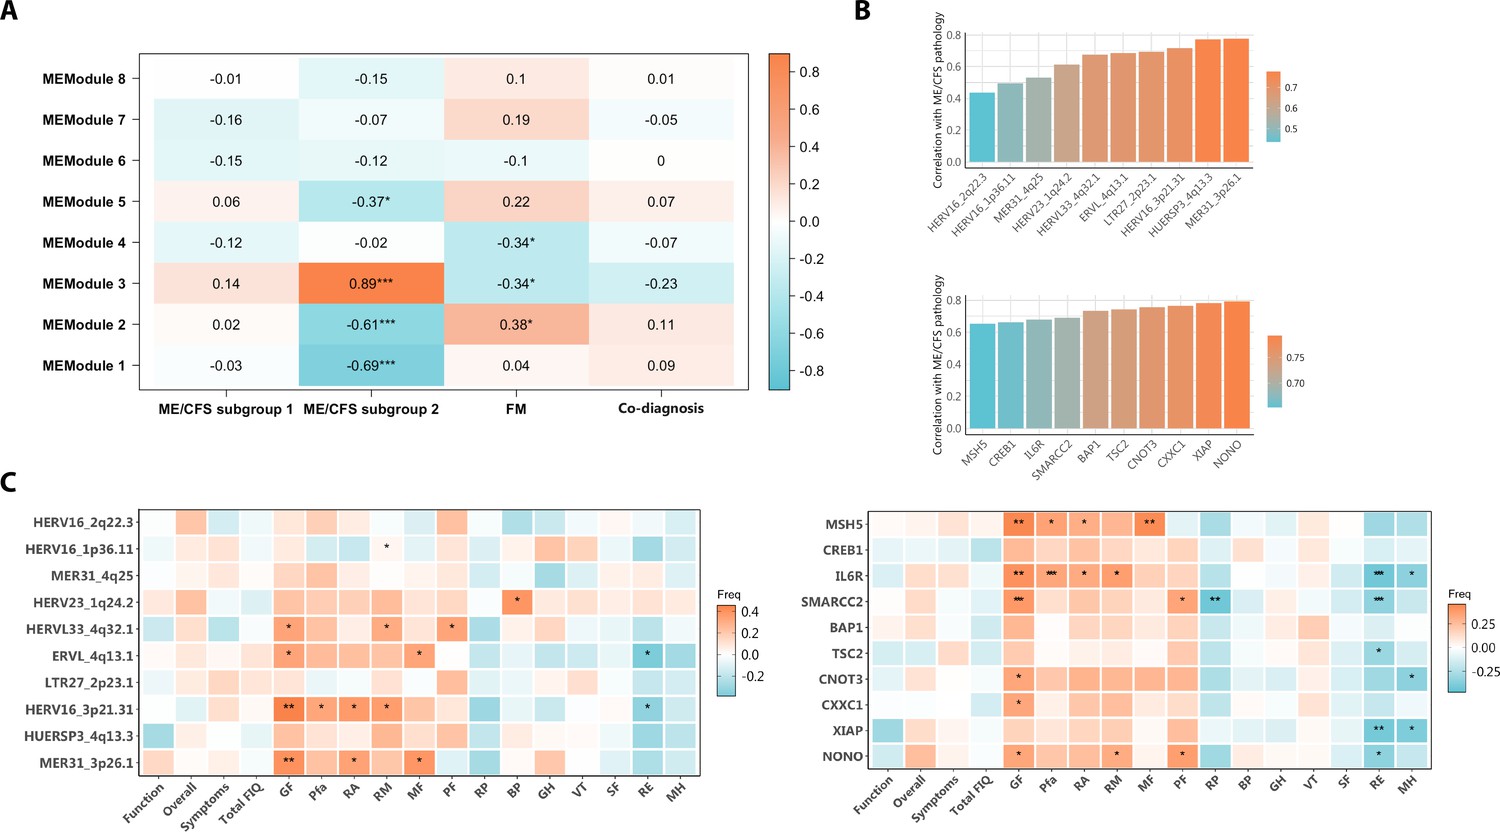
HERV and gene deregulation associates with disease symptomatology.
(A) Association between modules and disease determined by correlations of eigengenes from each module with binarized disease traits. Boxes show Pearson correlation values and associated p-values (*p < 0.05, **p < 0.01, ***p < 0.001) by module and each disease trait. A value of 1 (orange) and –1 (blue) quantify strongest positive and negative correlations, respectively, while 0 (white) shows no correlation. (B) Barplots showing top 10 HERV loci (upper) and top 10 genes (lower) with highest correlations with myalgic encephalomyelitis/chronic fatigue syndrome (ME/CFS) disease. Bar height and color display the strength of each correlation, being high orange bars more correlated than lower blue bars. (C) Association between top 10 HERV loci (left) and top 10 genes (right) with disease traits as determined by their correlation with ME/CFS patient symptoms as assessed by questionnaire scores. Boxes show Pearson correlation values and associated p-values (*p < 0.05, **p < 0.01) by DE HERV or DE gene as indicated for Fibromyalgia Impact Questionnaire (FIQ) subdomains (Function, Overall, and Symptoms) or total FIQ; for Multi Fatigue Inventory (MFI) subdomains (GF: general fatigue, Pfa: physical fatigue, RA: reduced activity, RM: reduced motivation, and MF: mental fatigue), and for Short-Form-36 Health Survey (SF-36) subdomains (PF: physical functioning, RP: role physical, BP: bodily pain, GH: general health, VT: vitality, SF: social functioning, RE: role emotional, and MH: mental health).
Tables
Table 1
Patient health status assessment with FIQ, MFI, and SF-36 (Burckhardt et al., 1991; Mchorney et al., 1993; Smets et al., 1995) questionnaires.
| Control (n = 9)Mean ± SD [range] | ME/CFS (n = 8)Mean ± SD [range] | FM (n = 10)Mean ± SD [range] | Co-diagnosed (n = 16)Mean ± SD [range] | |
|---|---|---|---|---|
| Age | 51 ± 2 [43–61] | 54 ± 3 [50–58] | 50 ± 5 [42–58] | 47 ± 15.48 [22 – 58] |
| BMI | 25.03 ± 2.07 [22.10–28.04] | 26.29 ± 3.33 [21.34–31.22] | 25.31 ± 1.73 [23.68–28.40] | 24.80 ± 4.72 [18.71–30.43] |
| FIQ | ||||
| Total FIQ | 28.16 ± 13.08 [0–2.86] | 74.4 ± 4.8 [56.3–85.6] | 75.9 ± 3.4 [51.6–92.8] | 74.6 ± 2.5 [47.8–96.3] |
| Function | 2.38 ± 0.57 [1.98–3.63] | 5.2 ± 2.2 [1.7–7.9] | 6.8 ± 1.5 [4.3–8.9] | 5.2 ± 1.8 [1.7–9.2] |
| Overall | 10.01 ± 0 [10.01–10.01] | 8.9 ± 3.0 [1.4–10.0] | 8.2 ± 3.4 [0–10.0] | 7.9 ± 2.7 [1.4–10] |
| Symptoms | 0.32 ± 0.95 [0–2.86] | 6.6 ± 4.8 [0–10.0] | 6.0 ± 3.4 [0–10.0] | 6.2 ± 2.5 [2.9–10] |
| MFI | ||||
| General fatigue | 11.56 ± 4.19 [5–17] | 17.6 ± 3.1 [11–20] | 16.3 ± 4.6 [10–20] | 13.6 ± 3.2 [7–20] |
| Physical fatigue | 10.11 ± 4.01 [6–17] | 18.0 ± 1.9 [16–20] | 17.0 ± 3.7 [12–20] | 14.1 ± 2.9 [12–20] |
| Reduced activity | 7.33 ± 2.74 [4–12] | 15.9 ± 3.4 [12–20] | 15.9 ± 4.4 [9–20] | 12.9 ± 2.8 [11–20] |
| Reduced motivation | 7.22 ± 3.31 [4–15] | 15.4 ± 3.7 [9–19] | 14.8 ± 4.1 [9–20] | 11.6 ± 2.4 [8–16] |
| Mental fatigue | 7.11 ± 2.93 [4–13] | 15.5 ± 3.7 [11–20] | 15.1 ± 3.8 | 13.3 ± 3.1 [9–19] |
| SF-36 | ||||
| Physical functioning | 86.67 ± 13.23 [65–100] | 44.5 ± 14.5 [15–60] | 31.5 ± 13.9 | 35.3 ± 14.8 [0–65] |
| Role physical | 83.33 ± 17.95 [50–100] | 3.2 ± 8.8 [0–25] | 10.6 ± 17.7 [0–43.8] | 14.5 ± 21.9 [0–75] |
| Bodily pain | 58.61 ± 12.63 [45–80] | 19.3 ± 11.7 [0–32.5] | 19.3 ± 17.8 [0–45] | 17.3 ± 14.2 [0–45] |
| General health | 65.56 ± 15.09 [35–85] | 18.9 ± 11.0 [3.8–35.0] | 24.8 ± 16.1 [0–50] | 23.4 ± 14.8 [0–45] |
| Vitality | 56.94 ± 9.08 [43.75–75.00] | 13.6 ± 10.1 [0–30] | 11.1 ± 16.8 [0–43.8] | 14.5 ± 11.6 [0–40] |
| Social functioning | 84.72 ± 13.66 [62.50–100] | 33.6 ± 21.9 [4.0–77.5] | 25.0 ± 23.2 [0–62.1] | 29.5 ± 25.6 [0–75] |
| Role emotional | 79.63 ± 20.88 [50–100] | 12.8 ± 35.3 [0–100] | 43.3 ± 37.2 [0–100] | 12.8 ± 38.9 [0–100] |
| Mental health | 71.67 ± 18.54 [40–95] | 34.9 ± 21.2 [3.4–72.0] | 44.7 ± 19.9 [12–70] | 45.2 ± 17.1 [15–80] |
-
FIQ, Fibromyalgia Impact Questionnaire; MFI, Multi Fatigue Inventory; SF-36, Short-Form 36 Health Survey; SD, standard deviation; SE, standard error. Range refers to the possible values in the studied group.
Additional files
-
MDAR checklist
- https://cdn.elifesciences.org/articles/104441/elife-104441-mdarchecklist1-v1.pdf
-
Supplementary file 1
Raw, processed, and complementary data.
(A) Itemized participant demographics and health status assessment with FIQ, MFI and SF-36 questionnaires. (B) Statistical analysis of participant demographics and health status assessment with FIQ, MFI and SF-36 questionnaires. (C) Differentially expressed HERV. (D) Patient health status assessment with FIQ, MFI, and SF-36 questionnaires separating ME/CFS into two subgroups. (E) Relative contribution of HERV families to each cluster. (F) Differentially expressed genes. (G) Genomic distance between correlated HERVs and genes in each module. (H) Primers for RT-qPCR validation.
- https://cdn.elifesciences.org/articles/104441/elife-104441-supp1-v1.xlsx
Download links
A two-part list of links to download the article, or parts of the article, in various formats.
Downloads (link to download the article as PDF)
Open citations (links to open the citations from this article in various online reference manager services)
Cite this article (links to download the citations from this article in formats compatible with various reference manager tools)
HERV activation segregates ME/CFS from fibromyalgia while defining a novel nosologic entity
eLife 14:RP104441.
https://doi.org/10.7554/eLife.104441.3


