Tissue-specific responses to TFAM and mtDNA copy number manipulation in prematurely ageing mice
- Department of Medical Biochemistry and Biophysics, Karolinska Institutet, Sweden
- Department of Cellular Biochemistry, University Medical Center Göttingen, Germany
- Center for Inherited Metabolic Diseases, Karolinska University Hospital, Sweden
Figures
Figure 1 with 1 supplement
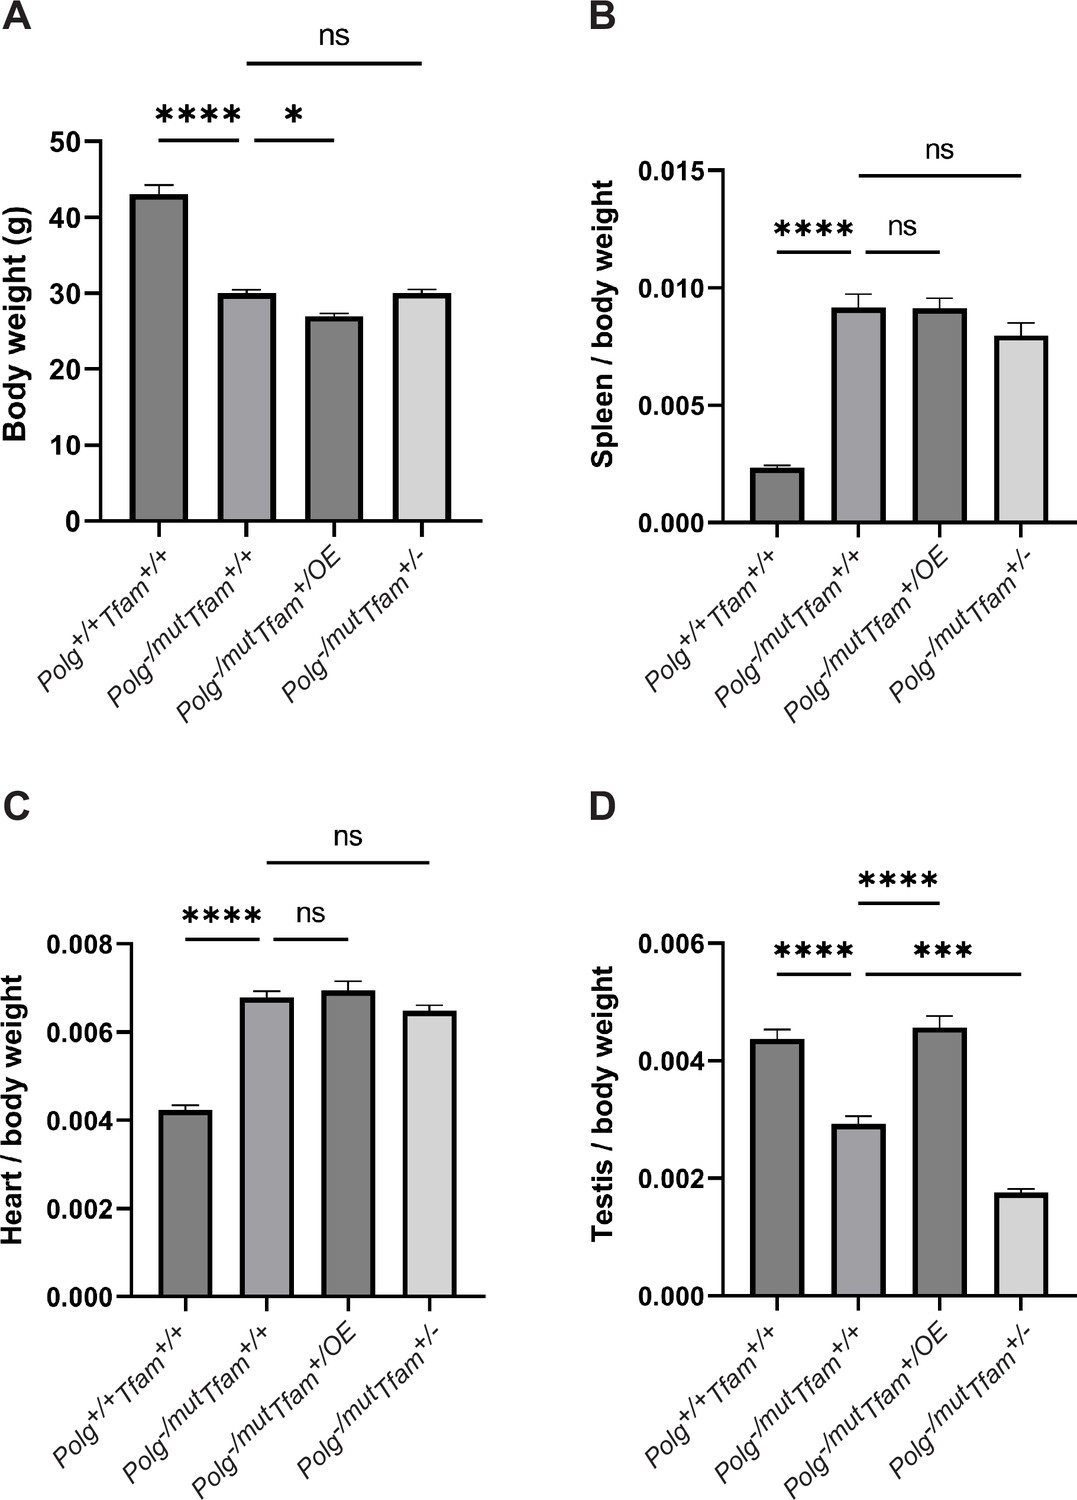
Mitochondrial transcription factor A (TFAM) modulation does not rescue the decreased body weight or the increased spleen/body weight and heart/body weight ratio.
(A) Body weight in g. (B) Spleen to body weight ratio (g/g). (C) Heart to body weight ratio (g/g). (D) Testis to body weight ratio (g/g). n≥7. Data are represented as mean ± SEM; *p<0.05; **p<0.01; ***p<0.001; ns: non-significant.
Figure 1—figure supplement 1
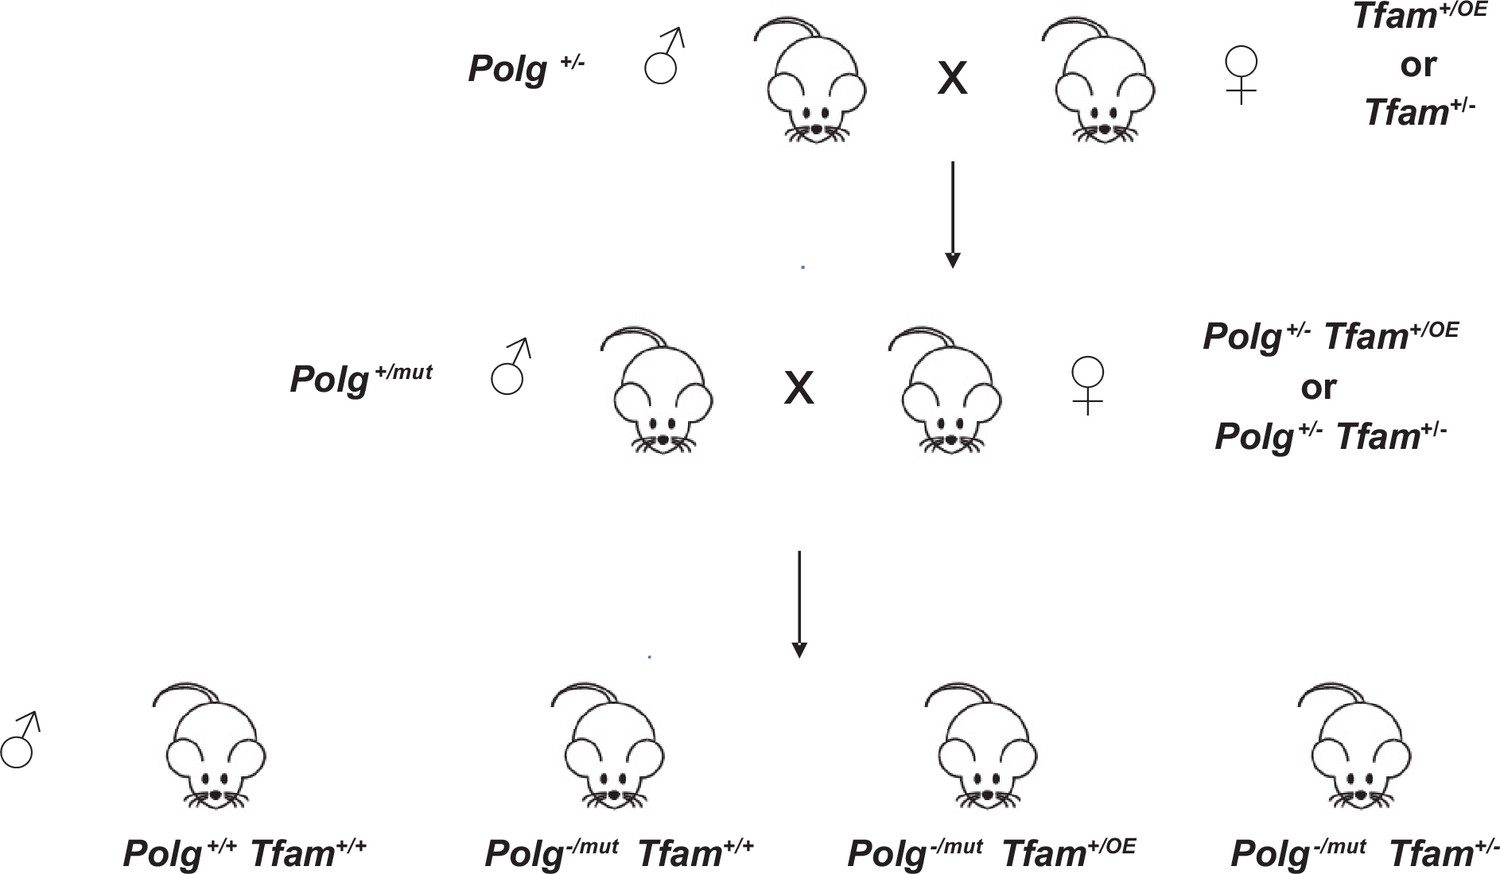
Mating strategy to generate mitochondrial DNA (mtDNA) mutator mice in combination with the Tfam+/OE or Tfam+/- alleles.
Figure 2 with 1 supplement
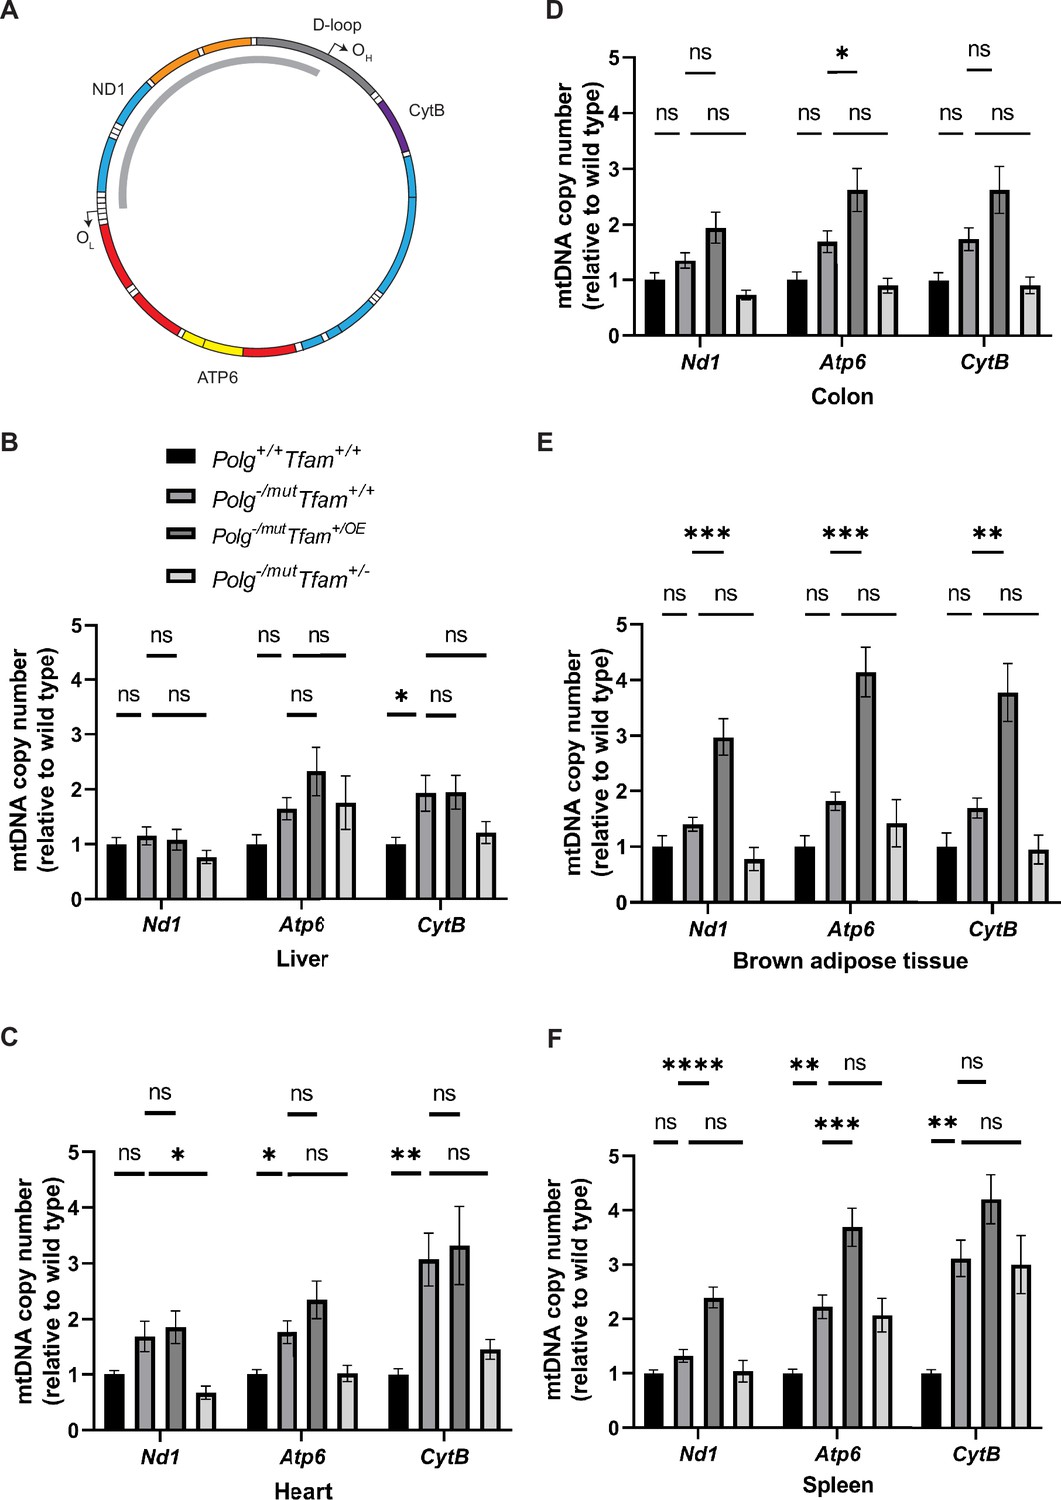
Modulation of mitochondrial transcription factor A (TFAM) expression affects mitochondrial DNA (mtDNA) copy number in a tissue-specific manner.
(A) Schematic of the mtDNA highlighting the position of the probes used for mtDNA copy number analysis by qPCR. The deleted mtDNA region is indicated with a gray arc. (B–F) Relative mtDNA copy number quantification (Nd1/18 S, Atp6/18 S, Cytb/18 S) in (B) liver, (C) heart, (D) colon, (E) brown adipose tissue, and (F) spleen. n≥5. Data are represented as mean ± SEM; *p<0.05; **p<0.01; ***p<0.001; ns: non-significant.
-
Figure 2—source data 1
Excel file containing qPCR data for Figure 2B–F.
- https://cdn.elifesciences.org/articles/104461/elife-104461-fig2-data1-v1.xlsx
Figure 2—figure supplement 1
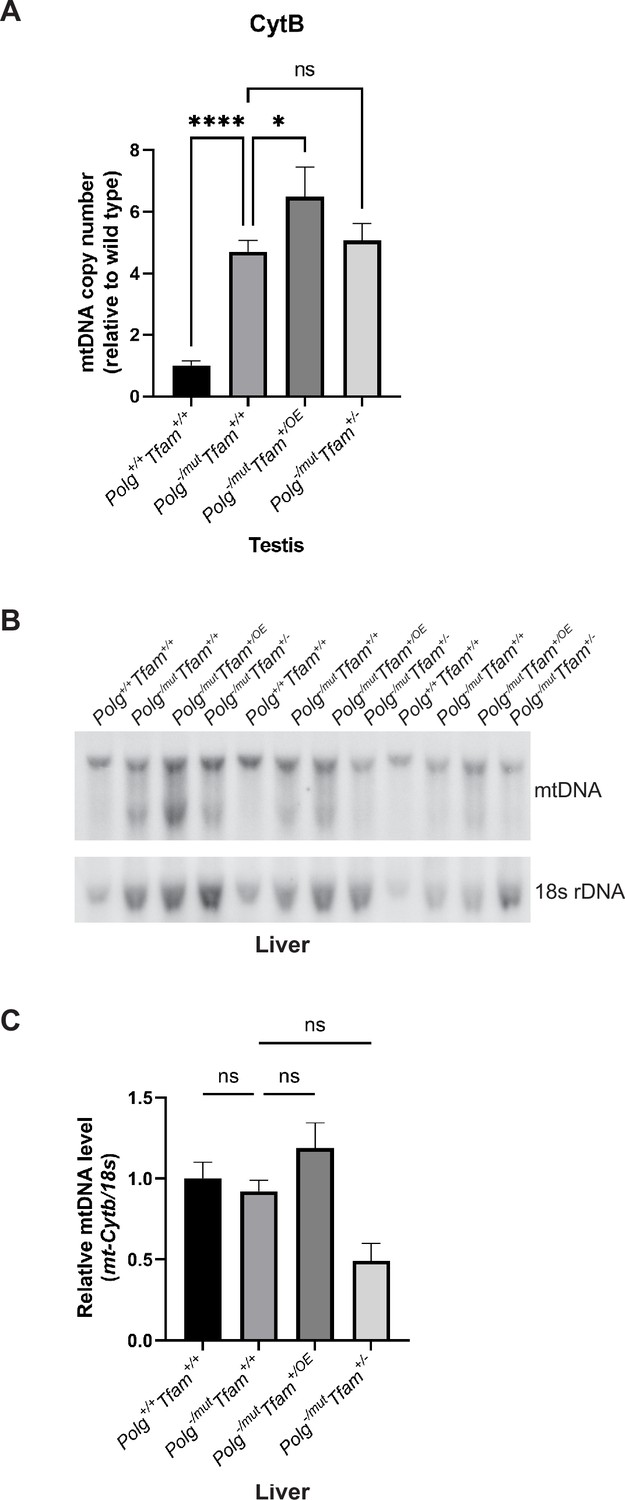
Quantification of mitochondrial DNA (mtDNA) levels by qPCR in testis and by Southern blot analysis in liver.
(A) Relative mtDNA copy number quantification (Cytb/18 S) by qPCR in testis. n≥5. Data are represented as mean ± SEM; *p<0.05; **p<0.01; ***p<0.001; ns: non-significant. (B) Southern blot analysis of SacI-digested DNA derived from the liver. mtDNA was quantified by radiolabeling with a specific probe against Cytochrome b (Cytb), nuclear DNA was probed with a specific probe against 18 S rDNA. (C) Relative Southern blot quantification (mtDNA/18 S rDNA); ns: non-significant.
-
Figure 2—figure supplement 1—source data 1
Excel file containing qPCR data for Figure 2—figure supplement 1A.
- https://cdn.elifesciences.org/articles/104461/elife-104461-fig2-figsupp1-data1-v1.xlsx
-
Figure 2—figure supplement 1—source data 2
Original files of mitochondrial DNA (mtDNA) Southern blot analysis for Figure 2—figure supplement 1B.
- https://cdn.elifesciences.org/articles/104461/elife-104461-fig2-figsupp1-data2-v1.zip
-
Figure 2—figure supplement 1—source data 3
Original files of 18 S rDNA Southern blot analysis for Figure 2—figure supplement 1B.
- https://cdn.elifesciences.org/articles/104461/elife-104461-fig2-figsupp1-data3-v1.zip
-
Figure 2—figure supplement 1—source data 4
PDF file containing Southern blot analysis for Figure 2—figure supplement 1B, indicating relevant bands.
- https://cdn.elifesciences.org/articles/104461/elife-104461-fig2-figsupp1-data4-v1.pdf
Figure 3
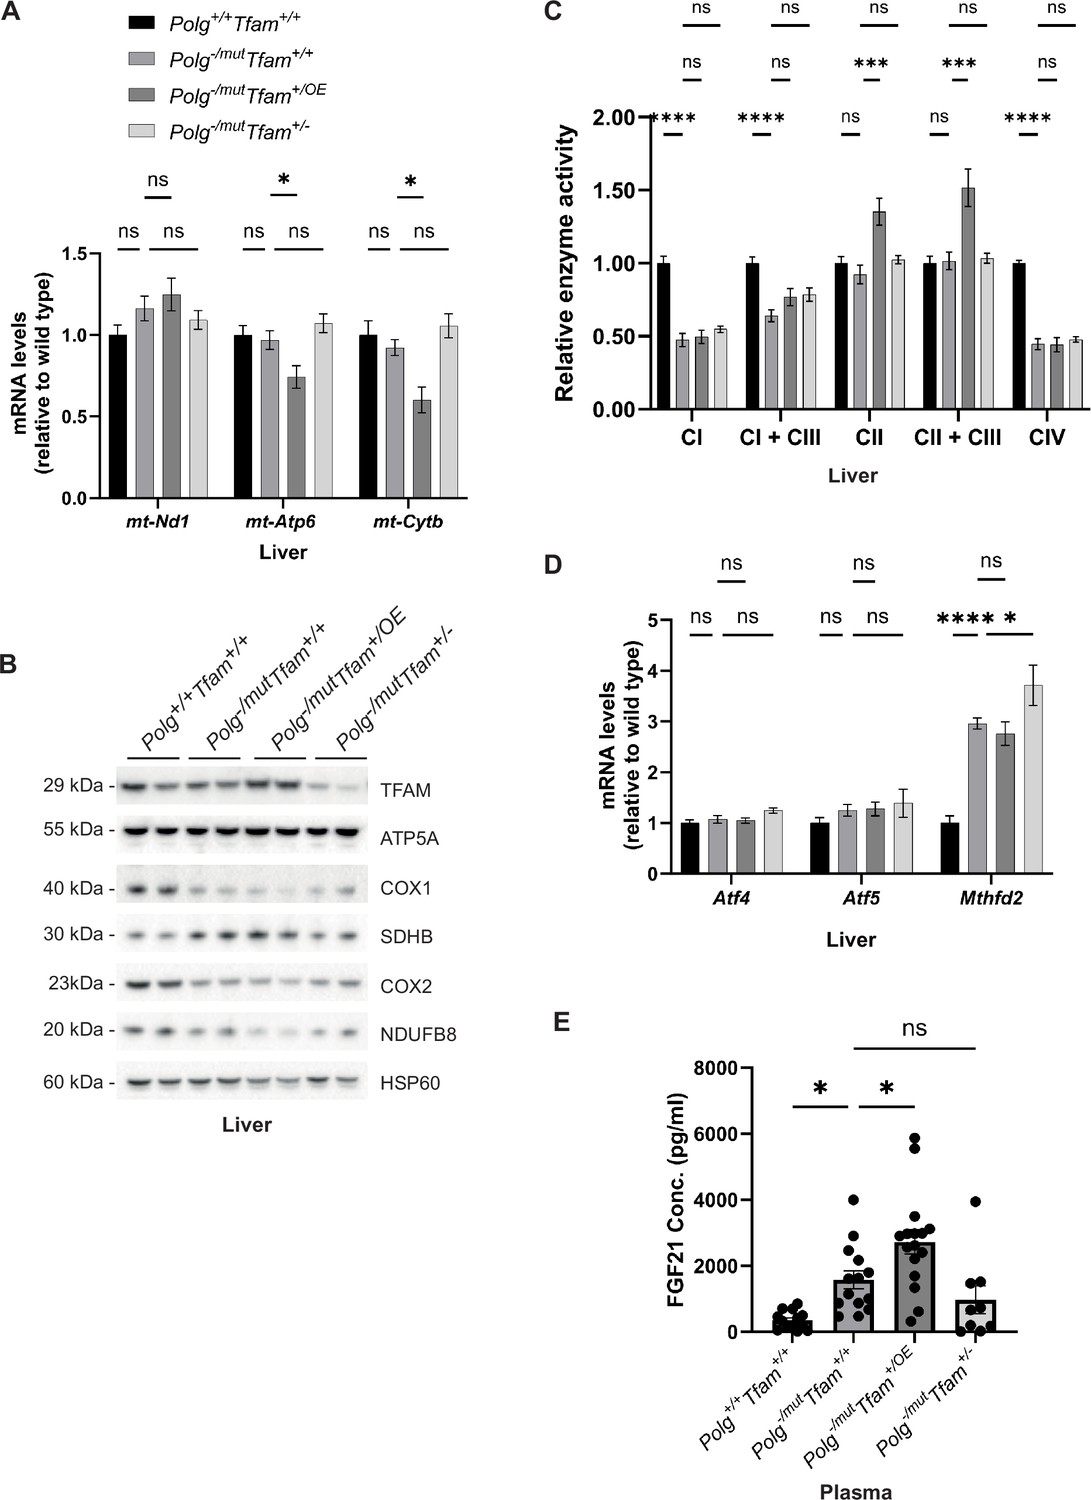
Moderate mitochondrial transcription factor A (TFAM) overexpression negatively impacts mitochondrial DNA (mtDNA) gene expression and tissue physiology in liver and correlates with increased fibroblast growth factor 21 (FGF21) levels.
(A) Relative expression levels of mtDNA-encoded transcripts (Nd1/β-actin, Atp6/β-actin, Cytb/β-actin) measured by RT-qPCR in liver. n≥7. Data are represented as mean ± SEM; *p<0.05; **p<0.01; ***p<0.001; ns: non-significant. (B) Western blot analysis of steady-state levels of mitochondrial proteins in liver. (C) Relative enzyme activities of oxidative phosphorylation (OXPHOS) complexes measured by spectrophotometry in liver mitochondria. n≥6 Data are represented as means ± SEM; *p<0.05; **p<0.01; **p<0.01; ***p<0.001; ns: non-significant. (D) Relative expression levels of mitochondrial stress markers (Atf4/β-actin, Atf5/β-actin, Mthfd2/β-actin) measured by RT-qPCR in liver. n≥7. Data are represented as means ± SEM; *p<0.05; **p<0.01; ***p<0.001, ns: non-significant (E) Quantification of FGF21 levels in plasma measured by ELISA. n ≥ 9. Data are represented as means ± SEM; *p<0.05; **p<0.01; ***p<0.001; ns: non-significant.
-
Figure 3—source data 1
Excel file containing qPCR data for Figure 3A, D and E.
- https://cdn.elifesciences.org/articles/104461/elife-104461-fig3-data1-v1.xlsx
-
Figure 3—source data 2
Original files of Western blot analysis for Figure 3B.
- https://cdn.elifesciences.org/articles/104461/elife-104461-fig3-data2-v1.zip
-
Figure 3—source data 3
PDF file containing Western blot analysis for Figure 3B, indicating relevant bands.
- https://cdn.elifesciences.org/articles/104461/elife-104461-fig3-data3-v1.pdf
Figure 4
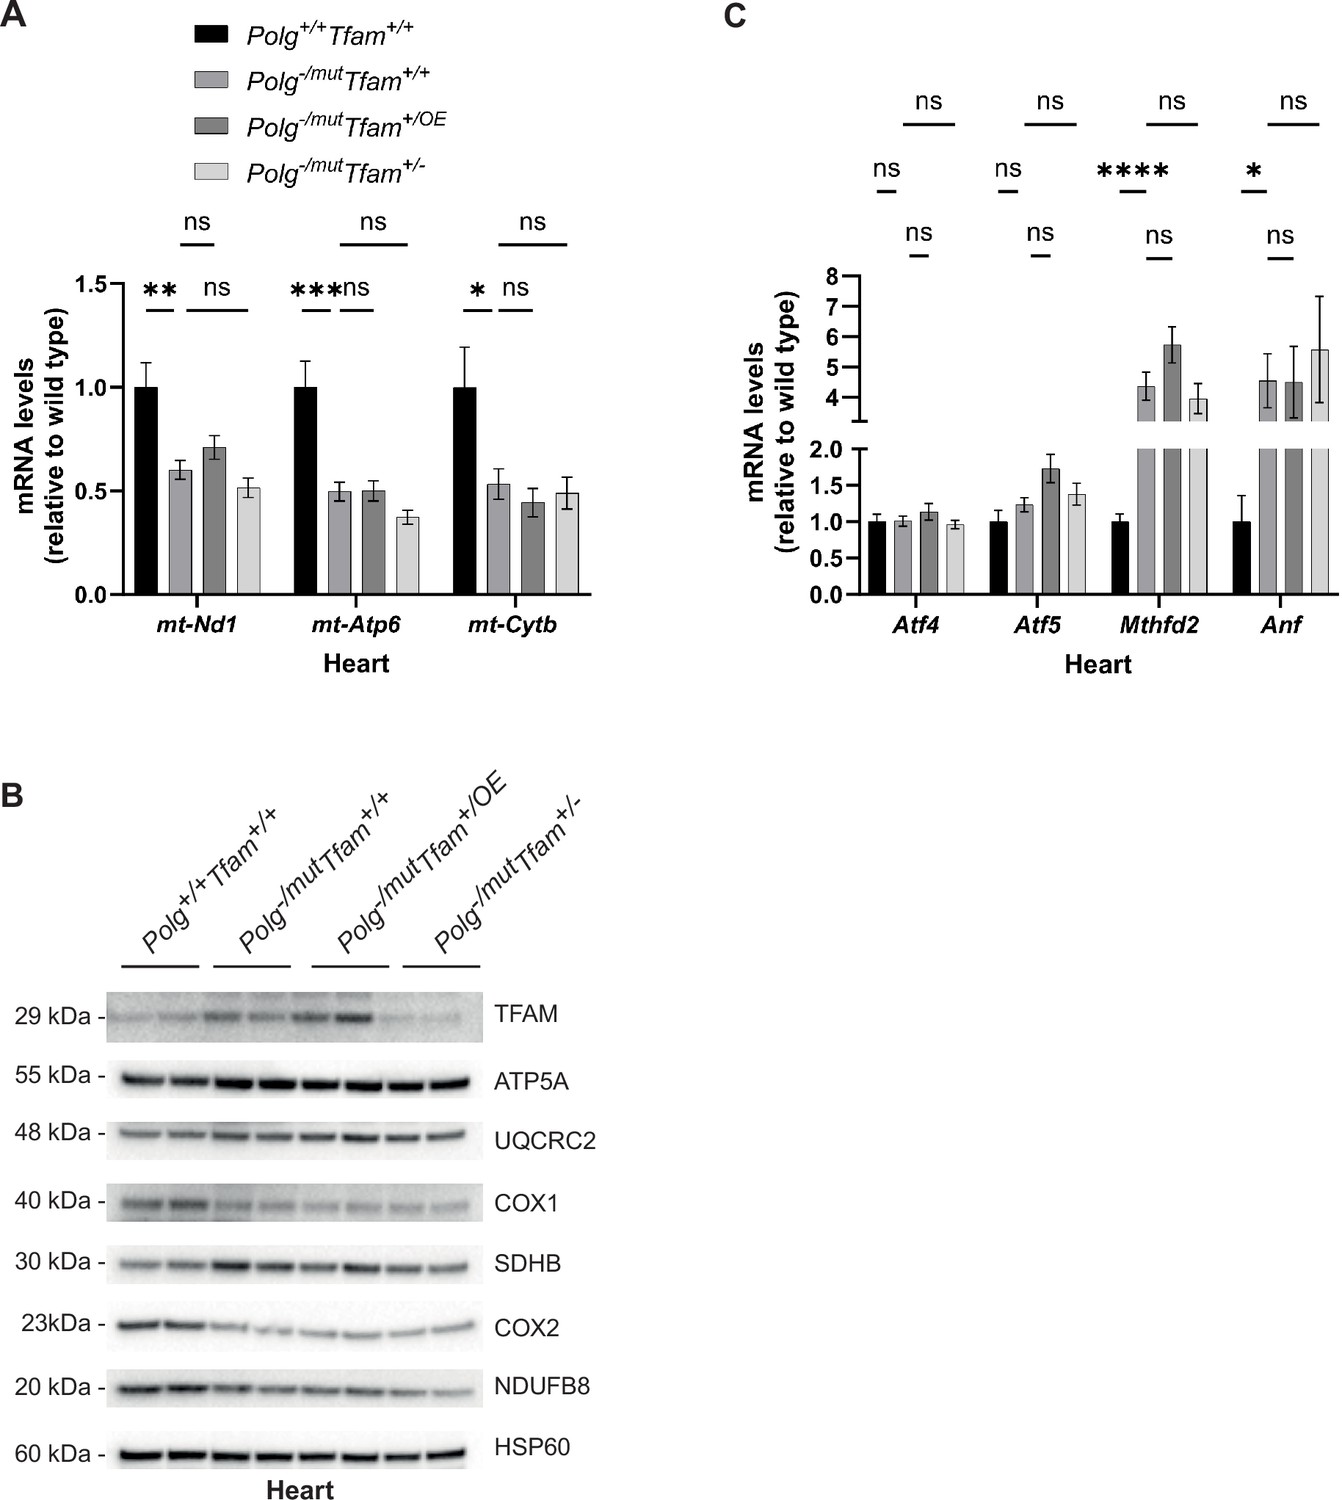
Alteration of mitochondrial transcription factor A (TFAM) expression does not affect the heart phenotype of mitochondrial DNA (mtDNA) mutator mice.
(A) Relative expression levels of mtDNA-encoded transcripts (Nd1/β-actin, Atp6/β-actin, Cytb/β-actin) measured by RT-qPCR in heart. n ≥ 7. Data are represented as mean ± SEM; *p<0.05; **p<0.01; ***p<0.001; ns: non-significant. (B) Western blot analysis of steady-state levels of mitochondrial proteins in heart. (C) Relative expression levels of mitochondrial stress markers (Atf4/β-actin, Atf5/β-actin, Mthfd2/β-actin, Nppa/β-actin) measured by RT-qPCR in heart. n ≥ 7. Data are represented as mean ± SEM; *p<0.05; **p<0.01; ***p<0.001; ns: non-significant.
-
Figure 4—source data 1
Excel file containing qPCR data for Figure 4A and C.
- https://cdn.elifesciences.org/articles/104461/elife-104461-fig4-data1-v1.xlsx
-
Figure 4—source data 2
Original files of Western blot analysis for Figure 4B.
- https://cdn.elifesciences.org/articles/104461/elife-104461-fig4-data2-v1.zip
-
Figure 4—source data 3
PDF file containing Western blot analysis for Figure 4B, indicating relevant bands.
- https://cdn.elifesciences.org/articles/104461/elife-104461-fig4-data3-v1.pdf
Figure 5
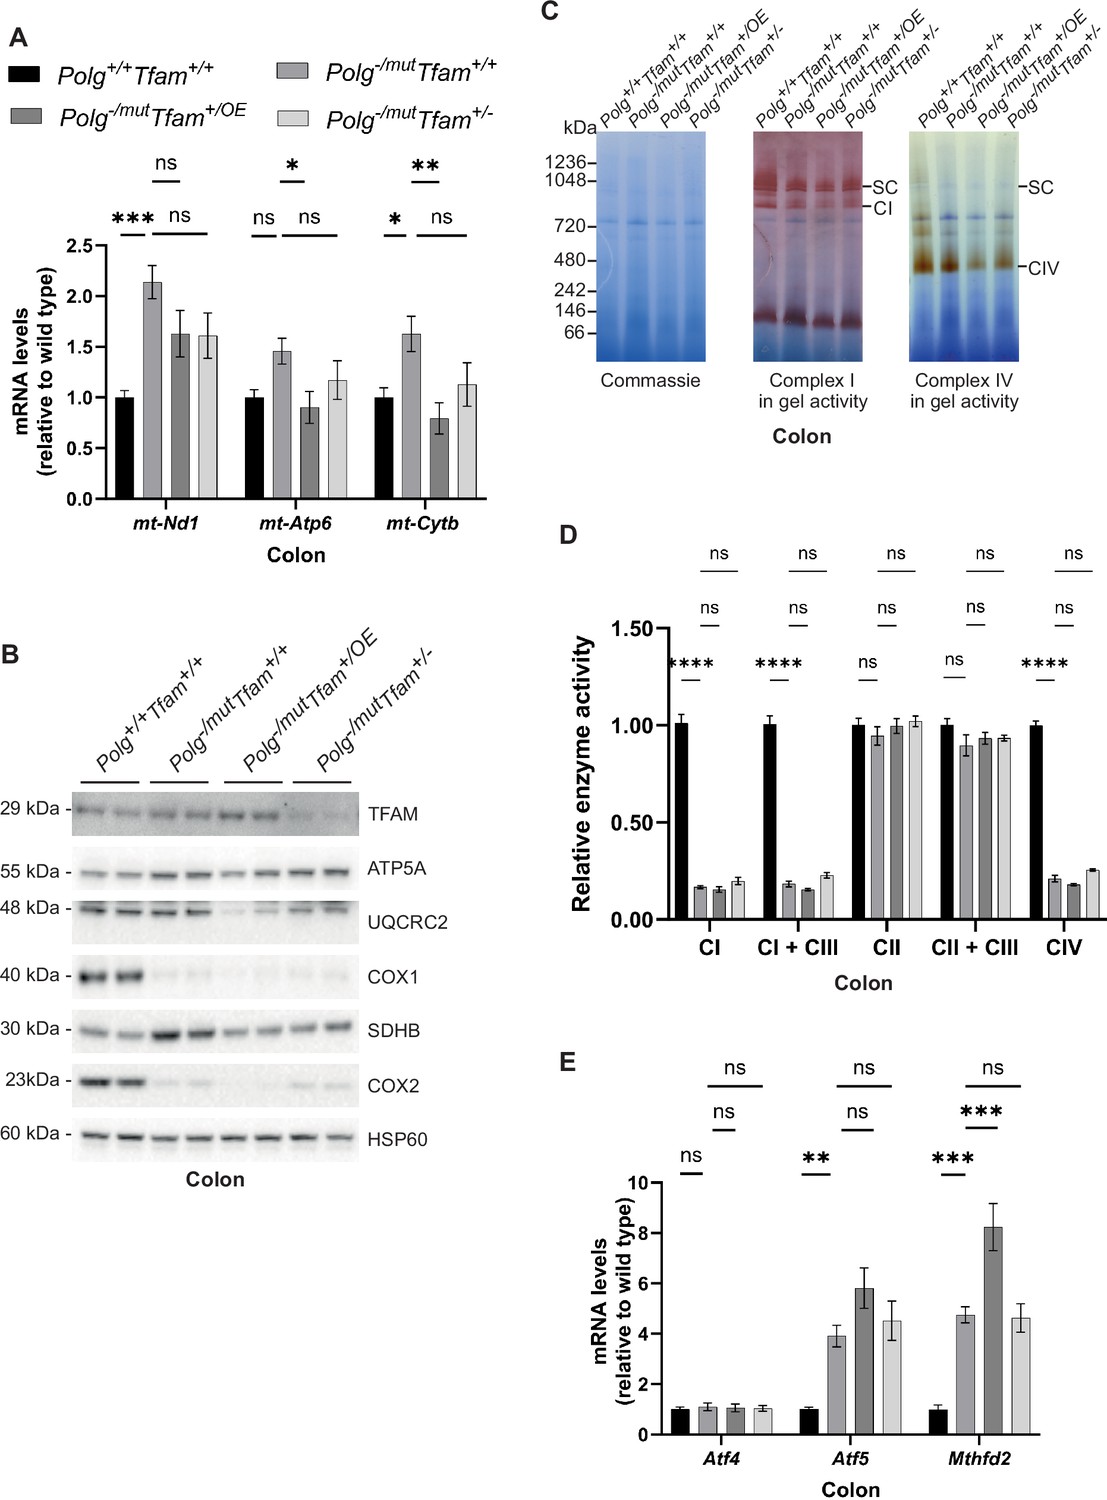
Increased mitochondrial transcription factor A (TFAM) levels do not rescue the reduced oxidative phosphorylation (OXPHOS) function in the colon of mitochondrial DNA (mtDNA) mutator mice.
(A) Relative expression levels of mtDNA-encoded transcripts (Nd1/β-actin, Atp6/β-actin, Cytb/β-actin) measured by RT-qPCR in colon. n≥7. Data are represented as mean ± SEM; *p<0.05; **p<0.01; ***p<0.001; ns: non-significant. (B) Western blot analysis of steady-state levels of mitochondrial proteins in colon. (C) BN-PAGE and in-gel activities of complex I and complex IV activities in mitochondrial protein extracts from mouse colon. Coomassie staining of the gel is shown to indicate equal loading. SC, Supercomplexes. (D) Relative enzyme activities of OXPHOS complexes measured by spectrophotometry in colon mitochondria. n≥3. Data are represented as mean ± SEM; *p<0.05; **p<0.01; ***p<0.001; ns: non-significant. (E) Relative expression levels of mitochondrial stress markers (Atf4/β-actin, Atf5/β-actin, Mthfd2/β-actin) measured by RT-qPCR in colon. n≥9. Data are represented as mean ± SEM; *p<0.05; **p<0.01; ***p<0.001; ns: non-significant.
-
Figure 5—source data 1
Excel file containing qPCR data for Figure 5A and E.
- https://cdn.elifesciences.org/articles/104461/elife-104461-fig5-data1-v1.xlsx
-
Figure 5—source data 2
Original files of Western blot analysis for Figure 5B.
- https://cdn.elifesciences.org/articles/104461/elife-104461-fig5-data2-v1.zip
-
Figure 5—source data 3
Original files of BN-PAGE analysis for Figure 5C.
- https://cdn.elifesciences.org/articles/104461/elife-104461-fig5-data3-v1.zip
-
Figure 5—source data 4
PDF file containing Western blot analysis for Figure 5B, indicating relevant bands.
- https://cdn.elifesciences.org/articles/104461/elife-104461-fig5-data4-v1.pdf
-
Figure 5—source data 5
PDF file containing BN-PAGE analysis for Figure 5C, indicating relevant bands.
- https://cdn.elifesciences.org/articles/104461/elife-104461-fig5-data5-v1.pdf
Figure 6
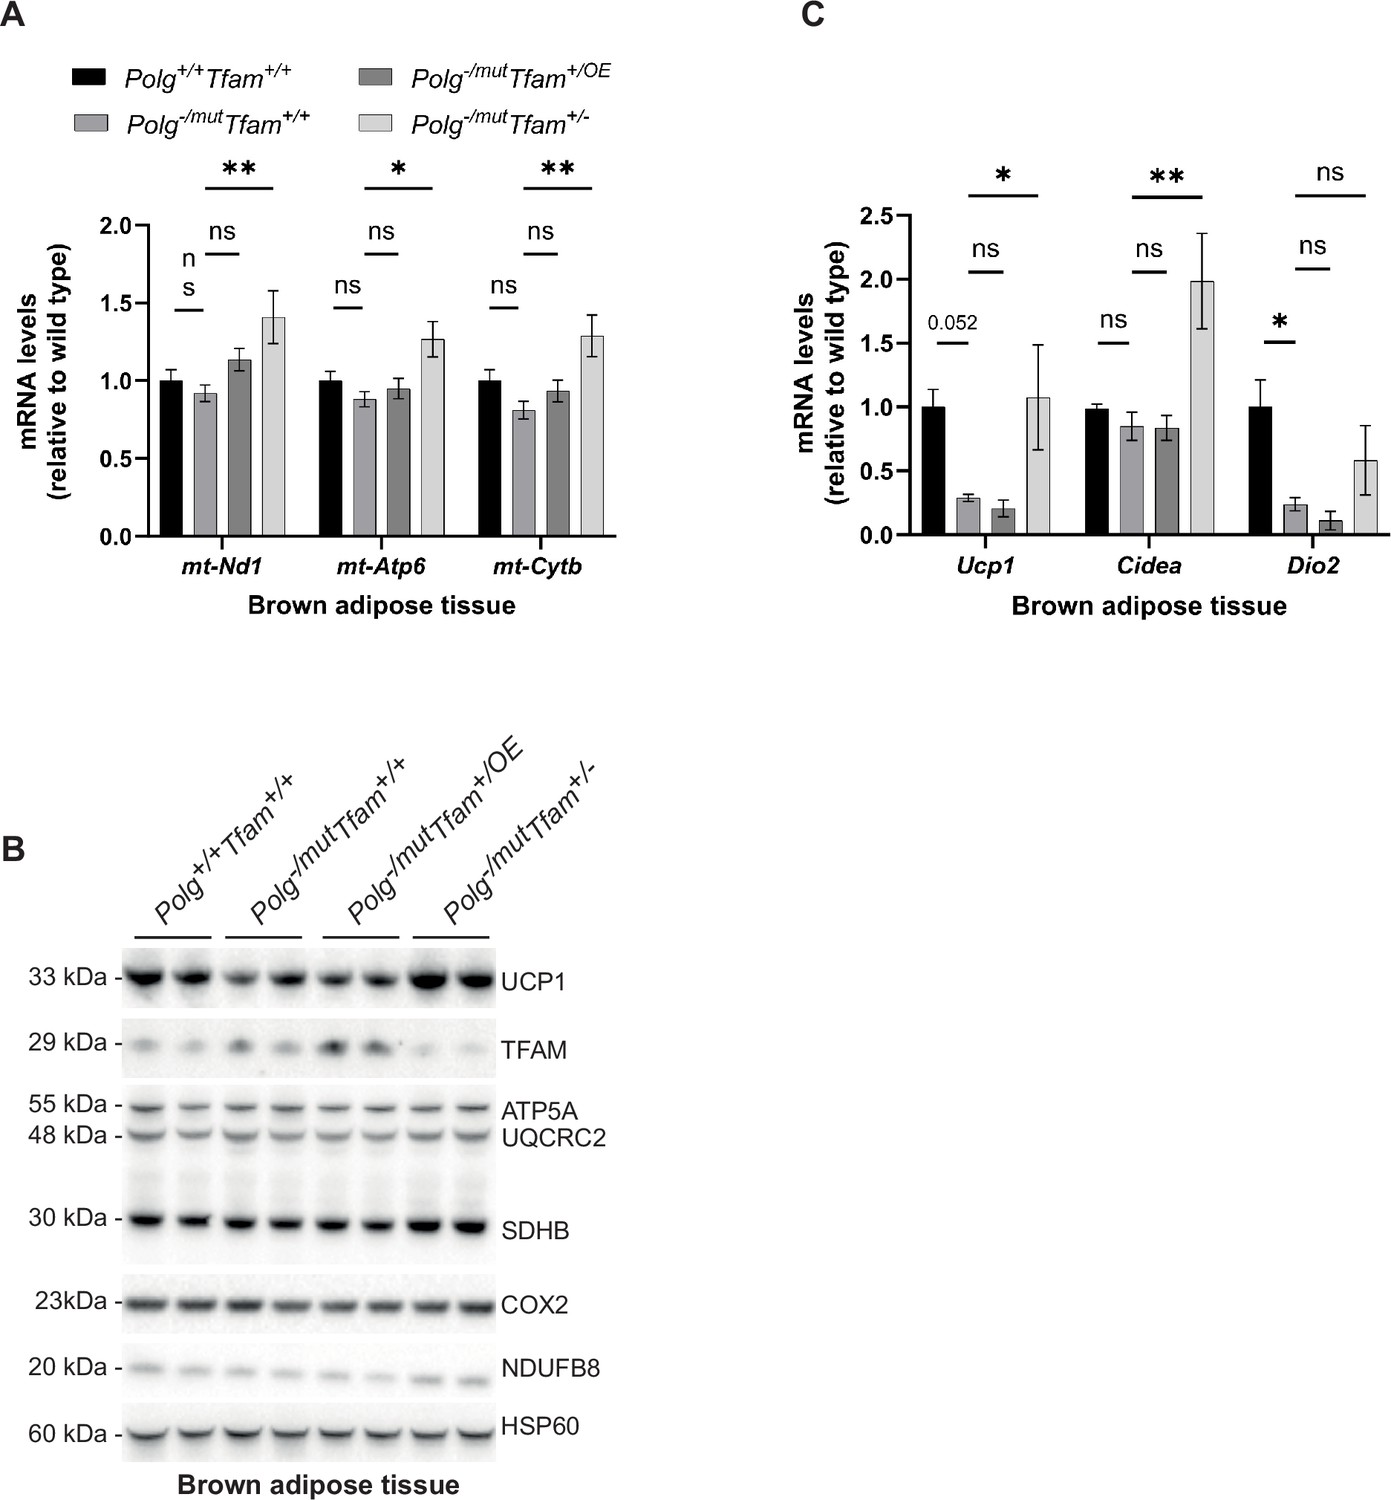
Reduction of mitochondrial transcription factor A (TFAM) levels in brown adipose tissue has beneficial effects.
(A) Relative expression levels of mitochondrial DNA (mtDNA)-encoded transcripts (Nd1/β-actin, Atp6/β-actin, Cytb/β-actin) measured by RT-qPCR in brown adipose tissue (BAT). n≥5. Data are represented as mean ± SEM; *p<0.05; **p<0.01; ***p<0.001; ns: non-significant. (B) Western blot analysis of steady-state levels of UCP1 and mitochondrial proteins in BAT. (C) Relative expression levels of brown adipose stress markers (Ucp1/β-actin, Cidea/β-actin, Dio2/β-actin) measured by RT-qPCR in BAT. n≥5. Data are represented as mean ± SEM; *p<0.05; **p<0.01; ***p<0.001; ns: non-significant.
-
Figure 6—source data 1
Excel file containing qPCR data for Figure 6A and C.
- https://cdn.elifesciences.org/articles/104461/elife-104461-fig6-data1-v1.xlsx
-
Figure 6—source data 2
Original files of Western blot analysis for Figure 6B.
- https://cdn.elifesciences.org/articles/104461/elife-104461-fig6-data2-v1.zip
-
Figure 6—source data 3
PDF file containing Western blot analysis for Figure 6B, indicating relevant bands.
- https://cdn.elifesciences.org/articles/104461/elife-104461-fig6-data3-v1.pdf
Figure 7 with 2 supplements
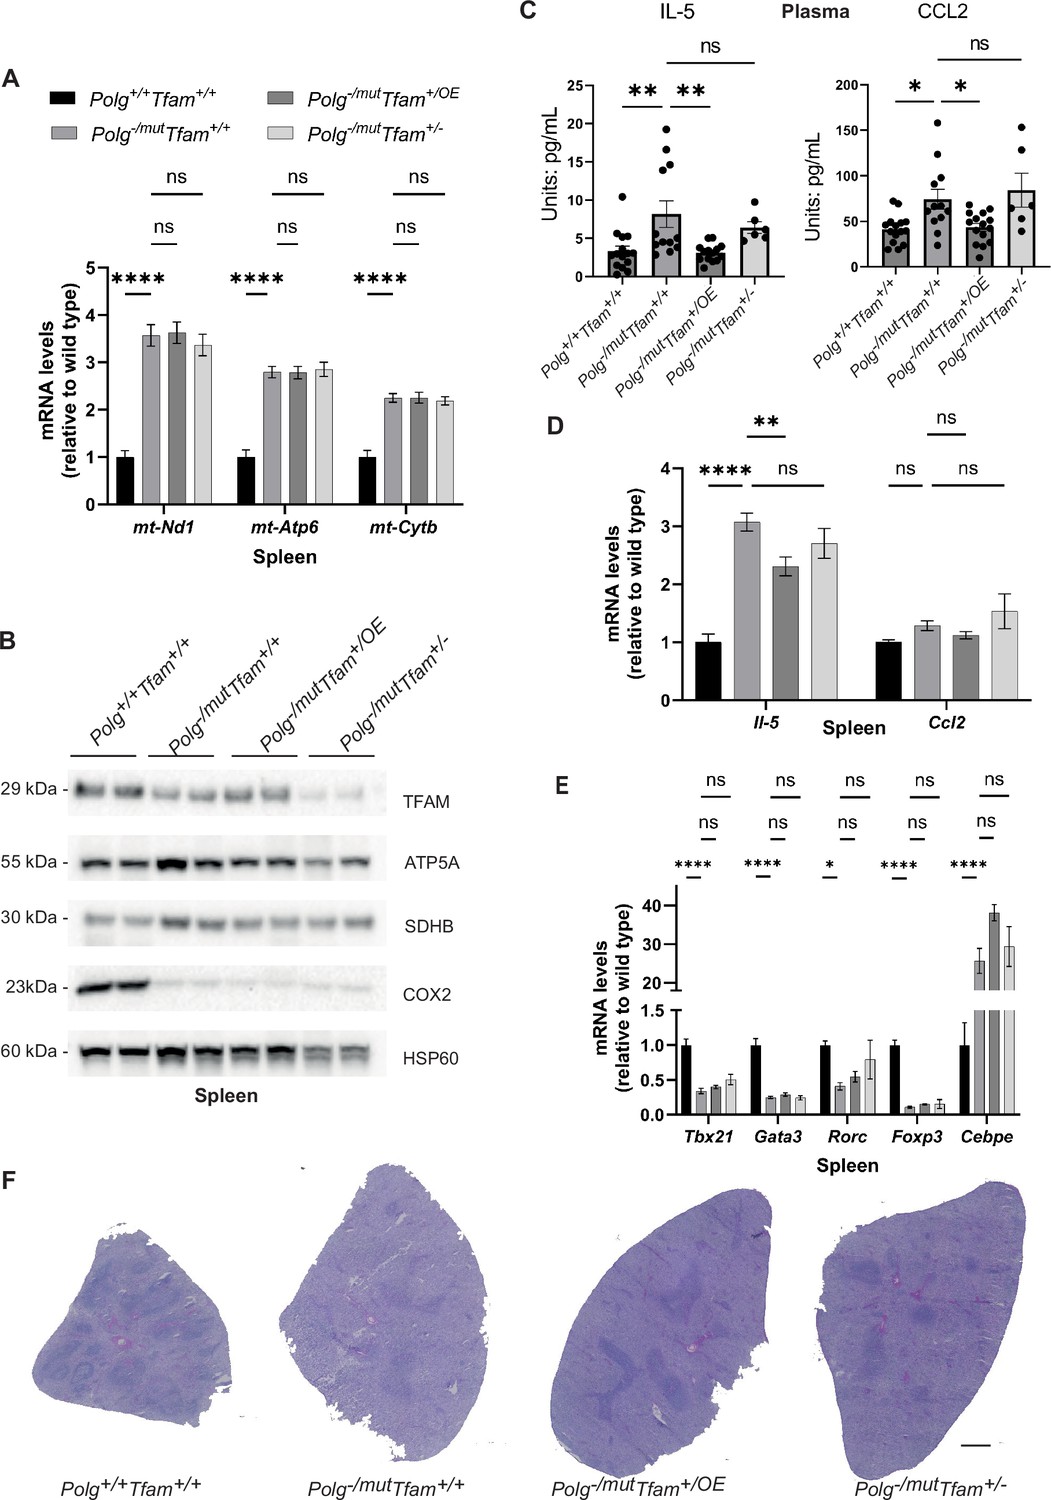
Mitochondrial transcription factor A (TFAM) overexpression restores IL-5 and Chemokine Ligand 2 (CCL2) cytokine levels in the spleen of mitochondrial DNA (mtDNA) mutator mice.
(A) Relative expression levels of mtDNA-encoded transcripts (Nd1/β-actin, Atp6/β-actin, Cytb/β-actin) measured by RT-qPCR in spleen. n≥5. Data are represented as mean ± SEM; *p<0.05; **p<0.01; ***p<0.001; ns: non-significant. (B) Western blot analysis of steady-state levels of mitochondrial proteins in spleen. (C) Quantification of IL-5 and CCL2 cytokine levels in plasma measured by the Mouse Cytokine/Chemokine 44-Plex Discovery Assay. n≥6. Data are represented as mean ± SEM; *p<0.05; **p<0.01; ***p<0.001; ns: non-significant. (D) Quantification of Il-5 and Ccl2 cytokine transcript levels in spleen measured by RT-qPCR. n≥10. Data are represented as mean ± SEM; *p<0.05; **p<0.01; ***p<0.001; ns: non-significant. (E) Relative expression levels of immune cell markers (Tbx21/β-actin, Gata3/β-actin, Rorc/β-actin, Foxp3/β-actin, Cebpe/β-actin) for analyzing immune cell populations measured by RT-qPCR in spleen. n≥5. Data are represented as mean ± SEM; *p<0.05; **p<0.01; ***p<0.001; ns: non-significant. (F) H&E staining of spleen sections. Scale bar: 500 µm.
-
Figure 7—source data 1
Excel file containing qPCR data for Figure 7A, C, D and E.
- https://cdn.elifesciences.org/articles/104461/elife-104461-fig7-data1-v1.xlsx
-
Figure 7—source data 2
Original files of Western blot analysis for Figure 7B.
- https://cdn.elifesciences.org/articles/104461/elife-104461-fig7-data2-v1.zip
-
Figure 7—source data 3
PDF file containing Western blot analysis for Figure 7B, indicating relevant bands.
- https://cdn.elifesciences.org/articles/104461/elife-104461-fig7-data3-v1.pdf
Figure 7—figure supplement 1
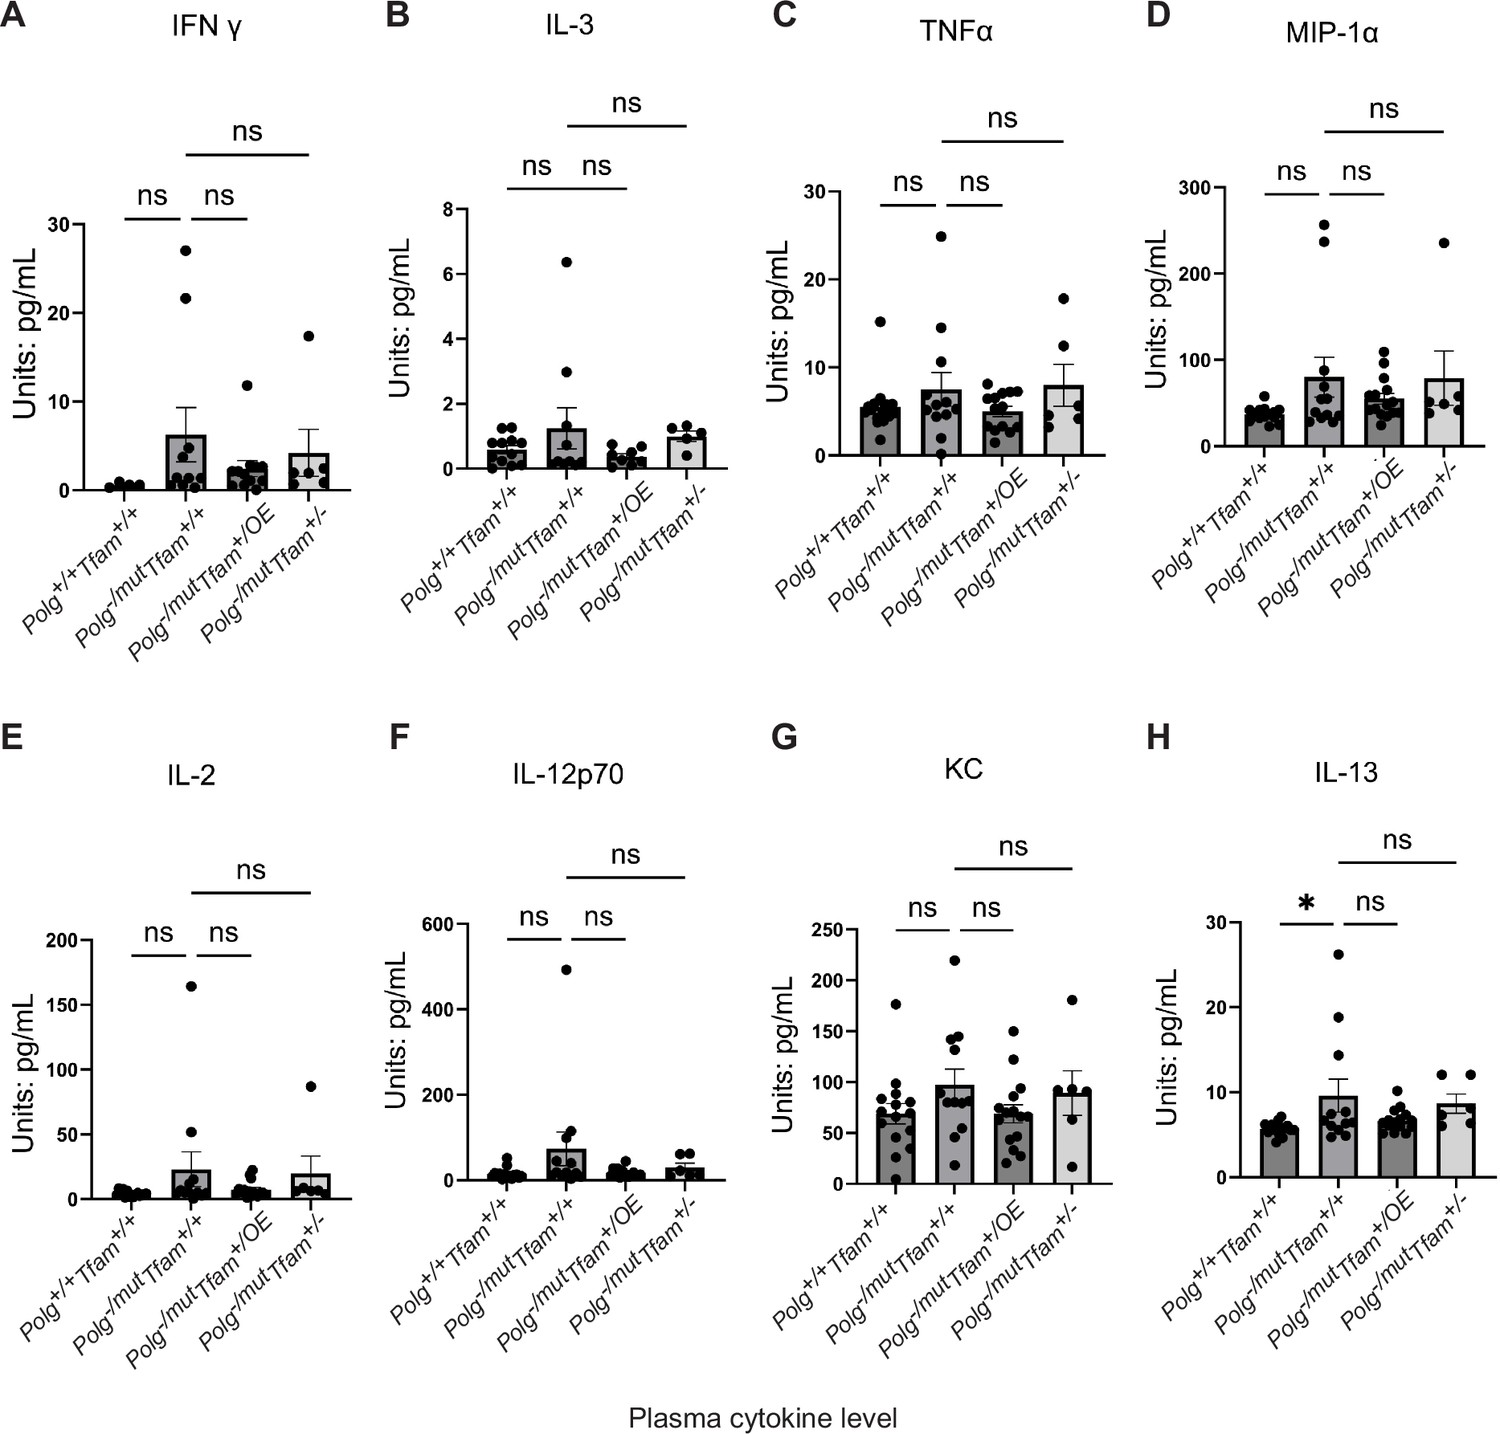
Cytokine quantification in plasma measured by the Mouse Cytokine/Chemokine 44-Plex Discovery Assay.
(A) Interferon Gamma (IFNγ). (B) Interleukin 3 (IL-3). (C) Tumor Necrosis Factor Alpha (TNFα). (D) Macrophage Inflammatory Protein-1 Alpha (MIP-1α). (E) Interleukin 2 (IL-2). (F) Interleukin 12p70 (IL-12p70). (G) C-X-C Motif Chemokine Ligand 1 (KC). (H) Interleukin 13 (IL-13). n≥6. Data are represented as mean ± SEM; *p<0.05; **p<0.01; ***p<0.001; ns: non-significant.
-
Figure 7—figure supplement 1—source data 1
Excel file containing Cytokine quantification data for Figure 7—figure supplement 1.
- https://cdn.elifesciences.org/articles/104461/elife-104461-fig7-figsupp1-data1-v1.xlsx
Figure 7—figure supplement 2
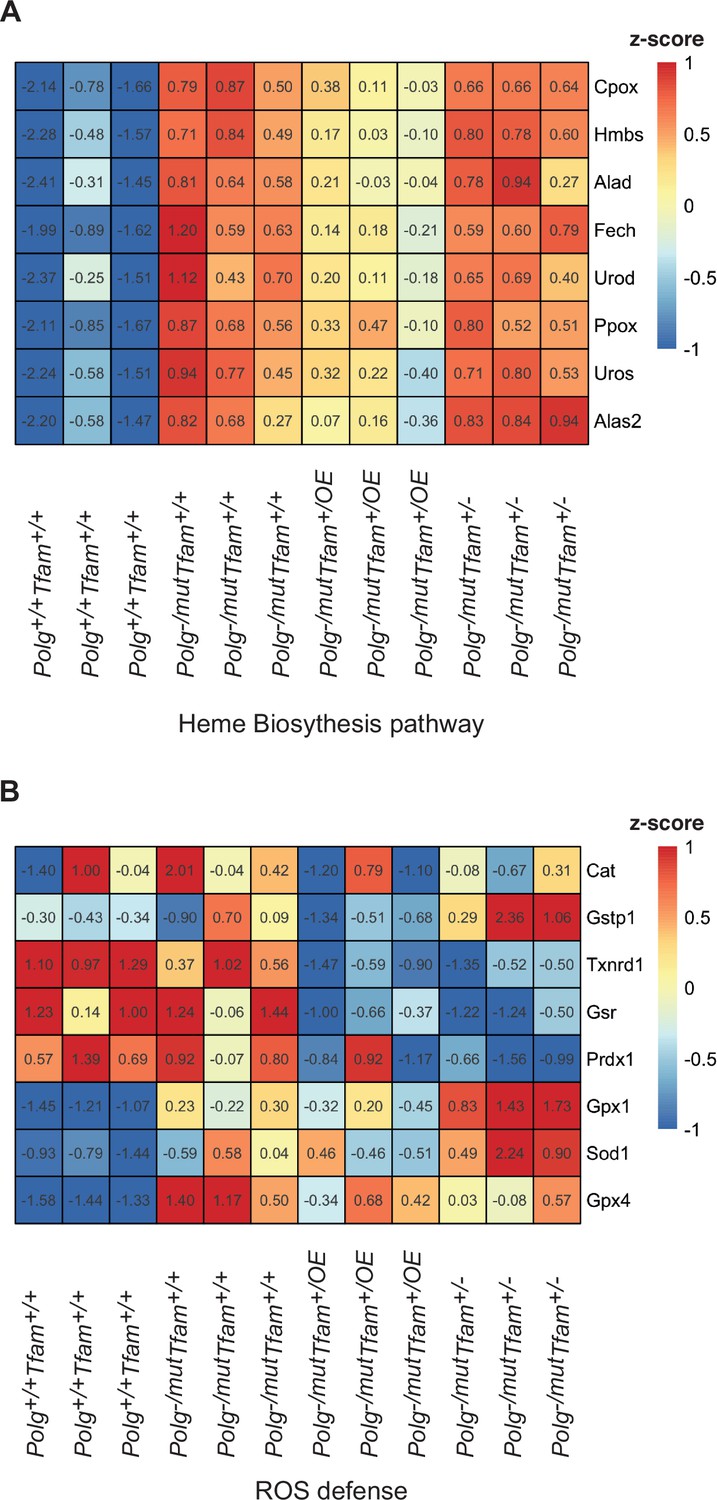
Differential expression analysis of quantitative proteomic data from the spleen.
(A) Heatmap of proteins involved in the heme biosynthesis pathway. (B) Heatmap of proteins involved in reactive oxygen species (ROS) defense. Color indicates the z-score.
Tables
Table 1
Relative mitochondrial transcription factor A (TFAM)-to-mitochondrial DNA (mtDNA) ratios in different tissues.
The TFAM-to-mtDNA ratio was calculated from normalized TFAM protein levels (n=2) and normalized mtDNA levels (n=5) as determined by the mt-Nd1 probe. The respective values for the normalized TFAM and mtDNA levels are indicated in parentheses. BAT: brown adipose tissue.
| Polg+/+Tfam+/+ | Polg-/mutTfam+/+ | Polg-/mutTfam+/OE | Polg-/mut Tfam+/- | |
|---|---|---|---|---|
| Liver | 1.00 | 0.86 (0.99:1.15) | 2.14 (2.32:1.08) | 0.48 (0.37:0.77) |
| Heart | 1.00 | 1.31 (2.21:1.69) | 1.93 (3.59:1.86) | 1.24 (0.83:0.67) |
| Colon | 1.00 | 1.19 (1.62:1.35) | 1.01 (1.96:1.95) | 0.61 (0.44:0.73) |
| BAT | 1.00 | 0.95 (1.33:1.40) | 1.09 (3.23:2.97) | 0.67 (0.52:0.78) |
| Spleen | 1.00 | 0.32 (0.42:1.32) | 0.28 (0.66:2.39) | 0.19 (0.20:1.04) |
Key resources table
| Reagent type (species) or resource | Designation | Source or reference | Identifiers | Additional information |
|---|---|---|---|---|
| Genetic reagent (M. musculus) | Mouse: Polg+/mut | Trifunovic et al., 2004 | NA | |
| Genetic reagent (M. musculus) | Mouse: Polg+/- | Hance et al., 2005 | NA | |
| Genetic reagent (M. musculus) | Mouse: Tfam+/OE | Jiang et al., 2017 | NA | |
| Genetic reagent (M. musculus) | Mouse: Tfam+/- | Larsson et al., 1998 | NA | |
| Antibody | Anti-HSP60 antibody | Enzo Lifesciences | AB1-SPA-807-E | WB |
| Antibody | Total OXPHOS Rodent WB Antibody Cocktail | Abcam | ab110413 | WB |
| Antibody | Anti-TFAM antibody | Abcam | ab131607 | WB |
| Antibody | Anti-UCP1 antibody | Abcam | ab209483 | WB |
| Antibody | Anti-COX2 antibody | home made | This study | WB |
| Commercial assay or kit | Fibroblast Growth Factor 21 Mouse/Rat ELISA | BioVendor | UNQ3115/PRO10196 | |
| Commercial assay or kit | Mouse Cytokine/Chemokine 44-Plex Discovery Assay Array | Eve Technologies | MD44 | |
| Software, algorithm | Prism 9 | Graph Pad | https://www.graphpad.com/ | |
| Software, algorithm | Image J | NIH | https://imagej.net/ij/ | |
| Software, algorithm | Adobe Photoshop 2020 | Adobe | https://www.adobe.com/home | |
| Software, algorithm | Adobe Illustrator 2020 | Adobe | https://www.adobe.com/home | |
| Software, algorithm | Proteome Discoverer v2.4 | Thermo Fisher Scientific | https://www.thermofisher.com/de/de/home/industrial/mass-spectrometry/liquid-chromatography-mass-spectrometry-lc-ms/lc-ms-software/multi-omics-data-analysis/proteome-discoverer-software.html | |
| Software, algorithm | R (4.1.0) | R project | https://www.r-project.org/ | |
| Other | Mass spectrometry proteomics data | This paper | ProteomeXchange Consortium (PRIDE partner repository): PXD054598 |
Additional files
Download links
A two-part list of links to download the article, or parts of the article, in various formats.
Downloads (link to download the article as PDF)
Open citations (links to open the citations from this article in various online reference manager services)
Cite this article (links to download the citations from this article in formats compatible with various reference manager tools)
Tissue-specific responses to TFAM and mtDNA copy number manipulation in prematurely ageing mice
eLife 14:RP104461.
https://doi.org/10.7554/eLife.104461.3


