Synergistic effect of inhibiting CHK2 and DNA replication on cancer cell growth
- Institut de Génétique Humaine, Univ. de Montpellier, CNRS, France
- ‘Maintenance of Genome Integrity during DNA replication’ laboratory, équipe labélisée Ligue contre le Cancer, France
- Agricultural Biotechnology Research Center, Academia Sinica, Taiwan
- Ph.D. Program in Medical Biotechnology, College of Medical Science and Technology, Taipei Medical University, Taiwan
- National Research Institute of Chinese Medicine, Ministry of Health and Welfare, Taiwan
- ‘Genome Surveillance and Stability’ Laboratory, IGH, Univ. de Montpellier, CNRS, France
- ‘Normal and Malignant B cells’ laboratory', IGH, Univ. de Montpellier, CNRS, France
- IRCM, Institut de Recherche en Cancérologie de Montpellier, INSERM U1194, Université de Montpellier, Institut régional du Cancer de Montpellier, France
- Institut Universitaire de France, France
- Department of Biological Hematology, CHU Montpellier, France
- Graduate Institute of Integrated Medicine, China Medical University, Taiwan
- Department of Life Sciences, National Chung-Hsing University, Taiwan
Figures
Figure 1 with 1 supplement

Isobavachalcone (IBC) and bakuchiol (BKC) synergistically inhibit proliferation of cancer cell lines.
(A) Chemical structures of IBC and BKC. (B) BJ, MCF-7, and A549 cells were treated with DMSO, 25 μg/ml crude extract (PR7), 15 μM IBC, 40 μM BKC, or the combination 15 μM IBC and 40 μM BKC for 72 hr. These concentrations were used throughout the study. Cell number was quantified by using the WST-1 assay. Data are means ± SD of three independent experiments. The p-values were calculated using two-tailed unpaired t-test. (C) Concentration matrix analyses of a panel of eight cancer cell lines treated with IBC and BKC at the indicated doses for 72 hr. Cell viability was measured by using the sulforhodamine B colorimetric assay. Antagonist combinations (green), synergistic combinations (red), and additive effects (black) were calculated. A representative analysis of three independent experiments is shown.
Figure 1—figure supplement 1
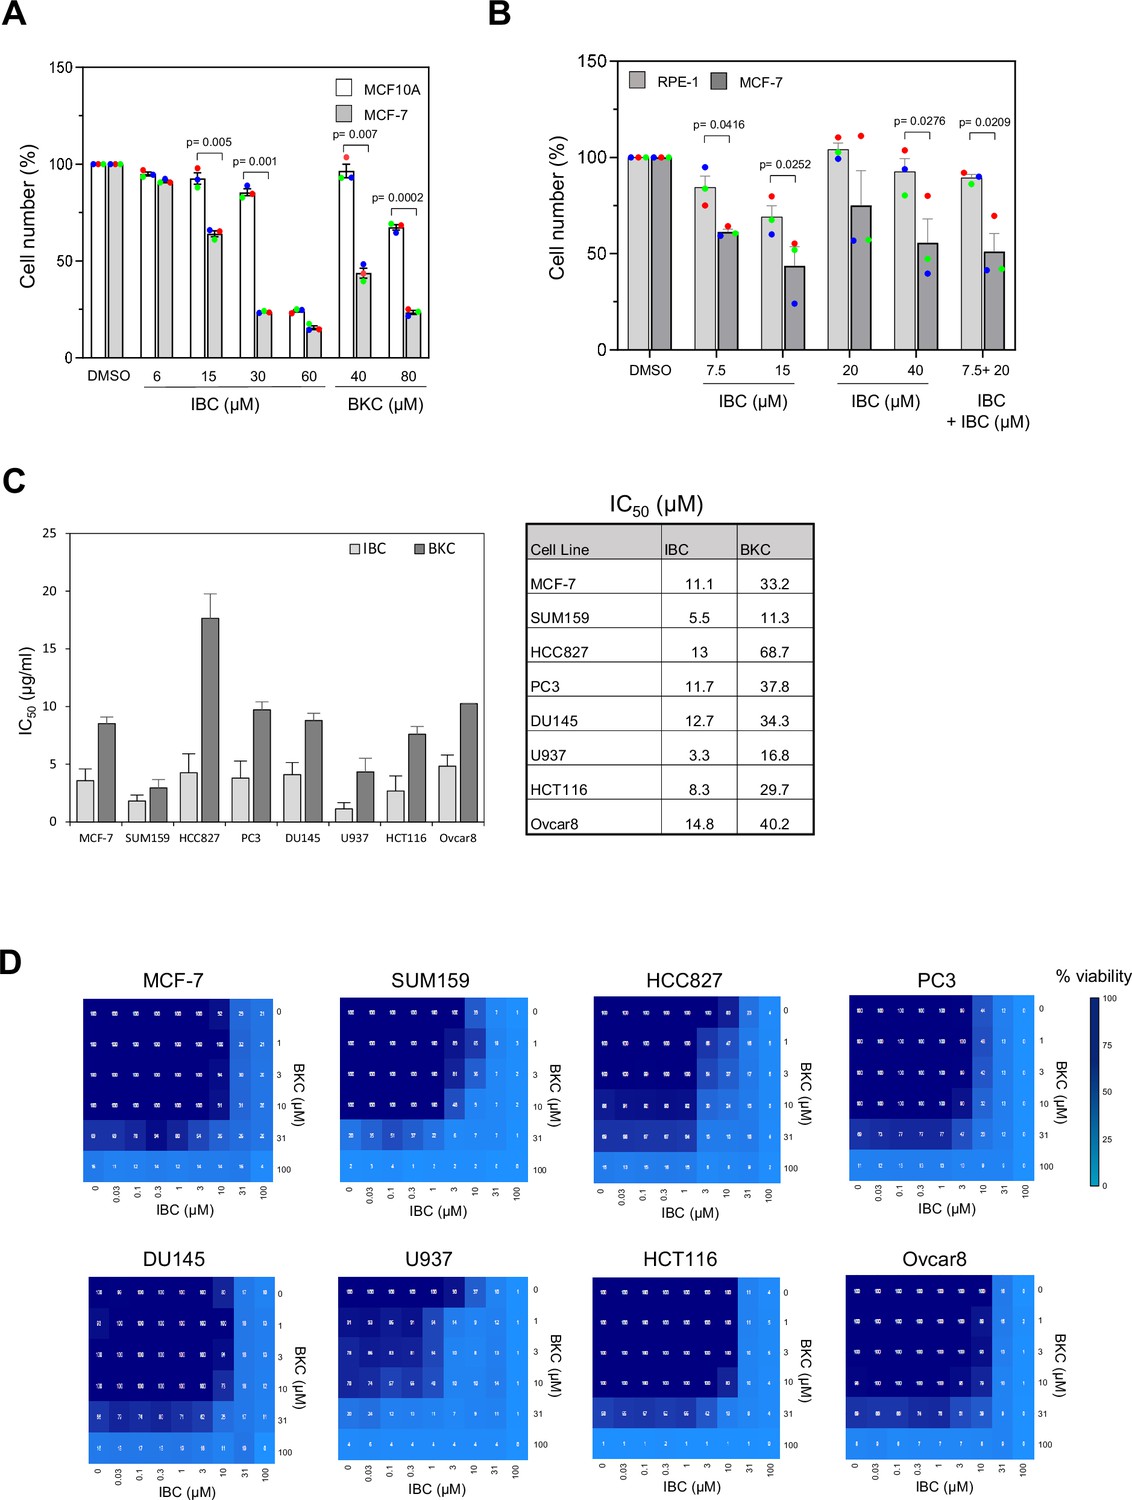
Isobavachalcone (IBC) and bakuchiol (BKC) synergistically inhibit proliferation of cancer cell lines.
(A) MCF10A and MCF-7 cells were treated with DMSO, or indicated concentrations of IBC and BKC for 72 hr. Cell number was quantified by using the WST-1 assay. Mean ± SD of three independent experiments are shown. The p-values were calculated using two-tailed unpaired t-test. (B) Human telomerase-immortalized RPE-1 cells and MCF-7 and A549 cells were treated with DMSO, indicated concentrations of IBC or BKC or the combination 7.5 μM IBC and 20 μM BKC for 72 hr. Cell number was quantified by using the WST-1 assay. Mean ± SD of three independent experiments are shown. The p-values were calculated using two-tailed unpaired t-test. (C) A panel of cancer cell lines were treated with different concentrations of IBC or BKC for 72 hr. Cell viability was measured and IC50 for each cell line was calculated from three independent experiments. Mean ± SD is shown. (D) Viability matrix for the concentrations of IBC and BKC combinations tested in a panel of cancer cell lines. Percentage of cell viability is indicated by the blue gradient. A representative analysis of three independent experiments is shown.
Figure 2 with 1 supplement
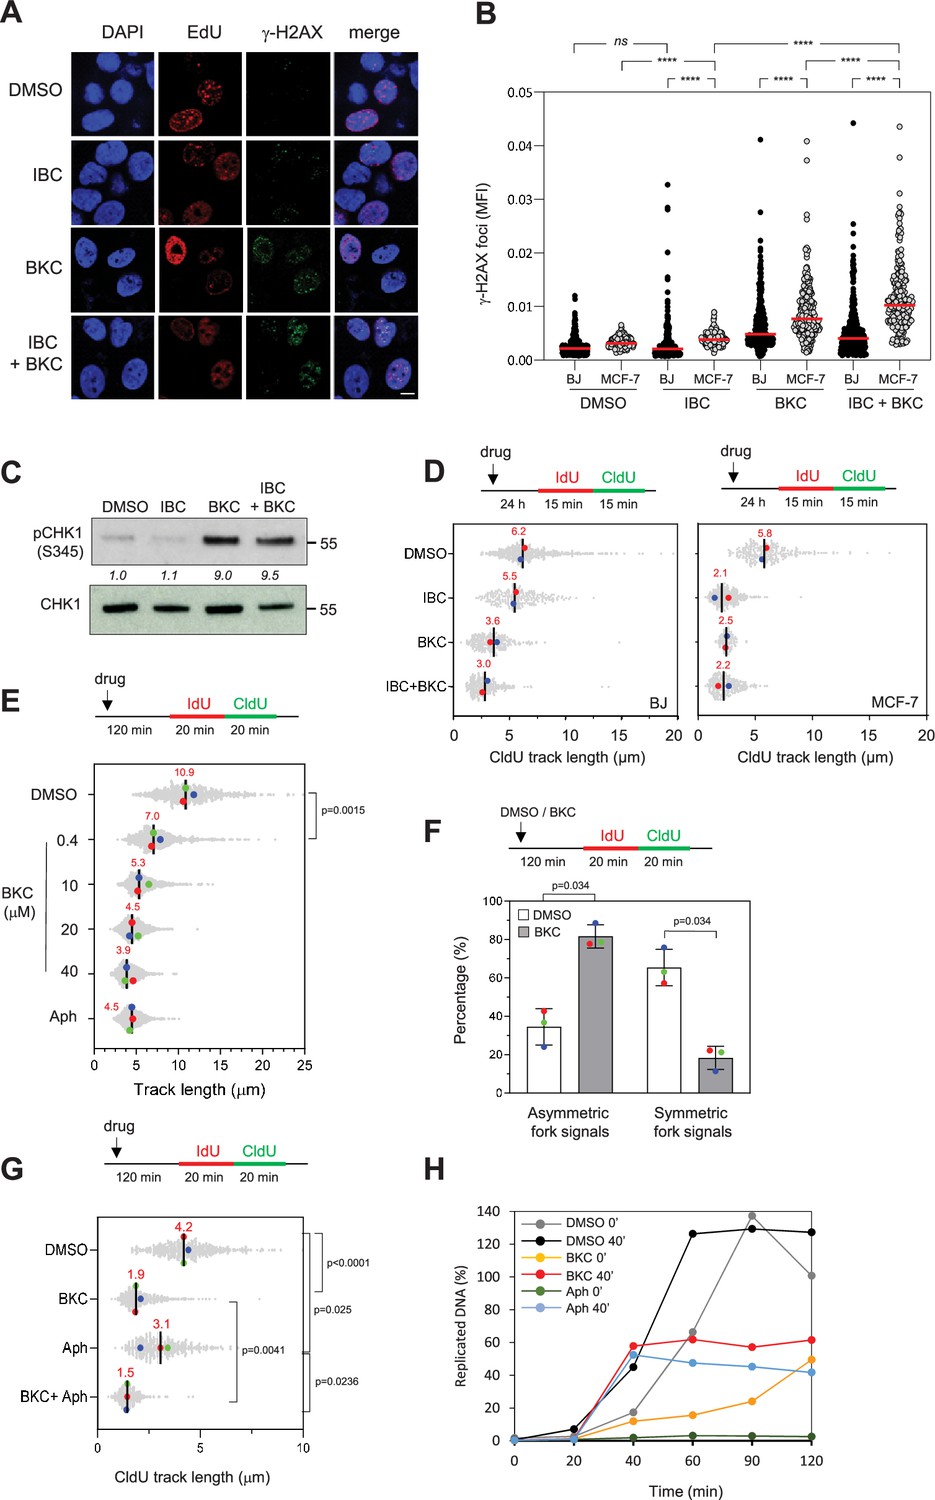
Isobavachalcone (IBC) and bakuchiol (BKC) induce replication stress and impede fork progression.
(A) MCF-7 and BJ cells were treated with either 15 μM IBC, 40 μM BKC, or both (IBC + BKC) for 24 hr, then 10 μM EdU was added for 10 min and γ-H2AX foci in EdU-positive cells were detected by using Click chemistry and immunofluorescence microscopy. Representative immunofluorescence images of MCF-7 cells are shown. Bar: 5 μm. (B) Mean fluorescence intensity (MFI) of γ-H2AX foci was quantified using CellProfiler. One of three independent experiments is shown (n = 3). ****p<0.0001; ns, not significant, Mann–Whitney rank sum test. (C) MCF-7 cells were treated with IBC/BKC for 24 hr, as in (A), and CHK1 phosphorylated on S345 (pCHK1) was detected by western blotting. The ratio of pCHK1 to total CHK1, relative to the DMSO control, is indicated. A representative example of two independent experiments is shown. (D) BJ and MCF-7 cells were treated with IBC/BKC for 24 hr, as in (A), then IdU and CldU were added sequentially each for 15 min. Replication fork progression was determined by measuring CldU track lengths in DNA fiber spreads. The median length of CldU tracks is indicated in red. At least 150 fibers were measured for each condition. Median of two independent experiments is indicated in red. (E) MCF-7 cells were treated with indicated concentrations of BKC or 1 µM aphidicolin (Aph) for 2 hr then IdU and CldU were added sequentially each for 20 min. Replication fork progression was determined as in (D). The length of IdU and CldU was measured. Median of three independent experiments is indicated in red. The p-values were determined using two-tailed unpaired t-test (n = 3). (F) MCF-7 cells were treated with DMSO or 20 μM BKC for 2 hr then IdU and CldU were added sequentially each for 20 min. Replication fork progression was determined as indicated in (D). The ratio of the CldU signal of two sister forks was calculated. At least 80 sister forks were measured in each biological replicate. The ratio of two sister forks between 0.8 and 1.2 was considered as symmetric forks. Mean ± SEM of three independent experiments are shown. The p-values were determined using two-tailed unpaired t-test. (G) MCF-7 cells were treated with 40 µM BKC, Aph (10 μM) or both (BKC + Aph) for 2 hr, prior to DNA fiber spreading assay. The p-values were determined using two-tailed unpaired t-test (n = 3). (H) Xenopus egg extracts were incubated with demembranated sperm nuclei and treated immediately (0 min) or after 40 min (40 min) with DMSO, BKC (100 μM), or Aph (60 μM). Samples were collected at the indicated time points after addition of the sperm nuclei. The percentage of replicated DNA was calculated as described in the ‘Materials and methods’.
-
Figure 2—source data 1
Original membranes corresponding to Figure 2C with labels.
4 and 7 are our codes for BKC and IBC, respectively. d: DMSO control; 7 4: means BKC + IBC.
- https://cdn.elifesciences.org/articles/104718/elife-104718-fig2-data1-v1.zip
-
Figure 2—source data 2
Original membranes corresponding to Figure 2C.
- https://cdn.elifesciences.org/articles/104718/elife-104718-fig2-data2-v1.zip
Figure 2—figure supplement 1
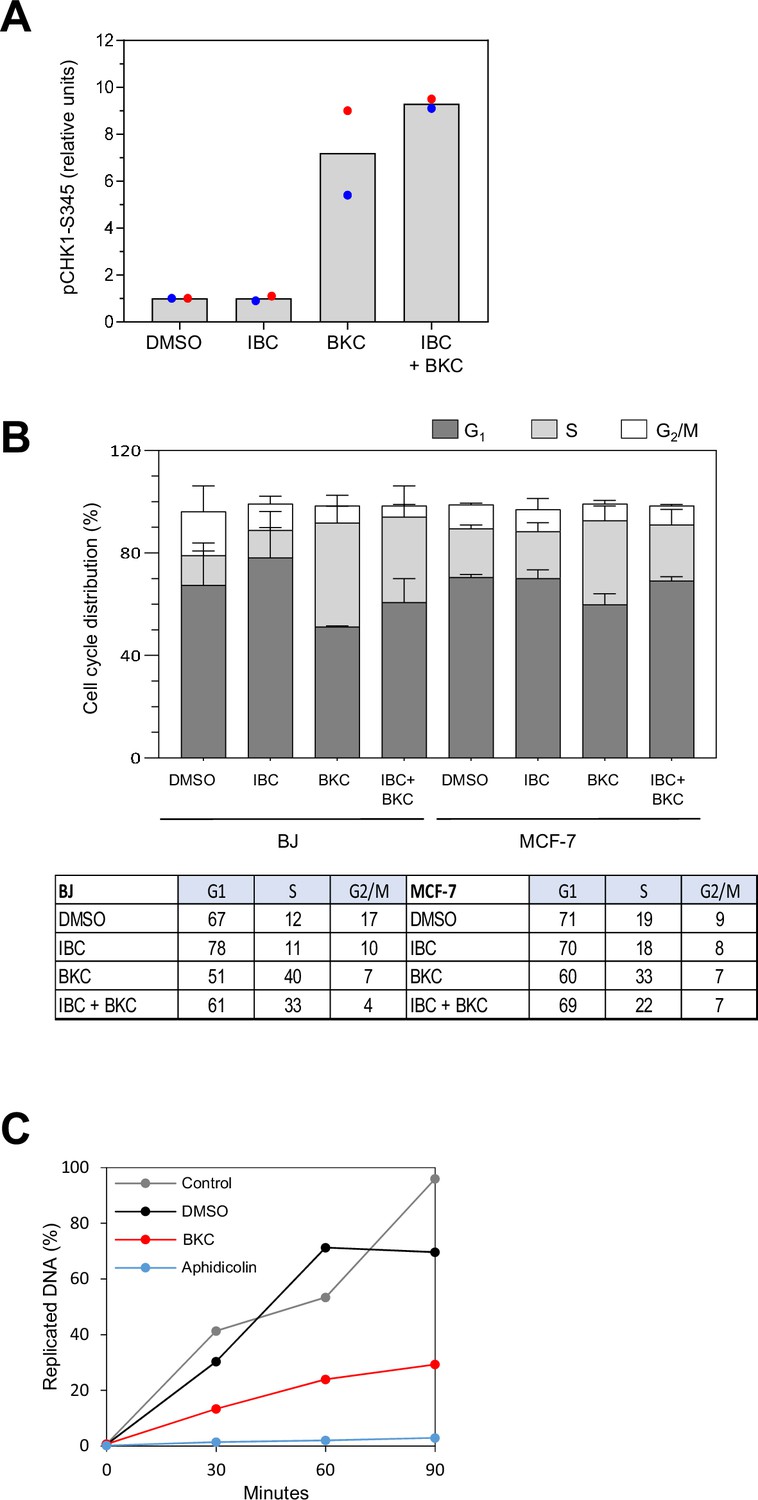
Bakuchiol (BKC) inhibits DNA replication and induces S-phase accumulation in the cell cycle.
(A) BJ and MCF-7 cells were treated for 24 hr with isobavachalcone (IBC), BKC, or the combination IBC + BKC for 24 hr, then labeled with 10 μM EdU for 30 min. Cell cycle distribution was analyzed by flow cytometry. Data are presented as mean ± SD from three independent experiments. (B) Densitometric quantification of the pCHK1-S345 signal for Figure 2C. (C) Xenopus high speed (HSS) egg extracts were treated with DMSO, BKC (100 μM, 25 μg/ml) or aphidicolin (Aph, 60 μM) before the addition of ssDNA. Samples were collected at 30, 60, or 90 min after the addition of sperm DNA. The percentage of replicated DNA was calculated as described in the ‘Materials and methods’. Representative figure from two independent experiments is shown.
Figure 3 with 1 supplement
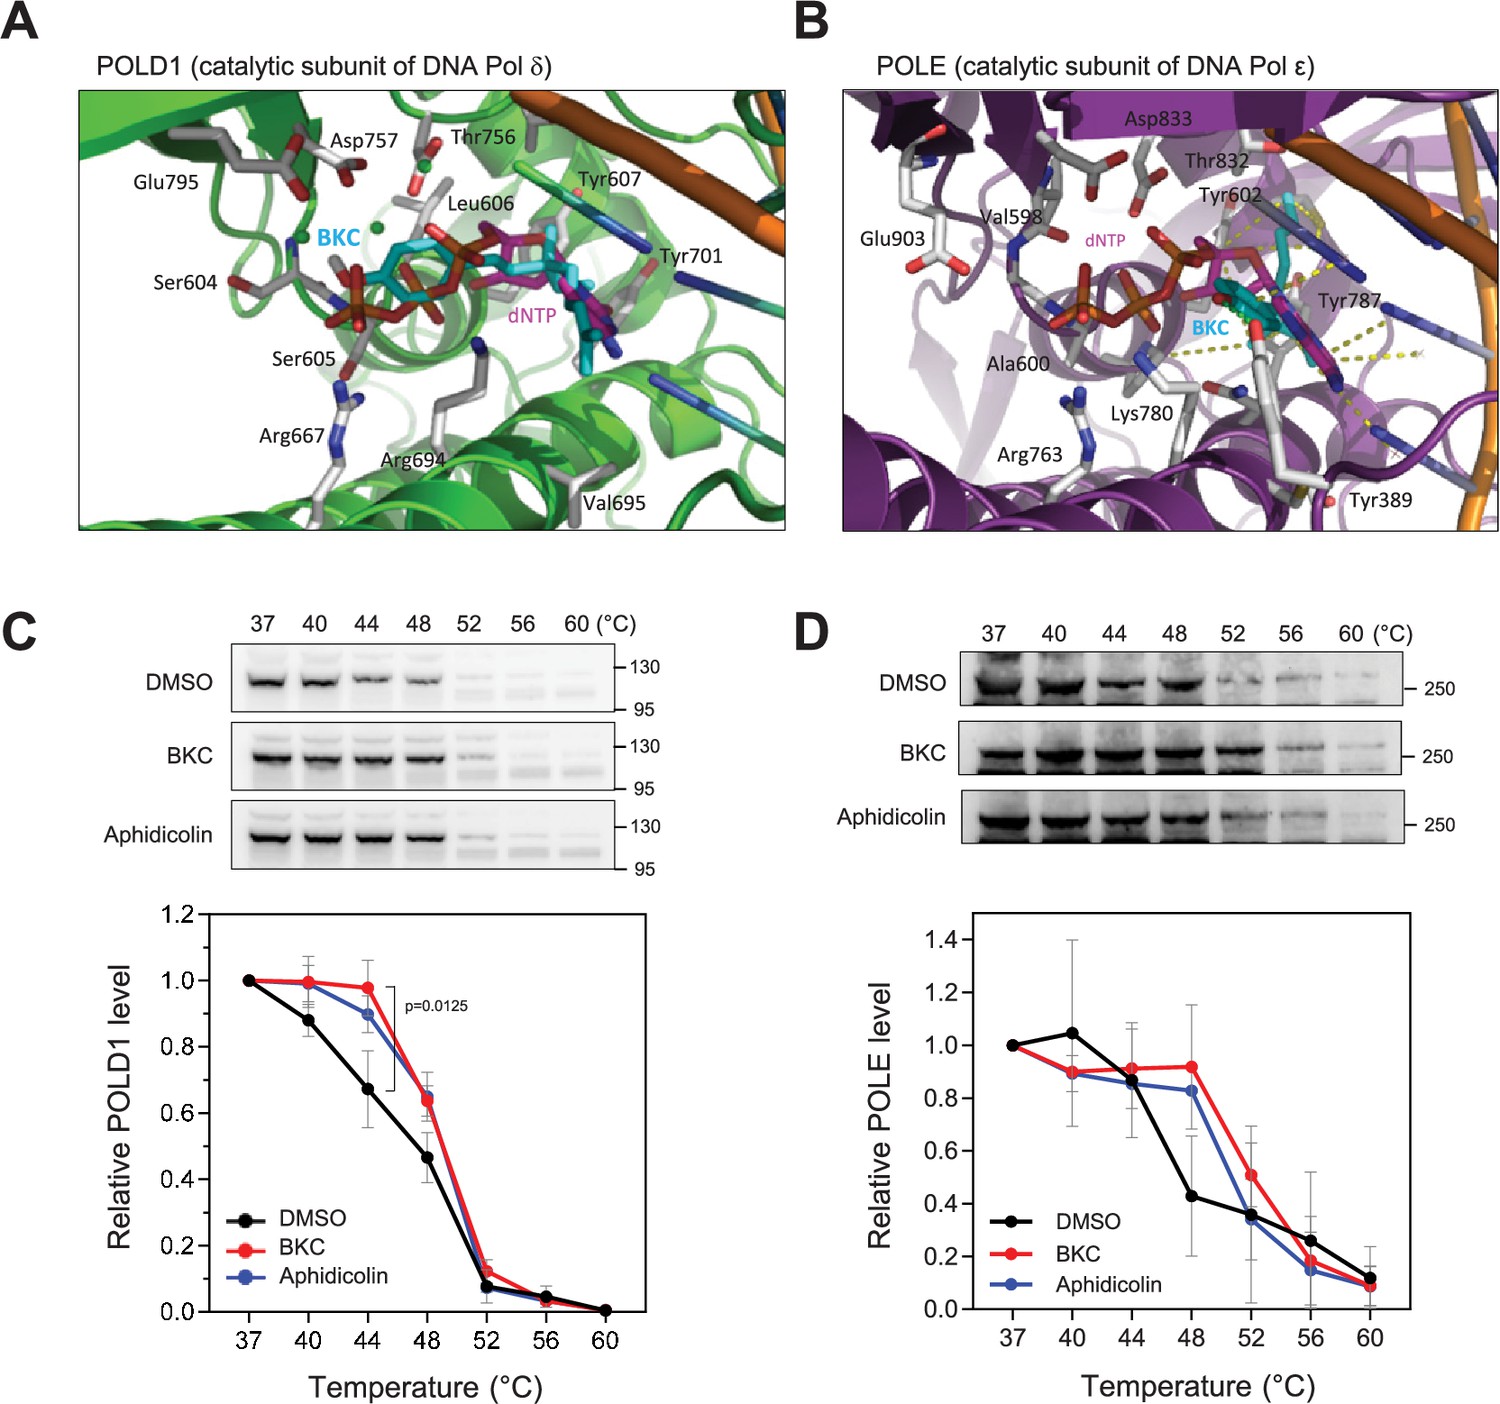
Bakuchiol (BKC) directly binds to DNA polymerases.
(A, B) In silico molecular docking of bakuchiol in the predicted active site structures of human DNA Pol δ and ε, respectively. (C, D) MCF-7 cells were treated with DMSO, 40 µM BKC, or 10 µM aphidicolin for 2 hr prior to the cellular thermal sensitivity shift assay (CETSA) at indicated temperature, as described in the Materials and Methods. Levels of POLD1 (Pol δ; panel C)and POLE (Pol ε; D) catalytic subunits were detected by western blotting. Mean and SEM of three independent experiments are shown. The p-values were determined using two-tailed paired t-test.
-
Figure 3—source data 1
Original membranes corresponding to Figure 3C and D with labels.
- https://cdn.elifesciences.org/articles/104718/elife-104718-fig3-data1-v1.zip
-
Figure 3—source data 2
Original membranes corresponding to Figure 3C and D.
- https://cdn.elifesciences.org/articles/104718/elife-104718-fig3-data2-v1.zip
Figure 3—figure supplement 1
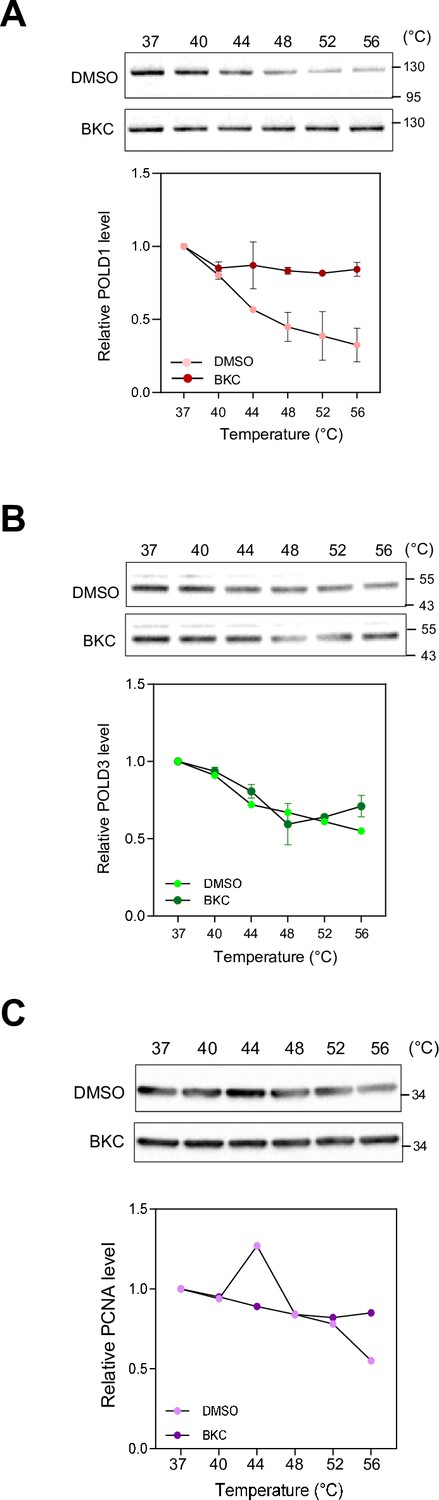
Bakuchiol (BKC) does not interact with PCNA.
(A–C) Xenopus egg extracts were incubated with DMSO or 40 μM BKC for 2 hr prior to the cellular thermal sensitivity shift assay (CETSA) at indicated temperature, as described in the ‘Materials and methods’. The residual amount of the DNA Polδ catalytic subunit POLD1 (p125, A) and the accessory subunit POLD3 (p66, B) or PCNA (C) in the supernatant was detected by western blotting. Mean of two independent experiments is shown.
-
Figure 3—figure supplement 1—source data 1
Original membranes corresponding to Figure 3—figure supplement 1A–C with labels.
The treatment and experimental temperatures are indicated.
- https://cdn.elifesciences.org/articles/104718/elife-104718-fig3-figsupp1-data1-v1.zip
-
Figure 3—figure supplement 1—source data 2
Original membranes corresponding to Figure 3—figure supplement 1A–C.
- https://cdn.elifesciences.org/articles/104718/elife-104718-fig3-figsupp1-data2-v1.zip
Figure 4 with 1 supplement
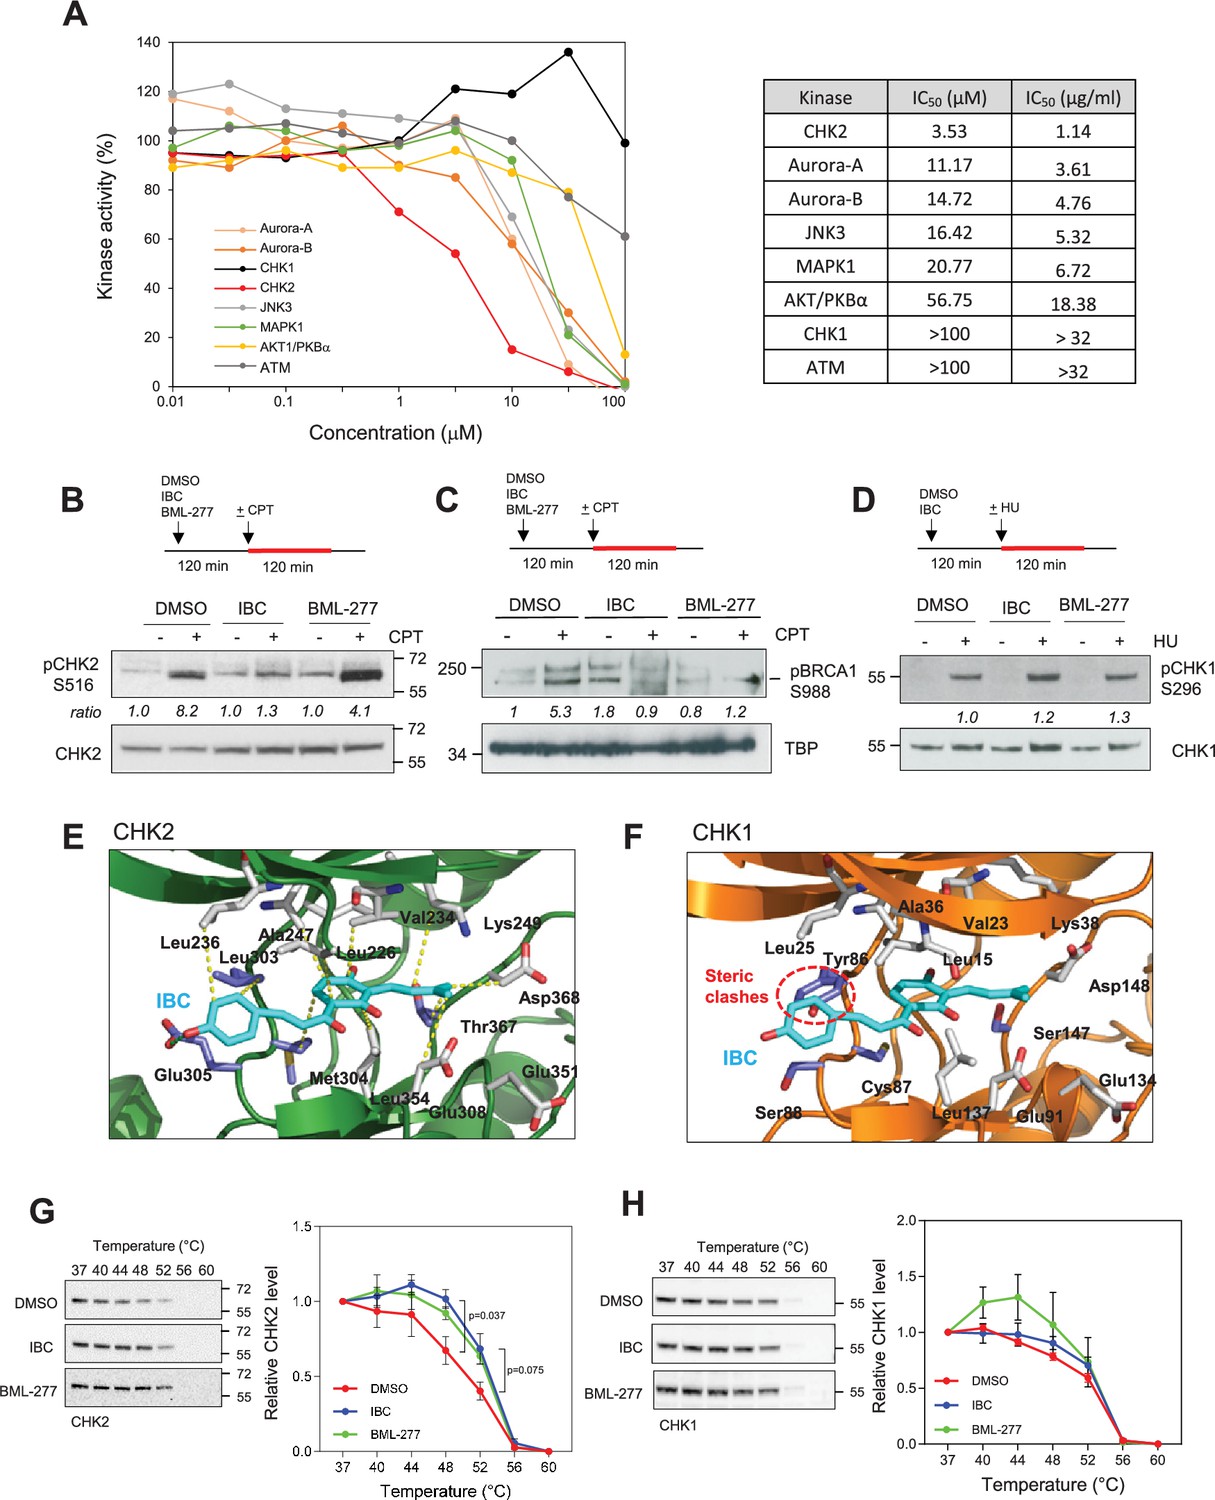
Isobavachalcone (IBC) inhibits the CHK2 kinase.
(A) Selected protein kinases were incubated with the indicated range of IBC concentrations, and kinase activity in vitro was determined by using a radiometric assay. The IC50 of IBC for each kinase is indicated in the panel on the right. (B) MCF-7 cells were pretreated with DMSO, 15 µM IBC, or 20 µM BML-277 for 2 hr, then camptothecin (CPT, 1 μM) was added for 2 hr. Phosphorylation of CHK2 on S516 (pCHK2) was detected by western blotting. The ratio of pCHK2-S516 induction, relative to the DMSO + CPT control, is indicated (n = 3). (C) MCF-7 cells were treated as indicated in (B). Phosphorylation of chromatin-bound BRCA1 at residue S988 was detected by western blotting. The relative ratio of pBRCA1-S988 signal, after normalization to Ponceau signal, is indicated. TBP was used as a marker of chromatin fraction. (D) MCF-7 cells were treated with 15 μM IBC for 2 hr, then 4 mM HU was added for 2 hr. CHK1 autophosphorylation on S296 (pCHK1) was detected by western blotting. (E, F) In silico molecular docking of IBC in the active sites of CHK2 and CHK1, respectively. (G, H) Cellular thermal shift assay (CETSA) of IBC on the thermal stability of CHK2 and CHK1. MCF-7 cells were treated with 15 µM IBC or 20 μΜBML-277 for 2 hr. Cells were proceeded to CETSA as described in the ‘Materials and methods’. The amount of CHK2 and CHK1 present in the supernatant was detected by western blotting. The relative CHK2 and CHK1 signal was quantified. The p-values were determined using two-tailed paired t-test (n = 3).
-
Figure 4—source data 1
Original membranes corresponding to Figure 4B–D, G, H with labels.
- https://cdn.elifesciences.org/articles/104718/elife-104718-fig4-data1-v1.zip
-
Figure 4—source data 2
Original membranes corresponding to Figure 4B–D, G, H.
- https://cdn.elifesciences.org/articles/104718/elife-104718-fig4-data2-v1.zip
Figure 4—figure supplement 1
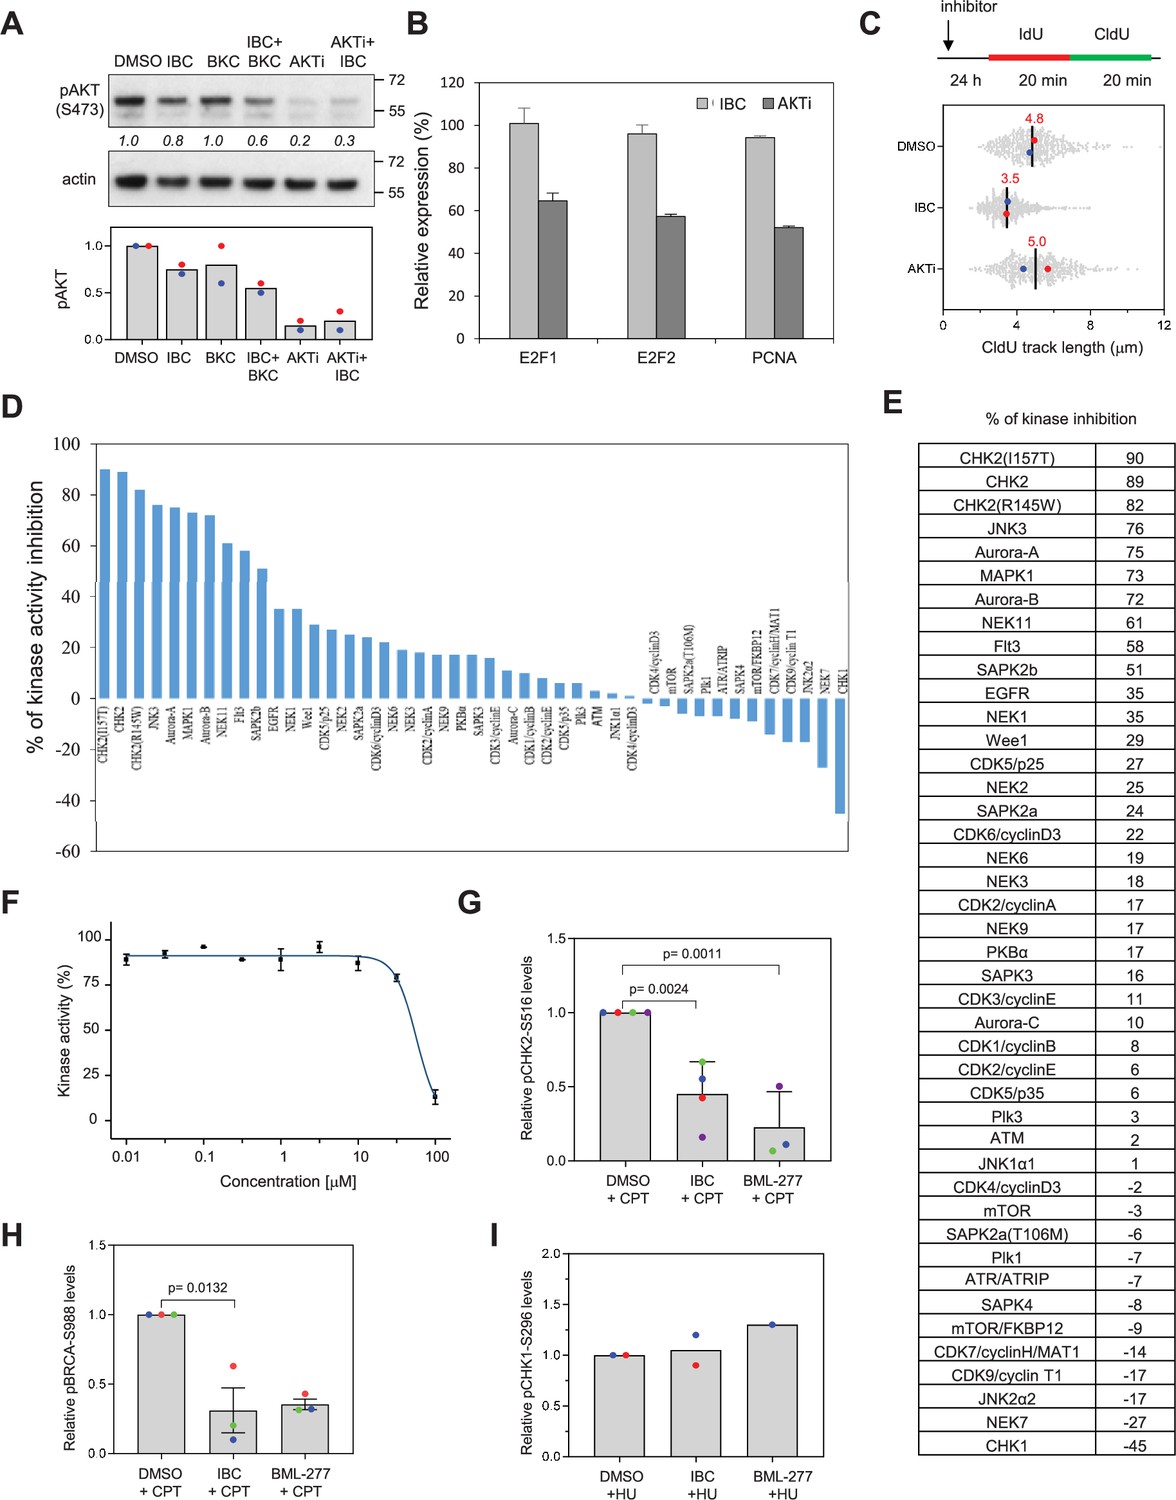
Isobavachalcone (IBC) does not inhibit AKT activity in MCF-7 cells.
(A) MCF-7 cells treated with DMSO, 15 μM IBC, 20 μM bakuchiol (BKC), the combination IBC + BKC or AKT inhibitor, MK-2206, (AKTi, 10 μM) for 24 hr. Autophosphorylation of AKT was detected by immunoblotting analysis. Densitometric quantification of phosphor-AKT signal is shown. (n = 2). (B) MCF-7 cells treated overnight with DMSO, IBC, or AKT inhibitor (AKTi). Total RNA was isolated. Reverse transcription and quantitative PCR was performed with specific primers targeting the gene bodies of PCNA, E2F1, and E2F2 (n = 2). (C) MCF-7 cells were treated with IBC or AKT inhibitor (AKTi) for 24 hr. They were then sequentially labeled with IdU and CldU for 20 min. Replication fork progression was measured using DNA fiber spreading. The median length of CldU tracks of two biological replicates is indicated in red. (D) In vitro kinase assay of 43 cell cycle-related kinases following treatment with 30 µM IBC. The CHK2(I157T) mutation is linked to an increased risk of breast and colorectal cancers. CHK2(R145W) is associated with Li–Fraumeni syndrome. Both mutations do not affect the basal kinase activity of CHK2. (E) Percentage inhibition of kinase activity by IBC treatment is shown. (F) AKT kinase peptides were incubated with a half-log range dilution series of Isobavachalcone and in vitro kinase activity was measured using a radiometric assay. Data are presented as mean ± SD with a technical triplicate. (G) Densitometric quantification of the pCHK2-S516 induction by CPT for Figure 4B. The relative induction of pCHK2-S516 by CPT after IBC or BML-277 treatment compared to DMSO control is indicated. Mean ± SD of three independent experiments for DMSO + CPT and IBC + CPT are shown. The p-value was determined using two-tailed unpaired t-test. (H) Densitometric quantification of the pCHK2-S516 induction by CPT for Figure 4C. The relative induction of pBRCA1-S988 by CPT after IBC or BML-277 treatment compared to DMSO control is indicated. Mean ± SD of three independent experiments for DMSO + CPT and IBC + CPT are shown. The p-value was determined using two-tailed unpaired t-test. (I) Densitometric quantification of the pCHK1-S296 induction by HU for Figure 3D. The relative induction of pCHK1-S296 by HU after IBC or BML-277 treatment compared to DMSO control is indicated (n = 2).
-
Figure 4—figure supplement 1—source data 1
Original membranes corresponding to Figure 4—figure supplement 1.
4 and 7 are our codes for BKC and IBC, respectively. d: DMSO control; 7+4: means BKC + IBC.
- https://cdn.elifesciences.org/articles/104718/elife-104718-fig4-figsupp1-data1-v1.zip
-
Figure 4—figure supplement 1—source data 2
Original membranes corresponding to Figure 4—figure supplement 1 with labels.
- https://cdn.elifesciences.org/articles/104718/elife-104718-fig4-figsupp1-data2-v1.zip
Figure 5 with 1 supplement
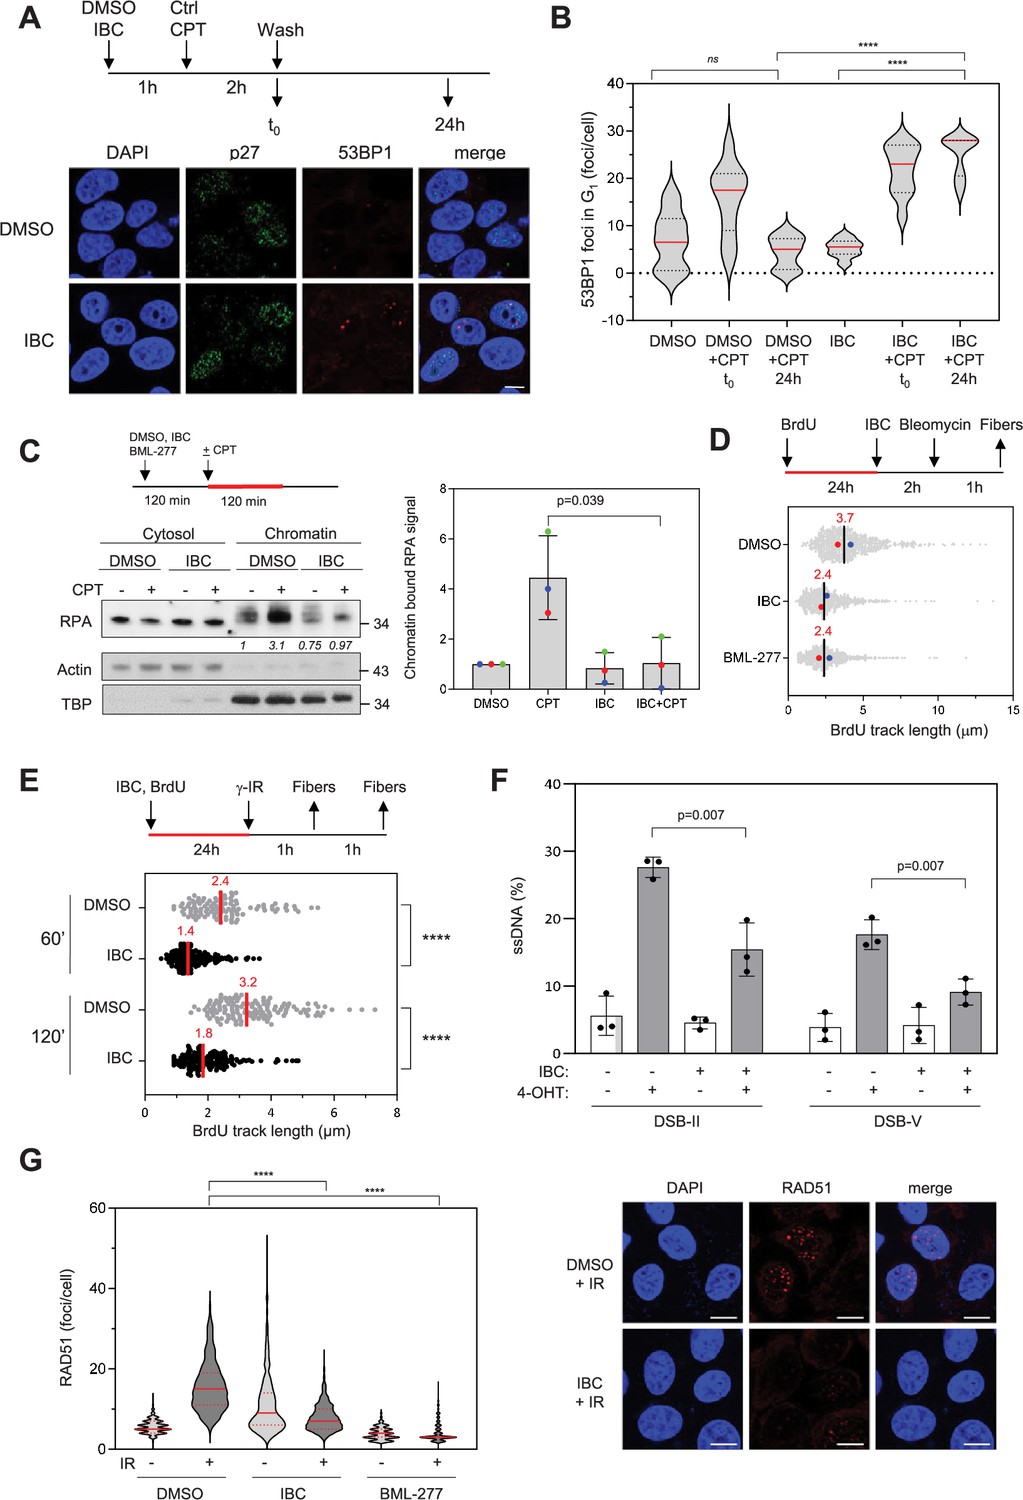
Isobavachalcone (IBC) impedes DNA end resection and RAD51 foci formation.
(A) MCF-7 cells were treated with DMSO or 15 μM IBC for 1 hr, then camptothecin (CPT, 1 μM) was added for 2 hr. The cells were fixed immediately or washed and allowed to recover in medium containing DMSO or IBC for 24 hr before fixation. 53BP1 foci in p27-positive nuclei were detected by immunofluorescence microscopy. Representative images are shown. Bar: 5 μm. (B) 53BP1 foci number was quantified using CellProfiler. Representative data from three independent experiments are shown. ****p<0.0001; ns, not significant, Mann–Whitney rank sum test. (C) MCF-7 cells were treated with DMSO or 15 μM IBC for 2 hr, then CPT (1 μM) was added for 2 hr, as indicated. Cells were fractionated into cytosol and nuclei (chromatin) and RPA in both fractions was detected by western blotting. Actin and TBP were used as markers of cytosol and chromatin fractions, respectively. The fold change of the chromatin-bound RPA signal relative to the DMSO control was quantified. The p-value was determined using unpaired t-test (n = 3). (D) MCF-7 cells were incubated with 10 µM BrdU for 24 hr to label genomic DNA, then DMSO, 15 µM IBC or the CHK2 inhibitor BML-277 (20 μM) were added for 2 hr followed by addition of 5 μg/ml bleomycin for 1 hr. DNA fibers were spread on glass slides and BrdU was detected by immunofluorescence microscopy without DNA denaturation. The length of BrdU the tracks was measured and the median for each condition is indicated in red. At least 250 fibers were measured for each condition. Median of two independent experiments is indicated in red (n = 2). (E) MCF-7 cells were incubated with 10 µM BrdU for 24 hr to label genomic DNA in the presence of DMSO or IBC then exposed to ionizing radiations (8 Gy). Cells were collected 60 or 120 min after irradiation and BrdU tracks measured as in (B). ****p<0.0001, Mann–Whitney rank sum test. (F) DIvA cells were treated with either DMSO or IBC for 2 hr then DNA breaks were induced by treatment with 300 nM 4-hydroxytamoxifen (4-OHT) for 4 hr. Resection at two break sites, DSB-II and DSB-V, was determined as the percentage of ssDNA at these sites, calculated as indicated in the ‘Materials and methods’. Data are means ± SD (n = 3). The p-values are indicated (two-tailed paired t-test). (G) MCF-7 cells were treated with DMSO, IBC, or BML-277 for 2 hr, then irradiated as described above. After 1 hr, RAD51 foci were detected by CSK-immunofluorescence microscopy and foci number was quantified using CellProfiler. Representative data (left) and immunofluorescence images (right) from two independent experiments are shown. Bar: 10 μm. ****p<0.0001, Mann–Whitney rank sum test.
-
Figure 5—source data 1
Original membranes corresponding to Figure 5C with labels.
Cytosol for cytosol fraction. Chr for chromatin fraction. Alpha-actin was used as a marker of cytosolic fraction. TBP was employed as a marker of chromatin fraction. The molecular weight markers are indicated.
- https://cdn.elifesciences.org/articles/104718/elife-104718-fig5-data1-v1.zip
-
Figure 5—source data 2
Original membranes corresponding to Figure 5C.
- https://cdn.elifesciences.org/articles/104718/elife-104718-fig5-data2-v1.zip
Figure 5—figure supplement 1
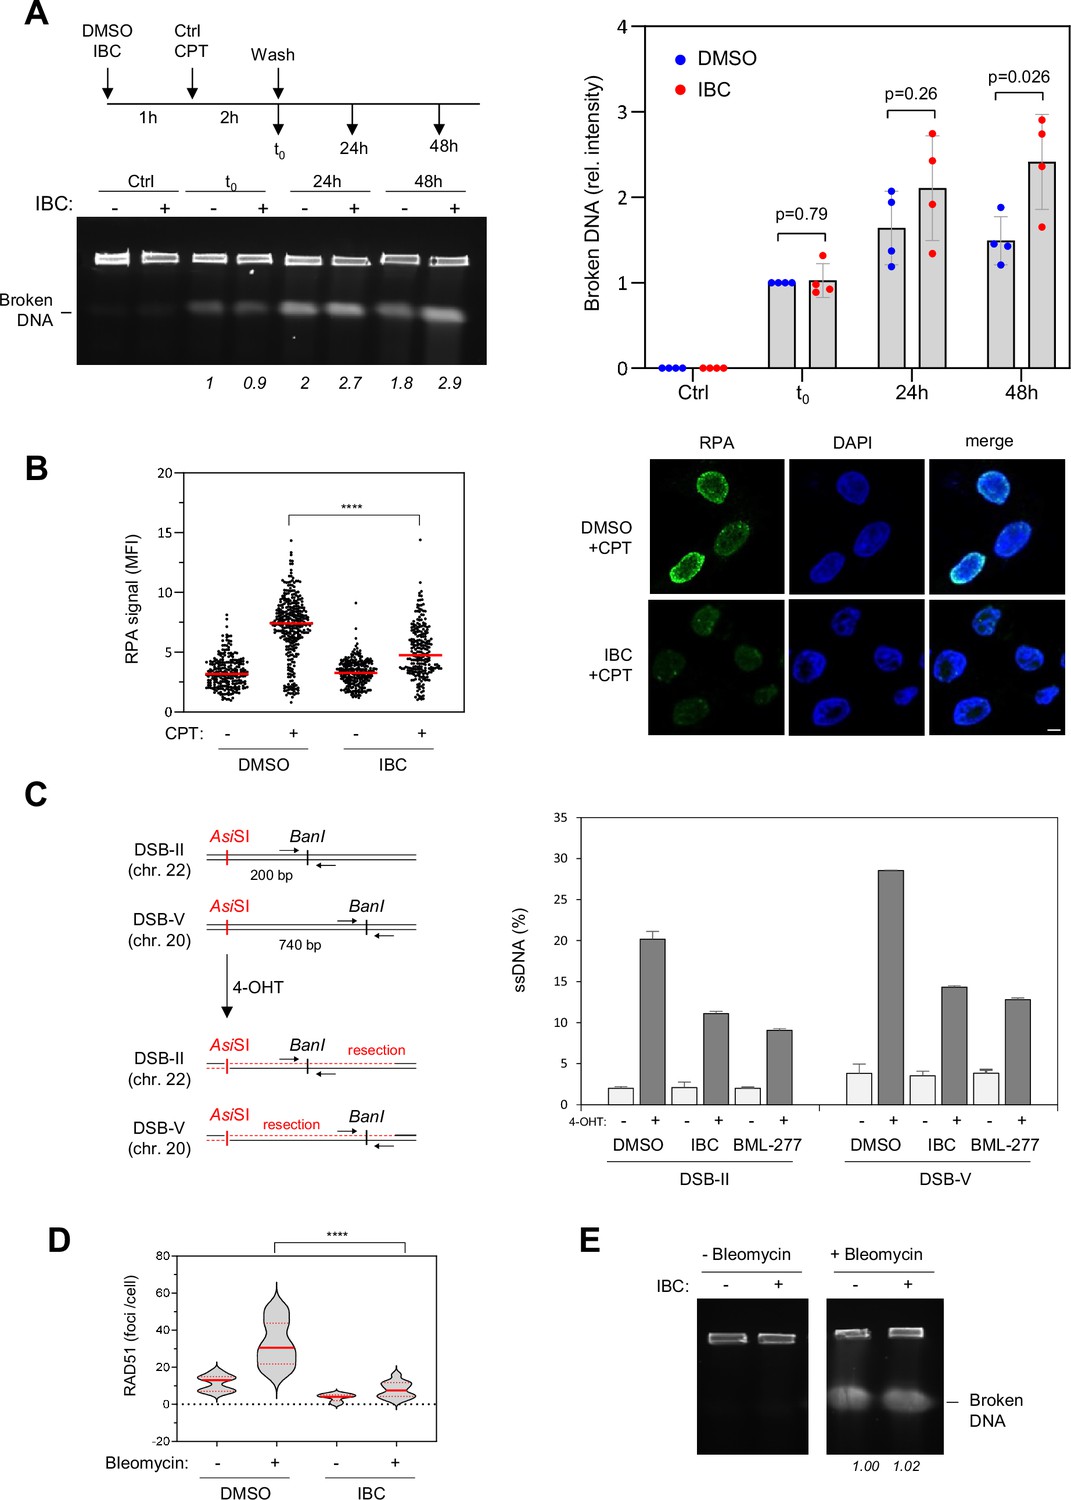
Isobavachalcone (IBC) results in the persistence of DNA breaks and impairs DNA end resection.
(A) MCF-7 cells were pretreated with DMSO or IBC for 1 hr, followed by incubation with or without camptothecin (CPT, 1 μM) for another 2 hr. Cells were recovered immediately or washed and let recover in the presence of DMSO or IBC for 24 or 48 hr. The amount of broken DNA was detected by PFGE. Fold increase of broken DNA was normalized by the control sample at t0. The p-values are indicated (two-tailed paired t-test). Representative gel image from four independent experiments is shown. (B) MCF-7 cells were pretreated with DMSO or IBC for 1 hr, followed by incubation with or without CPT for another 2 hr. Cells were fixed and the formation of RPA foci was detected by CSK-immunofluorescence microscopy. Mean fluorescence intensity (MFI) of RPA signal was quantified using CellProfiler. ****p<0.0001, Mann–Whitney rank sum test. Representative data from three independent experiments are shown. Bar: 5 μm. (C) DIvA cells were treated with either DMSO, IBC, or CHK2 inhibitor (BML-277) for 2 hr before induction of DNA breaks by 4-hydroxytamoxifen (4-OHT) for 4 hr. Resection at two break sites is evaluated. Percentage of ssDNA was calculated as indicated in the ‘Materials and methods’. (D) MCF-7 cells were pretreated with DMSO, IBC for 2 hr, followed by bleomycin treatment for 1 hr. Cells were allowed to recover for 1 hr, and the formation of RAD51 foci was detected by CSK-immunofluorescence microscopy. RAD51 foci number was quantified using CellProfiler. ****p<0.0001, Mann–Whitney rank sum test. A representative example of three independent experiments is shown (n = 3). (E) MCF-7 cells were pretreated with DMSO, IBC for 2 hr, followed by bleomycin treatment for 1 hr. The amount of broken DNA was detected by PFGE. Fold increase of broken DNA was normalized by the control sample.
-
Figure 5—figure supplement 1—source data 1
Original gel corresponding to Figure 5—figure supplement 1A with labels.
Bleocin-treated positive control was included.
- https://cdn.elifesciences.org/articles/104718/elife-104718-fig5-figsupp1-data1-v1.zip
-
Figure 5—figure supplement 1—source data 2
Original gel corresponding to Figure 5—figure supplement 1A.
- https://cdn.elifesciences.org/articles/104718/elife-104718-fig5-figsupp1-data2-v1.zip
Figure 6 with 1 supplement
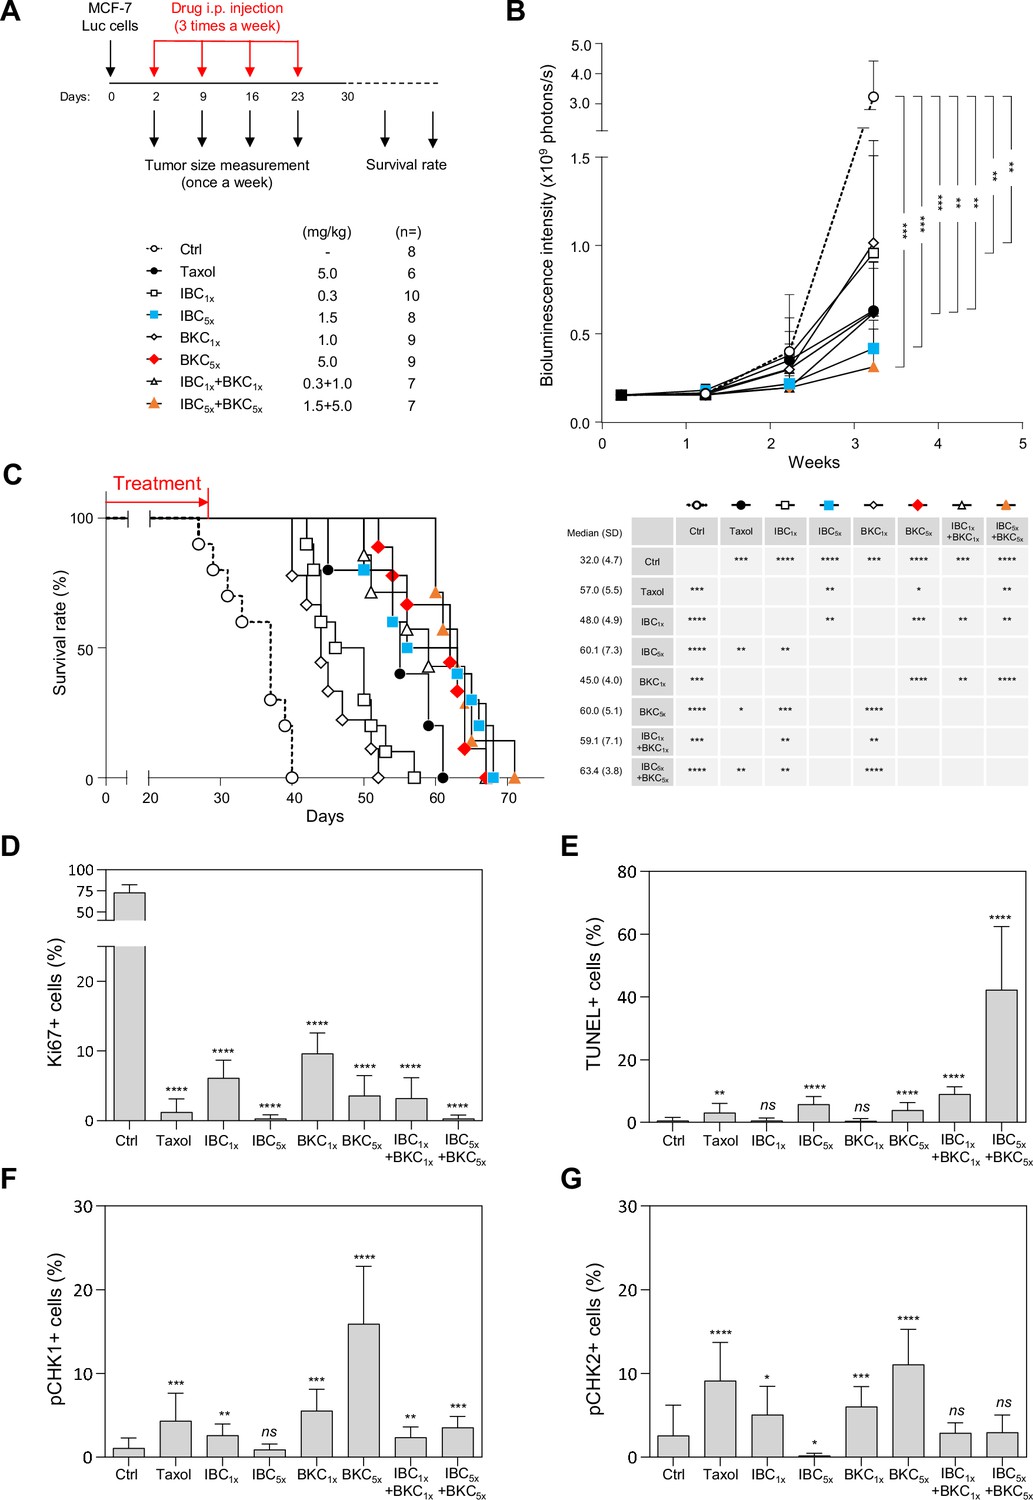
Isobavachalcone (IBC) and bakuchiol (BKC) synergistically inhibit tumor development and induce DNA damage in a xenograft mouse model.
(A) Schematic description of the protocol. MCF-7/Luc cells (1 × 10⁴) were injected into the fat pads of female non-obese diabetic/severe combined immunodeficiency mice at day 0. Two days later, randomized mice were injected intraperitoneally with (phosphate-buffered saline) PBS, Taxol, IBC, BKC, or IBC + BKC at the indicated doses. Tumor sizes were measured weekly thereafter. Tumor tissues were collected 28 days after grafting and analyzed by immunohistochemistry. Mice survival was also evaluated. (B) Tumor size in the fat pads was measured once per week by using the IVIS bioluminescence system. The number of xenografted mice receiving each treatment is indicated. ****p<0.0001, ***p<0.001, **p<0.01, *p<0.05, Mann–Whitney rank sum test. (C) Survival (left) and median survival time (days, right) is shown for xenografted mice receiving each treatment. ****p<0.0001, ***p<0.001, **p<0.01, *p<0.05, Mann–Whitney rank sum test. (D) Tumor tissues collected from xenograft mice were analyzed immunohistochemically for the cell proliferation maker Ki67. (E) Broken DNA and apoptosis marker, TUNEL staining. (F) pCHK1 (S345) and (G) pCHK2 (Thr68). ****p<0.0001, ***p<0.001, **p<0.01, *p<0.05; ns, not significant, Mann–Whitney rank sum test.
Figure 6—figure supplement 1
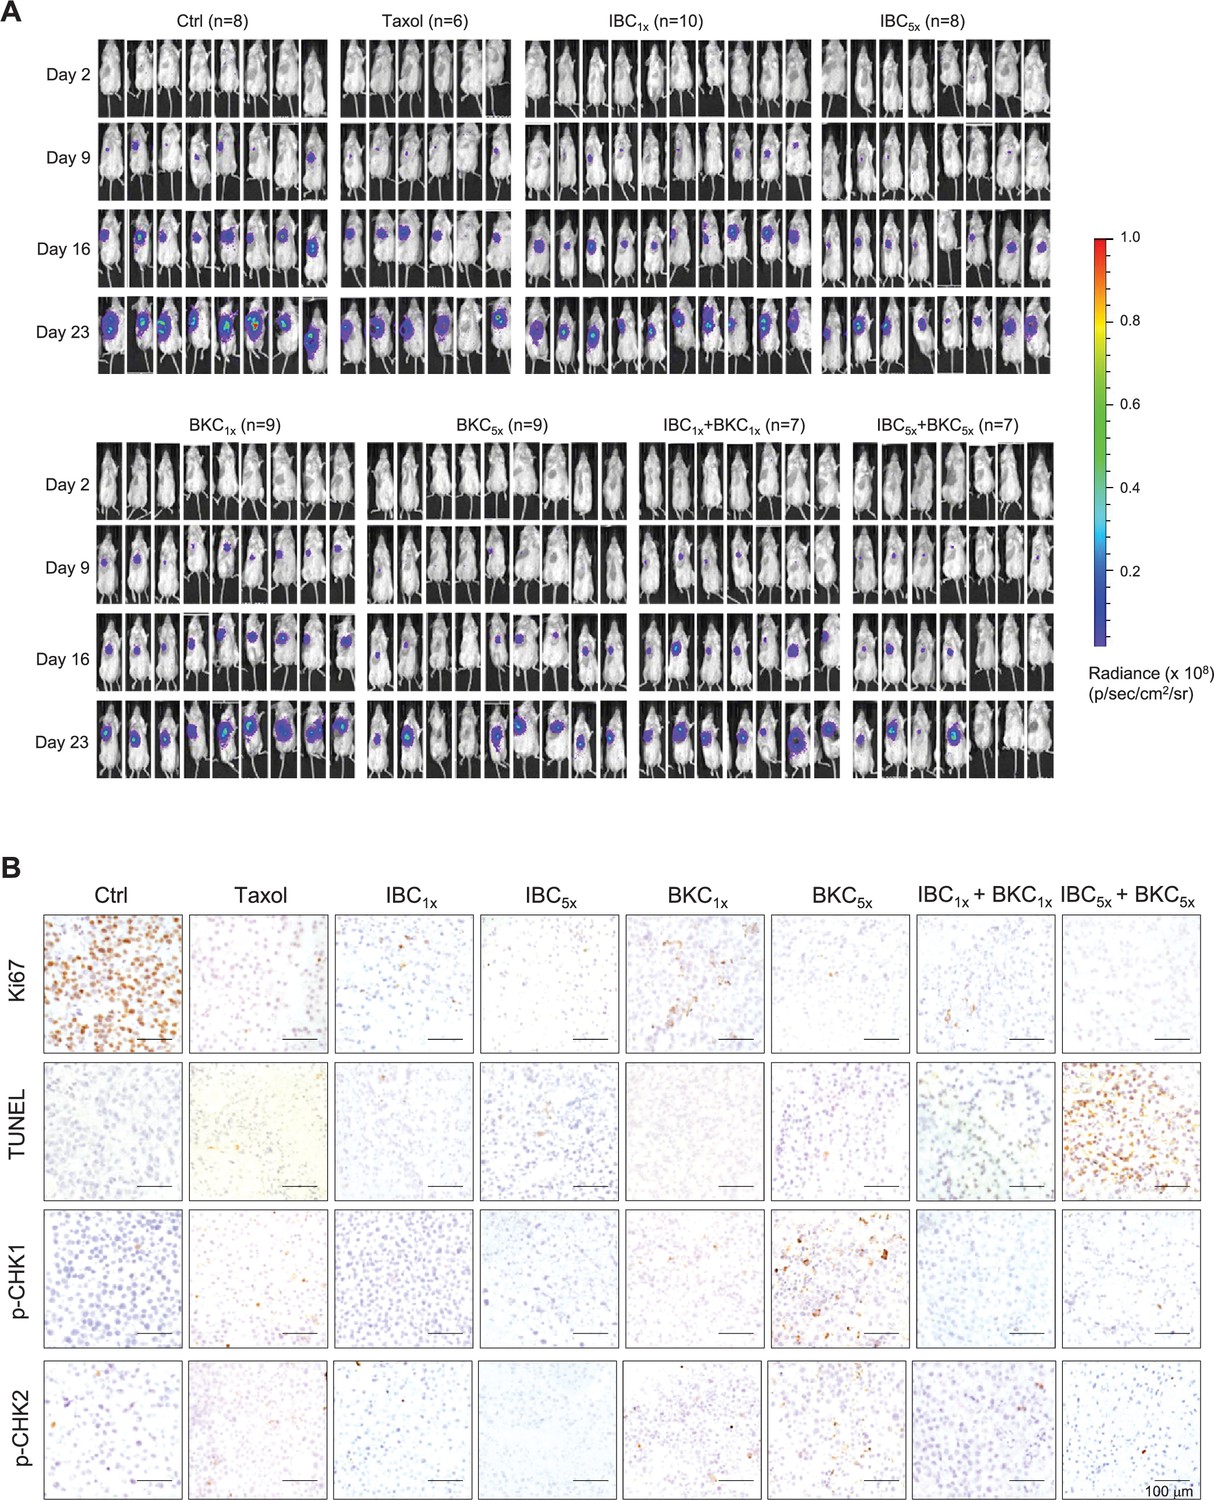
Isobavachalcone (IBC) and bakuchiol (BKC) extend survival and induce replication stress and DNA damage in a xenograft mouse model.
(A) Luminometry images of MCF-7/Luc xenograft mice treated with (phosphate-buffered saline) PBS, Taxol, IBC, BKC, or the combination IBC + BKC during treatments. (B) Immunohistochemistry images of Ki67, TUNEL staining, pCHK1 (S345), and pCHK2 (Thr68) in xenografted tumor tissues.
Figure 7 with 1 supplement
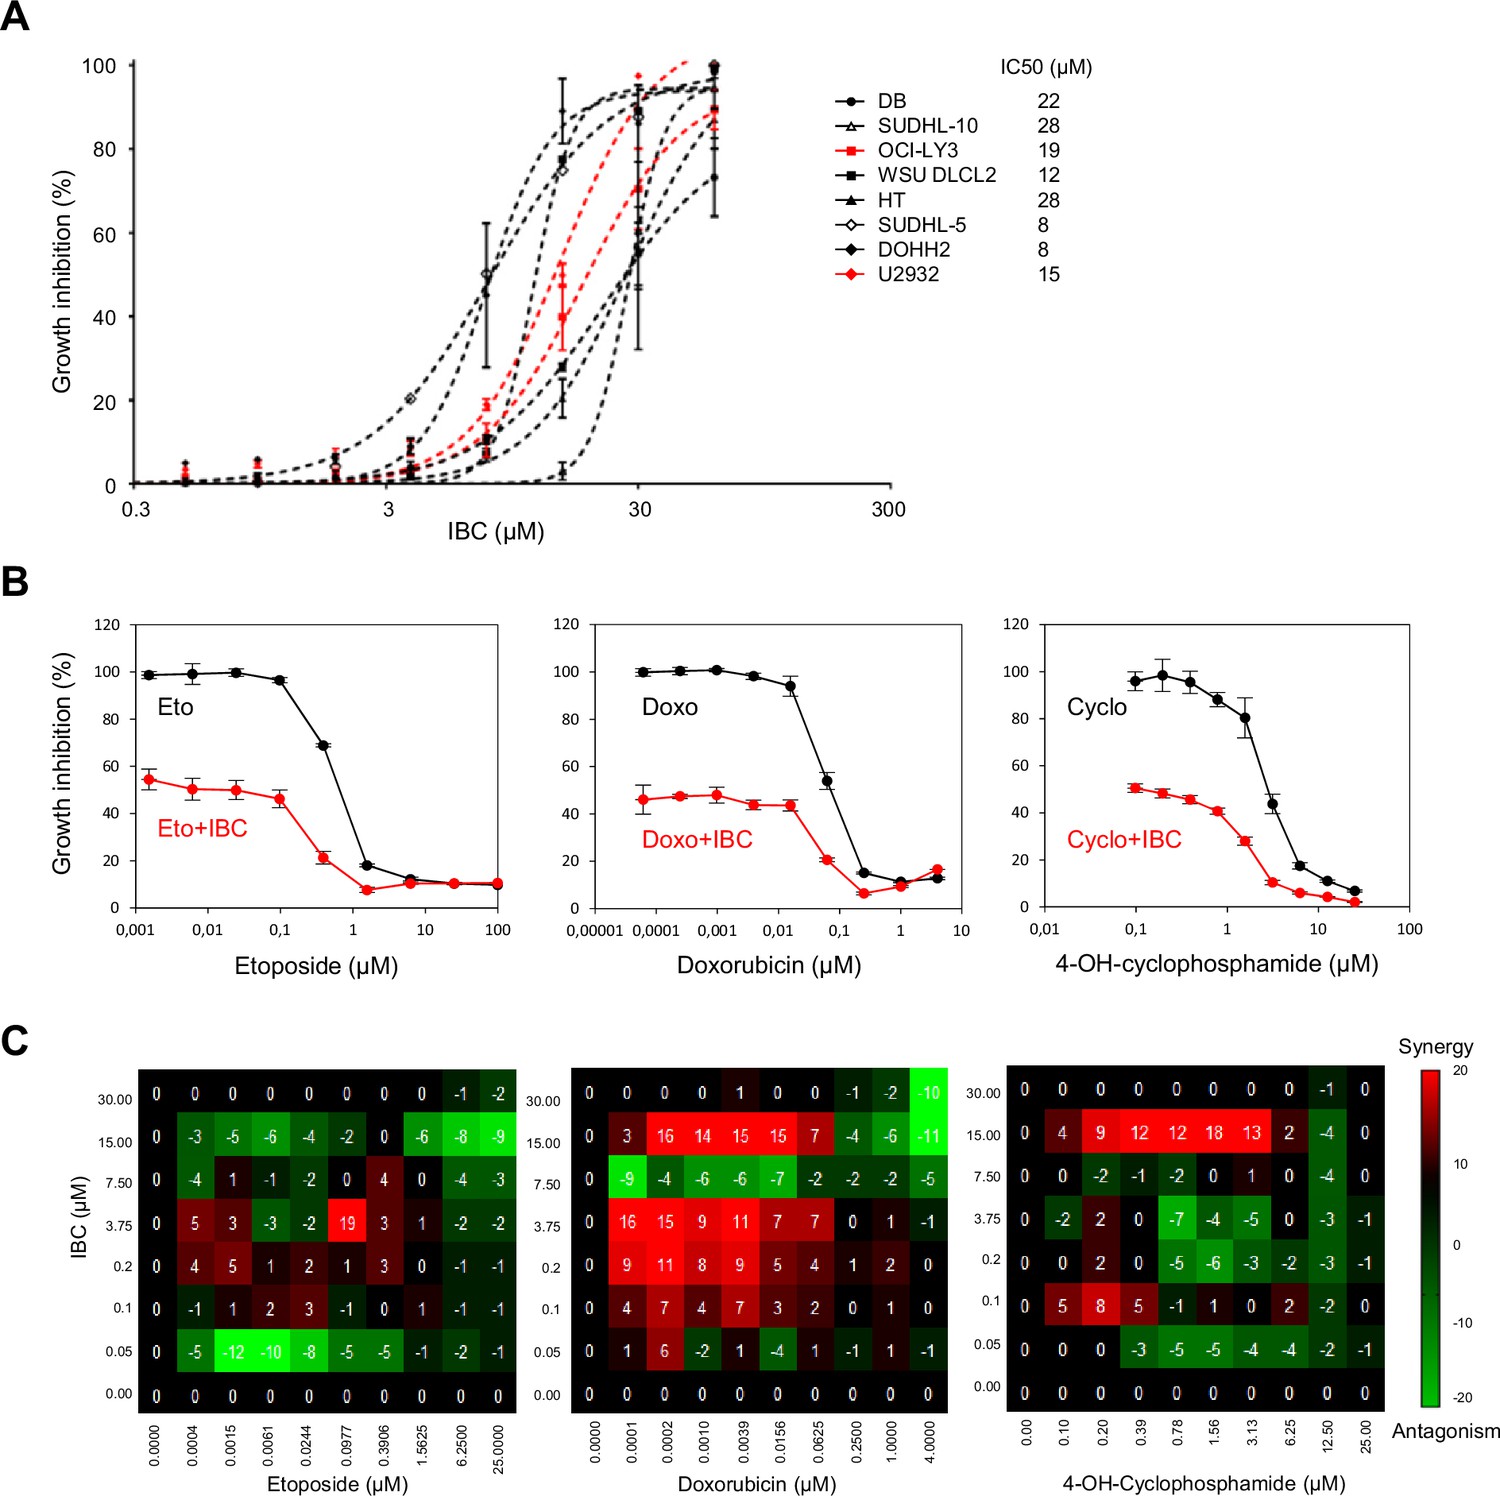
Isobavachalcone (IBC) potentiates the effect of chemotherapeutic agents on lymphoma cells.
(A) A panel of eight diffuse large B-cell lymphoma (DLBCL) cell lines were incubated with the indicated concentrations of IBC for 72 hr (left) and growth inhibition was measured to calculate the IC50 in each cell line (right). Data are presented as means ± SD (n = 3). (B) U2932 cells were treated with the indicated concentrations of etoposide (Eto), doxorubicin (Doxo), or 4-OH-cyclophosphamide (4-OH-Cyclo) without (black points) or with 1.5 μg/ml (the IC20 concentration for this cell line) IBC (red points) for 72 hr. Cell viability was measured. Data are presented as means ± SD (n = 3). (C) Full-concentration matrix analyses of U2932 cells treated with IBC and Eto (left), Doxo (middle), or 4-OH-Cyclo at the indicated concentrations for 72 hr. Synergy and antagonism were calculated as described in Figure 1.
Figure 7—figure supplement 1
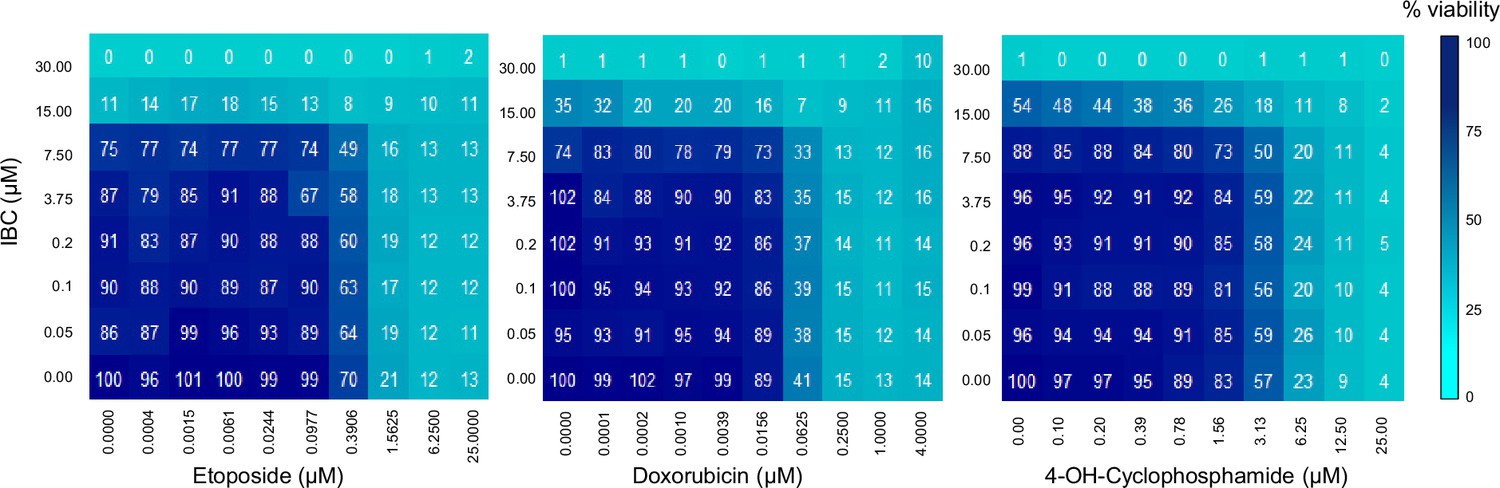
Isobavachalcone (IBC) potentiates the anticancer of chemotherapeutic agents in diffuse large B-cell lymphoma (DLBCL).
U2932 cells were treated with indicated concentrations of etoposide, doxorubicin, or 4-OH-cyclophosphamide in combination with indicated concentrations of IBC for 72 hr. Cell viability was measured. Percentage of cell viability is indicated by the blue gradient in the matrix.
Figure 8

Model of the synergistic action of bakuchiol (BKC) and isobavachalcone (IBC) that kills cancer cells.
By inhibiting the DNA polymerases, BKC enhances the endogenous replication stress (RS) in cancer cells, leading to increased DNA damage. IBC specifically inhibits CHK2 to prevent DNA repair. The combined use of BKC and IBC enhances DNA damage to a level that triggers cancer cell death.
Tables
Key resources table
| Reagent type (species) or resource | Designation | Source or reference | Identifiers | Additional information |
|---|---|---|---|---|
| Cell line (Homo sapiens) | Immortalized BJ fibroblasts | Dr. D. Peeper | The Netherlands Cancer Institute, Amsterdam | Foreskin (normal neonatal mal) |
| Cell line (H. sapiens) | MCF-7 | HTB-22 | ATCC | Mammary gland adenocarcinoma |
| Cell line (H. sapiens) | A549 | CRM-CCL-185 | ATCC | Lung carcinoma |
| Cell line (H. sapiens) | HCC827 | CRL-2868 | ATCC | Lung adenocarcinoma |
| Cell line (H. sapiens) | PC3 | CRL-1435 | ATCC | Prostate adenocarcinoma |
| Cell line (H. sapiens) | DU145 | HTB-81 | ATCC | Prostate carcinoma |
| Cell line (H. sapiens) | U937 | CRL-1593.2 | ATCC | Histiocytic lymphoma |
| Cell line (H. sapiens) | HCT116 | CCL-247 | ATCC | Colorectal carcinoma |
| Cell line (H. sapiens) | OVCAR8 | NIH:OVCAR8 | Ovarian carcinoma | |
| Cell line (H. sapiens) | DLBCL cell lines | Dr. J. Moreaux | Institute of Human Genetics, Montpellier | |
| Cell line (H. sapiens) | SUM159 | SUM159PT | Asterand Bioscience | Triple-negative breast cancer cell line |
| Antibody | Mouse monoclonal anti-BrdU clone B44 | 347580 | BD Biosciences | 1/100 |
| Antibody | Rat monoclonal anti-BrdU clone BU1/75 | ABC117-7513 | Eurobio Abcys | 1/100 |
| Antibody | Mouse monoclonal anti-ssDNA | MAB3868 | Millipore | 1/250 |
| Antibody | Rabbit monoclonal anti-pCHK1 (S345) | 2348 | Cell Signaling | 1/1000 |
| Antibody | Rabbit polyclonal anti-pCHK2 (T68) | 2661 | Cell Signaling | 1/1000 |
| Antibody | Mouse monoclonal anti-γ-H2AX (S139) | 05-636 | Millipore | 1/500 |
| Antibody | Mouse monoclonal anti-actin | A4700 | Sigma | 1/500 |
| Antibody | Rabbit monoclonal anti-RPA1 | Ab79398 | Abcam | 1/300 |
| Antibody | Rabbit polyclonal anti-TBP | 8515 | Cell Signaling | 1/1000 |
| Antibody | Mouse monoclonal anti-CHK1 | 2360 | Cell Signaling | 1/1000 |
| Antibody | Rabbit polyclonal anti-pRPA32 (S4/S8) | A300-245A | Bethyl | 1/1000 |
| Antibody | Rabbit monoclonal anti-CHK2 | ab109413 | Abcam | 1/5000 |
| Antibody | Goat polyclonal Anti-RPA2 | A303-874 | Bethyl | 1/500 |
| Antibody | Rabbit polyclonal anti-pCHK2 (S516) | 2669 | Cell Signaling | 1/1000 |
| Antibody | Rabbit polyclonal anti-pChk1 (S296) | 2349 | Cell Signaling | 1/1000 |
| Antibody | Mouse monoclonal anti-pBRCA1 (S988) | sc-166793 | Santa Cruz | 1/200 |
| Antibody | Rabbit polyclonal anti-RAD51 | PC130 | Millipore | 1/500 |
| Antibody | Rabbit polyclonal anti-pAKT (S473) | 9271 | Cell Signaling | 1/1000 |
Additional files
Download links
A two-part list of links to download the article, or parts of the article, in various formats.
Downloads (link to download the article as PDF)
Open citations (links to open the citations from this article in various online reference manager services)
Cite this article (links to download the citations from this article in formats compatible with various reference manager tools)
Synergistic effect of inhibiting CHK2 and DNA replication on cancer cell growth
eLife 13:RP104718.
https://doi.org/10.7554/eLife.104718.2


