Cell type-specific driver lines targeting the Drosophila central complex and their use to investigate neuropeptide expression and sleep regulation
- Janelia Research Campus, Howard Hughes Medical Institute, United States
- Department of Psychology, College of Science, California State University, United States
Figures
Figure 1
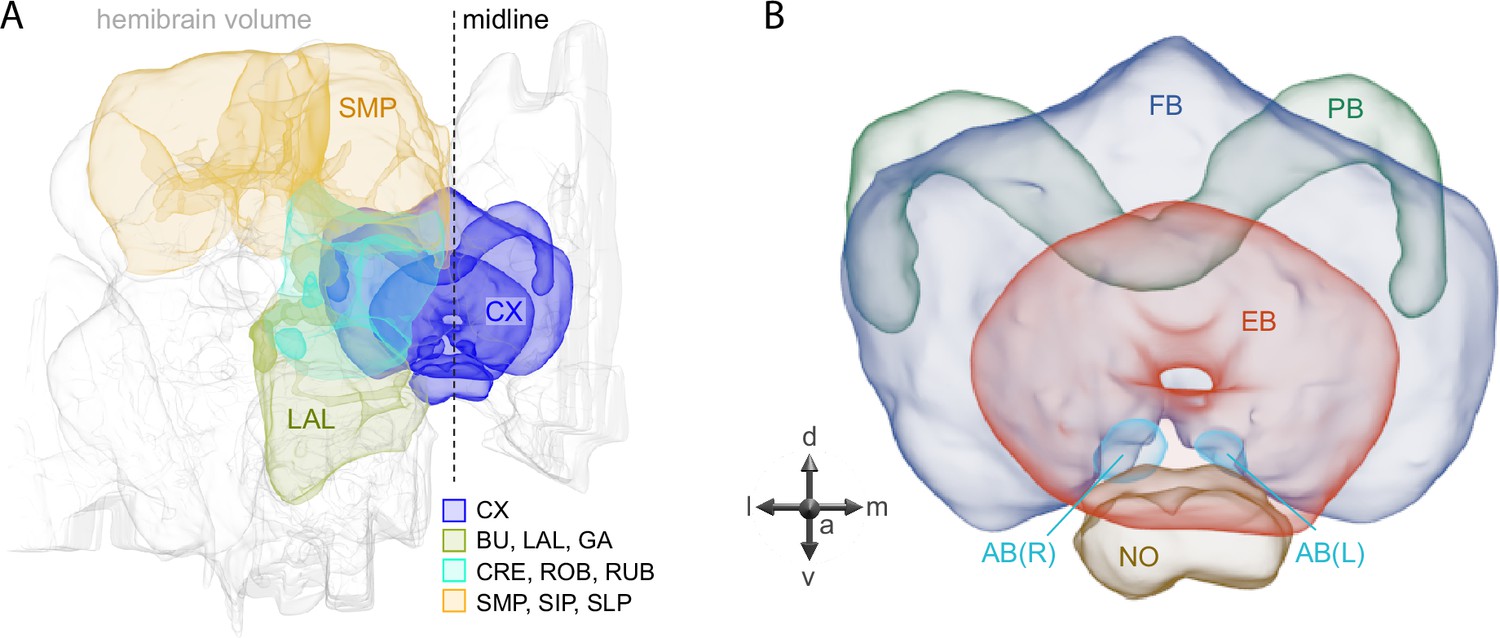
Schematic diagram of CX neuropils.
(A) The brain areas included in the hemibrain connectome are shown with the CX and key connected brain areas highlighted. (B) The neuropils comprising the CX are shown: FB, fan-shaped body; PB, protocerebral bridge; EB, ellipsoid body; NO, noduli; and AB, asymmetrical body. Redrawn from Hulse et al., 2021.
Figure 2 with 4 supplements
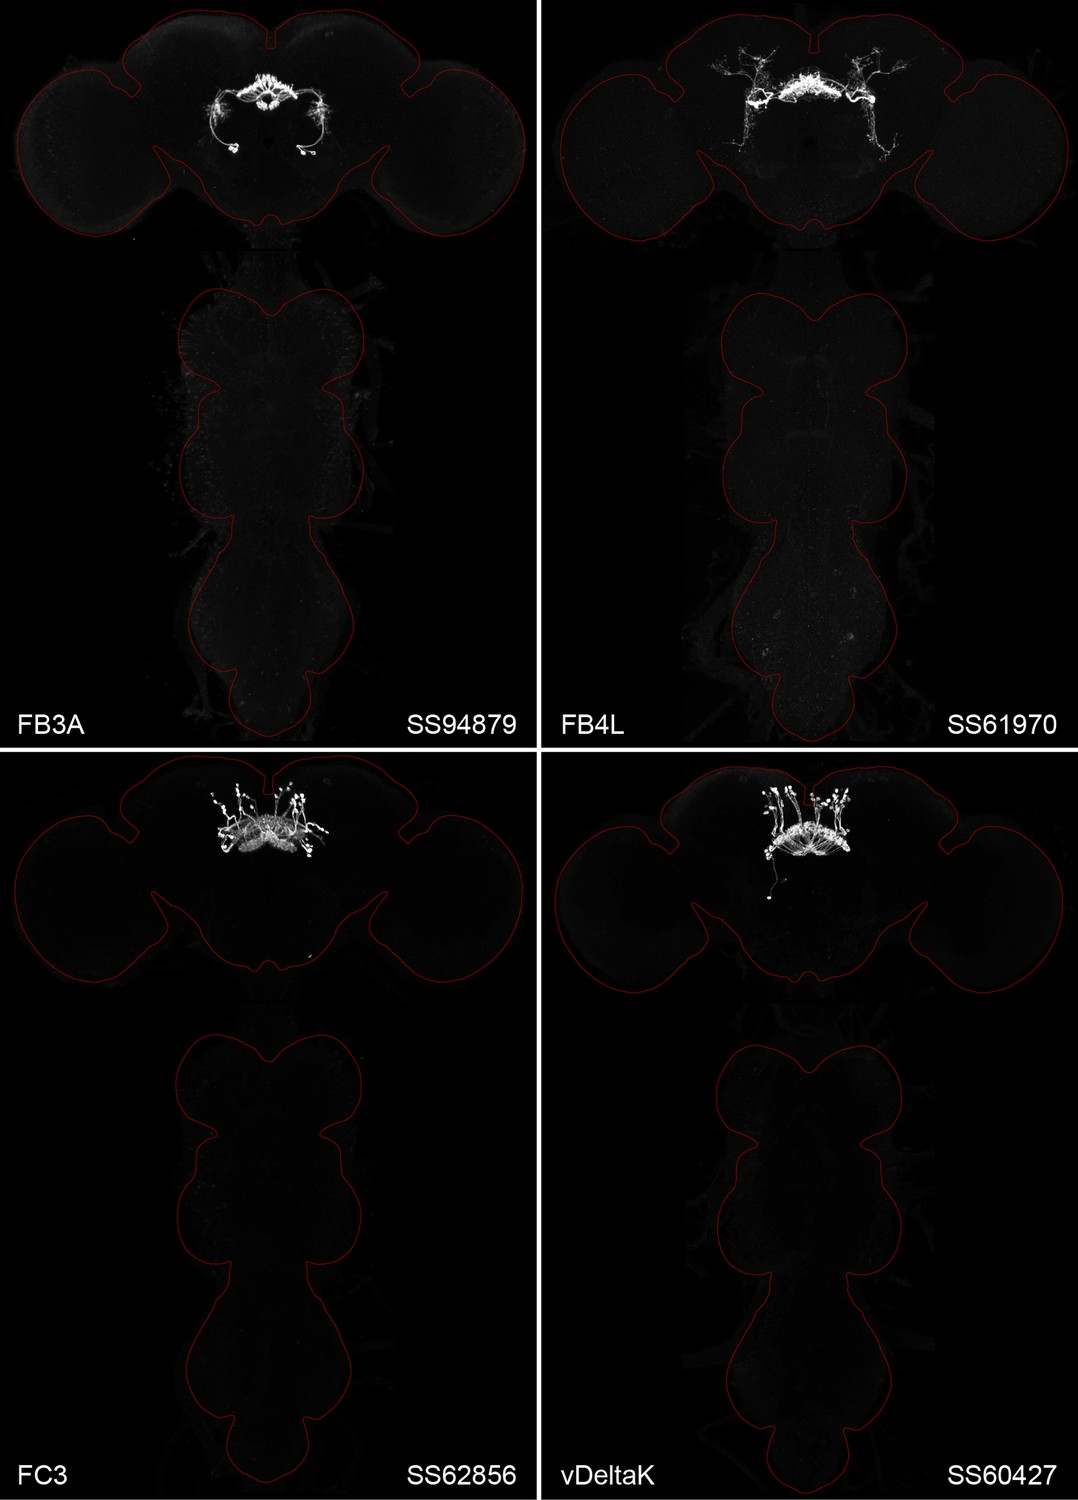
Maximum intensity projections (×20 confocal images) of the expression patterns driven by four stable split-GAL4 lines for the indicated cell types.
The brain and VNC are outlined in red. Original confocal stacks that include a neuropil reference channel can be downloaded from https://www.janelia.org/split-gal4. Similar images for 48 additional lines generated as part of this study are shown in Figure 2—figure supplements 1–4. Figure 2—source data 1 contains additional information on all the split-GAL4 lines we characterized.
-
Figure 2—source data 1
Table of split-GAL4 lines organized by CX structure and cell type.
- https://cdn.elifesciences.org/articles/104764/elife-104764-fig2-data1-v1.xlsx
Figure 2—figure supplement 1
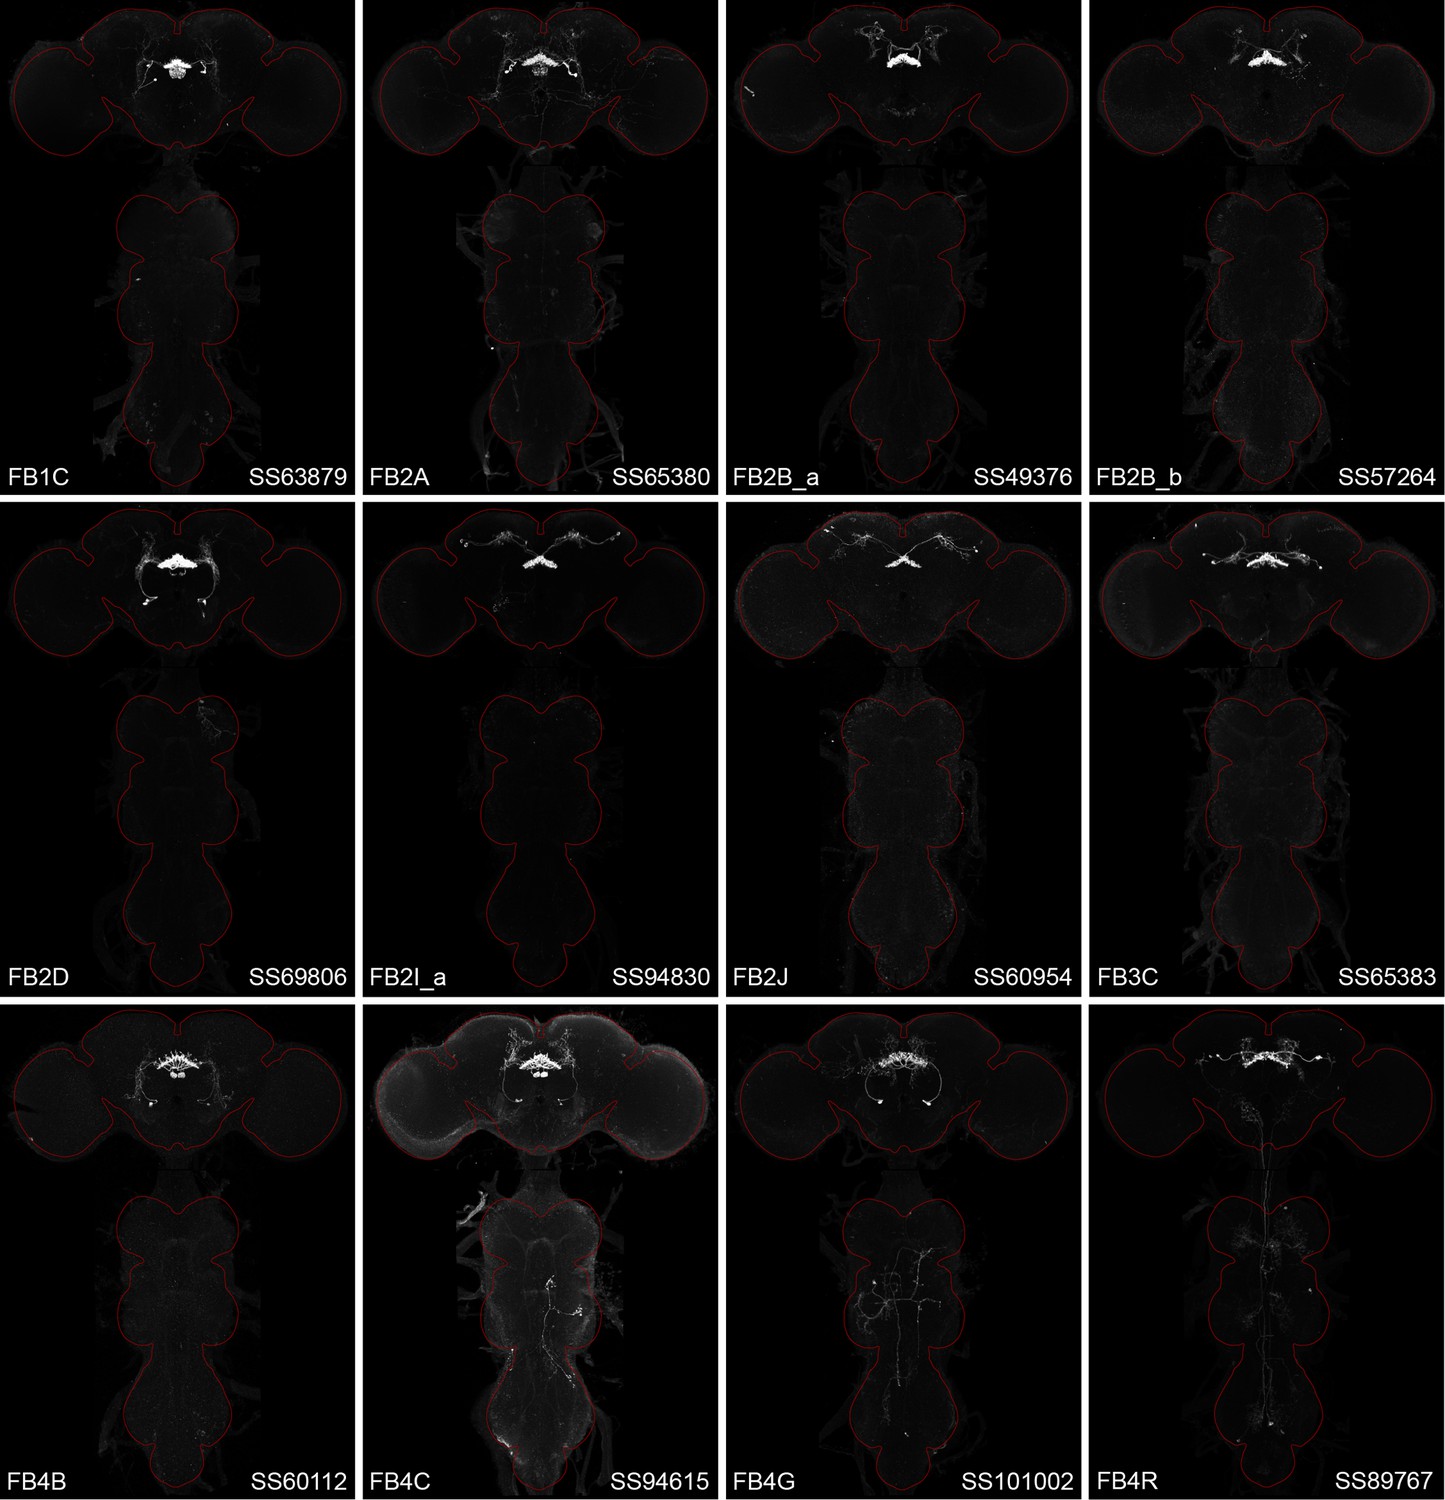
Maximum intensity projections (×20 confocal images) of the expression patterns driven by stable split-GAL4 lines for the indicated 12 cell types.
The brain and VNC are outlined in red. Original confocal stacks that include a neuropil reference channel can be downloaded from https://www.janelia.org/split-gal4.
Figure 2—figure supplement 2
Maximum intensity projections (×20 confocal images) of the expression patterns driven by stable split-GAL4 lines for the indicated 12 cell types.
The brain and VNC are outlined in red. Original confocal stacks that include a neuropil reference channel can be downloaded from https://www.janelia.org/split-gal4.
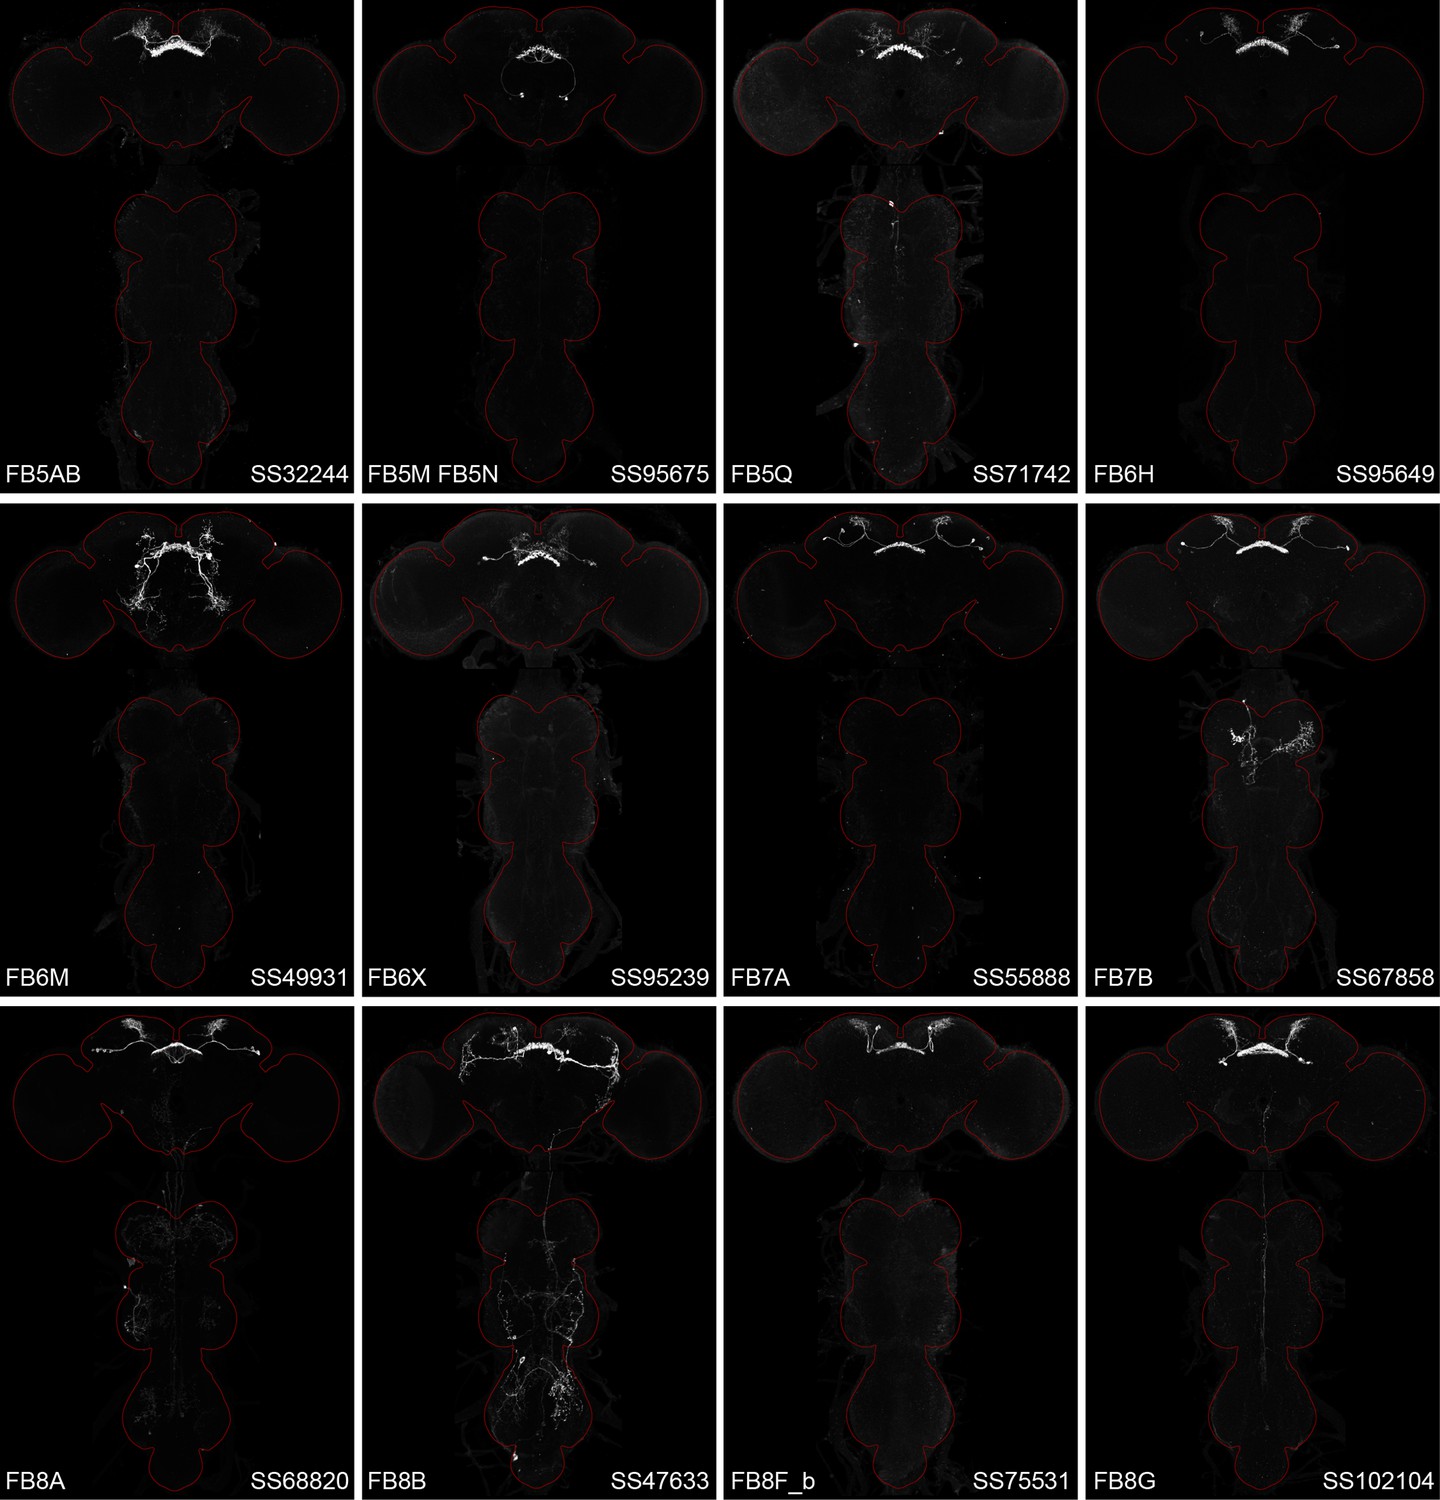
Figure 2—figure supplement 3
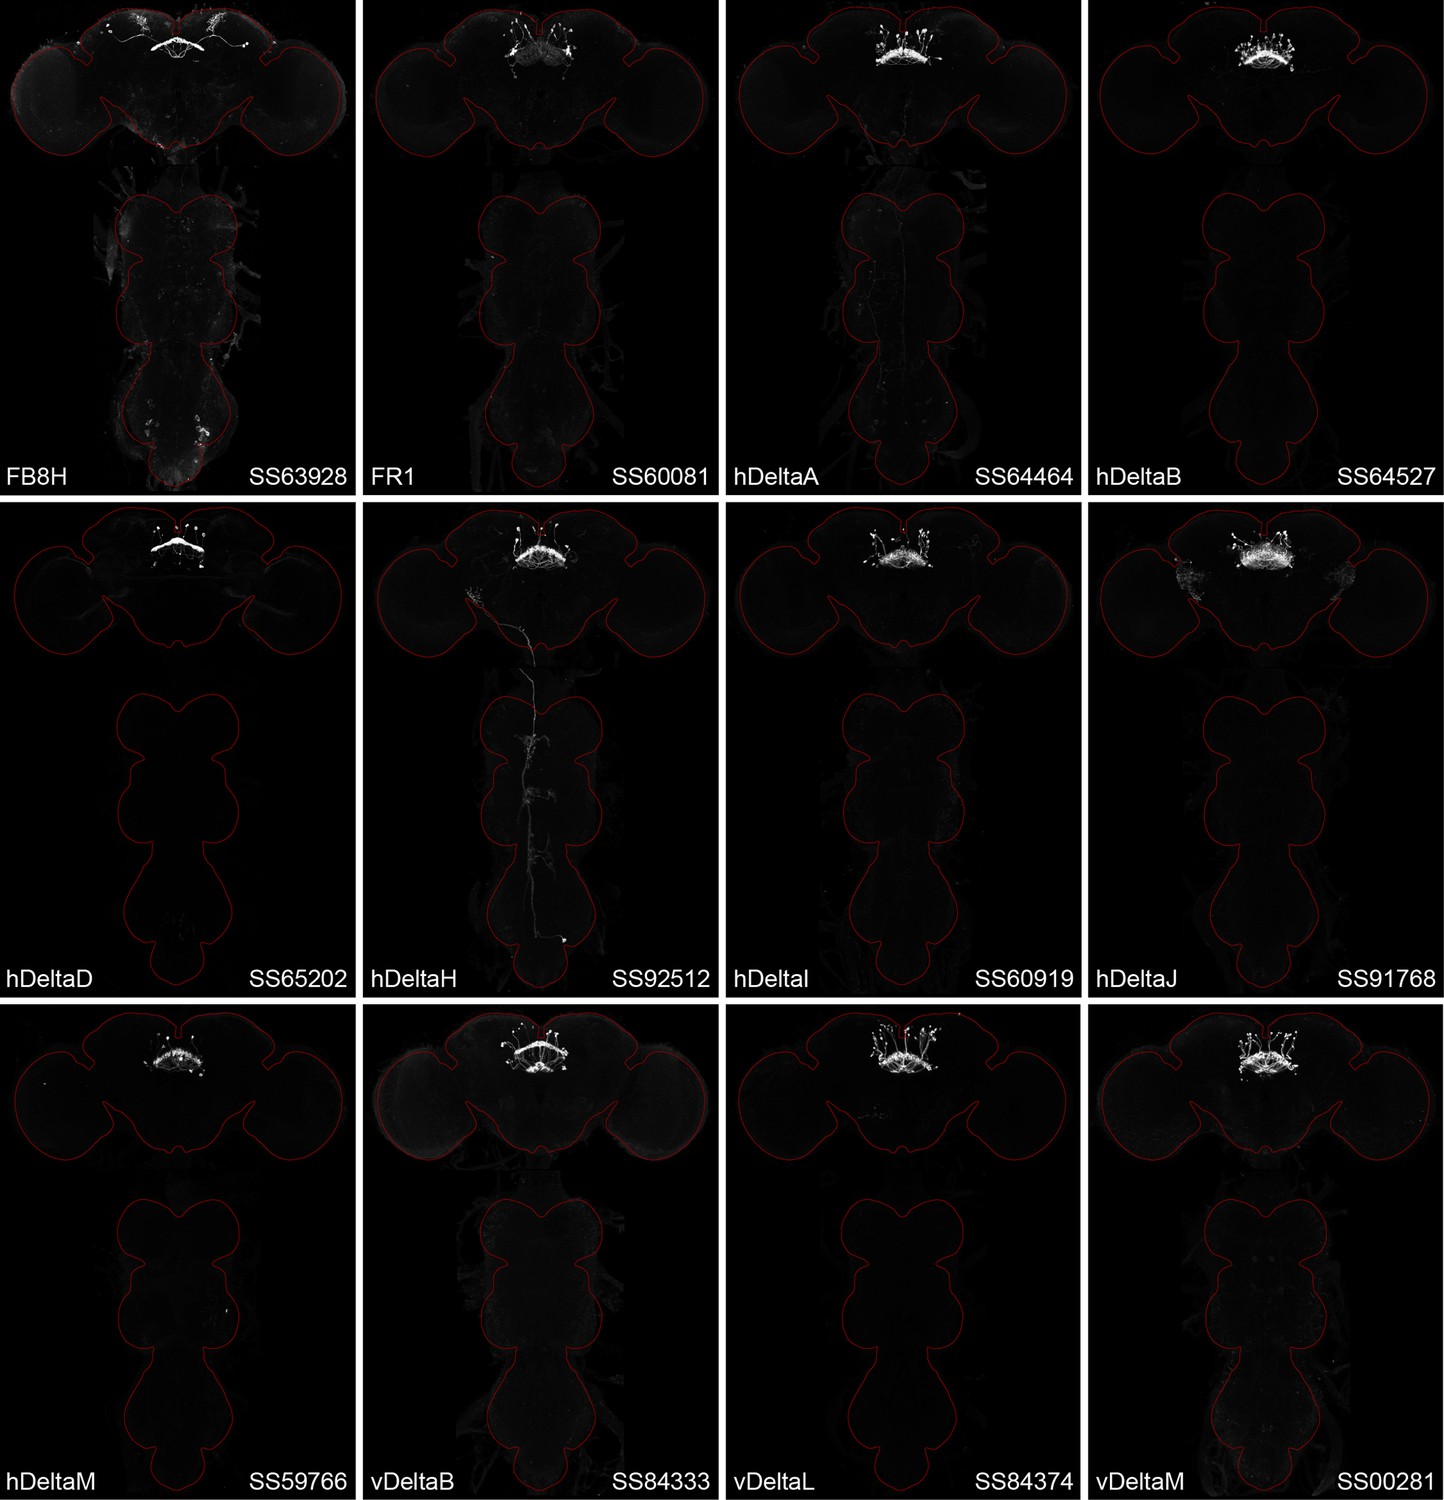
Maximum intensity projections (×20 confocal images) of the expression patterns driven by stable split-GAL4 lines for the indicated 12 cell types.
The brain and VNC are outlined in red. Original confocal stacks that include a neuropil reference channel can be downloaded from https://www.janelia.org/split-gal4.
Figure 2—figure supplement 4
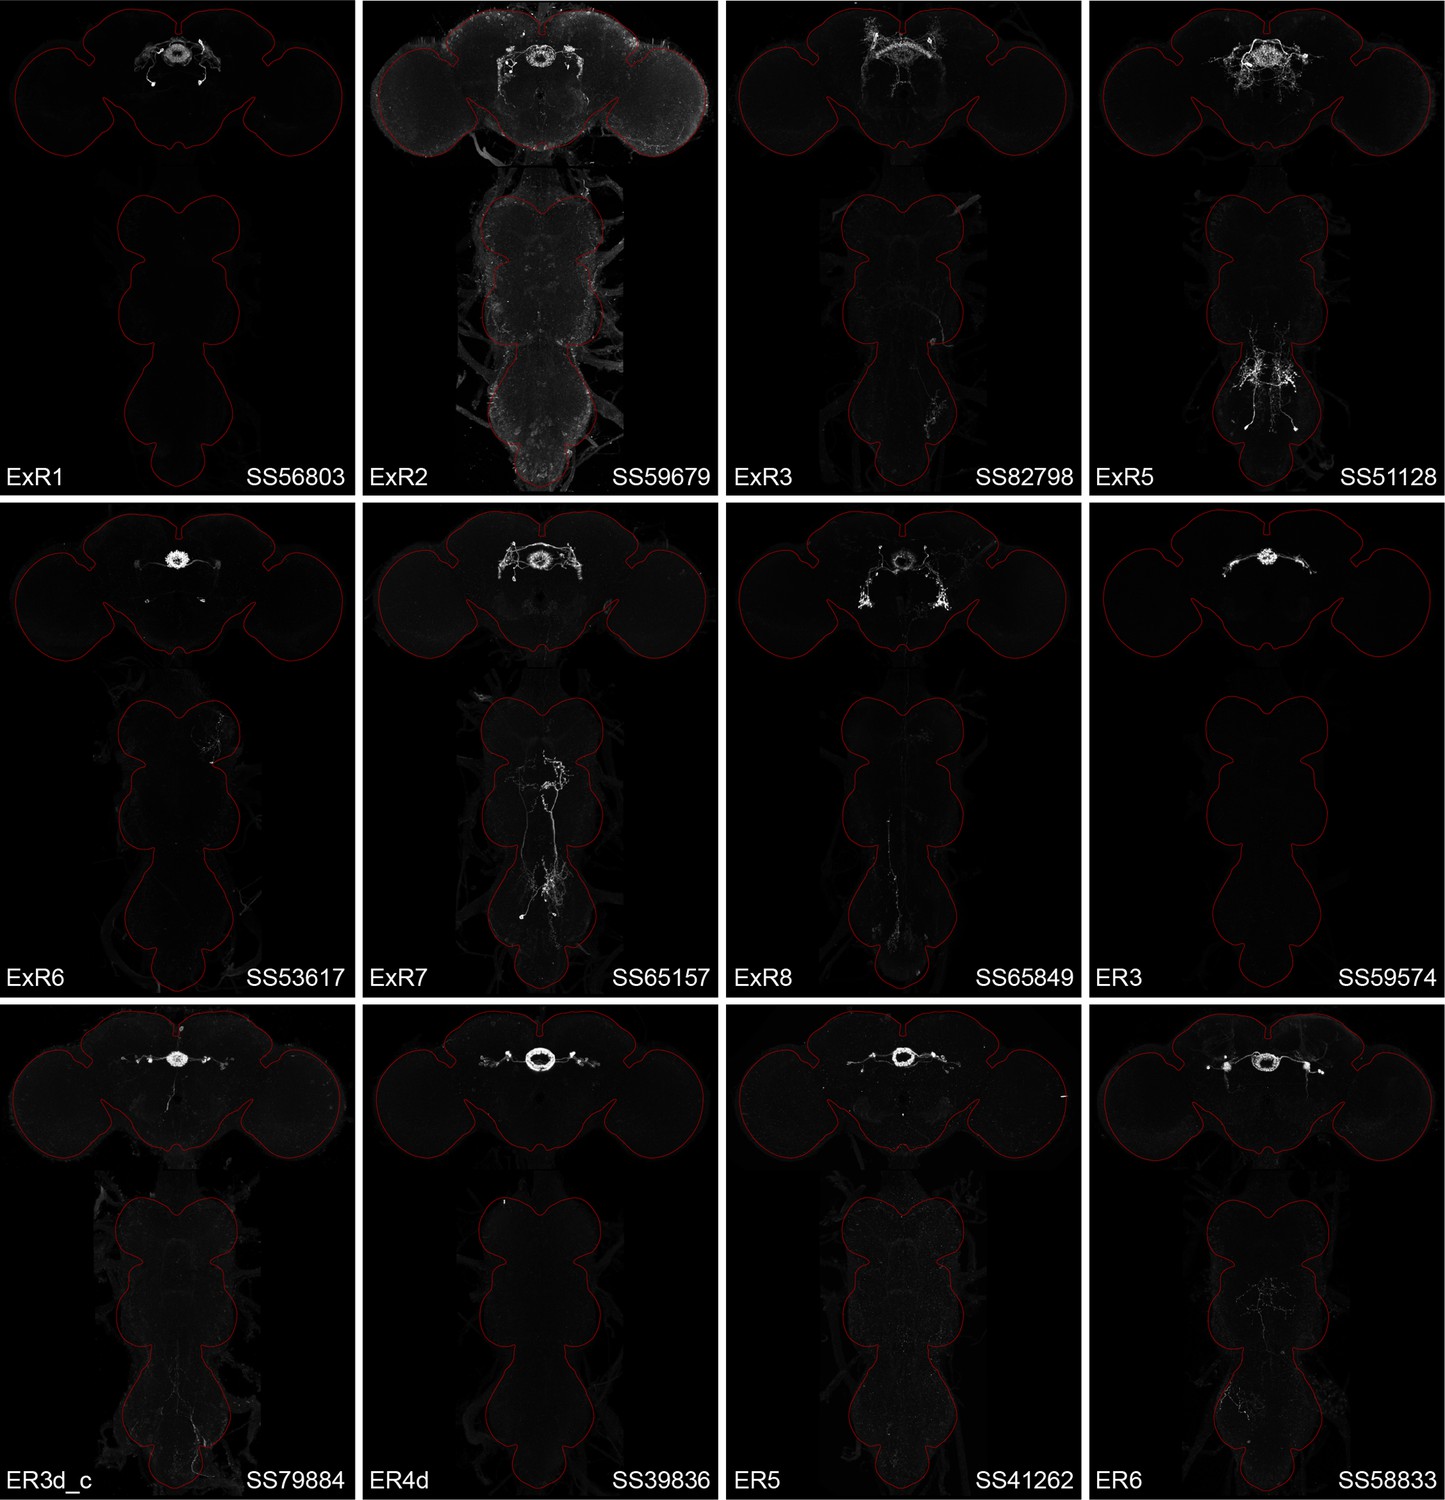
Maximum intensity projections (×20 confocal images) of the expression patterns driven by stable split-GAL4 lines for the indicated 12 cell types.
The brain and VNC are outlined in red. Original confocal stacks that include a neuropil reference channel can be downloaded from https://www.janelia.org/split-gal4.
Figure 3 with 1 supplement
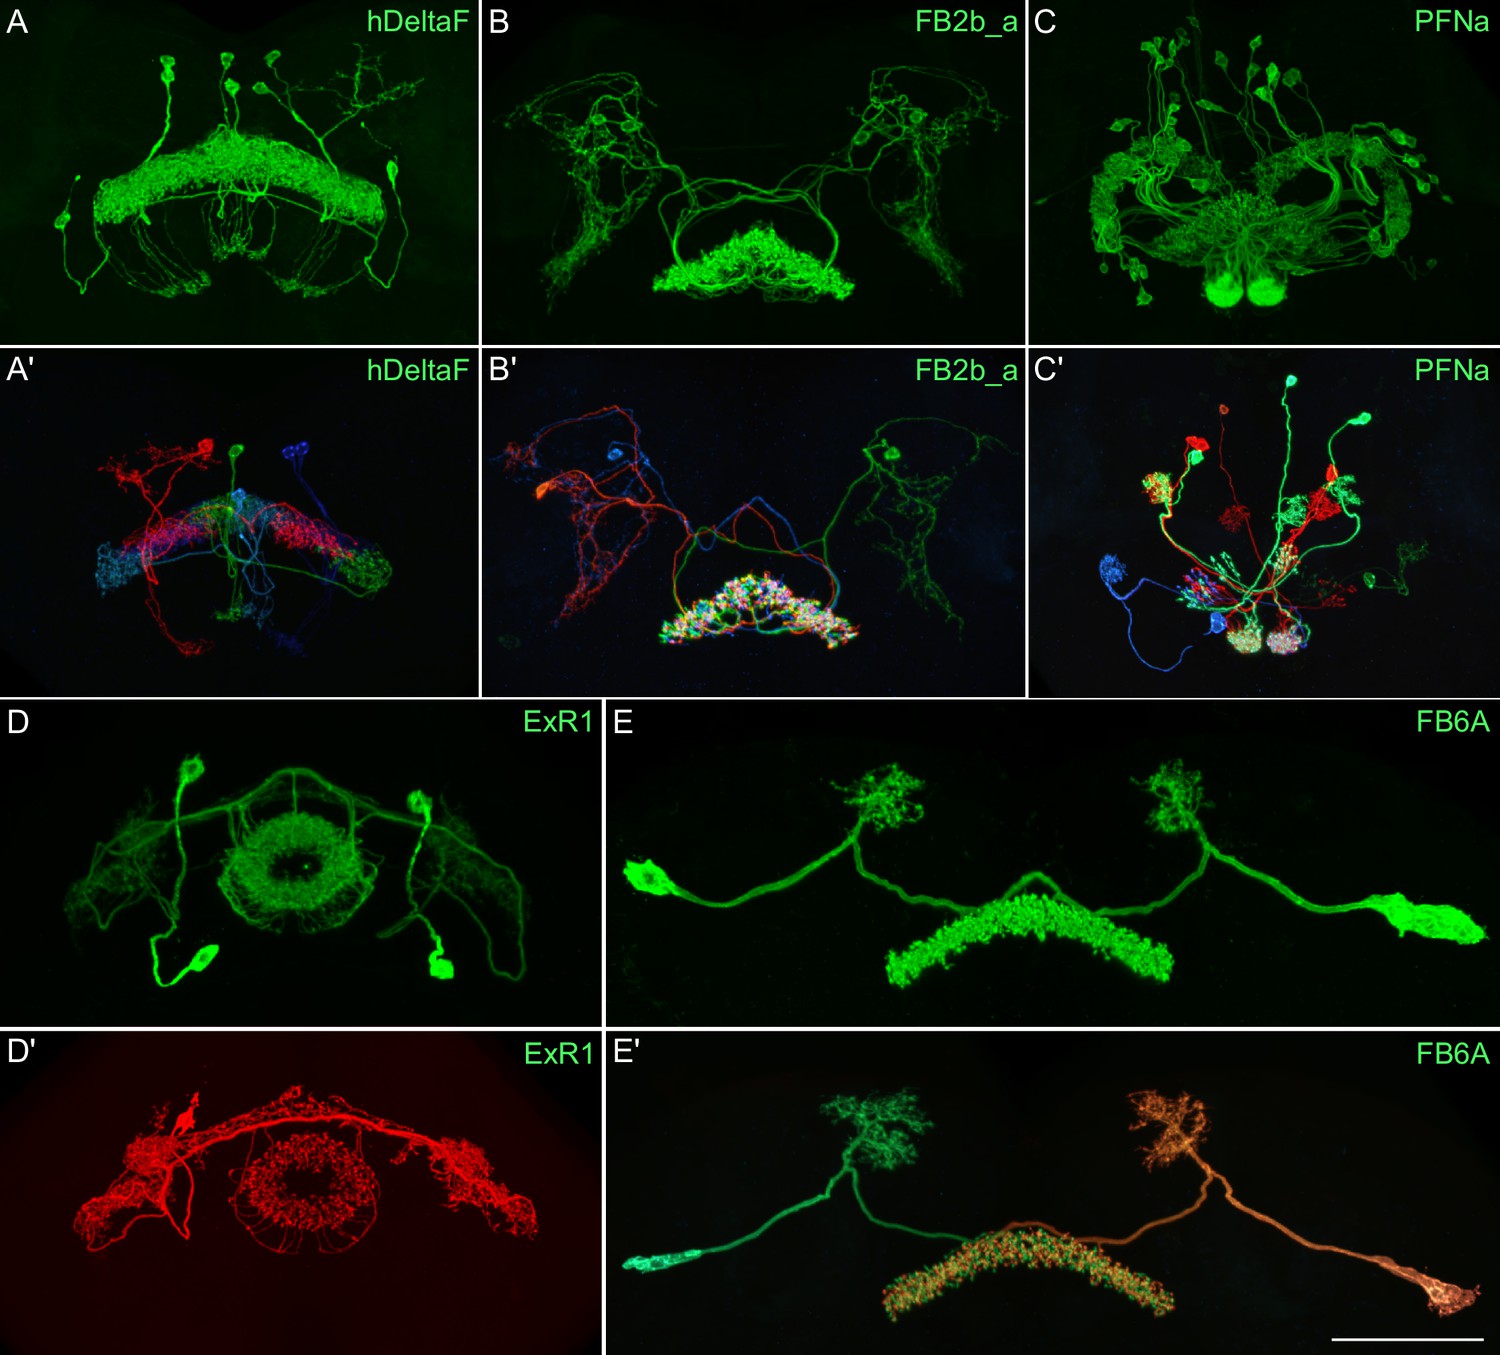
Visualization of the entire expression pattern of a split-GAL4 line for the indicated five cell types revealed using UAS-myrGFP (A–E).
A subset of individual cells within those same cell types (A′–E′) are revealed by stochastic labeling using the MCFO method (Nern et al., 2015). The scale bar in E′ refers to all panels and = 50 μm. Images are maximum intensity projections (MIPs). Stable split lines used were as follows: A, SS54903; A′, SS53683; B and B′, SS49376; C and C′, SS02255; D, SS56684; D′, SS56803; E and E′, SS57656. The original confocal image stacks from which these images were taken are available at https://www.janelia.org/split-GAL4.
Figure 3—figure supplement 1
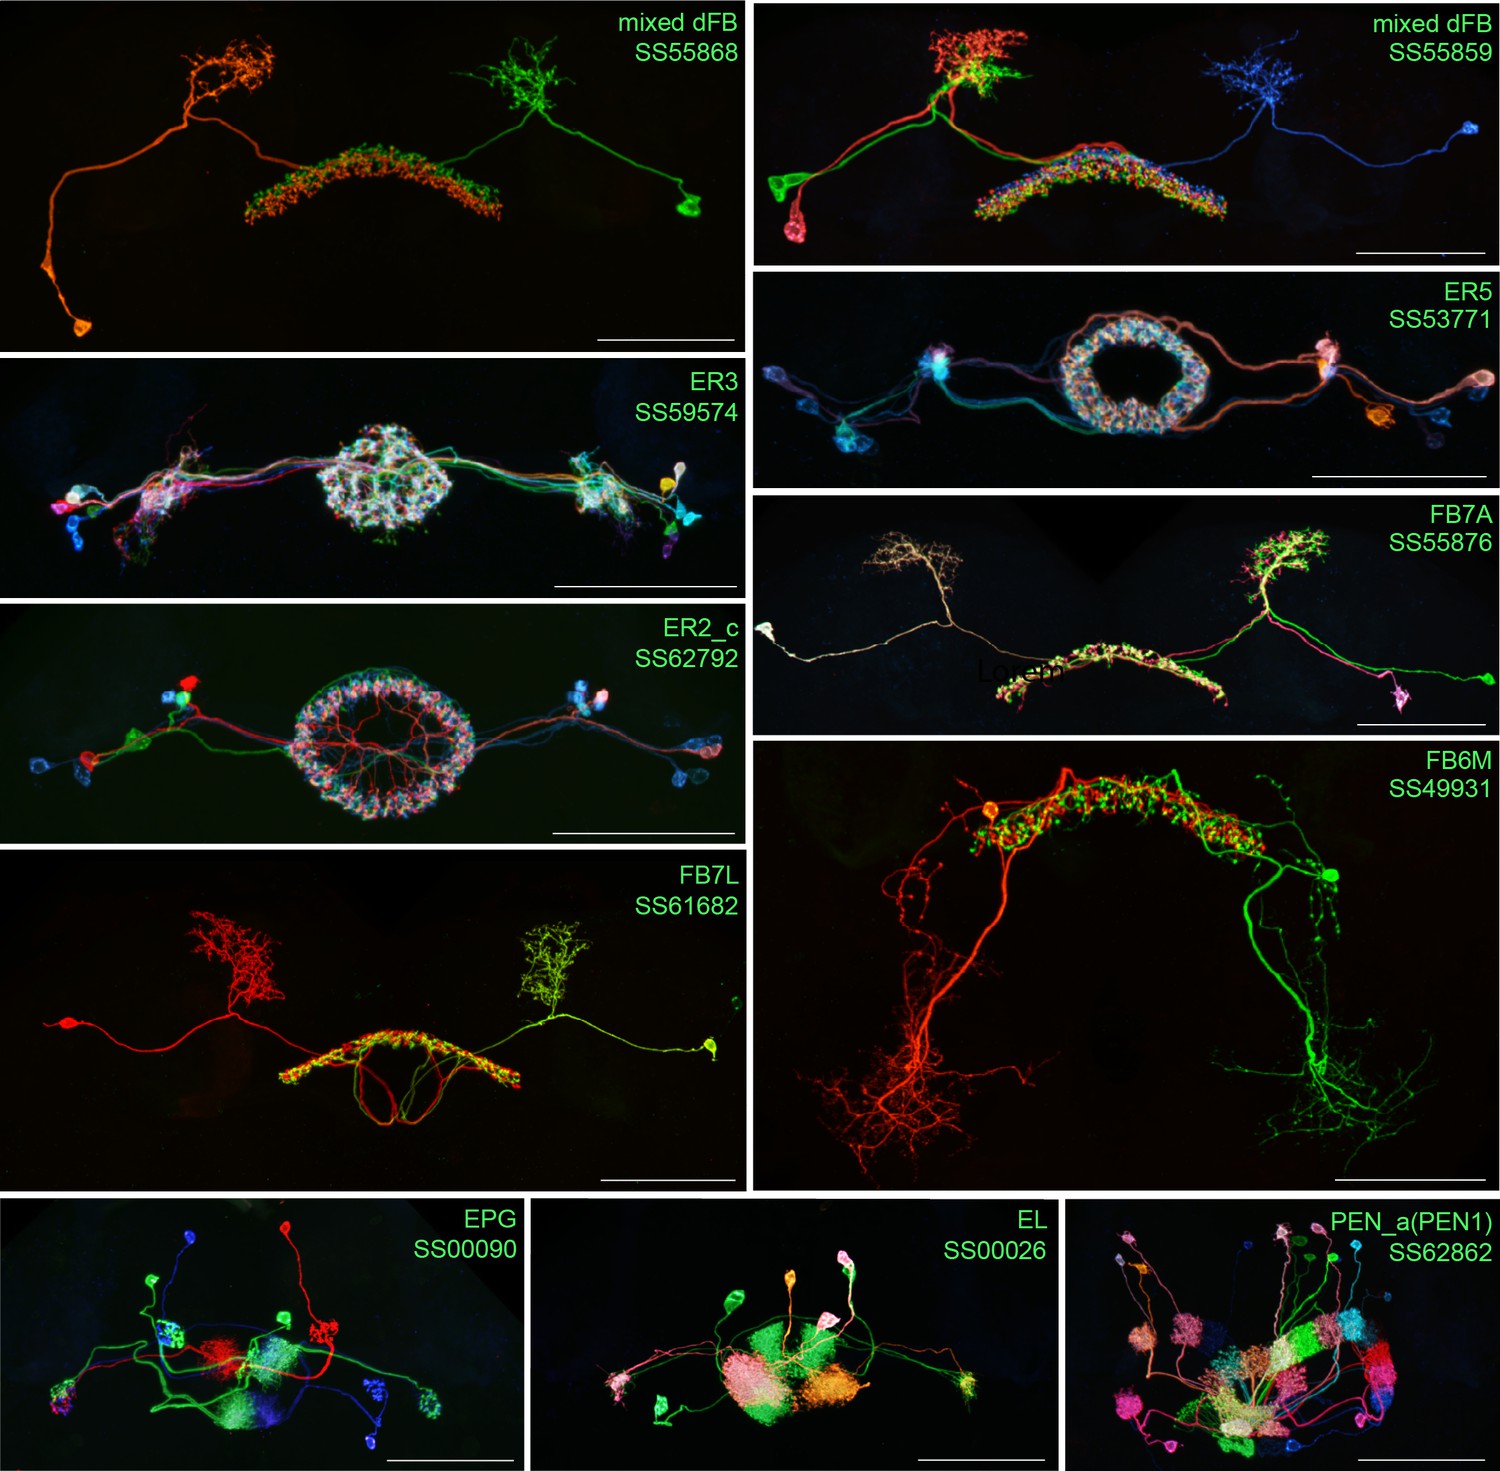
Individual cell morphologies revealed by stochastic labelling.
Individual cells within the indicated cell types revealed by stochastic labeling using the MCFO method (Nern et al., 2015) with the indicated split-GAL4 lines. Images are MIPs. Scale bars = 50 μm.
Figure 4
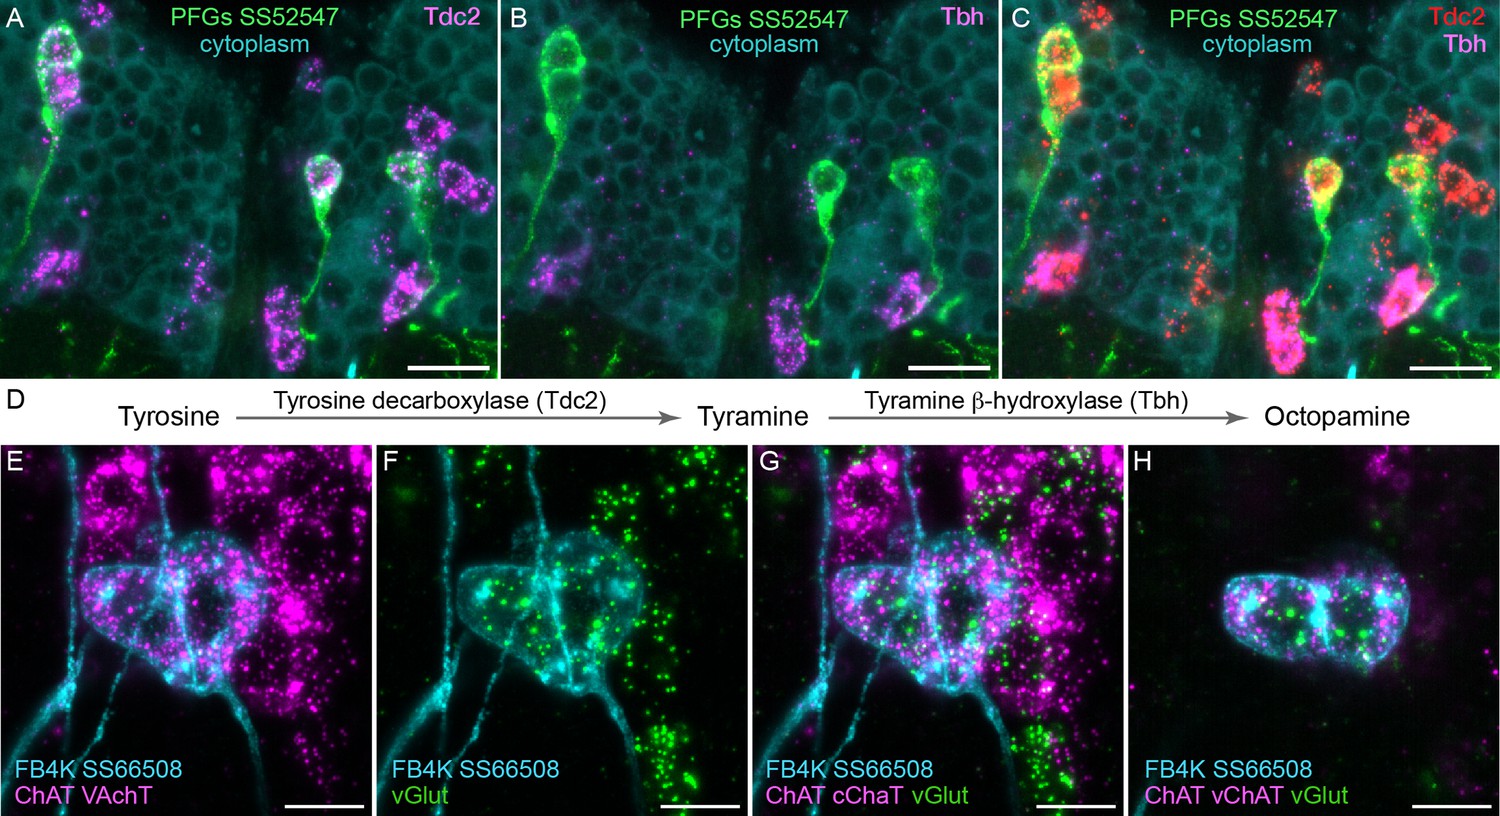
Using EASI-FISH to assess neurotransmitter expression.
(A–C) Expression of the transcripts encoding key enzymes required to synthesize tyramine (Tdc2) and octopamine (Tbh) has been examined as indicated. PFG neurons were marked by the split-GAL4 line SS52547 together with UAS-myr-GFP and visualized by anti-GFP antibody staining. Brains were treated with DNAse1 and counterstained with high concentrations of DAPI to reveal total RNA in the cytoplasm. PFG cell bodies show expression of Tdc2 but not Tbh indicating that the PFG neurons use tyramine as a neurotransmitter. Maximum intensity projections (MIPs) of substacks are shown. (D) Biochemical pathway for synthesis of tyramine and octopamine from tyrosine. (E–H) Evidence for co-expression of the neurotransmitters acetylcholine and glutamate in FB4K. EASI-FISH was carried out using probes against choline acetyltransferase (ChAT) and vesicular acetylcholine transporter (VAChT) and vesicular glutamate transporter (vGlut) as indicated. The fan-shaped body tangential neuron FB4K has been visualized using the split-GAL4 line SS66508. Panels G and H show two different substacks at different Z-depths through the same neurons. Scale bar in each panel = 10 μm.
Figure 5 with 1 supplement
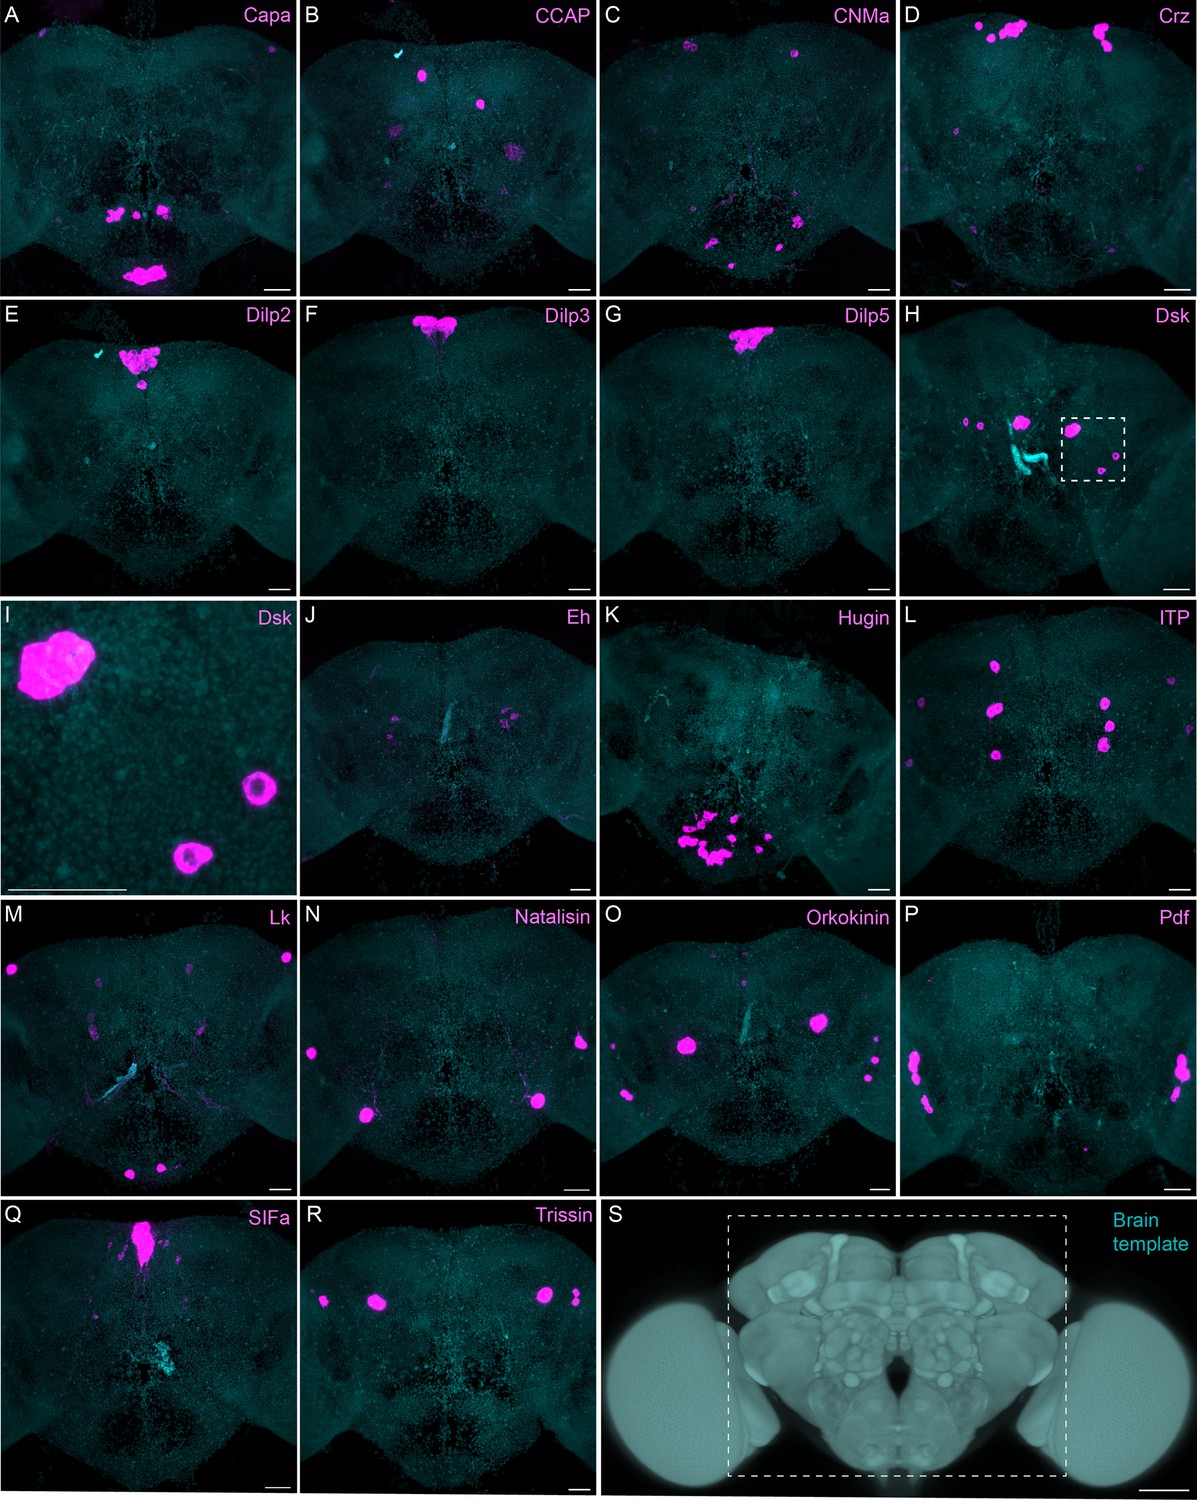
Sparsely expressed neuropeptide genes.
(A-R) EASI-FISH was used to examine the expression of the indicated neuropeptide genes in the central brain (this brain area is shown as dashed box inS). Samples were counterstained with DAPI to visualize the outline of brain tissue. Images are MIPs. A higher magnification view of a region of the brain showing Dsk expression (indicated by dashed box in H) is shown in I. Scale bar in each panel = 50 μm; note that the images shown are from brains that were expanded by about a factor of two during the EASI-FISH procedure.
Figure 5—figure supplement 1
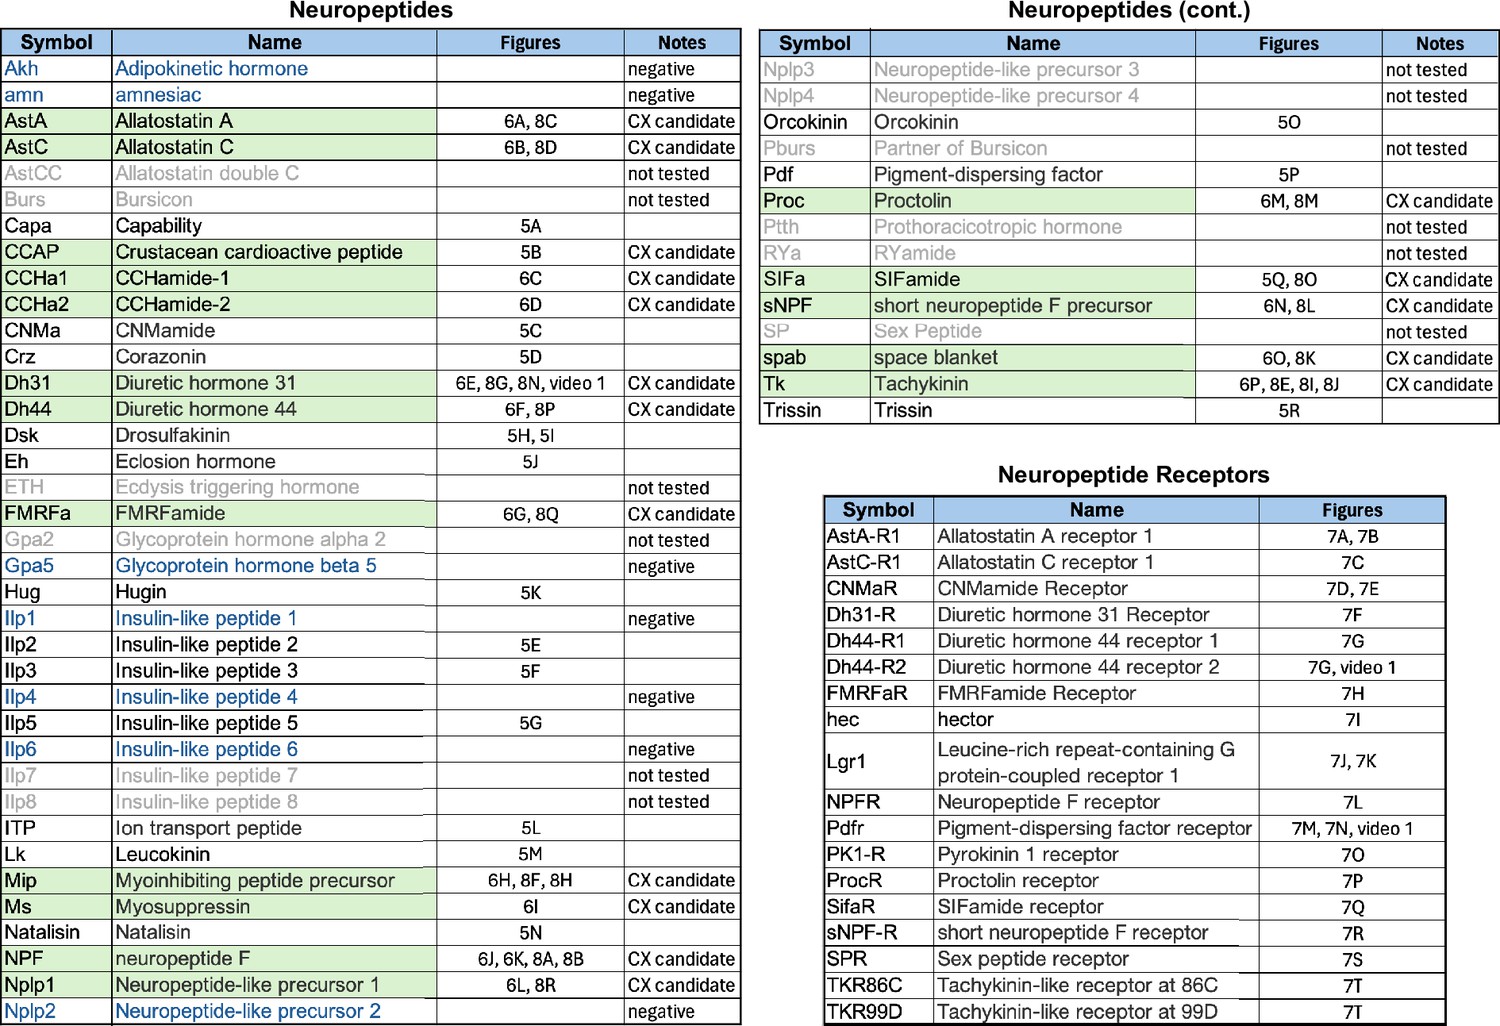
Neuropeptides and neuropeptide receptor genes whose expression patterns were characterized by the EASI-FISH experiments shown in Figures 5—8.
Relevant figure panels are listed. Some predicted neuropeptides were not tested because of lack of evidence for their expression in adult brain and are shown in gray font and listed as ‘not tested’ in the Notes column. Neuropeptides shaded in green were tested against split-GAL4 lines with expression in CX cell types (see Figures 8 and 9) based on their cell body positions being in the same brain areas as those of CX cell types. These are listed as ‘CX candidate’ in the Notes column. Those neuropeptides shown in blue font were tested in adult brains, but expression was not detected.; these are listed as ‘negative’ in the Notes column. Lines for which the Notes column is blank were detected in the adult brain but were not chosen for screening against split-GAL4 lines based on the position of their cell bodies.
Figure 6
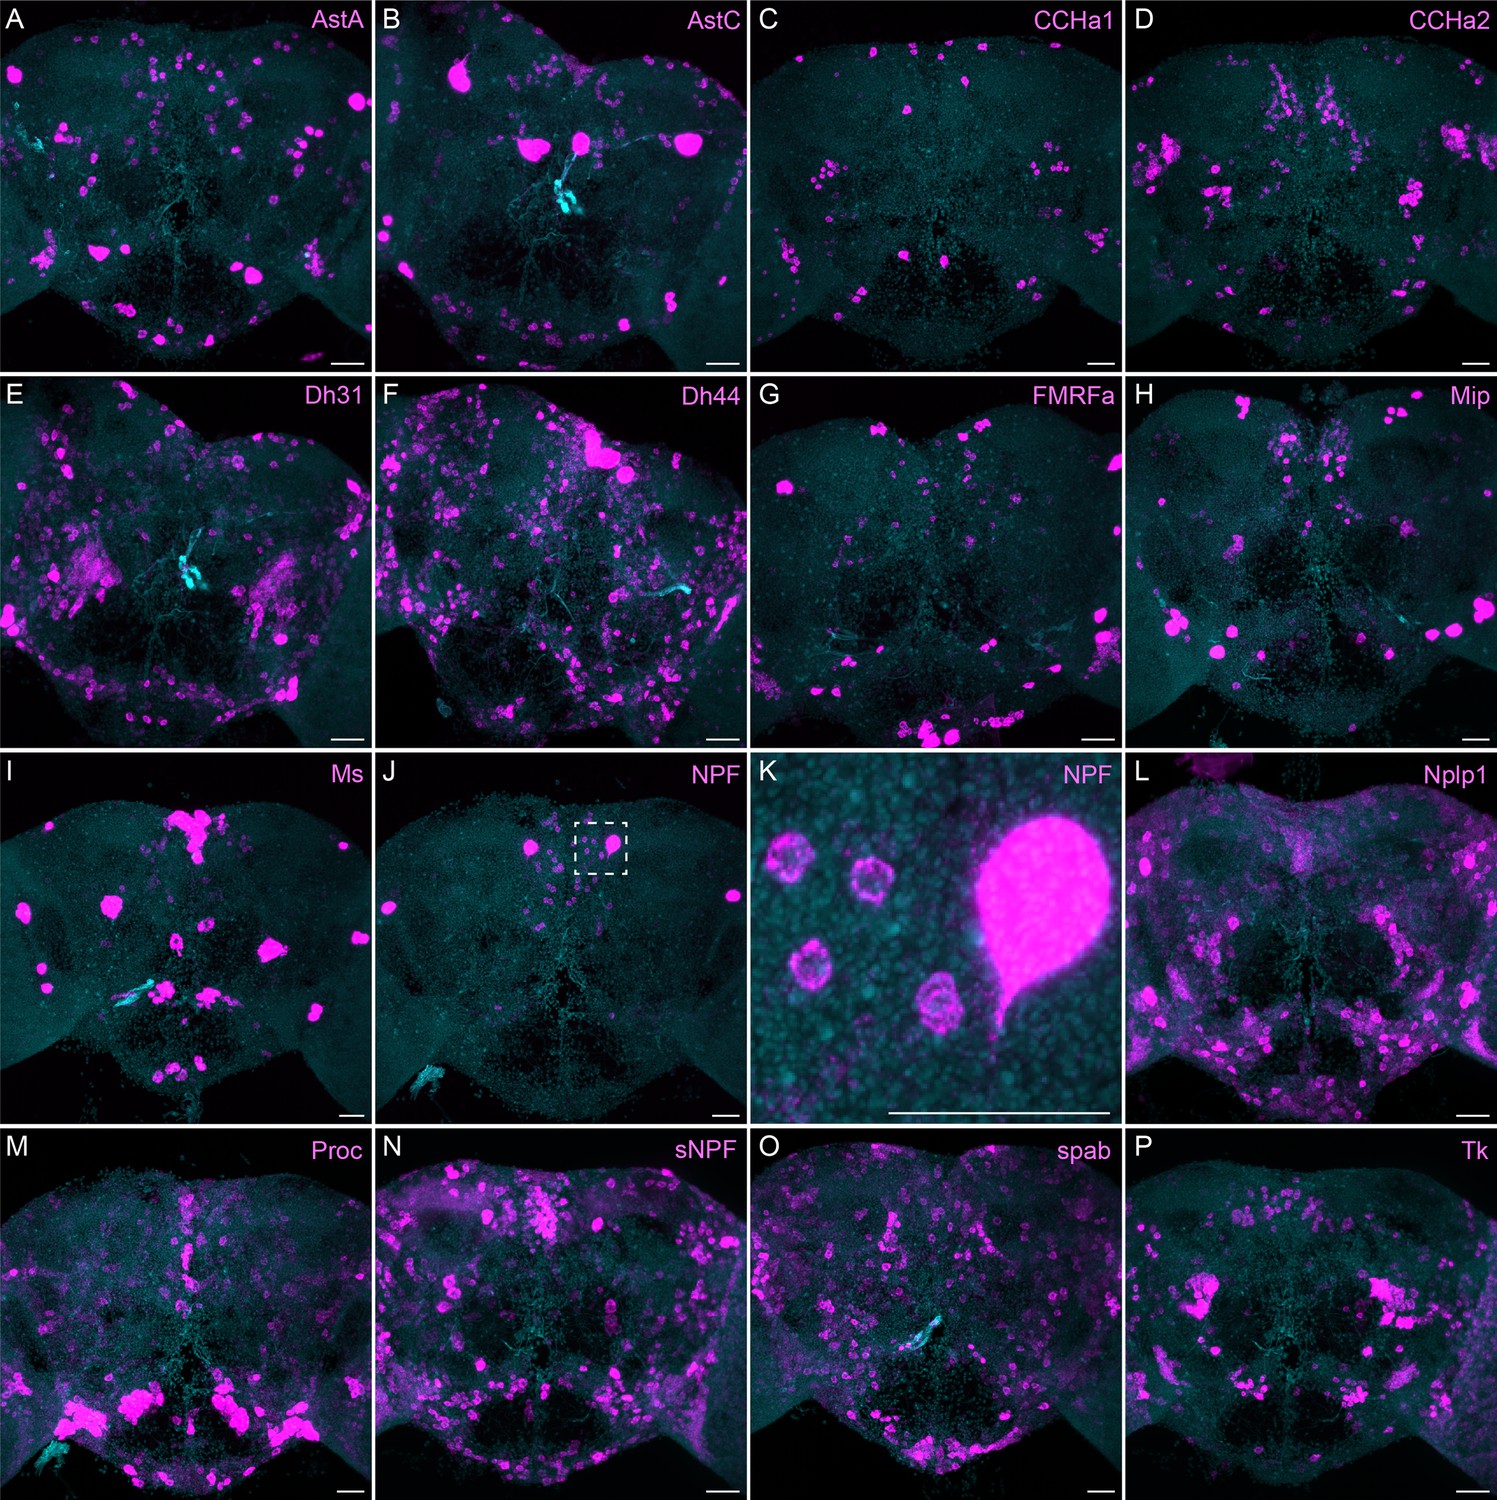
More broadly expressed neuropeptide genes.
(A-P) EASI-FISH was used to examine the expression of the indicated neuropeptide genes in the central brain. Samples were counterstained with DAPI to visualize the outline of brain tissue. Images are MIPs. We included spab and Nplp1 in our screening although it is unclear whether these are indeed neuropeptides (M. Zandawala, pers. comm.). A higher magnification view of a region of the brain showing NPF expression (indicated by area enclosed by the dashed box in J) is shown in K. Scale bar in each panel = 50 μm; note that the images shown are from brains that were expanded by about a factor of two during the EASI-FISH procedure.
Figure 7
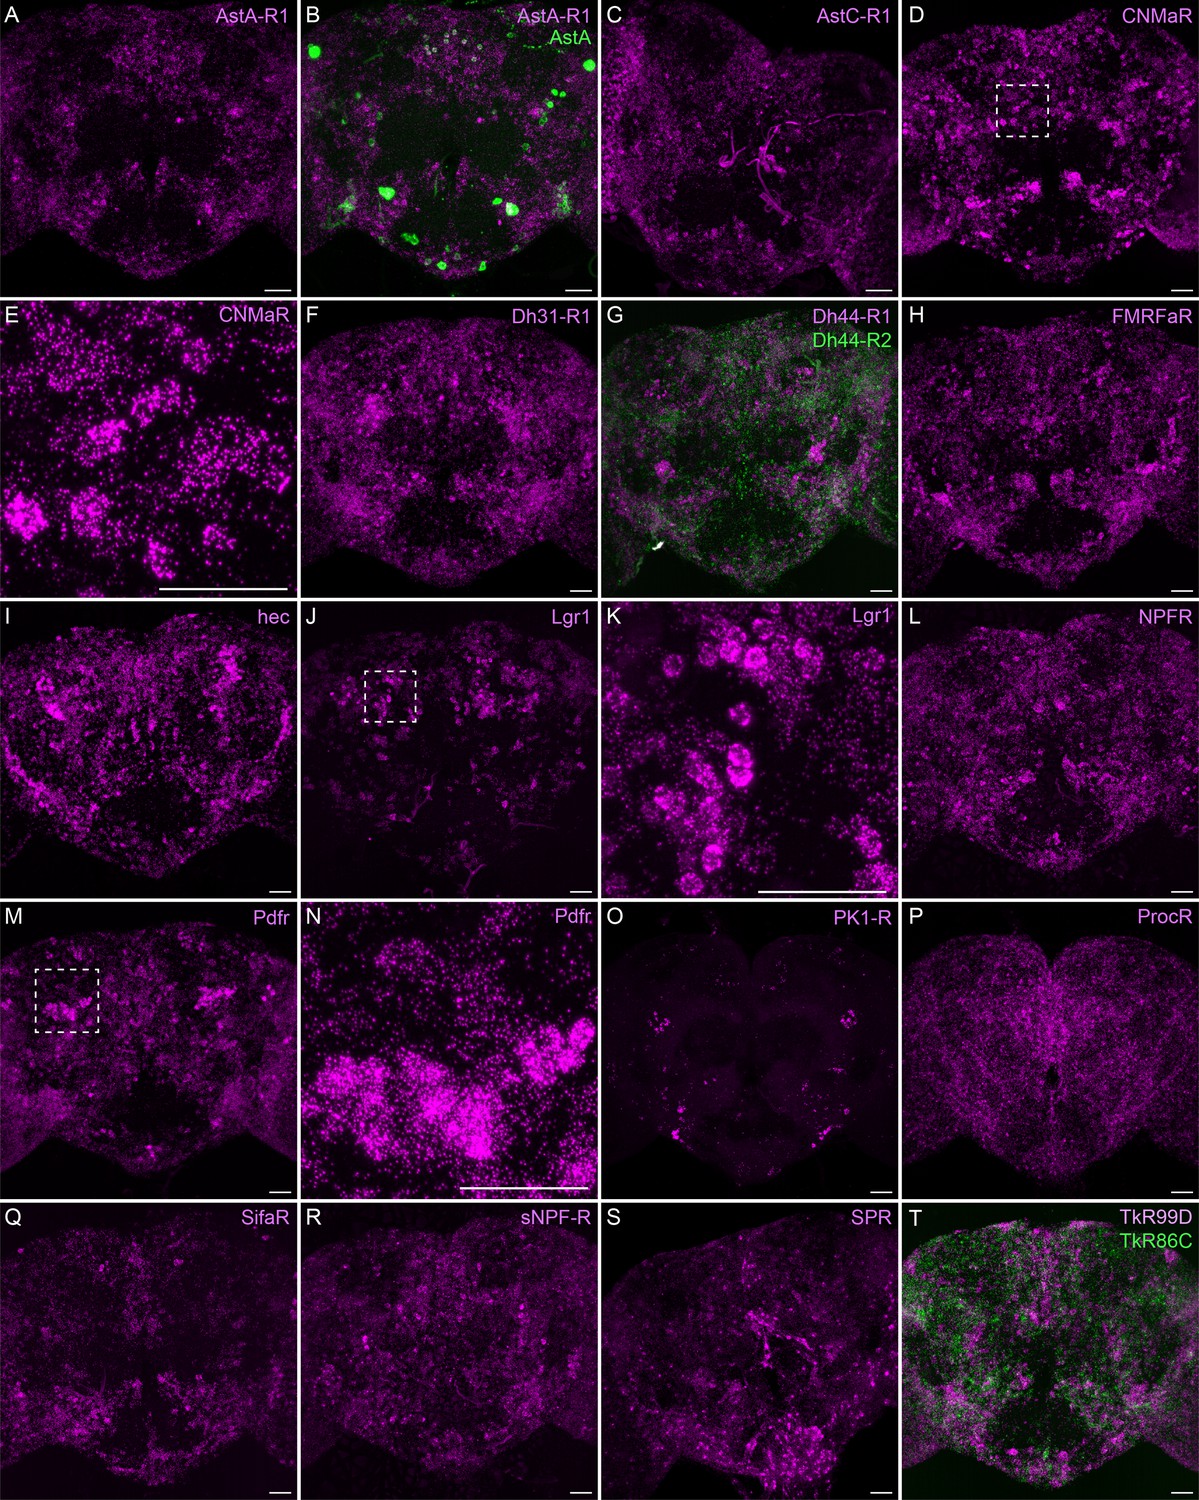
Neuropeptide receptor gene expression.
(A-T) EASI-FISH was used to examine the expression of the indicated neuropeptide genes in the central brain. Higher magnification views of regions of the brains shown in D, J, and M (indicated by dashed boxes) are shown in E, K, and N. Images are MIPs. Scale bar in each panel = 50 μm; note that the images shown are from brains that were expanded by about a factor of two during the EASI-FISH procedure.
Figure 8
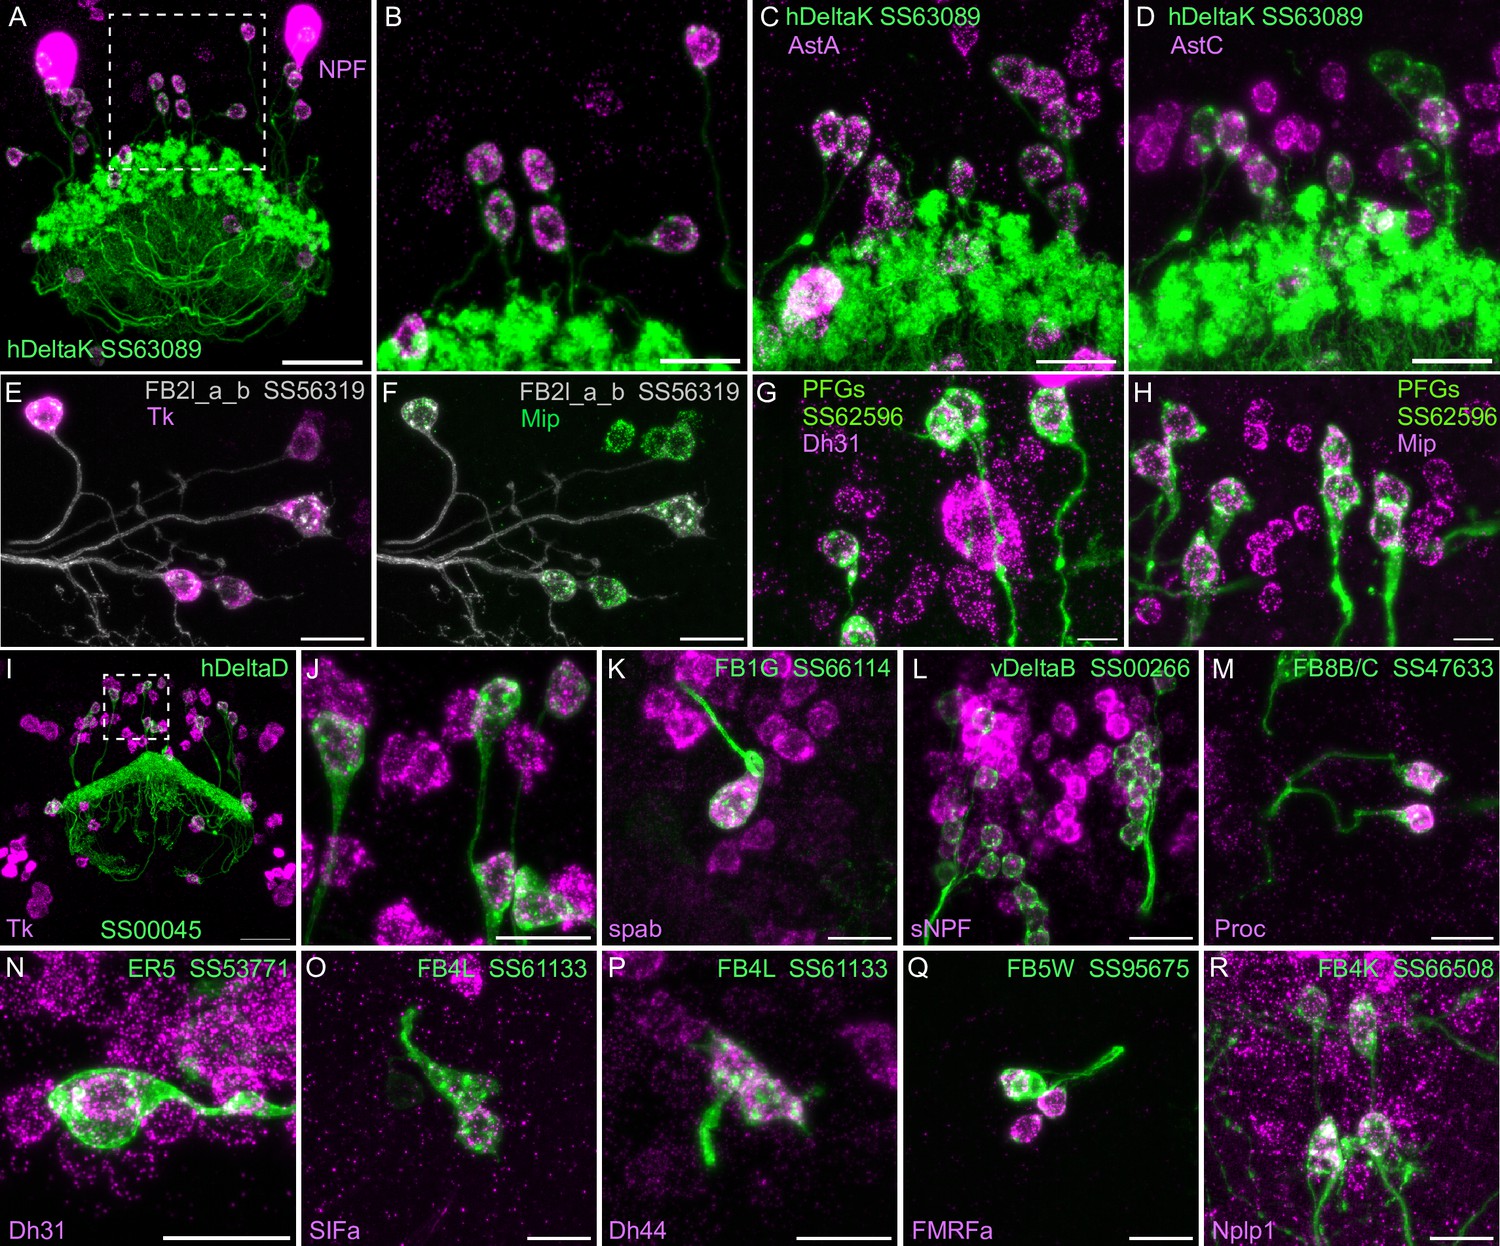
Neuropeptide gene expression in specific cell types.
(A-R) EASI-FISH was used to examine the expression of the indicated neuropeptide genes in the brains also expressing myr-GFP driven by a cell type-specific split-GAL4 line. The line name and labeled cell type are indicated. GFP was visualized by anti-GFP antibody staining. Hamid et al., 2024 demonstrated expression of Tk in ventral FB neurons likely to correspond to the cell type shown in panel E. Higher magnification view of regions of the brain in A and I (indicated by dashed box) are shown in B and J, respectively. Scale bar in panels A and I = 50 μm and for all other panels = 20 μm; note that the images shown are from brains that were expanded by about a factor of two during the EASI-FISH procedure.
Figure 9 with 2 supplements
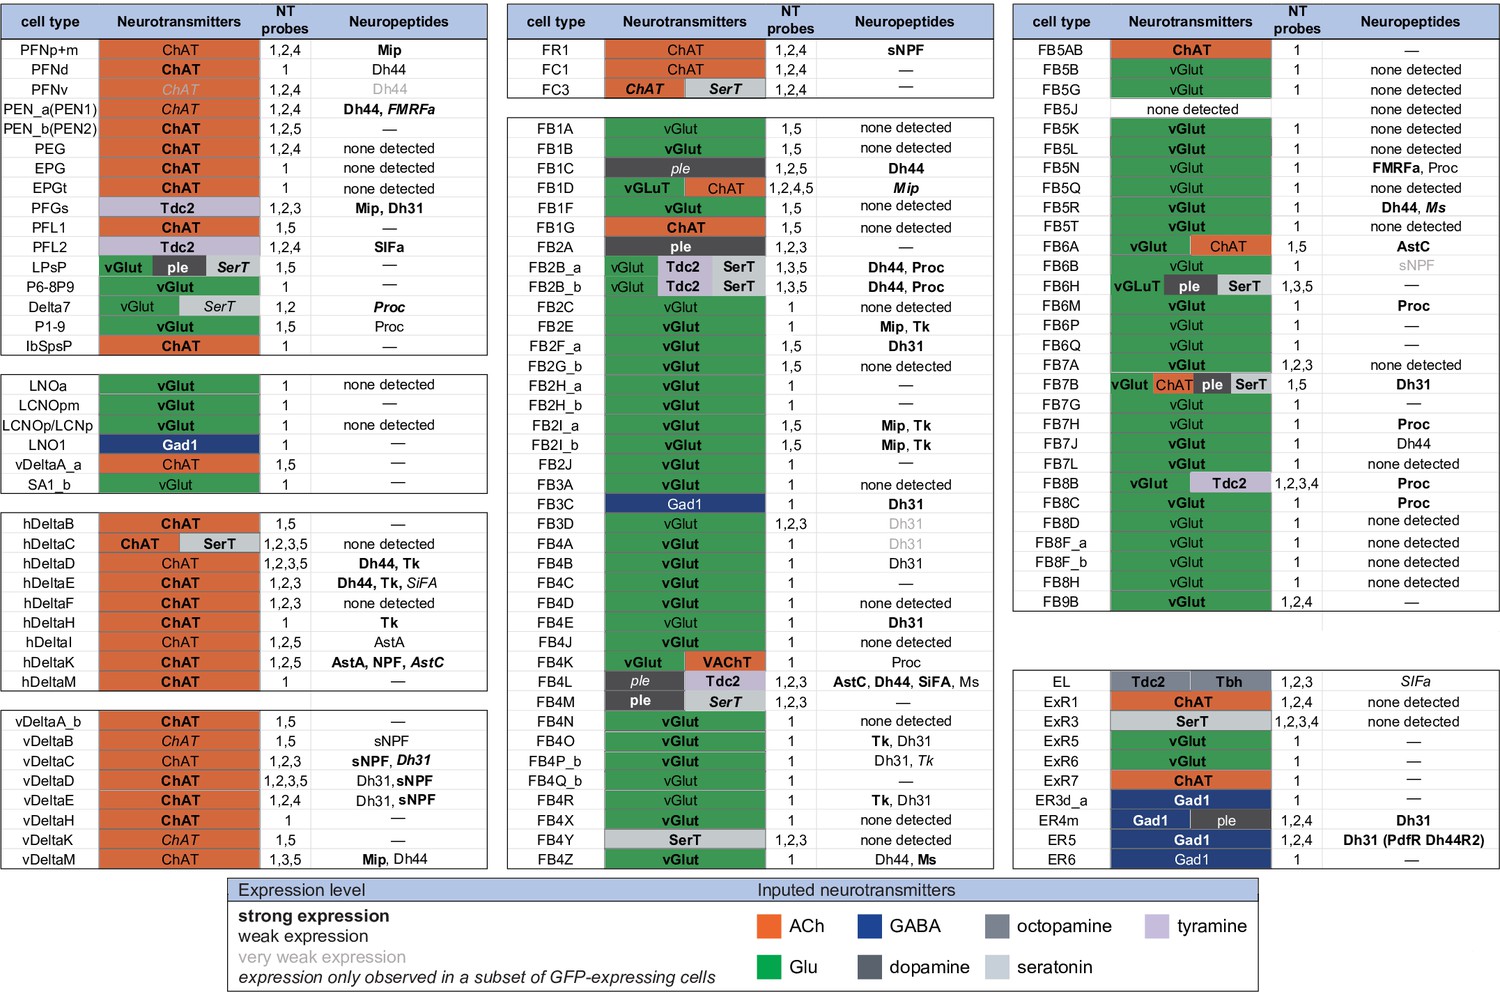
Summary of neurotransmitter and neuropeptide expression as determined by EASI-FISH performed on adult brains in which selected cell types were marked by a split-GAL4 lines driving GFP expression.
About half of all CX cell types were examined using probes for the following 15 NPs: AstA, AstC, CCAP, CCHa1, CCHa2, Dh31, Dh44, FMRFa, Mip, Ms, NPF, Proc, SIFA, sNPF, and Tk. All NPs except CCAP, CCHa1, and CCHa2 showed expression in at least one cell type. We excluded spab and Nplp1 from the genes in this figure, as it is unclear whether these are bonafide neuropeptides (M. Zandawala, pers. comm.); however, data on their expression in the listed cell types are given in Figure 9—source data 1. See Figures 4 and 8 for examples of the experimental data supporting these conclusions. The specific split-GAL4 driver(s) used for each cell type and how they were scored are given in Figure 9—source data 1. Results are coded for signal strength by typeface as indicated. The color shading used for neurotransmitters indicates what we believe to be the most likely transmitter used by each cell type. ‘None detected’ indicates that an experiment was performed, whereas a ‘—’ indicates no experimental data. To determine neurotransmitter expression various combinations of probe sets were used as indicated: 1, ChAT and VAChT choline O-acetyltransferase, and vesicular acetylcholine transporter; GAD1 (glutamate decarboxylase), vGlut (vesicular glutamate transporter); 2, ple (tyrosine 3-monooxygenase), SerT (serotonin transporter), Tbh (tyramine β-hydroxylase); 3, Tdc2 (tyrosine decarboxylase 2), Tbh; 4, Tdc2; and 5, SerT, ple, and Tdc2. In general, all lines were first probed with probe set 1 which reveals expression of genes involved in transmission by acetylcholine (ChAT), GABA (GAD), and glutamate (vGlut). Then a subset of lines was probed for genes involved in transmission by dopamine (ple), serotonin (SerT), octopamine (Tbh and Tdc2), and tyramine (Tdc2).
-
Figure 9—source data 1
Table of split-GAL4 lines with EASI-FISH results for neurotrasmitter and neuropeptide expression.
- https://cdn.elifesciences.org/articles/104764/elife-104764-fig9-data1-v1.xlsx
Figure 9—figure supplement 1
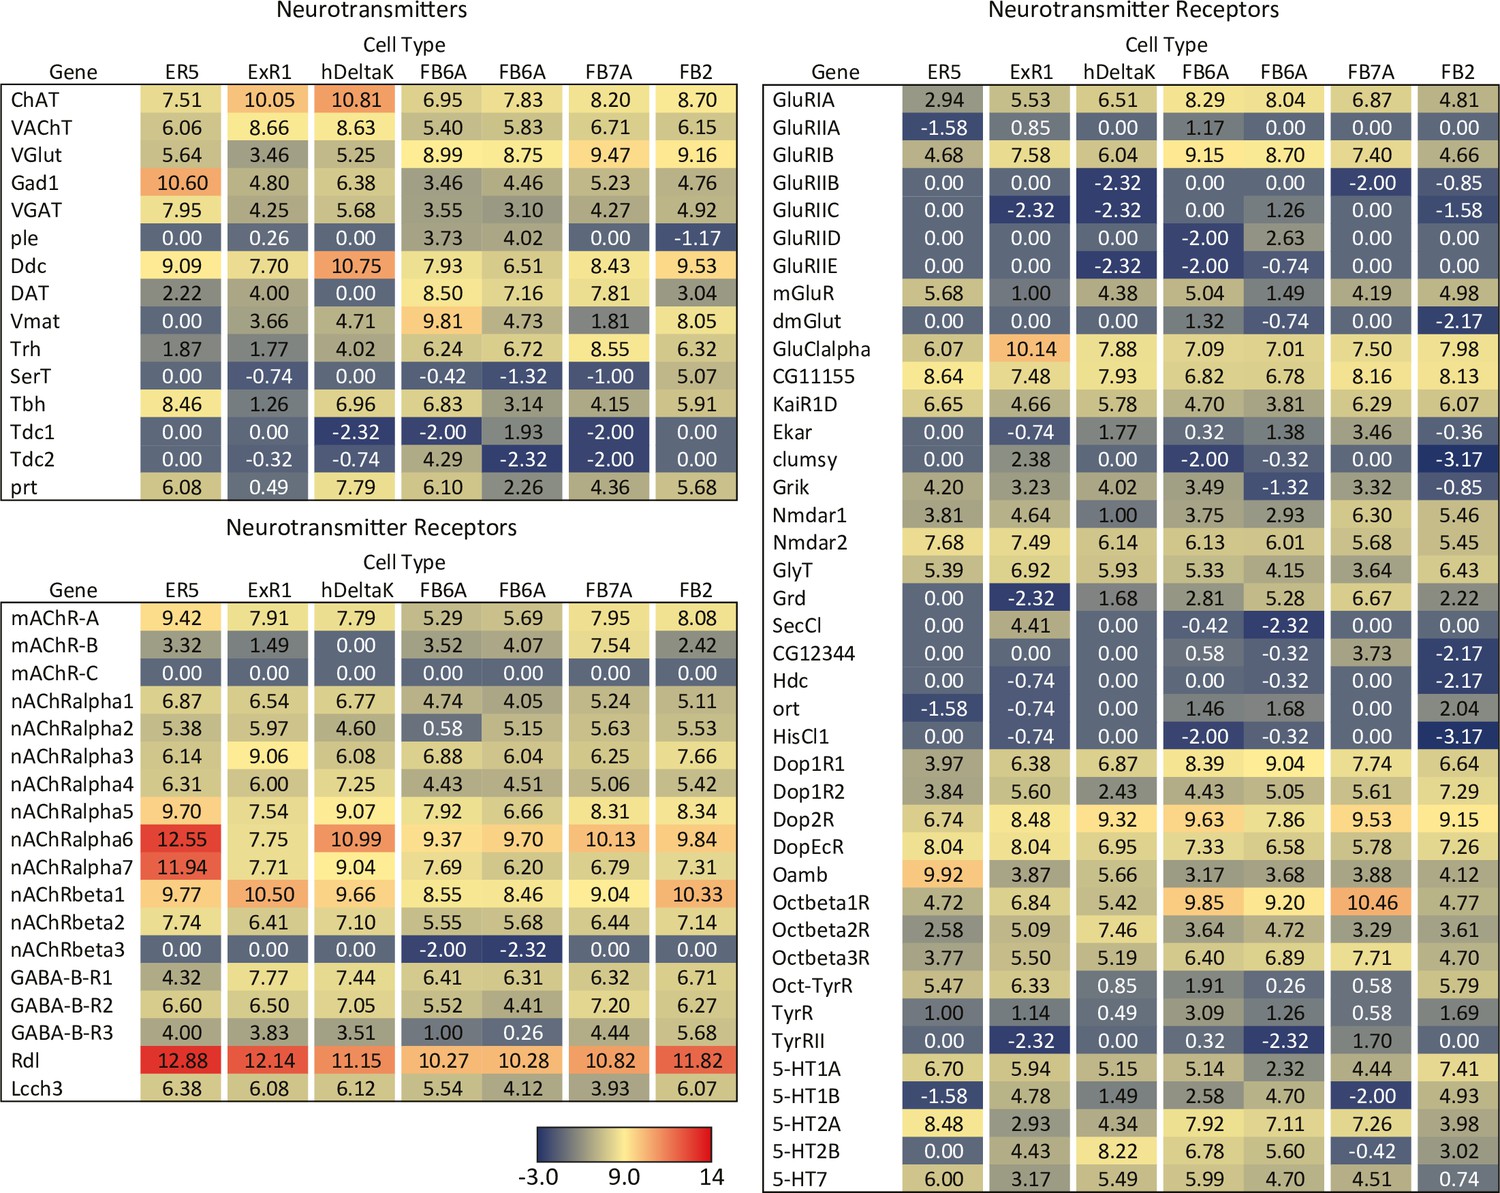
RNA-seq data for genes related to neurotransmitter synthesis, transport, and receptors in the indicated cell types.
Mean log2 of TPM values for each gene are listed. See NCBI Gene Expression Omnibus (accession number GSE271123) for the raw data. The split-GAL4 drivers used for each cell type were as follows: ER5, SS00070; ExR1, SS56684; hDeltaK, SS02748; FB6A, SS57656 and SS54343; FB7A, SS55888; FB2, SS56319.
Figure 9—figure supplement 2
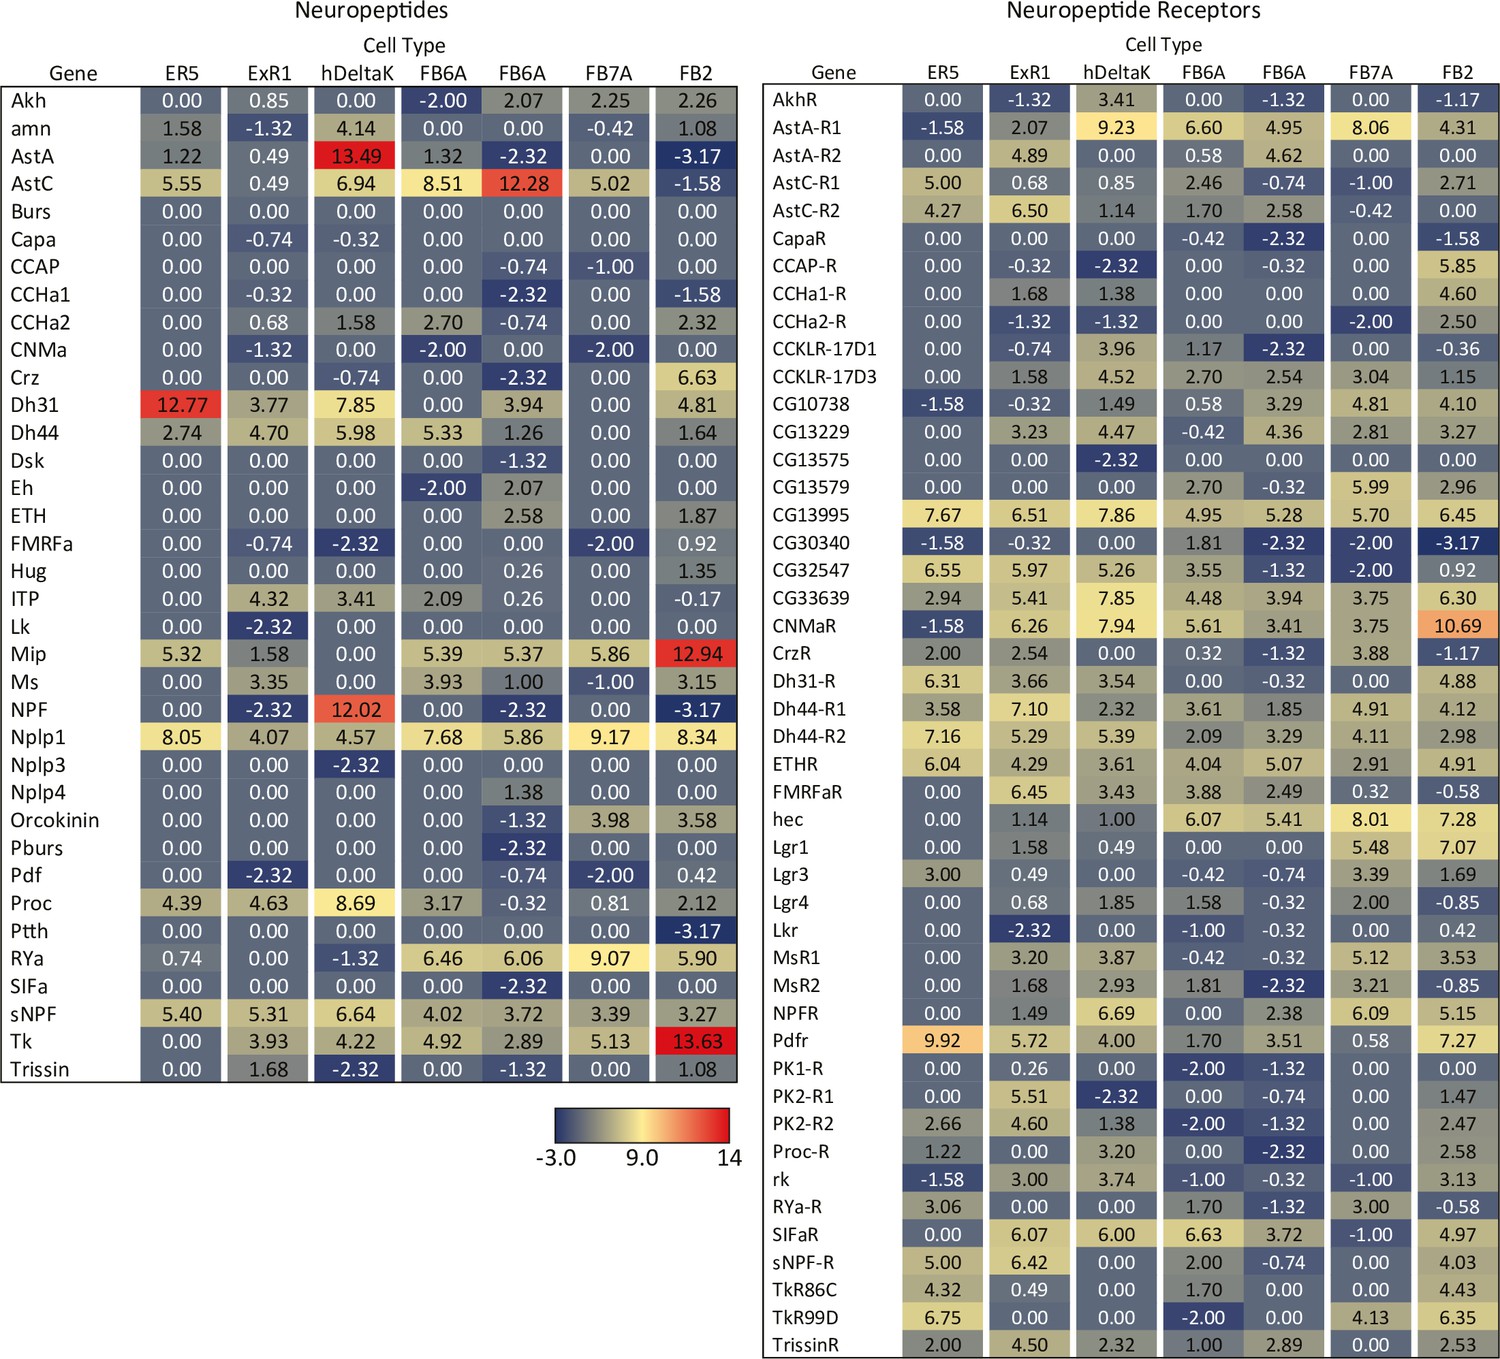
RNA-seq data for genes related to neuropeptides and their receptors in the indicated cell types.
Figure 10 with 5 supplements
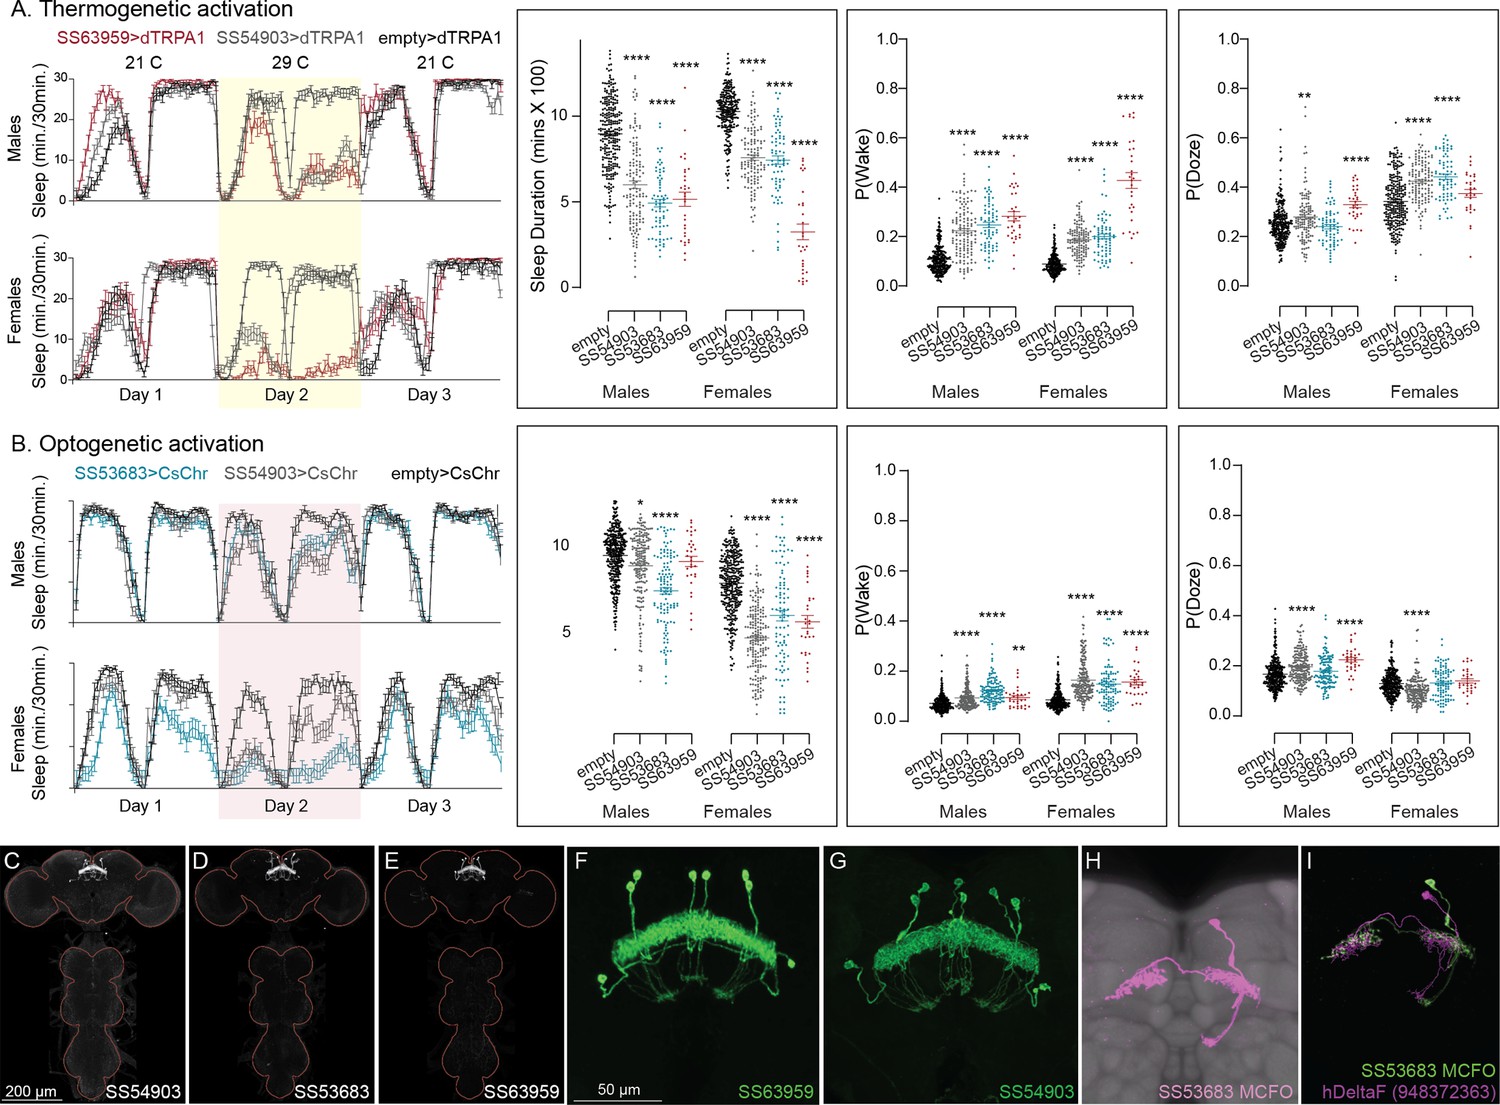
Activation of hDeltaF, comprised of eight intrinsic FB columnar neurons (see Hulse et al., 2021) decreases sleep.
(A) Thermogenetic activation and DAM-based monitoring using the split-GAL4 lines SS54903, SS53683, and SS63959 produced decreased sleep duration and increased P(Wake) in all three lines as compared to the control (empty-GAL4). The sleep profile indicated a stronger suppression of sleep during nighttime in males and reduced sleep during both day and nighttime in females. (B) Optogenetic activation and video-based tracking showed that two split-GAL4 lines (SS54903 and SS53683) have decreased sleep duration, and all three tested lines have increased P(Wake) in male flies during optogenetic activation. All three lines showed decreased sleep and increased P(Wake) in female flies. As observed with thermogenetic activation, these phenotypes were more pronounced for nighttime sleep in males. In addition to sleep duration and P(Wake) we also measured activity by beam counts/waking minute in the DAM assays and pixel movements/waking minute in video tracking. We found that activation of hDeltaF does not increase these measures, showing that observed changes are not attributable to hyperactivity (see Supplementary file 3, Supplementary file 4, Supplementary file 5). (C–E) MIP images of GFP-driven expression in the brain and VNC of the three spilt-GAL4 lines. The brain and VNC are outlined in red. (F, G) Higher resolution images of the relevant brain area of two of the lines. (H) Morphology of a single neuron revealed by stochastic labeling. (I) Comparison of LM and EM cell morphologies. Original confocal stacks for panels C–H can be downloaded from https://www.janelia.org/split-gal4. The full genotypes of the driver lines are given there and in Figure 2—source data 1. Statistical comparisons were made by Kruskal–Wallis and Dunn’s post hoc test. Asterisk indicates significance from 0: *p < 0.05; **p < 0.01; ****p < 0.0001.
Figure 10—figure supplement 1
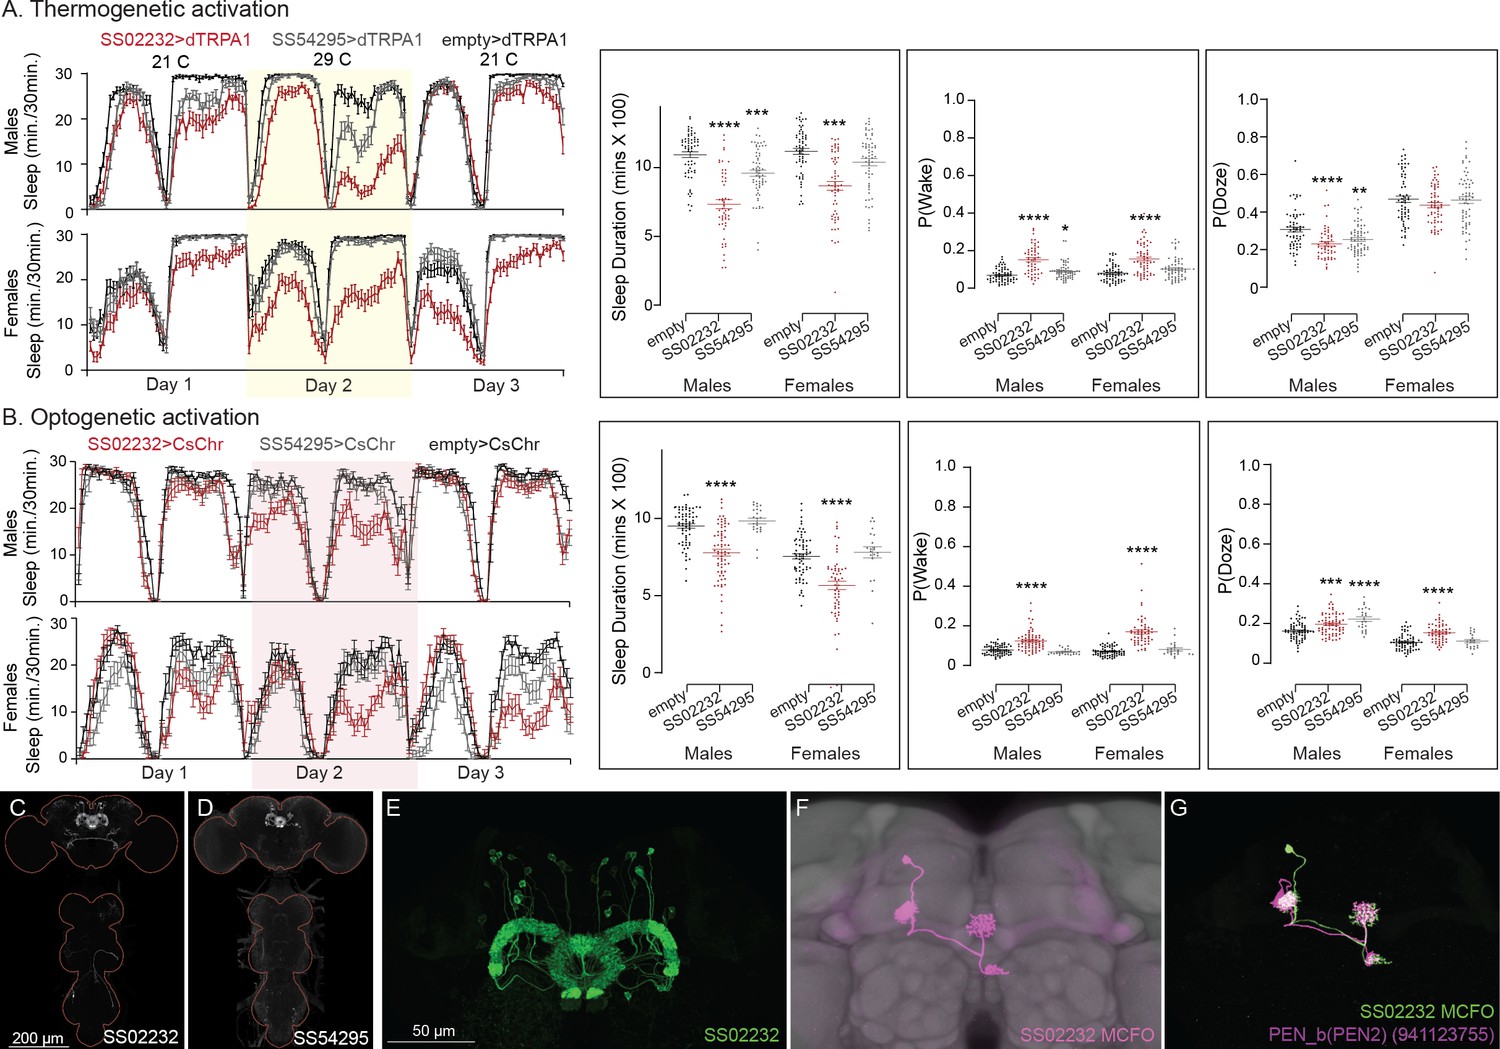
Activation phenotype of PEN_b.
PEN_b is comprised of 22 columnar neurons linking the ellipsoid body (EB), protocerebral bridge (PB), and noduli (Wolff and Rubin, 2018; Turner-Evans and Jayaraman, 2016 ; Green et al., 2017; Hulse et al., 2021). Effects on activity of thermogenetic (A) and optogenetic (B) activation of PEN_b using split-GAL4 lines SS02232 and SS54295 are shown. Specifically, thermogenetic activation of these split-GAL4 lines decreases sleep duration and increases P(Wake) in males but only SS02232 is wake promoting in females. Optogenetic activation of SS02232 suppresses sleep and increases P(Wake) in both males and females supporting the general function of these neurons as wake promoting. While both lines show high cell type specificity and minimal VNC expression, SS54295 has stochastic expression that might explain the weaker wake promoting effect seen with this line. (C, D) MIP images of GFP-driven expression in the brain and VNC of the two spilt-GAL4 lines. The brain and VNC are outlined in red. (E) Higher resolution images of the relevant brain area of SS02232. (F) Morphology of a single neuron revealed by stochastic labeling shown with neuropil reference. (G) Comparison of LM and EM cell morphologies. Original confocal stacks for panels C–F can be downloaded from https://www.janelia.org/split-gal4. The full genotypes of the driver lines are given there and in Figure 2—source data 1. Statistical comparisons were made by Kruskal–Wallis and Dunn’s post hoc test. Asterisk indicates significance from 0: *p < 0.05; **p < 0.01; ***p < 0.001; ****p < 0.0001.
Figure 10—figure supplement 2
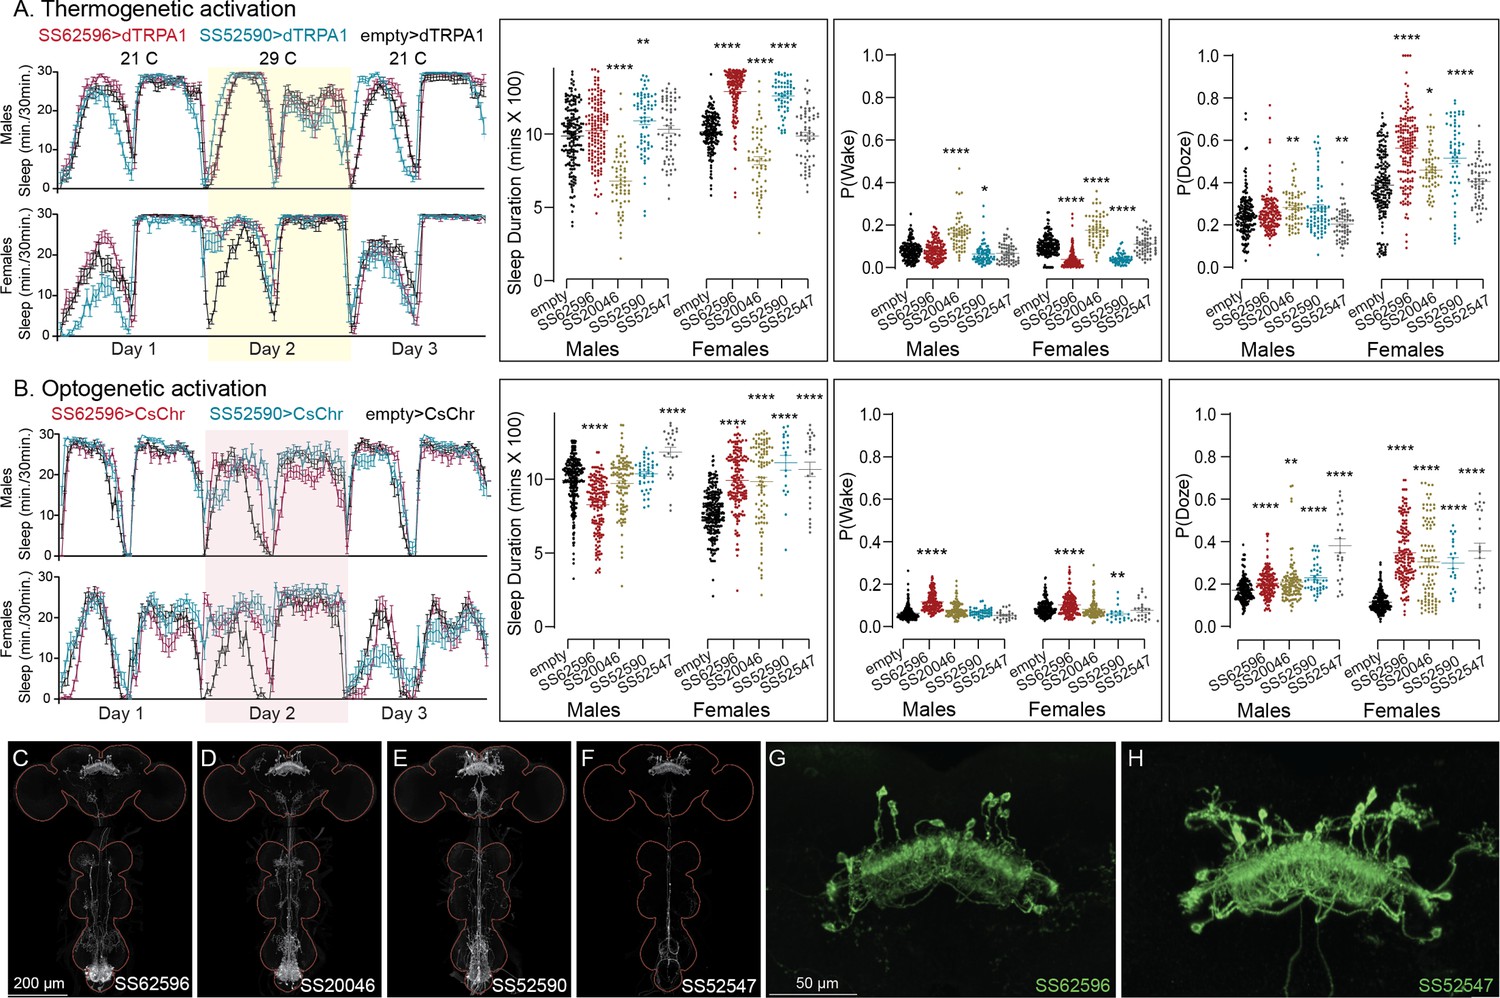
Activation phenotype of PFGs.
Thermogenetic (A) and optogenetic (B) activation of PFGs reveals sexually dimorphic sleep behavior. We tested four different split-GAL4 lines for this cell type. All four lines display expression in the VNC complicating interpretation of the results. To mitigate this issue, we used lines with different hemidriver parents and visually distinct VNC expression patterns (C–F). The brain and VNC are outlined in red. Optogenetic activation (Day 2) in female flies showed increased sleep in all four driver lines and a mild increase in sleep duration in one of lines for male flies (SS52547). However, P(Doze) was consistently higher in male and female flies for all tested PFGs lines. Thermogenetic activation (Day 2) also shows sex-specific phenotypes and two of the four lines (SS62596 and SS52590) have increased sleep. SS20046 has decreased sleep in females and male flies with dTRPA1-based activation but shows increased sleep with CsChrimson in females. Despite these inconsistencies, the data suggest a sex-specific sleep promoting effect for this cell type. (G, H) Higher resolution images of the relevant brain area of SS62596 and SS52547. Original confocal stacks for panels C–H can be downloaded from https://www.janelia.org/split-gal4. The full genotypes of the driver lines are given there and in Figure 2—source data 1. Statistical comparisons were made by Kruskal–Wallis and Dunn’s post hoc test. Asterisk indicates significance from 0: *p < 0.05; **p < 0.01; ****p < 0.0001.
Figure 10—figure supplement 3
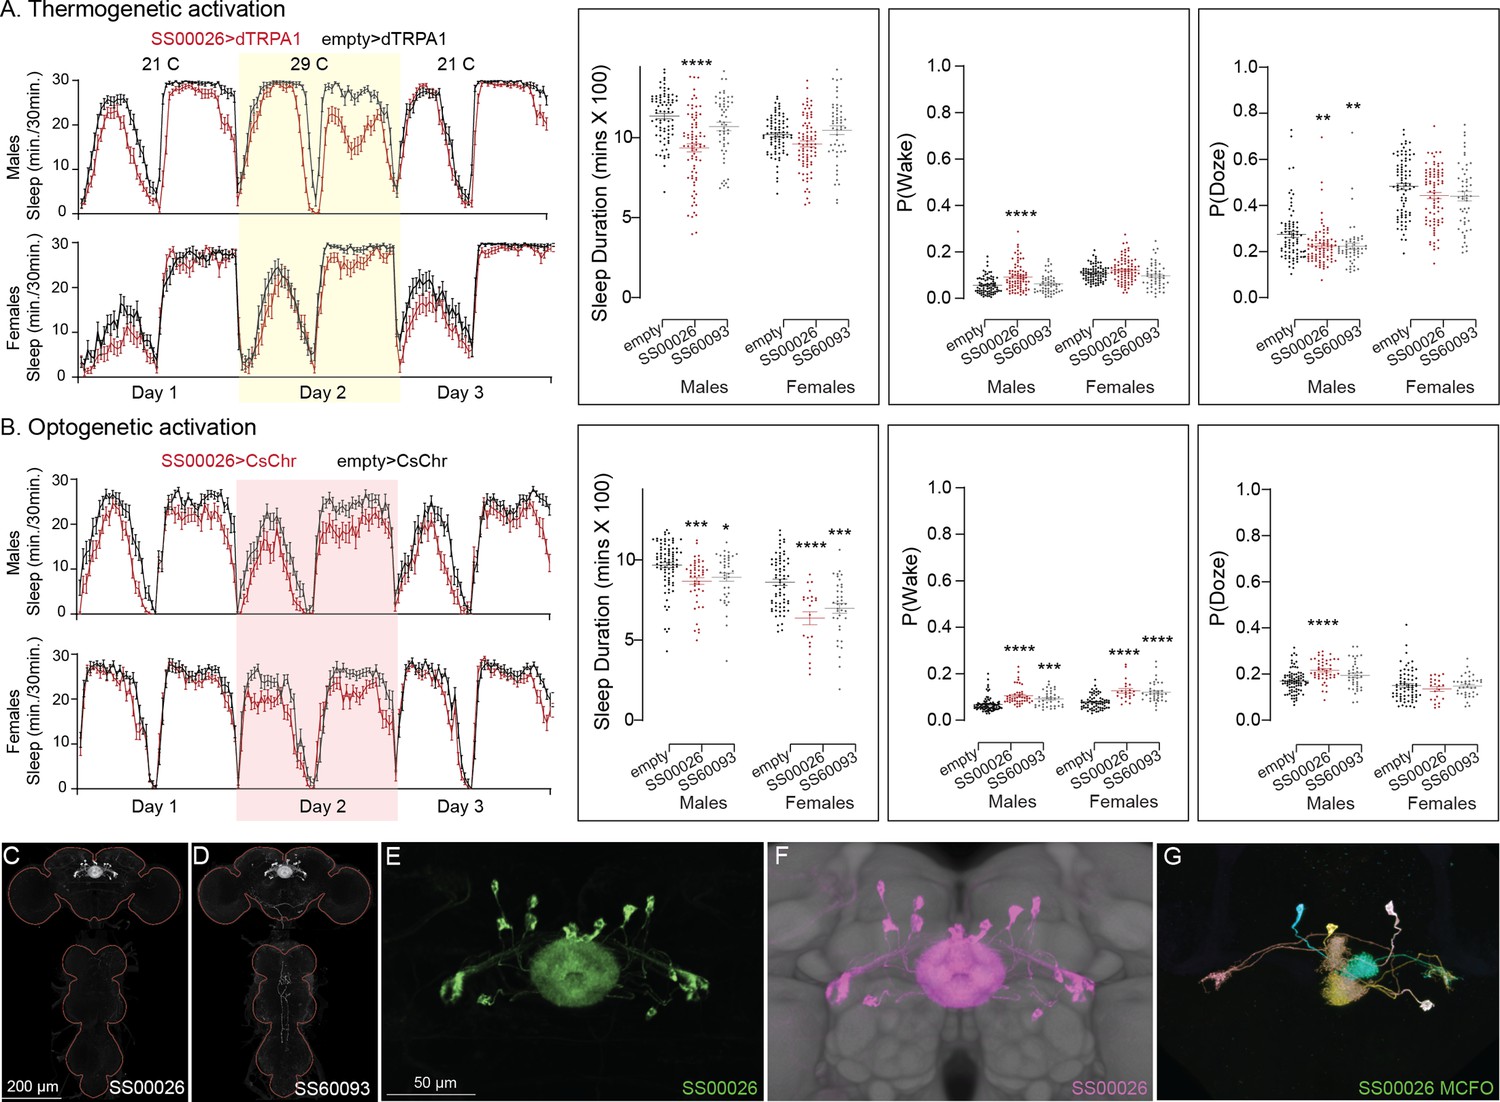
Activation phenotype of EL.
Thermogenetic activation (A) of EL neurons decreases sleep in one of the split-GAL4 lines (SS00026), while optogenetic activation (B) of both lines decreases sleep and increases P(Wake) on Day 2.
(C, D) MIP images of GFP-driven expression in the brain and VNC of the three spilt-GAL4 lines. The brain and VNC are outlined in red. (E) Higher resolution images of the relevant brain area of in SS00026. (F) Same as panel E, but with neuropil reference. (G) Morphology of individual neurons revealed by stochastic labeling. Original confocal stacks for panels C–G can be downloaded from https://www.janelia.org/split-gal4. The full genotypes of the driver lines are given there and in Figure 2—source data 1. Statistical comparisons were made by Kruskal–Wallis and Dunn’s post hoc test. Asterisk indicates significance from 0: *p < 0.05; **p < 0.01; ***p < 0.001; ****p < 0.0001.
Figure 10—figure supplement 4
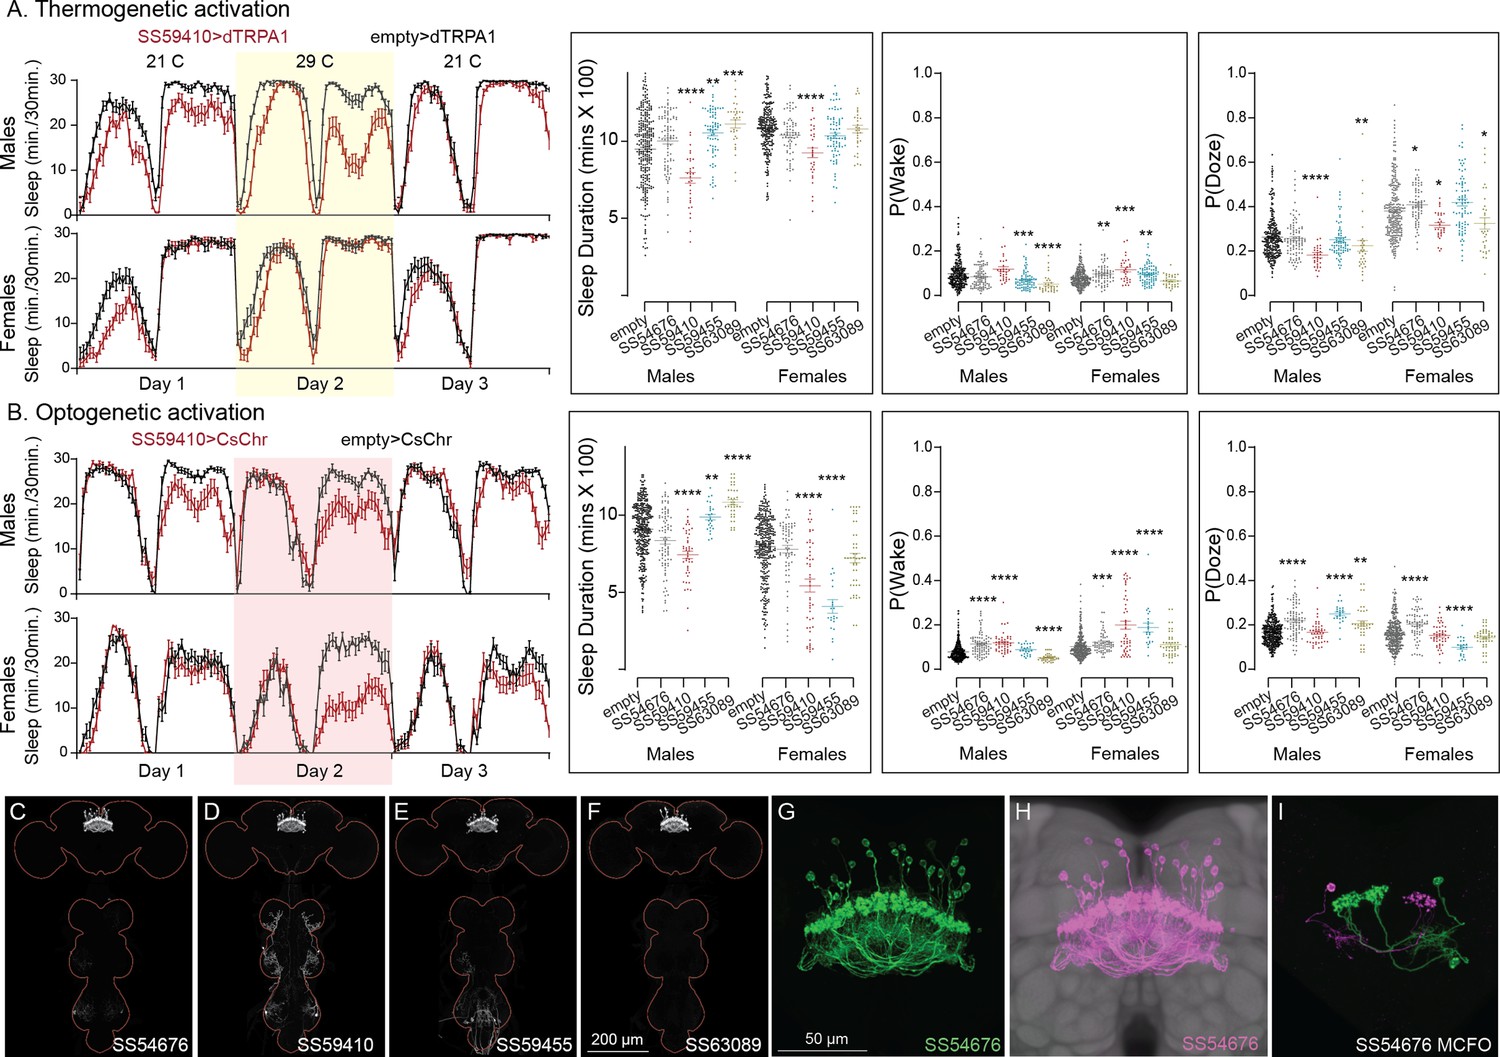
Activation phenotype of hDeltaK.
This group of intrinsic columnar neurons is highly peptidergic and has been implicated in chronic social isolation-induced sleep loss (Li et al., 2021). We tested four split-GAL4 lines (SS59455, SS63089, SS54676, and SS59410). Our results do not give a consistent view of the role of this cell type in sleep regulation. (A) Thermogenetic activation of one of the four lines (SS59410) was wake promoting in both sexes, while two (SS59455 and SS63089) were sleep promoting in males, but not females. (B) Consistent with what was observed with thermogenetic activation, optogenetic activation of SS59410 also suppressed sleep in males and females, while SS59410 and SS59455 were sleep promoting in males, but not in females. (C–F) MIP images of GFP-driven expression in the brain and VNC of the four spilt-GAL4 lines. The brain and VNC are outlined in red. (G) Higher resolution images of the relevant brain area of in SS54676 (H). Same as panel G, but with neuropil reference. (I) Morphology of individual neurons revealed by stochastic labeling. We do not have any insight into the differences in behaviors between lines and cannot make an overall conclusion of their role in sleep regulation. Such line-to-line inconsistencies argue for caution in the interpretation of results, especially when only one line for a cell type has been assayed. Original confocal stacks for panels C–I can be downloaded from https://www.janelia.org/split-gal4. The full genotypes of the driver lines are given there and in Figure 2—source data 1. Statistical comparisons were made by Kruskal–Wallis and Dunn’s post hoc test. Asterisk indicates significance from 0: *p < 0.05; **p < 0.01; ***p < 0.001; ****p < 0.0001.
Figure 10—figure supplement 5
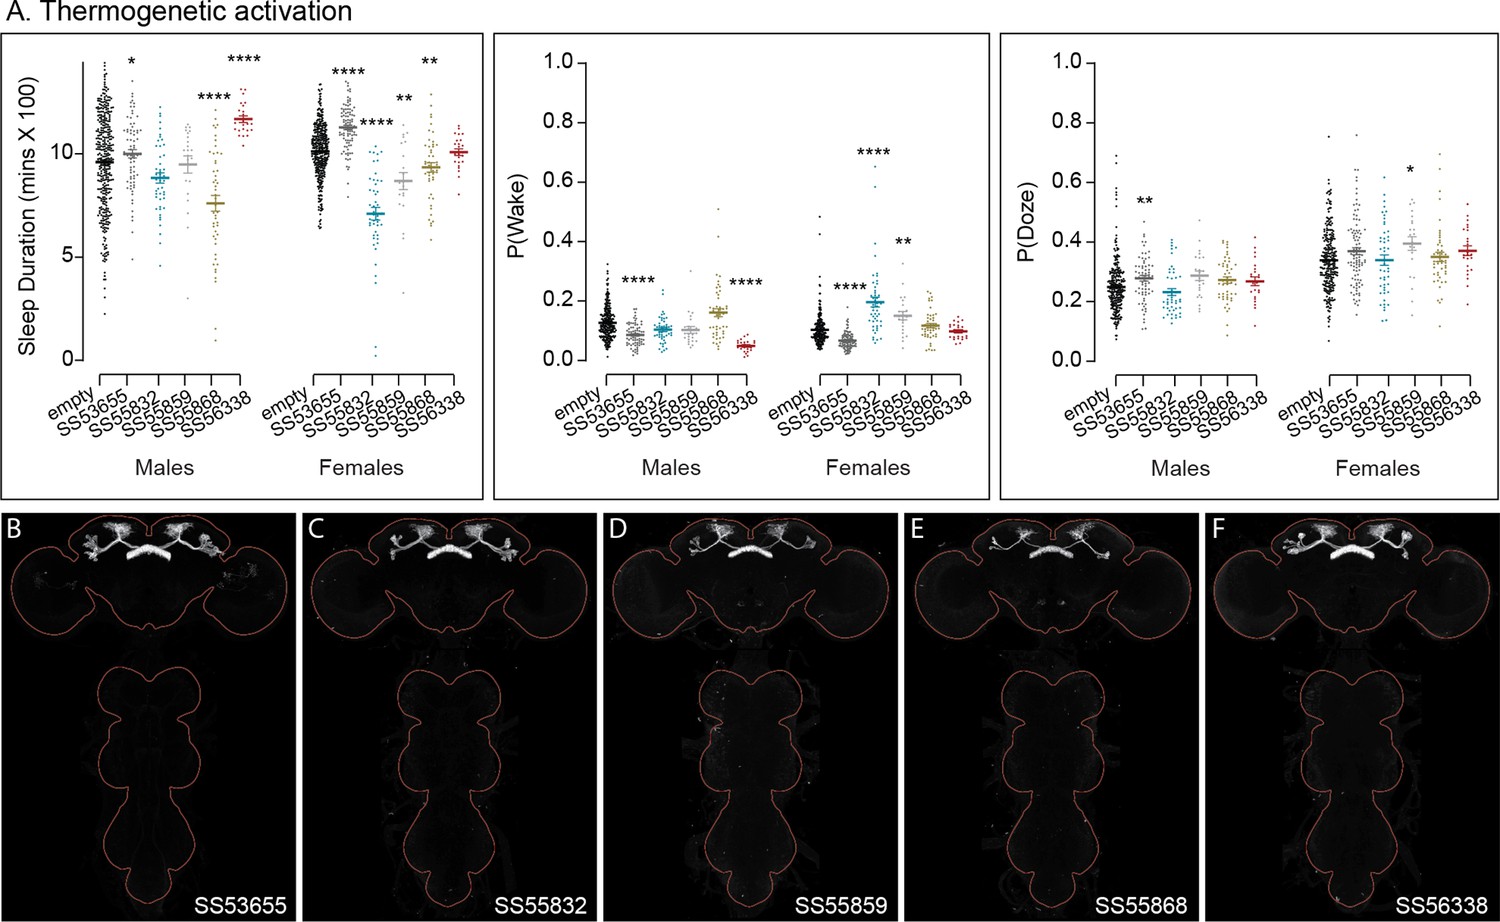
Activation phenotypes of combinations of dFB cell types.
The five split-GAL4 lines used here each utilize R84C10 as one of their hemidrivers. They represent different but largely overlapping subsets of layer 6 and 7 FB tangential cell types and have no detectable VNC expression. Jones et al., 2024 reported analysis of additional lines that used R84C10 as a hemidriver in split-GAL4 lines. We did not examine expression in other parts of the peripheral nervous system or muscle. (A) Thermogenetic activation revealed that some lines were sleep promoting and others wake promoting. (B–F) MIP images of GFP-driven expression in the brain and VNC of the four spilt-GAL4 lines. The brain and VNC are outlined in red. Original confocal stacks can be downloaded from https://www.janelia.org/split-gal4. The full genotypes of the driver lines are given there and in Figure 2—source data 1. Statistical comparisons were made by Kruskal–Wallis and Dunn’s post hoc test. Asterisk indicates significance from 0: *p < 0.05; **p < 0.01; ****p < 0.0001.
Figure 11 with 1 supplement
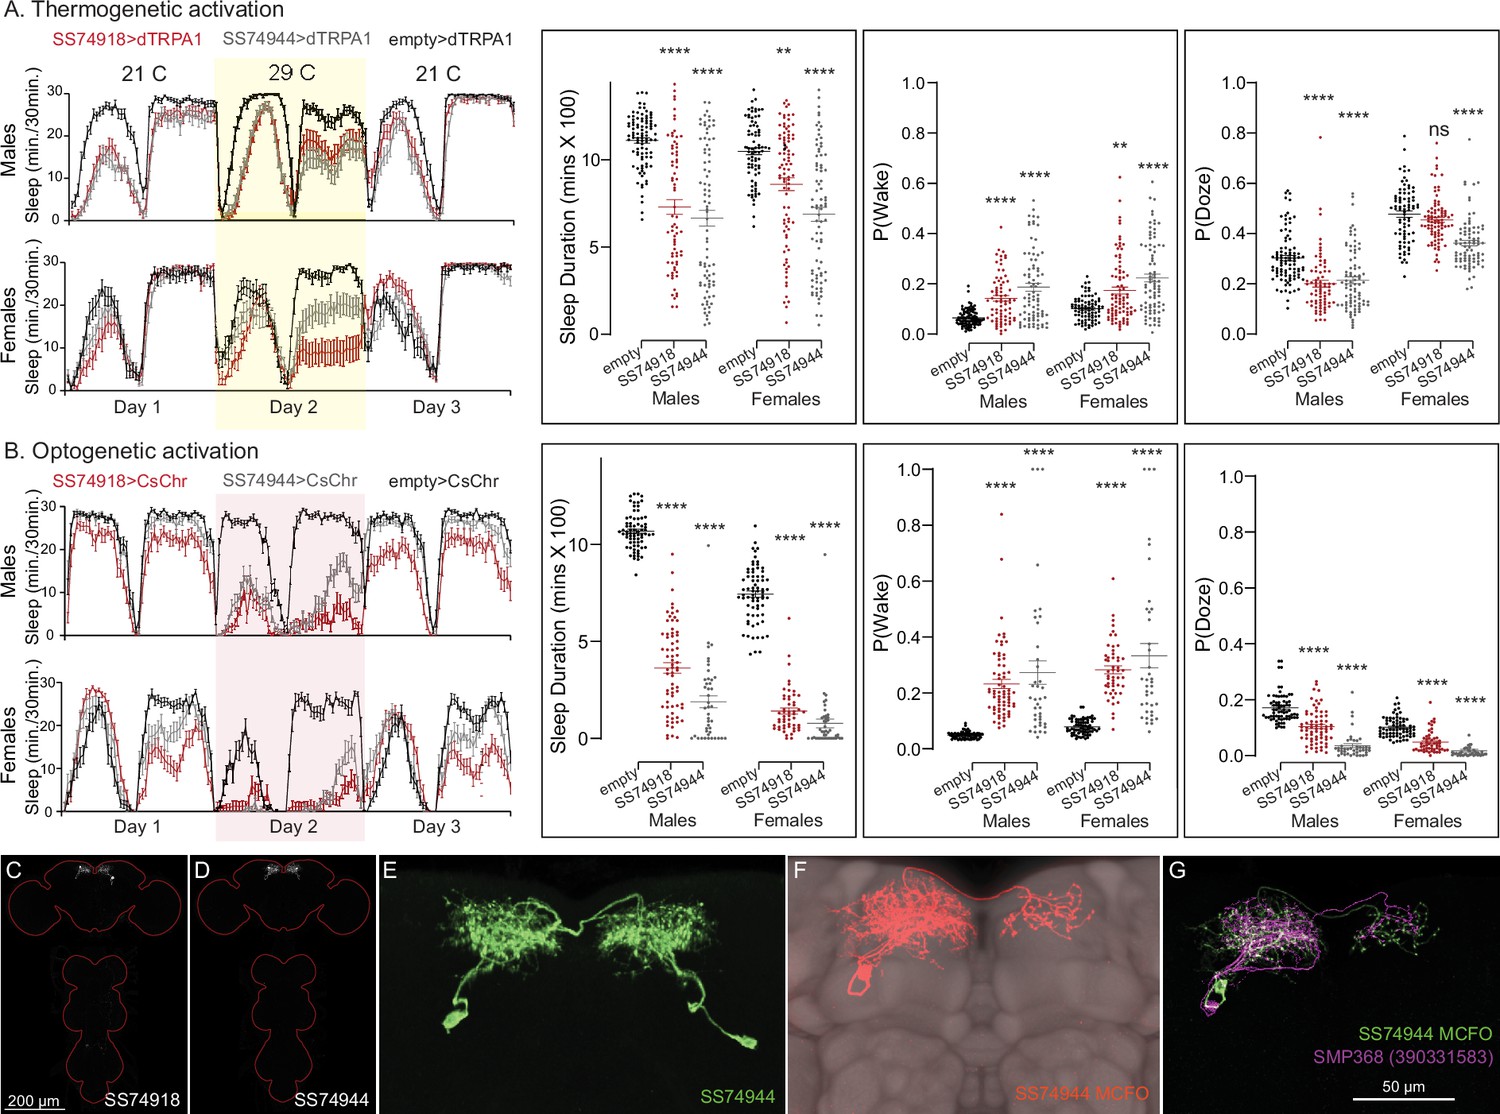
Activation of SMP368 decreases sleep.
SMP368 connects central clock outputs to the CX (see Figure 12, Figure 12—figure supplement 1). Both split-GAL4 lines for SMP368 that we tested (SS74918 and SS74944) are strongly wake promoting in both thermogenetic (A) and optogenetic (B) activation and the phenotypes are consistent across sexes. Further, these lines show increase P(Wake) and decreased P(Doze) indicative of decreased sleep pressure and altered sleep depth. (C, D) MIP images of GFP-driven expression in the brain and VNC of the two spilt-GAL4 lines. The brain and VNC are outlined in red. (E) Higher resolution images of the relevant brain area of SS74944. (F) Morphology of a single neuron revealed by stochastic labeling shown with neuropil reference. (G) Comparison of LM and EM cell morphologies. Original confocal stacks for panels C–F can be downloaded from https://www.janelia.org/split-gal4. The full genotypes of the driver lines are given there and in Figure 2—source data 1. Statistical comparisons were made by Kruskal–Wallis and Dunn’s post hoc test. Asterisk indicates significance from 0: **p < 0.01; ****p < 0.0001.
Figure 11—figure supplement 1
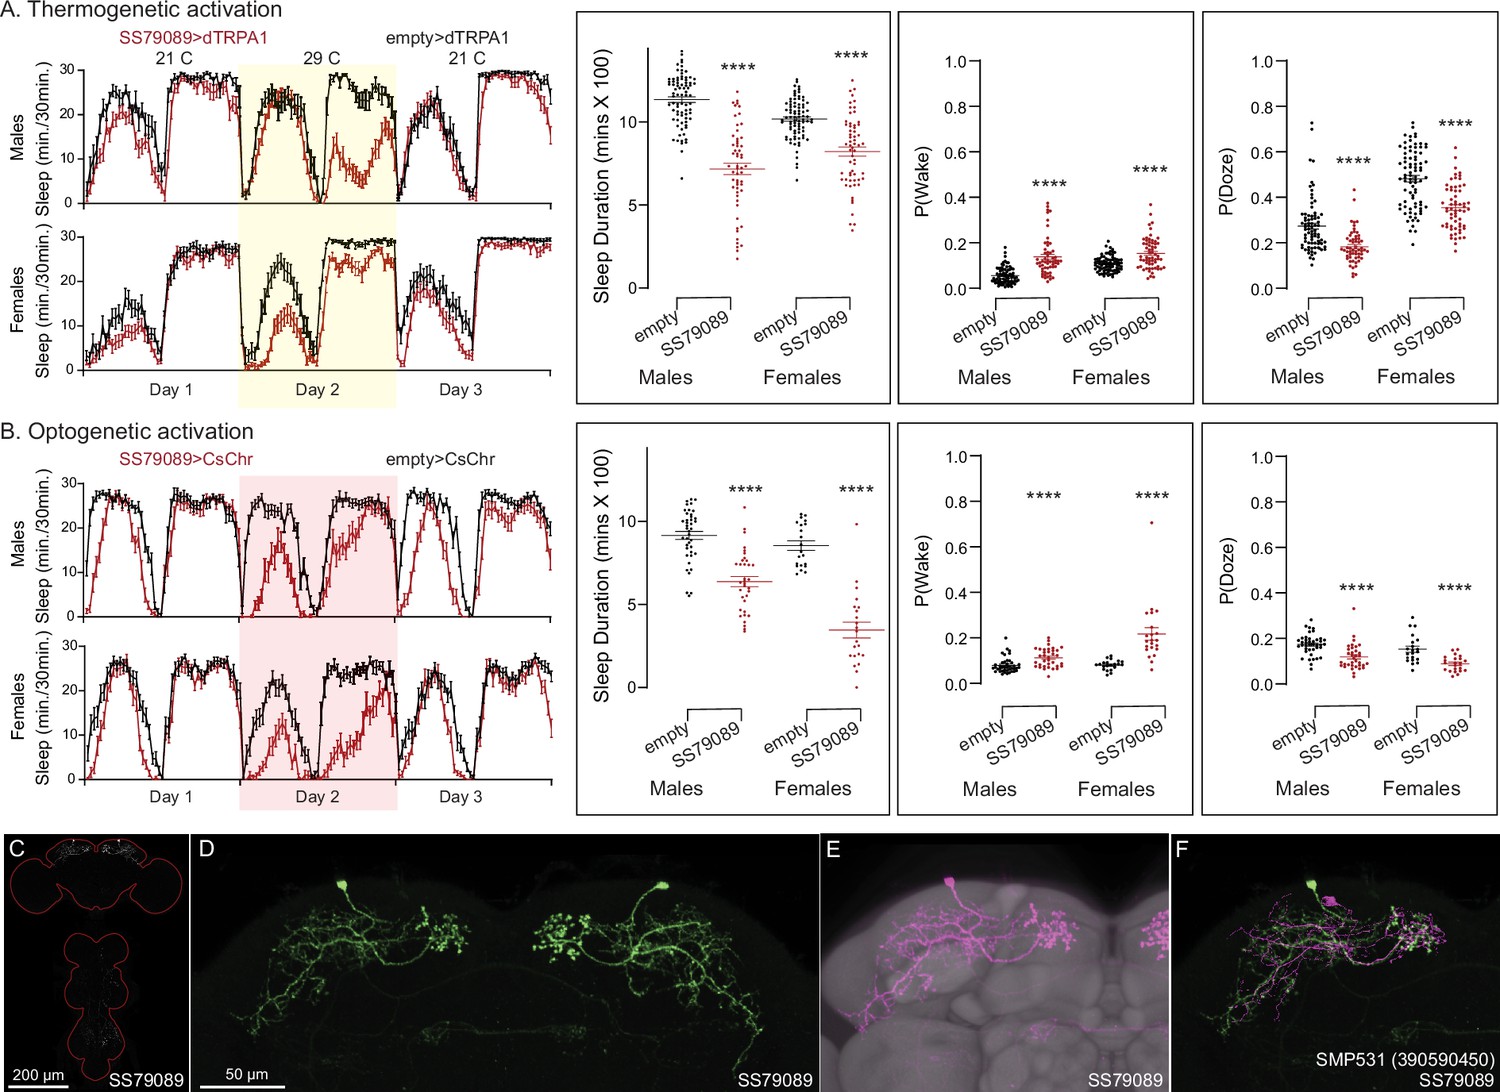
Activation phenotype of SMP531.
SMP531 is part of a potential pathway from clock outputs to the CX (see Figure 12—figure supplement 1) The SMP531 split-GAL4 line SS79089 suppresses sleep when activated thermogenetically (A) and optogenetically (B) in both males and females. Further, activation of this line increases P(Wake) and decreased P(Doze). (C) MIP image of GFP-driven expression in the brain and VNC of SS79089. The brain and VNC are outlined in red. (D) Higher resolution images of the relevant brain area of SS79089. (E) Morphology shown with neuropil reference. (F) Comparison of LM and EM cell morphologies. Original confocal stacks for panels C–E can be downloaded from https://www.janelia.org/split-gal4. The full genotypes of the driver lines are given there and in Figure 2—source data 1. Statistical comparisons were made by Kruskal–Wallis and Dunn’s post hoc test. Asterisk indicates significance from 0: ****p < 0.0001.
Figure 12 with 1 supplement
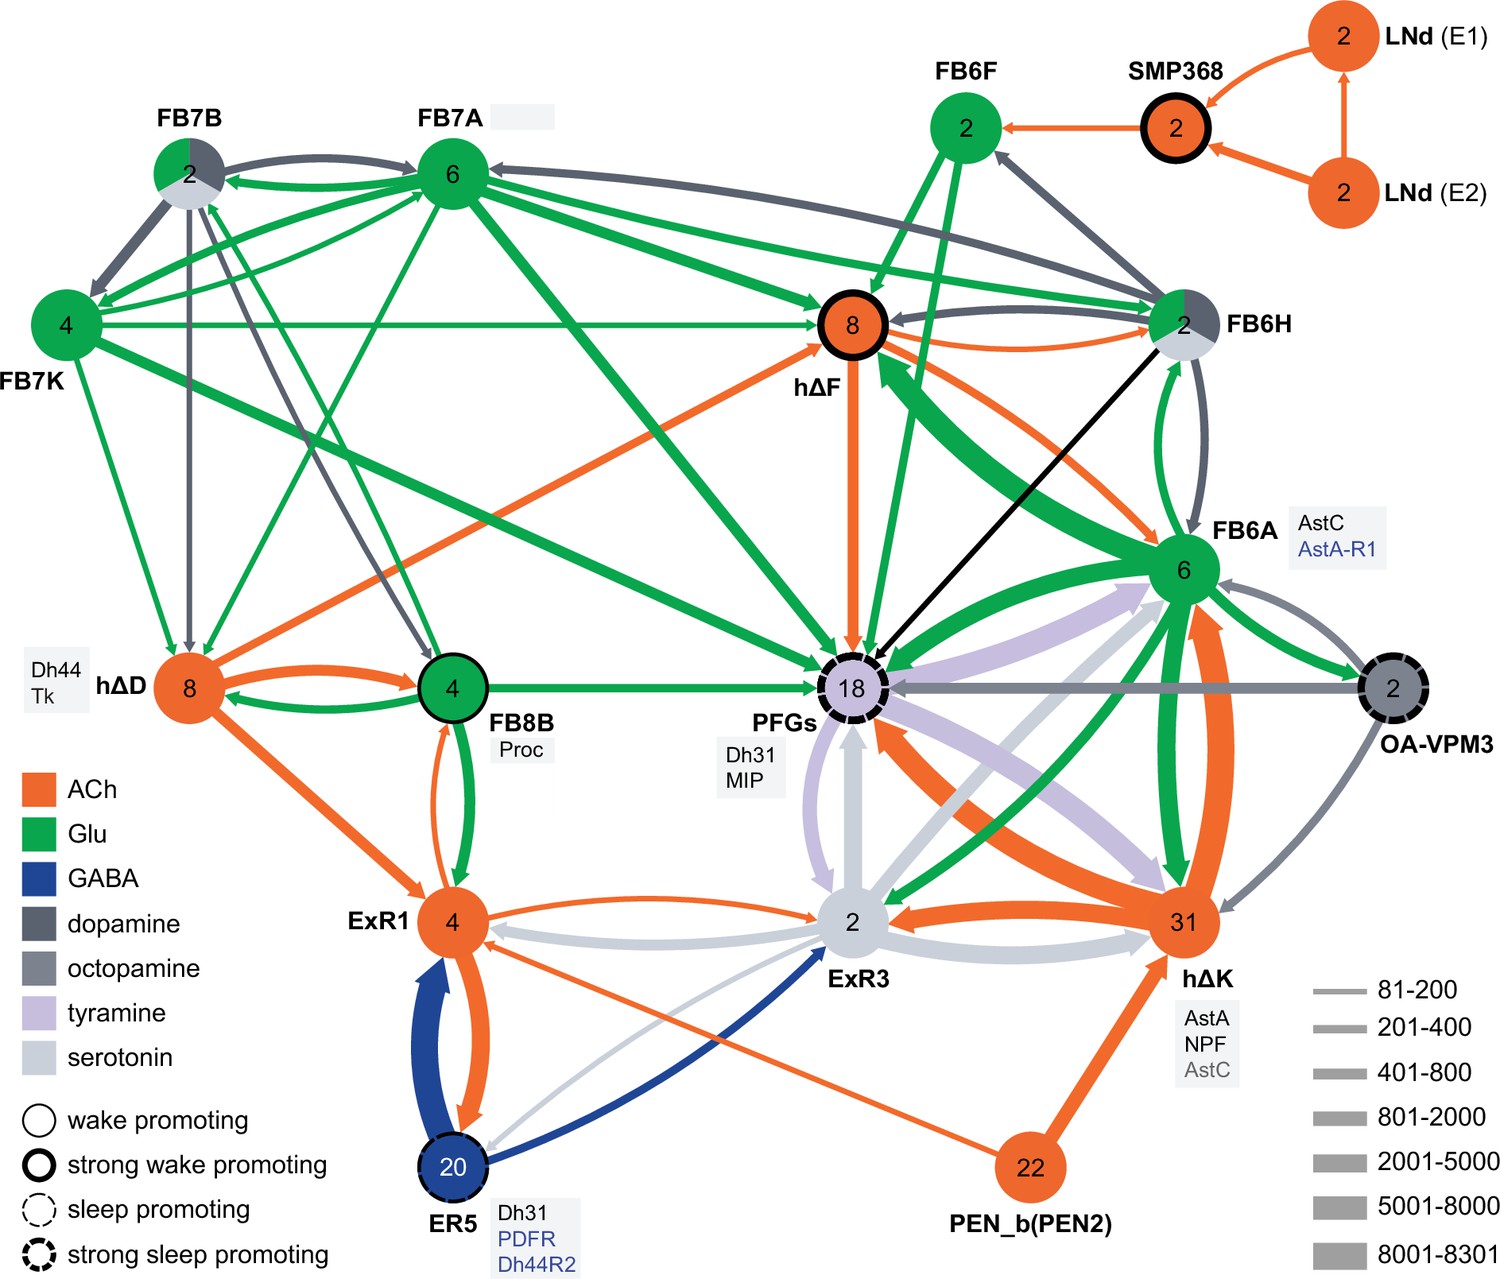
Circuit diagram of CX cells implicated in regulating sleep.
Selected CX cell types, plus non-CX cell types SMP368, LNd, and OA-VPM3, are shown. The number within each circle denotes the number of cells in that cell type. The neurotransmitters used by each cell type are indicated by color coding, and the number of synapses between cell types is represented by arrow width. Cell types that have been shown to promote sleep or wake when activated are indicated. Experimental evidence for the wake promoting effects of OA-VPM3 is from Reyes, M and Sitaraman D (in preparation). In cases where we have experimentally determined expression of neuropeptides or neuropeptide receptor genes by either EASI-FISH or RNA profiling, this information is indicated in the boxes next to the relevant cell type. Cell type names are from the hemibrain release 1.2.1 except for the LNd neurons whose names have been modified based on morphology and connectivity; they have been grouped into two types: LNd (E1) corresponds to hemibrain body IDs 5813056917 + 5813021192 and LNd (E2) corresponds to hemibrain body IDs 511051477 (5th LNv) + 5813069648 (LNd6) (Shafer et al., 2022). Because the CX is a central body and the inputs from CX cells that have their soma in right or left hemisphere appear to be comingled on their downstream targets, the synaptic strengths shown represent the combined number of cells of each type, regardless of soma position. For example, the arrow thickness between FB6F and hDeltaF reflects the total number of synapses (368) from FB6F_R and FB6F_L to all hDeltaF cells; the individual synapse number between each of the two FB6F cells to each of the eight hDeltaF cells, which ranges from 7 to 39, can be found in neuPrint. The sole exception is the LNd cells where the synaptic strength represents only the output of LNds in the right hemisphere. See Figure 53 of Hulse et al., 2021 for additional connected cells.
Figure 12—figure supplement 1
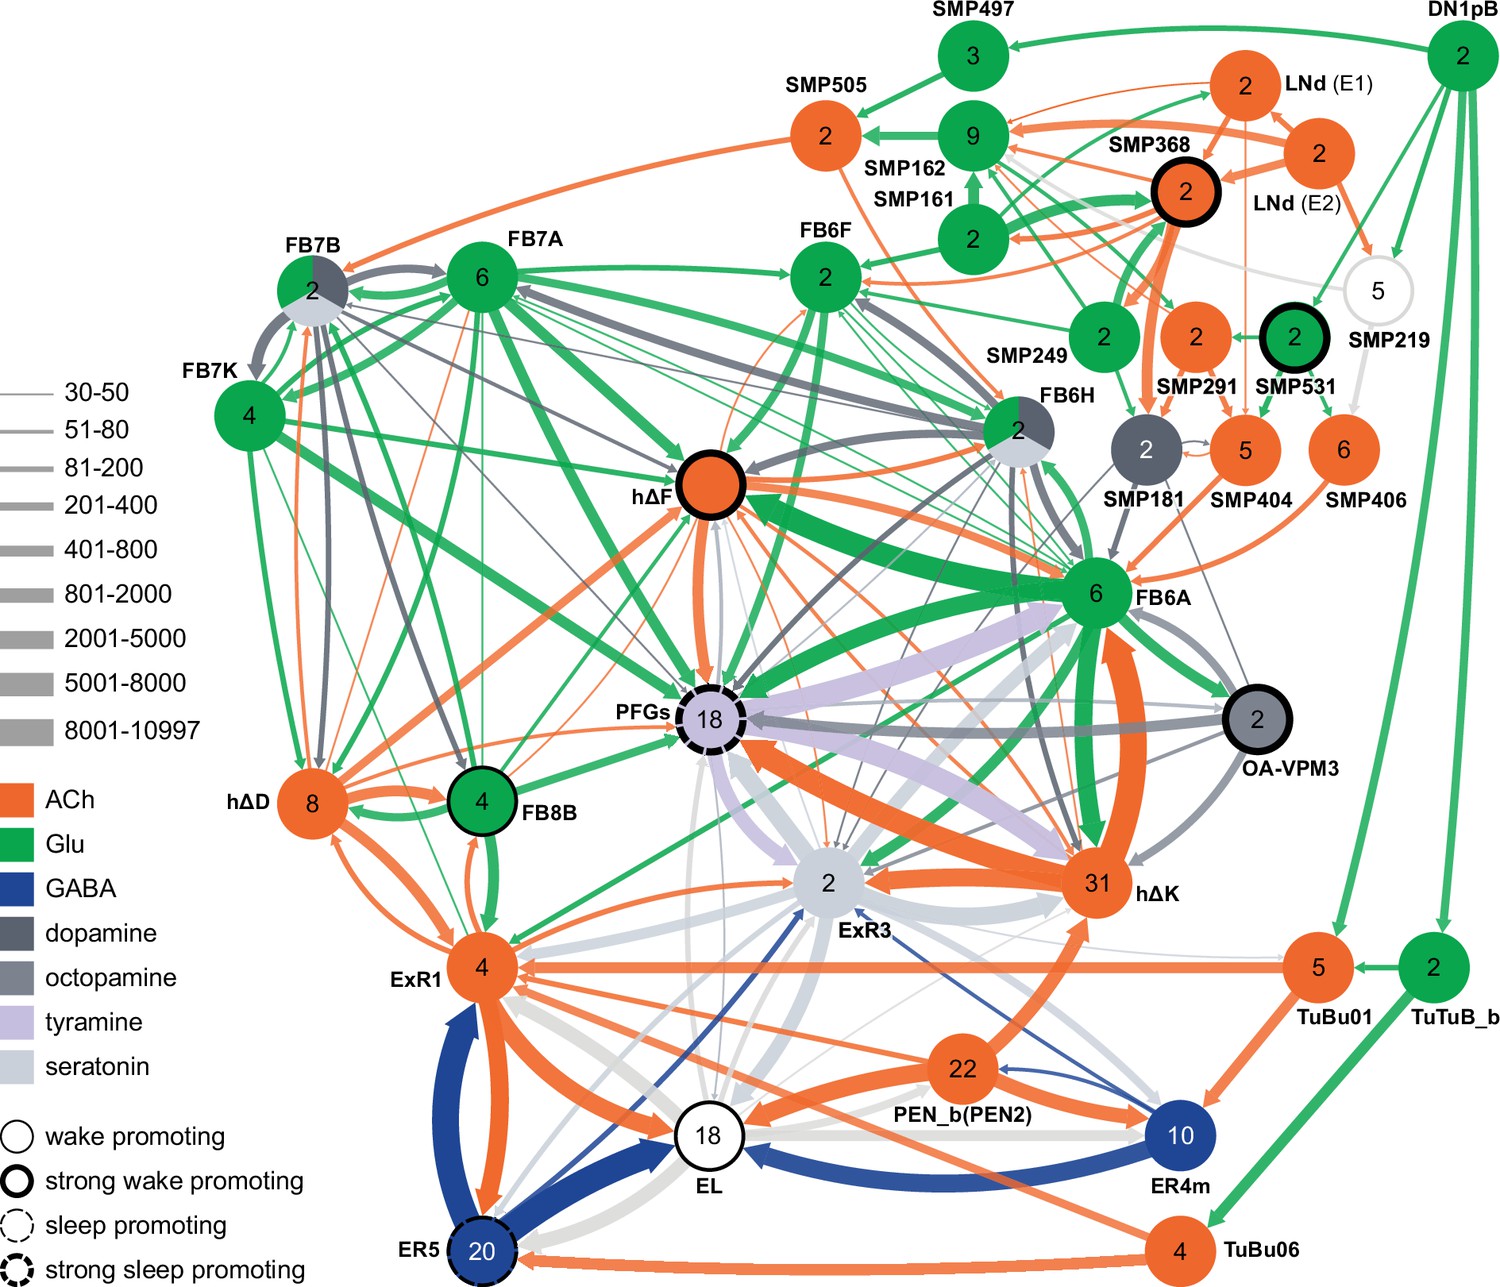
Circuit diagram showing some additional cell types potentially involved in regulating sleep.
Other studies have identified roles for some of these cell types as well as additional cells not shown in this diagram. Links between clock output DN1 neurons to the ExR1 have been described in Lamaze et al., 2018 and Guo et al., 2018. Liang et al., 2019 described a connection form the clock to ExR2 (PPM3) dopaminergic neurons.
Videos
Video 1
Expression of genes encoding the neuropeptide receptors PDFR and Dh44R2 as well as the neuropeptide Dh31 in ER5 cells of the EB.
The ER5 cells were marked by membrane-bound GFP expression and expression of PDFR, Dh44R2, and Dh31 were assayed by EASI-FISH.
Additional files
-
MDAR checklist
- https://cdn.elifesciences.org/articles/104764/elife-104764-mdarchecklist1-v1.docx
-
Supplementary file 1
Table of additional split-GAL4 lines organized by CX structure and cell type.
- https://cdn.elifesciences.org/articles/104764/elife-104764-supp1-v1.xlsx
-
Supplementary file 2
Thermogenetic screen of selected stable-split lines in males.
- https://cdn.elifesciences.org/articles/104764/elife-104764-supp2-v1.xlsx
-
Supplementary file 3
Thermogenetic screen of selected stable-split lines in females.
- https://cdn.elifesciences.org/articles/104764/elife-104764-supp3-v1.xlsx
-
Supplementary file 4
Optogenetic screen of selected stable-split lines in males.
- https://cdn.elifesciences.org/articles/104764/elife-104764-supp4-v1.xlsx
-
Supplementary file 5
Optogenetic screen of selected stable-split lines in females.
- https://cdn.elifesciences.org/articles/104764/elife-104764-supp5-v1.xlsx
Download links
A two-part list of links to download the article, or parts of the article, in various formats.
Downloads (link to download the article as PDF)
Open citations (links to open the citations from this article in various online reference manager services)
Cite this article (links to download the citations from this article in formats compatible with various reference manager tools)
Cell type-specific driver lines targeting the Drosophila central complex and their use to investigate neuropeptide expression and sleep regulation
eLife 14:RP104764.
https://doi.org/10.7554/eLife.104764.3


