Myosin light chain 3 serves as a receptor for nervous necrosis virus entry into host cells via the macropinocytosis pathway
- School of Marine Sciences, Sun Yat-sen University, China
- Southern Marine Science and Engineering Guangdong Laboratory, China
- Guangdong Provincial Key Laboratory of Marine Resources and Coastal Engineering, China
Figures
Figure 1 with 1 supplement
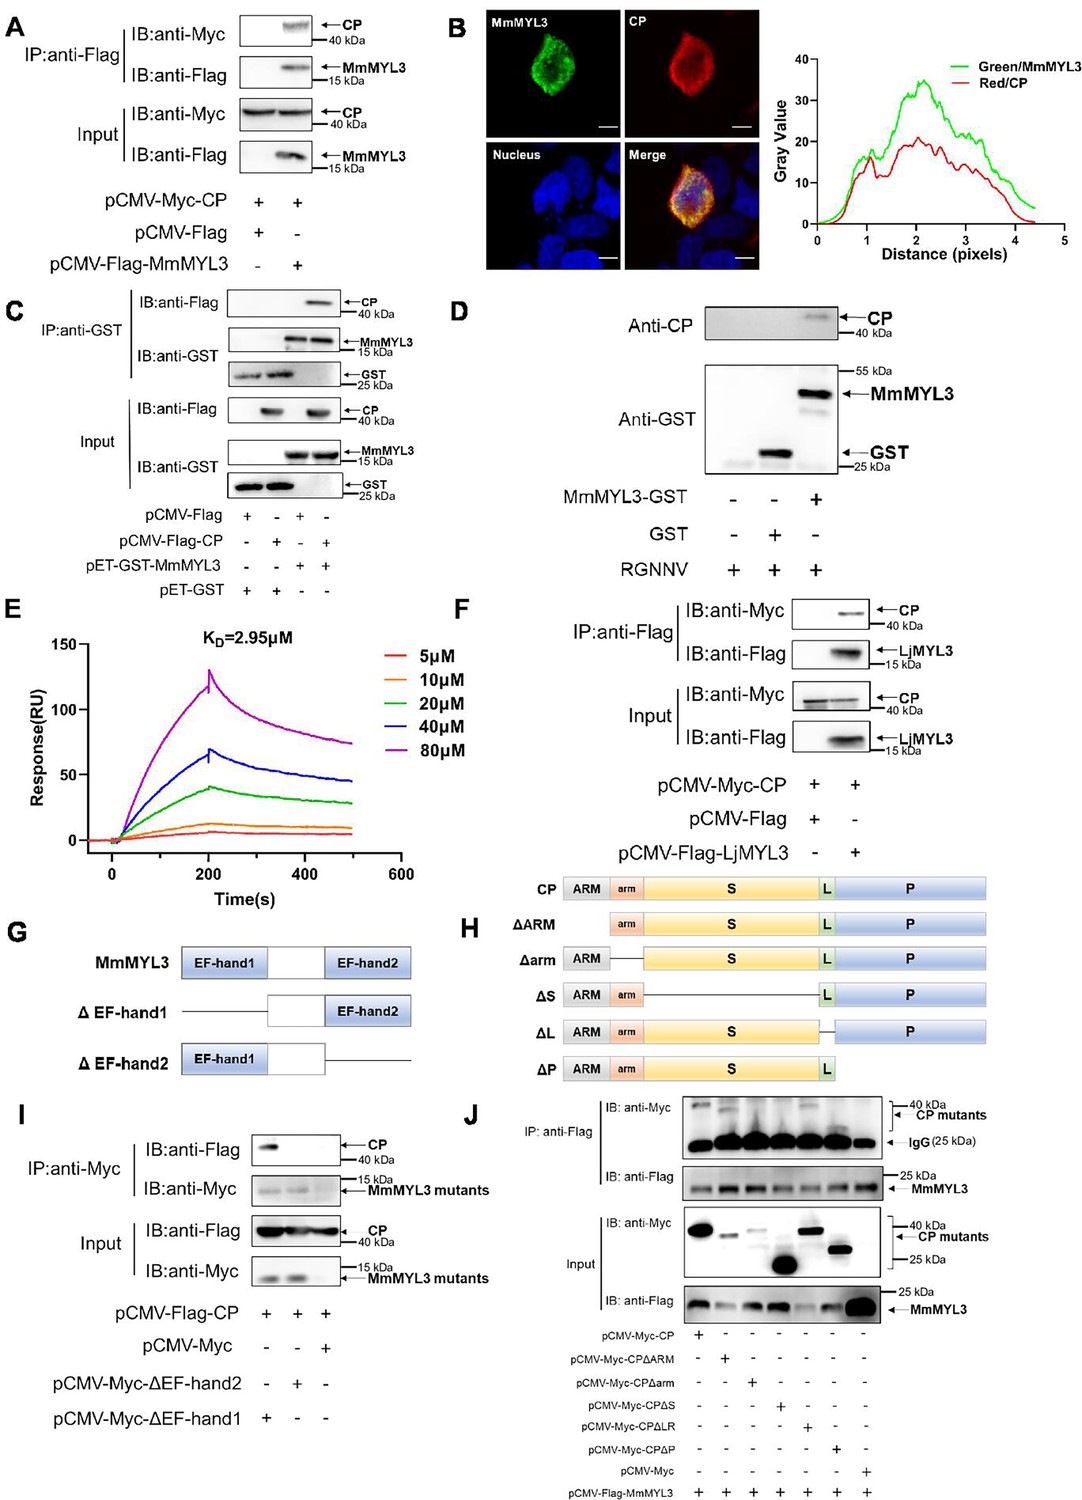
MmMYL3 interacts with CP.
(A) Immunoprecipitation (IP) (with anti-Flag) and immunoblot analysis (with anti-Flag and anti-Myc) of HEK293 cells transfected with plasmids encoding MmMYL3-Flag and CP-Myc for 48 hr. (B) HEK293T cells were co-transfected with MmMYL3-Flag and CP-Myc plasmids. MmMYL3 (green) and CP (red) were detected by immunofluorescence staining with anti-Flag or anti-Myc abs, respectively. Nucleus was stained by DAPI, bar = 10 μm. (C) The lysates of HEK293T cells transfected with indicated plasmids were pulled down with purified MmMYL3-GST or GST proteins followed by immunoblotting with anti-GST and anti-Flag abs. (D) Pull-down of RGNNV virions by MmMYL3-GST or GST proteins. RGNNV, purified proteins, and magnetic streptavidin beads were co-incubated as indicated. Pull-down was performed with a magnet, and the pellet was subjected to western blot analysis. (E) Surface plasmon resonance (SPR) analysis of MmMYL3-CP interaction. A 1:1 binding model was used to calculate the KD. (F) Plasmids carrying MYL3 from sea perch (LjMYL3) were transfected into HEK293T cells, together with CP-Myc plasmid. At 48 hr post-transfection, the cell lysates were subjected to Co-IP analysis with anti-Flag magnetic beads as indicated. (G) Schematic diagram of MmMYL3 and its truncated mutants. (H) Schematic diagram of CP and its truncated mutants. (I) IP (with anti-Myc) and immunoblot analysis (with anti-Flag and anti-Myc) of HEK293 cells transfected with plasmids encoding CP-Flag and Myc-tagged full-length MmMYL3 or its truncated mutants for 48 hr. (J) HEK293T cells were co-transfected with MmMYL3-Flag and different Myc-tagged CP mutants for 48 hr. Co-IP assays were performed as described above.
-
Figure 1—source data 1
Original files for western blot analysis displayed in Figure 1A.
- https://cdn.elifesciences.org/articles/104772/elife-104772-fig1-data1-v1.zip
-
Figure 1—source data 2
PDF file containing original western blots for Figure 1A, indicating the relevant bands and treatments.
- https://cdn.elifesciences.org/articles/104772/elife-104772-fig1-data2-v1.pdf
-
Figure 1—source data 3
Original data of Figure 1B.
- https://cdn.elifesciences.org/articles/104772/elife-104772-fig1-data3-v1.zip
-
Figure 1—source data 4
Original files for western blot analysis displayed in Figure 1C.
- https://cdn.elifesciences.org/articles/104772/elife-104772-fig1-data4-v1.zip
-
Figure 1—source data 5
PDF file containing original western blots for Figure 1C, indicating the relevant bands and treatments.
- https://cdn.elifesciences.org/articles/104772/elife-104772-fig1-data5-v1.pdf
-
Figure 1—source data 6
Original files for western blot analysis displayed in Figure 1D.
- https://cdn.elifesciences.org/articles/104772/elife-104772-fig1-data6-v1.zip
-
Figure 1—source data 7
PDF file containing original western blots for Figure 1D, indicating the relevant bands and treatments.
- https://cdn.elifesciences.org/articles/104772/elife-104772-fig1-data7-v1.pdf
-
Figure 1—source data 8
Original data of Figure 1E.
- https://cdn.elifesciences.org/articles/104772/elife-104772-fig1-data8-v1.zip
-
Figure 1—source data 9
Original files for western blot analysis displayed in Figure 1F.
- https://cdn.elifesciences.org/articles/104772/elife-104772-fig1-data9-v1.zip
-
Figure 1—source data 10
PDF file containing original western blots for Figure 1F, indicating the relevant bands and treatments.
- https://cdn.elifesciences.org/articles/104772/elife-104772-fig1-data10-v1.pdf
-
Figure 1—source data 11
Original files for western blot analysis displayed in Figure 1I.
- https://cdn.elifesciences.org/articles/104772/elife-104772-fig1-data11-v1.zip
-
Figure 1—source data 12
PDF file containing original western blots for Figure 1I, indicating the relevant bands and treatments.
- https://cdn.elifesciences.org/articles/104772/elife-104772-fig1-data12-v1.pdf
-
Figure 1—source data 13
Original files for western blot analysis displayed in Figure 1J.
- https://cdn.elifesciences.org/articles/104772/elife-104772-fig1-data13-v1.zip
-
Figure 1—source data 14
PDF file containing original western blots for Figure 1J, indicating the relevant bands and treatments.
- https://cdn.elifesciences.org/articles/104772/elife-104772-fig1-data14-v1.pdf
Figure 1—figure supplement 1
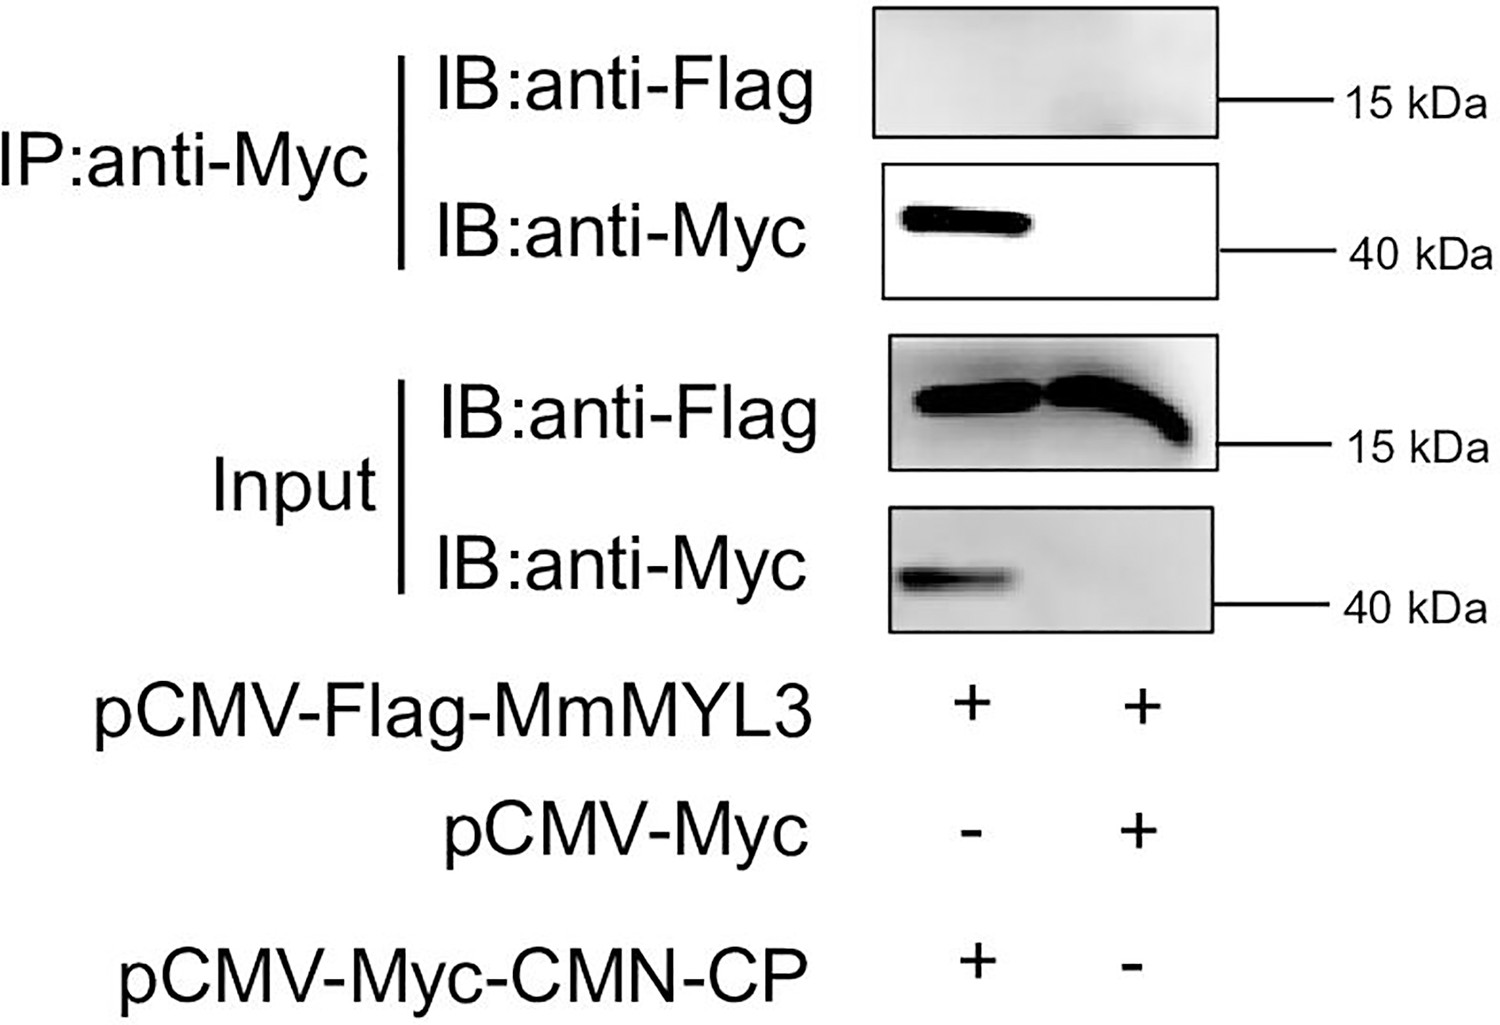
MmMYL3 could not interact with CP of covert mortality nodavirus (CMNV).
Immunoprecipitation (IP) (with anti-Myc) and immunoblot analysis (with anti-Flag and anti-Myc) of HEK293 cells transfected with plasmids encoding MmMYL3-Flag and CMNV-CP-Myc for 48 hr.
-
Figure 1—figure supplement 1—source data 1
Original files for western blot analysis displayed in Figure 1—figure supplement 1.
- https://cdn.elifesciences.org/articles/104772/elife-104772-fig1-figsupp1-data1-v1.zip
-
Figure 1—figure supplement 1—source data 2
PDF file containing original western blots for Figure 1—figure supplement 1, indicating the relevant bands and treatments.
- https://cdn.elifesciences.org/articles/104772/elife-104772-fig1-figsupp1-data2-v1.pdf
Figure 2
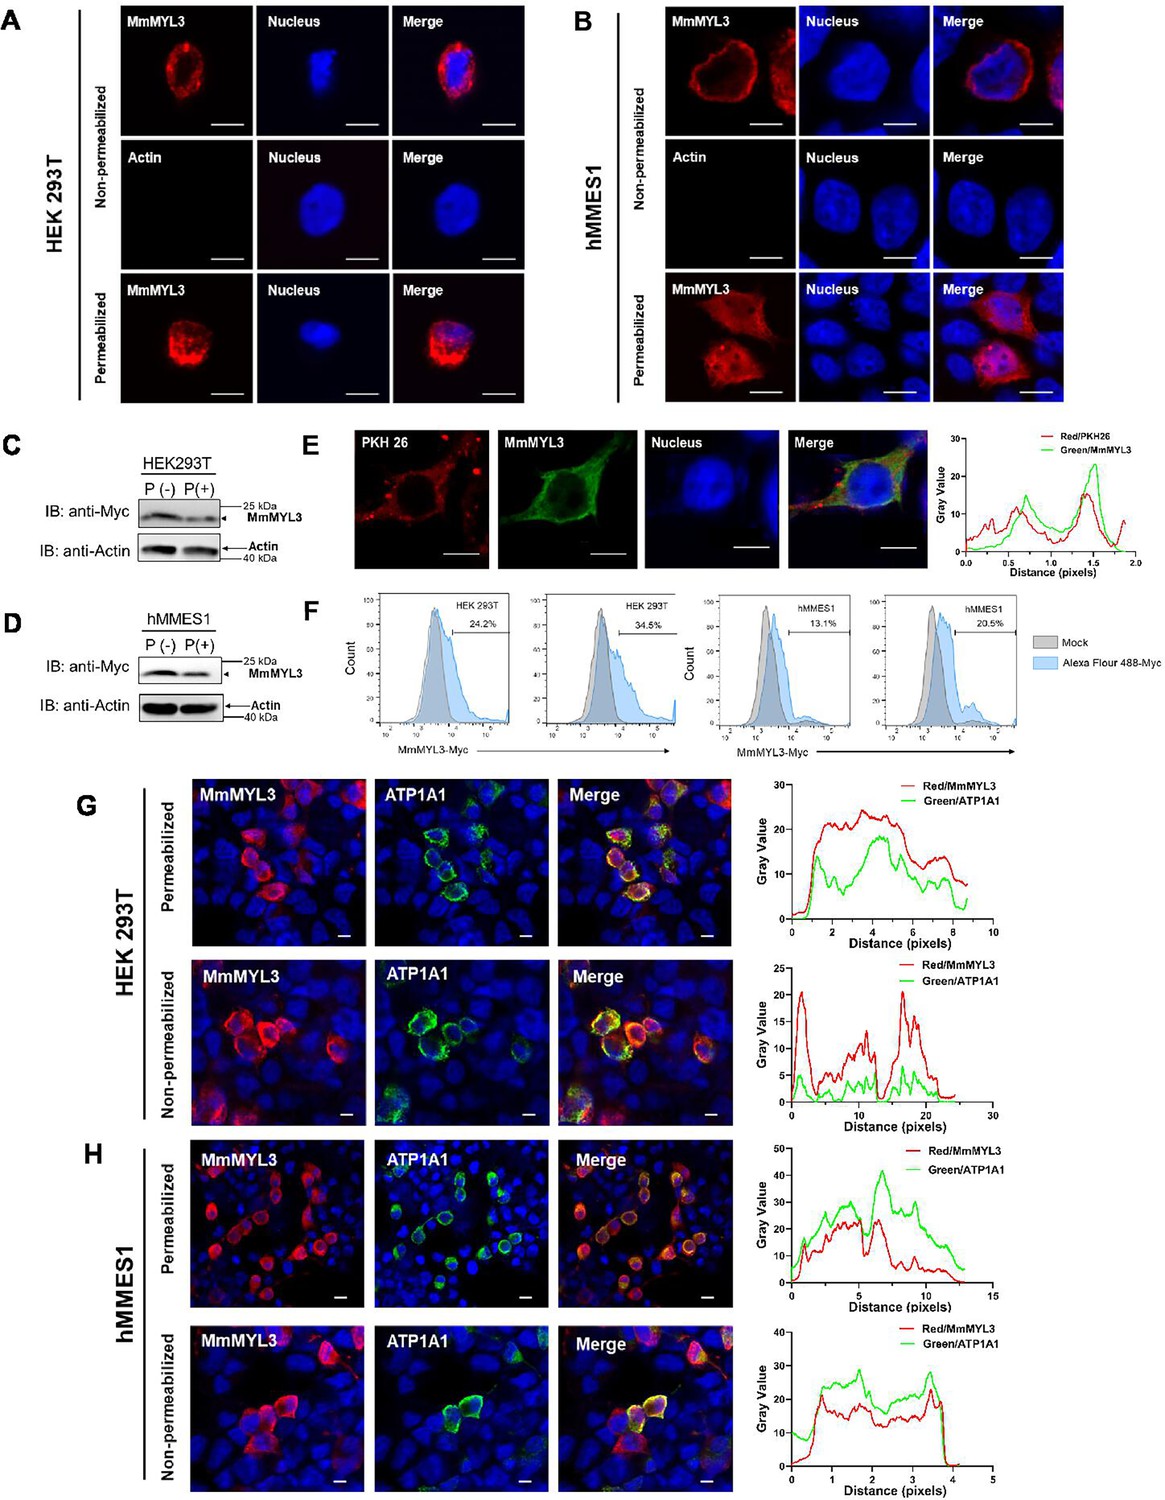
Surface localization of MmMYL3 in HEK293T and hMMES1 cells.
(A and B) HEK293T (A) or hMMES1 (B) cells transfected with MmMYL3-Myc plasmids were fixed with formalin, treated with Triton X-100 or not, and immunostained with anti-Myc abs or anti-Actin abs, respectively. Cell nuclei were stained with DAPI. Bar = 10 μm. (C and D) HEK293T and hMMES1 cells transfected with MmMYL3-Myc plasmid were treated with proteinase K (P+) or without proteinase K (P-) and harvested for a western blot analysis using anti-Myc and anti-Actin abs. (E) hMMES1 cells transfected with MmMYL3-Myc plasmid were labeled with PKH 26 (red) and stained with anti-Myc abs (green). Nucleus was stained by DAPI, bar = 10 μm. (F) HEK293T and hMMES1 cells transfected with Myc-MmMYL3 were stained with Alexa Fluor 488-conjugated anti-Myc abs. Surface expression of MmMYL3 was analyzed by flow cytometry. (G and H) HEK293T or hMMES1 cells were co-transfected with MmMYL3-Myc and ATP1A1-Flag plasmids. MmMYL3 (red) and ATP1A1 (green) were detected by immunofluorescence staining with anti-Myc or anti-Flag abs in permeabilized or non-permeabilized conditions. Nucleus was stained by DAPI, bar = 10 μm.
-
Figure 2—source data 1
Original files for western blot analysis displayed in Figure 2C and D.
- https://cdn.elifesciences.org/articles/104772/elife-104772-fig2-data1-v1.zip
-
Figure 2—source data 2
PDF file containing original western blots for Figure 2C and D, indicating the relevant bands and treatments.
- https://cdn.elifesciences.org/articles/104772/elife-104772-fig2-data2-v1.pdf
-
Figure 2—source data 3
Original data of Figure 2E.
- https://cdn.elifesciences.org/articles/104772/elife-104772-fig2-data3-v1.zip
-
Figure 2—source data 4
Original data of Figure 2F.
- https://cdn.elifesciences.org/articles/104772/elife-104772-fig2-data4-v1.zip
-
Figure 2—source data 5
Original data of Figure 2G.
- https://cdn.elifesciences.org/articles/104772/elife-104772-fig2-data5-v1.zip
-
Figure 2—source data 6
Original data of Figure 2H.
- https://cdn.elifesciences.org/articles/104772/elife-104772-fig2-data6-v1.zip
Figure 3 with 1 supplement
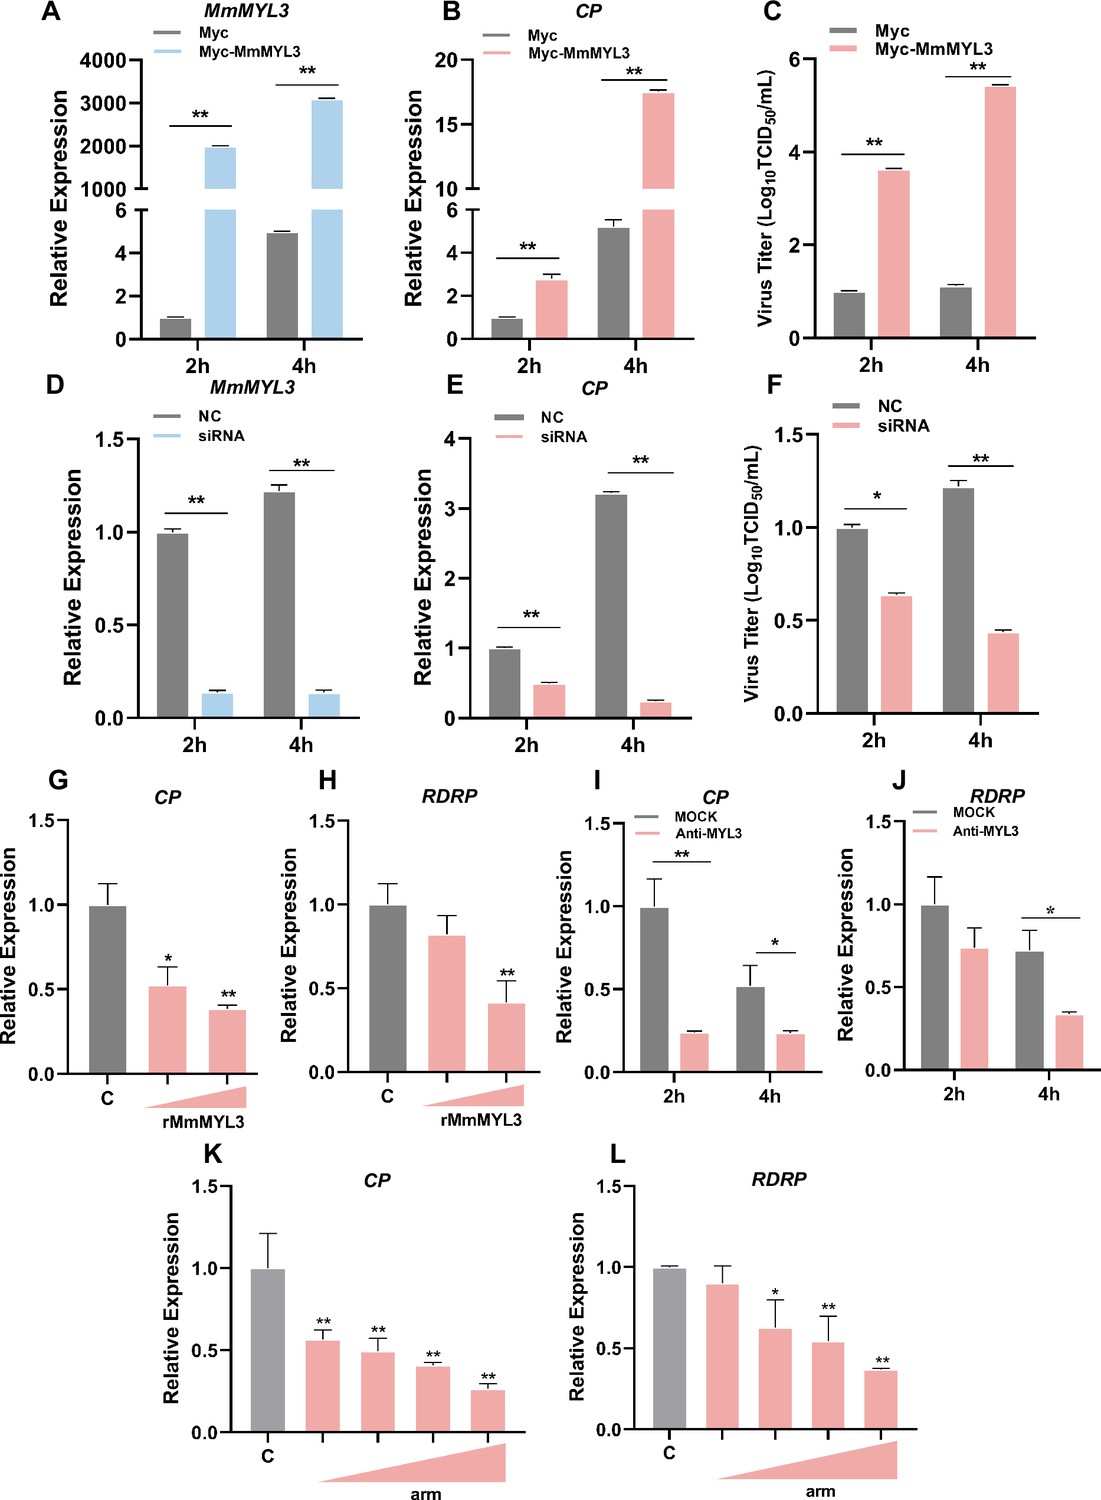
Effect of MmMYL3 on RGNNV entry.
(A and B) hMMES1 cells were transfected with MmMYL3-Myc or Myc plasmid (control) and infected with RGNNV (multiplicity of infection [MOI] = 1) for 2 and 4 hr, respectively. Then, the cells were lysed for quantitative reverse transcription PCR (qRT-PCR) to detect the expression of MmMYL3 and CP. (C) Virus titer detection in MmMYL3-Myc-transfected hMMES1 cells post RGNNV infection for 2 and 4 hr. (D and E) qRT-PCR analysis of MmMYL3 and CP expression in siMmMYL3- or control-transfected hMMES1 cells infected with RGNNV for 2 and 4 hr. (F) Virus titer detection in siMmMYL3-transfected hMMES1 cells post RGNNV infection for 2 and 4 hr. (G and H) RGNNV was incubated with purified MmMYL3-GST proteins (100 or 500 ng) for 4 hr at 4°C, then was added to hMMES1 cells which were further incubated for 4 hr at 4°C. Cells were washed with PBS three times and harvested for CP (G) and RNA-dependent RNA polymerase (RDRP) (H) expression detection. (I and J) hMMES1 cells were incubated with commercial anti-human MYL3 abs (1:50) for 4 hr and then infected with RGNNV for 2 or 4 hr at 4°C. After being washed with PBS three times, cells were harvested for CP (I) and RDRP (J) expression detection. (K and L) hMMES1 cells were treated with different concentrations of arm peptides for 2 hr at 4°C, and after RGNNV infection for 4 hr, CP (K) and RDRP (L) expression were detected by qRT-PCR. The results are presented as mean ± SD. Statistical significance was determined by an unpaired two-tailed Student’s t test. *p<0.05, **p<0.01. Data are representative of three independent experiments.
-
Figure 3—source data 1
Original data of Figure 3.
- https://cdn.elifesciences.org/articles/104772/elife-104772-fig3-data1-v1.zip
Figure 3—figure supplement 1
The role of MmMYL3 in RGNNV infection.
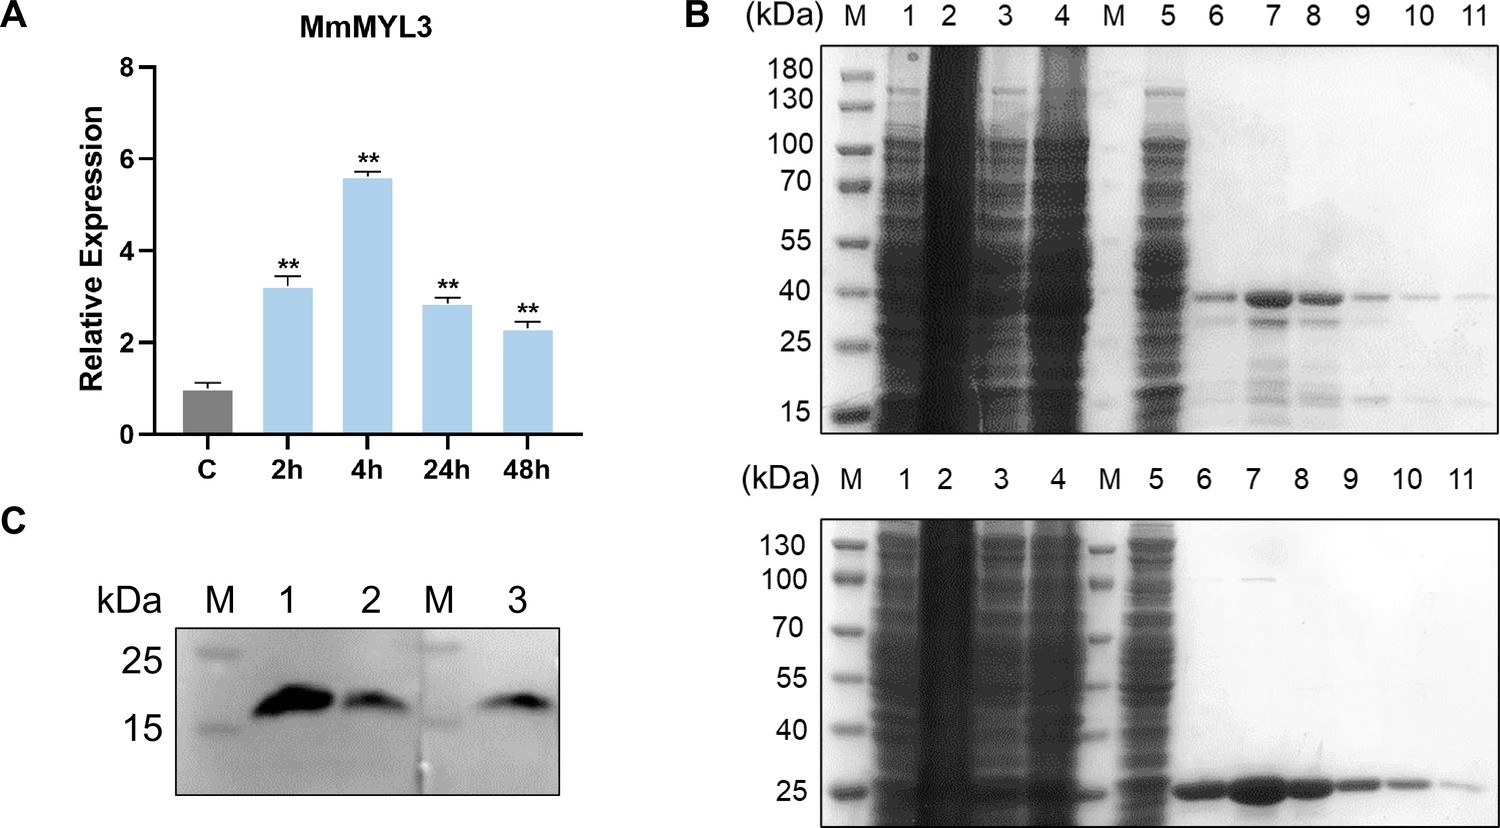
(A) Expression analysis of MmMYL3 in hMMES1 cells at 2, 4, 24, and 48 hr post RGNNV infection. hMMES1 cells were infected with RGNNV (multiplicity of infection [MOI] = 1) for 2, 4, 24, and 48 hr, respectively. Then, the cells were lysed for quantitative reverse transcription PCR (qRT-PCR) to detect the expression of MmMYL3. The results are presented as mean ± SD. Statistical significance was determined by an unpaired two-tailed Student’s t test. *p<0.05, **p<0.01. Data are representative of three independent experiments. (B) Recombinant expression and purification of MmMYL3-GST (top) and GST (bottom). Lane M, marker; lane 1, cell extracts before IPTG induction; lane 2, cell extracts after IPTG induction; lane 3, supernatant after centrifugation; lane 4, precipitate after centrifugation; lane 5, flow through; lanes 6–11, purified recombinant. (C) MYL3 antibody validation. Lane M, marker; lane 1, HEK 293T cell lysate; lane 2, hMMES1 cell lysate; lane 3, MmMYL3-overexpressing hMMES1 cell lysate.
-
Figure 3—figure supplement 1—source data 1
Original files for western blot analysis displayed in Figure 3—figure supplement 1B.
- https://cdn.elifesciences.org/articles/104772/elife-104772-fig3-figsupp1-data1-v1.zip
-
Figure 3—figure supplement 1—source data 2
PDF file containing original western blots for Figure 3—figure supplement 1B, indicating the relevant bands and treatments.
- https://cdn.elifesciences.org/articles/104772/elife-104772-fig3-figsupp1-data2-v1.pdf
-
Figure 3—figure supplement 1—source data 3
Original files for western blot analysis displayed in Figure 3—figure supplement 1C.
- https://cdn.elifesciences.org/articles/104772/elife-104772-fig3-figsupp1-data3-v1.zip
-
Figure 3—figure supplement 1—source data 4
PDF file containing original western blots for Figure 3—figure supplement 1C, indicating the relevant bands and treatments.
- https://cdn.elifesciences.org/articles/104772/elife-104772-fig3-figsupp1-data4-v1.pdf
Figure 4
MmMYL3 was involved in RGNNV internalization, and recombinant MmMYL3 protein treatment protects marine medaka from RGNNV pathogenesis.
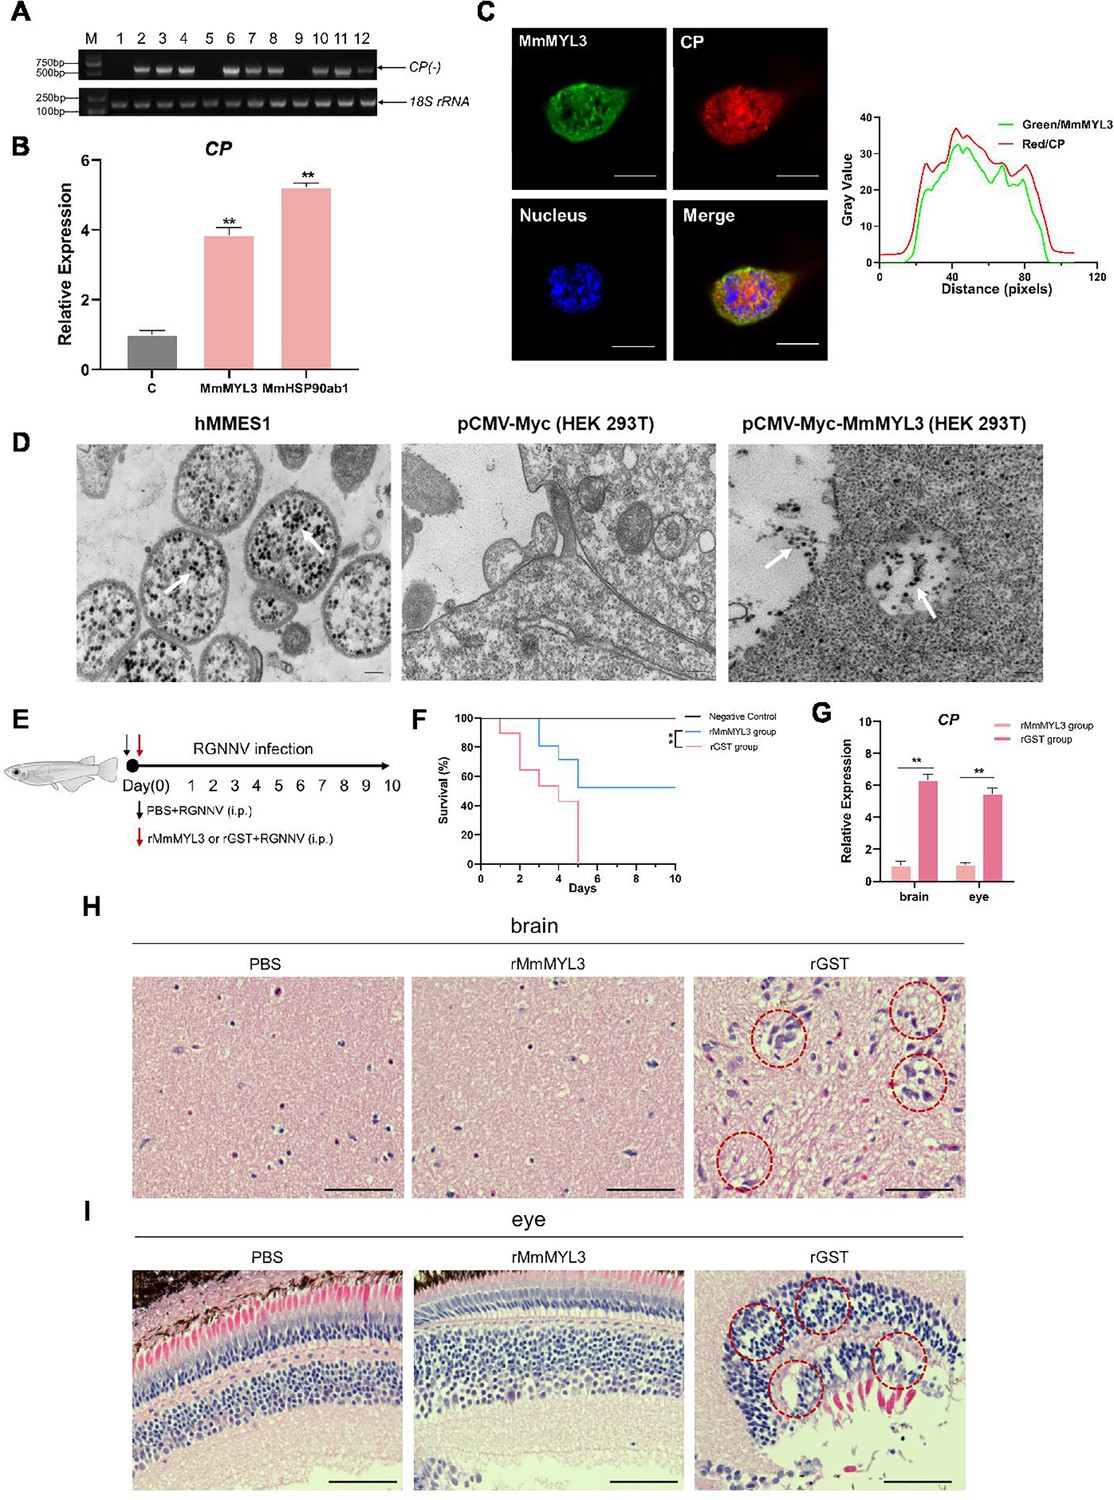
(A) Reverse transcription PCR (RT-PCR) analysis of CP (-) sequence. HEK293T cells were transfected with Myc empty vector (lines 1, 5, and 9), MmMYL3-Myc (lines 2, 6, and 10), MmHSP90ab1-Myc (lines 3, 7, and 11), or both MmMYL3-Myc and MmHSP90ab1-Myc (lines 4, 8, and 12) plasmids for 24 hr, respectively. Then, cells were infected with RGNNV (multiplicity of infection [MOI] = 5) for 4 hr. Next, the cells were washed to remove any unbound viruses and incubated for 24 hr (lines 1–4), 48 hr (lines 5–8), and 72 hr (lines 9–12). Cells were harvested, and total RNA was extracted for CP (-) detection by RT-PCR. Human 18S rRNA was detected as a reference. (B) HEK293T cells were transfected with MmMYL3-Myc, MmHSP90ab1-Myc, or Myc plasmids, respectively. Then, transfected cells were infected with RGNNV (multiplicity of infection [MOI] = 5) for 24 hr. Next, the cells were washed to remove any unbound viruses, and total RNA was extracted for CP detection by quantitative RT-PCR (qRT-PCR). (C) HEK293T cells transfected with Myc empty vector or MmMYL3-Myc were infected with RGNNV (MOI = 5) for 24 hr. CP (red) and MmMYL3 (green) were detected by immunofluorescence staining. Cell nuclei were stained with DAPI. Bar = 10 μm. (D) Transmission electron micrograph of RGNNV-infected hMMES1 cells and HEK293T cells transfected with Myc empty vector or MmMYL3-Myc with 80,000 magnifications. Bar = 200 nm. (E) Schematic representation of the experimental design. RGNNV (100 TCID50) was incubated with purified GST-tagged MmMYL3 recombinant protein (rMmMYL3, 500 ng) or GST protein (rGST, 500 ng) for 4 hr at 4°C. Marine medaka were infected with rMmMYL3-RGNNV or GST-RGNNV mixture by intraperitoneal (i.p.) injection, respectively. The negative control group of fishes was injected with the same volume of PBS. (F) Survival rates of marine medaka infected with RGNNV and MmMYL3 or GST protein mixtures. The cumulative survival rate was determined from 1 to 10 days post-infection. (G) Quantification of RGNNV CP expression in brain and eye tissues by qRT-PCR. (H and I) Histopathological analysis of the brain (H) and eye (I) tissues of fish treated with PBS, rMmMYL3, or rGST. Marine medaka were necropsied, and the eyes and brains were collected at day 5 post-infection. Hematoxylin and eosin (H&E) staining was used to assess tissue integrity. The vacuolization in eyes and brains was marked by a red dotted circle. Bar = 100 µm. Data were collected from three independent experiments and presented as mean ± SD. All results are representative of three similar experiments. **, p<0.01.
-
Figure 4—source data 1
Original files for western blot analysis displayed in Figure 4A.
- https://cdn.elifesciences.org/articles/104772/elife-104772-fig4-data1-v1.zip
-
Figure 4—source data 2
PDF file containing original western blots for Figure 4A, indicating the relevant bands and treatments.
- https://cdn.elifesciences.org/articles/104772/elife-104772-fig4-data2-v1.pdf
-
Figure 4—source data 3
Original data of Figure 4B.
- https://cdn.elifesciences.org/articles/104772/elife-104772-fig4-data3-v1.zip
-
Figure 4—source data 4
Original data of Figure 4C.
- https://cdn.elifesciences.org/articles/104772/elife-104772-fig4-data4-v1.zip
-
Figure 4—source data 5
Original data of Figure 4F.
- https://cdn.elifesciences.org/articles/104772/elife-104772-fig4-data5-v1.zip
-
Figure 4—source data 6
Original data of Figure 4G.
- https://cdn.elifesciences.org/articles/104772/elife-104772-fig4-data6-v1.zip
Figure 5
RGNNV triggers macropinocytosis mediated by MmMYL3.
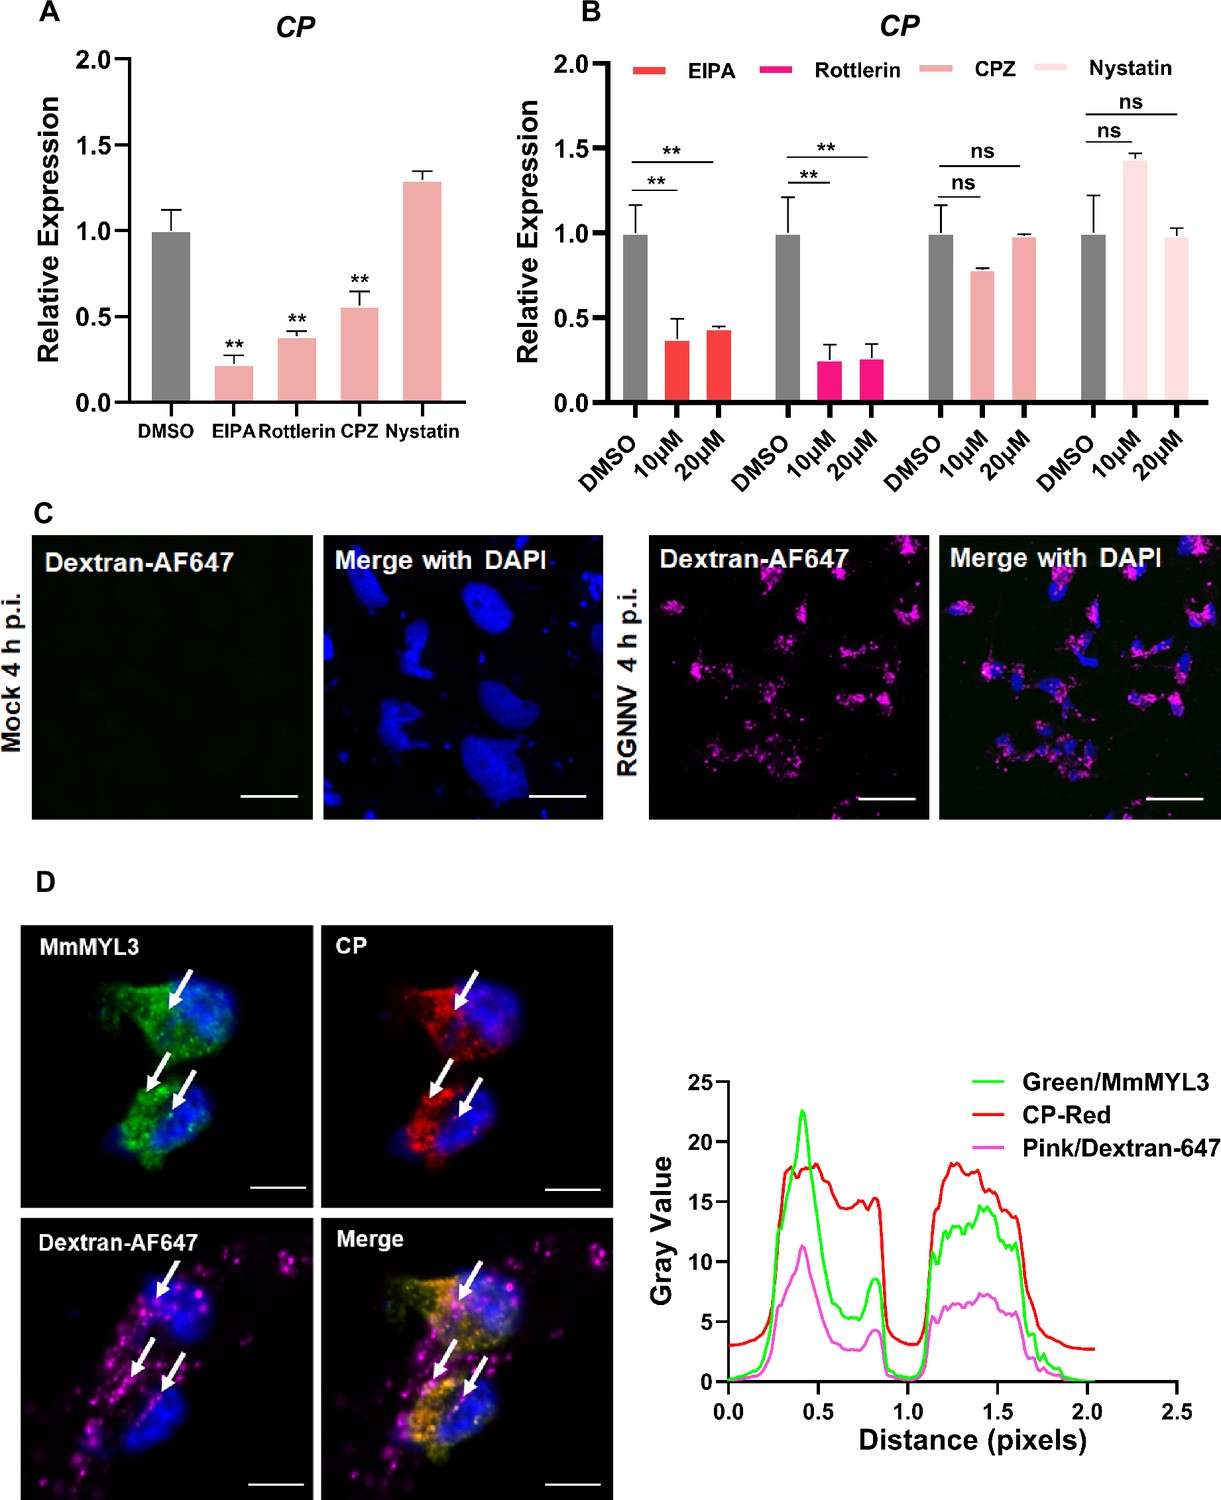
(A) Cells pretreated with EIPA, Rottlerin, CPZ, or Nystatin were infected with RGNNV (multiplicity of infection [MOI] = 1) for 4 hr at 28°C, and the expression of CP was analyzed by quantitative reverse transcription PCR (qRT-PCR). (B) MmMYL3-overexpressing hMMES1 cells were treated with different inhibitors and incubated with RGNNV (MOI = 1) for 4 hr at 28°C, and the expression of CP was analyzed by qRT-PCR. (C) hMMES1 cells were mock-infected or infected with RGNNV (MOI = 1) in medium containing Alexa Fluor 647-conjugated dextran (10,000 MW). At 4 hr post-infection (hpi), cells were fixed and nuclei counterstained with DAPI and imaged on a confocal microscope. Bar = 10 μm. (D) Co-localization of MmMYL3 (green), RGNNV CP (red), and dextran-AF647 in RGNNV-infected hMMES1 cells. Cell nuclei were stained with DAPI. Bar = 10 μm. Data were collected from three independent experiments and presented as mean ± SD. All results are representative of three similar experiments. ns, not significant; **, p<0.01.
-
Figure 5—source data 1
Original data of Figure 5A.
- https://cdn.elifesciences.org/articles/104772/elife-104772-fig5-data1-v1.zip
-
Figure 5—source data 2
Original data of Figure 5B.
- https://cdn.elifesciences.org/articles/104772/elife-104772-fig5-data2-v1.zip
-
Figure 5—source data 3
Original data of Figure 5D.
- https://cdn.elifesciences.org/articles/104772/elife-104772-fig5-data3-v1.zip
Figure 6
MmIGF1R is involved in MmMYL3-mediated RGNNV internalization.
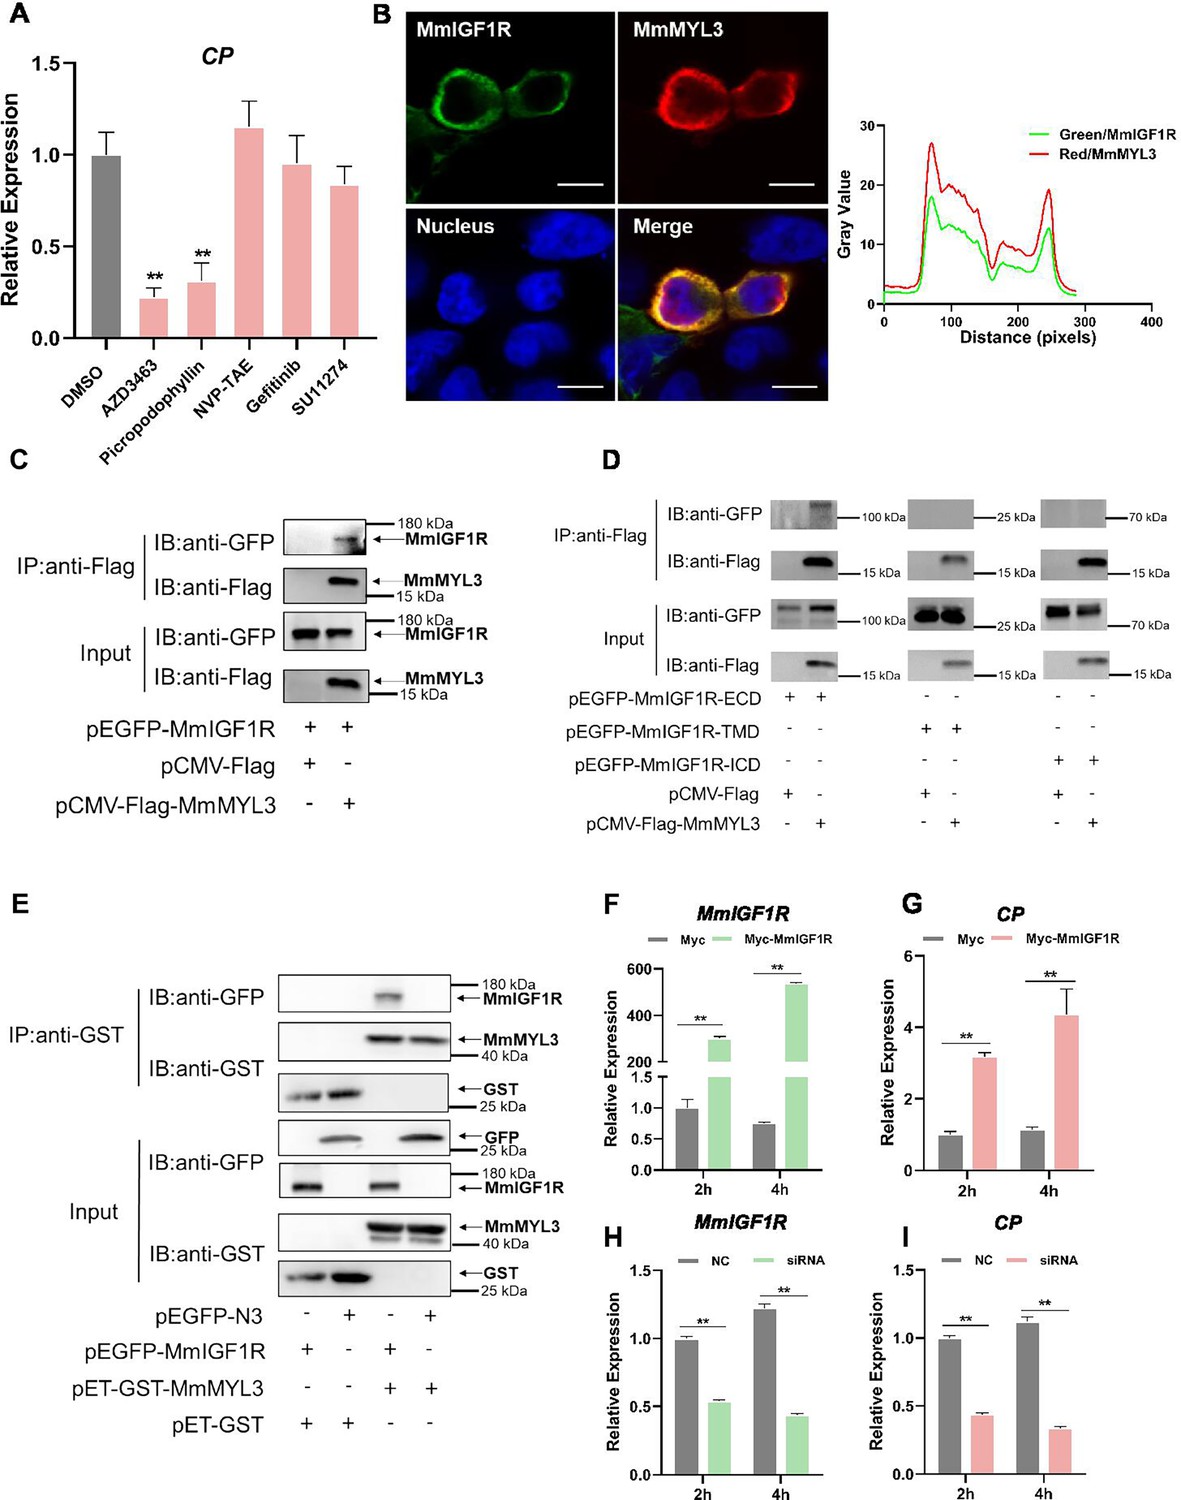
(A) MmMYL3-overexpressing hMMES1 cells were treated with different receptor tyrosine kinases (RTKs) inhibitors and incubated with RGNNV for 4 hr at 28°C, and the expression of CP was analyzed by quantitative reverse transcription PCR (qRT-PCR). (B) MmIGF1R-GFP and MmMYL3-Myc were transfected into HEK293T cells as indicated for immunofluorescence analysis by using anti-Myc (red) abs. Nuclei were stained with DAPI. Bar = 10 μm. (C and D) Immunoprecipitation (IP) (with anti-Flag) and immunoblot analysis (with anti-Flag and anti-GFP) of HEK293 cells transfected with plasmids encoding MmMYL3-Flag, MmIGF1R-GFP, MmIGF1R-ECD-GFP, MmIGF1R-TMD-GFP, or MmIGF1R-ICD-GFP for 48 hr. (E) The lysates of HEK293T cells transfected with indicated plasmids were pulled down with purified MmMYL3-GST or GST proteins. The proteins bound to MmIGF1R, and the inputs were immunoblotted with anti-GST and anti-GFP abs. (F and G) hMMES1 cells were transfected with MmIGF1R-GFP or GFP-N3 plasmid (control) and infected with RGNNV (multiplicity of infection [MOI] = 1) for 2 and 4 hr, respectively. Then, the cells were lysed for qRT-PCR to detect the expression of MmIGF1R and CP. (H and I) qRT-PCR analysis of MmIGF1R and CP mRNA expression of siMmIGF1R- or NC (control)-transfected hMMES1 cells, following infection with RGNNV for 2 and 4 hr. Data were collected from three independent experiments and presented as mean ± SD. All results are representative of three similar experiments. **, p<0.01.
-
Figure 6—source data 1
Original data of Figure 6A.
- https://cdn.elifesciences.org/articles/104772/elife-104772-fig6-data1-v1.zip
-
Figure 6—source data 2
Original data of Figure 6B.
- https://cdn.elifesciences.org/articles/104772/elife-104772-fig6-data2-v1.zip
-
Figure 6—source data 3
Original files for western blot analysis displayed in Figure 6C.
- https://cdn.elifesciences.org/articles/104772/elife-104772-fig6-data3-v1.zip
-
Figure 6—source data 4
PDF file containing original western blots for Figure 6C, indicating the relevant bands and treatments.
- https://cdn.elifesciences.org/articles/104772/elife-104772-fig6-data4-v1.pdf
-
Figure 6—source data 5
Original files for western blot analysis displayed in Figure 6D.
- https://cdn.elifesciences.org/articles/104772/elife-104772-fig6-data5-v1.zip
-
Figure 6—source data 6
PDF file containing original western blots for Figure 6D, indicating the relevant bands and treatments.
- https://cdn.elifesciences.org/articles/104772/elife-104772-fig6-data6-v1.pdf
-
Figure 6—source data 7
Original files for western blot analysis displayed in Figure 6E.
- https://cdn.elifesciences.org/articles/104772/elife-104772-fig6-data7-v1.zip
-
Figure 6—source data 8
PDF file containing original western blots for Figure 6E, indicating the relevant bands and treatments.
- https://cdn.elifesciences.org/articles/104772/elife-104772-fig6-data8-v1.pdf
-
Figure 6—source data 9
Original data of Figure 6F.
- https://cdn.elifesciences.org/articles/104772/elife-104772-fig6-data9-v1.zip
-
Figure 6—source data 10
Original data of Figure 6G.
- https://cdn.elifesciences.org/articles/104772/elife-104772-fig6-data10-v1.zip
-
Figure 6—source data 11
Original data of Figure 6H.
- https://cdn.elifesciences.org/articles/104772/elife-104772-fig6-data11-v1.zip
-
Figure 6—source data 12
Original data of Figure 6I.
- https://cdn.elifesciences.org/articles/104772/elife-104772-fig6-data12-v1.zip
Figure 7
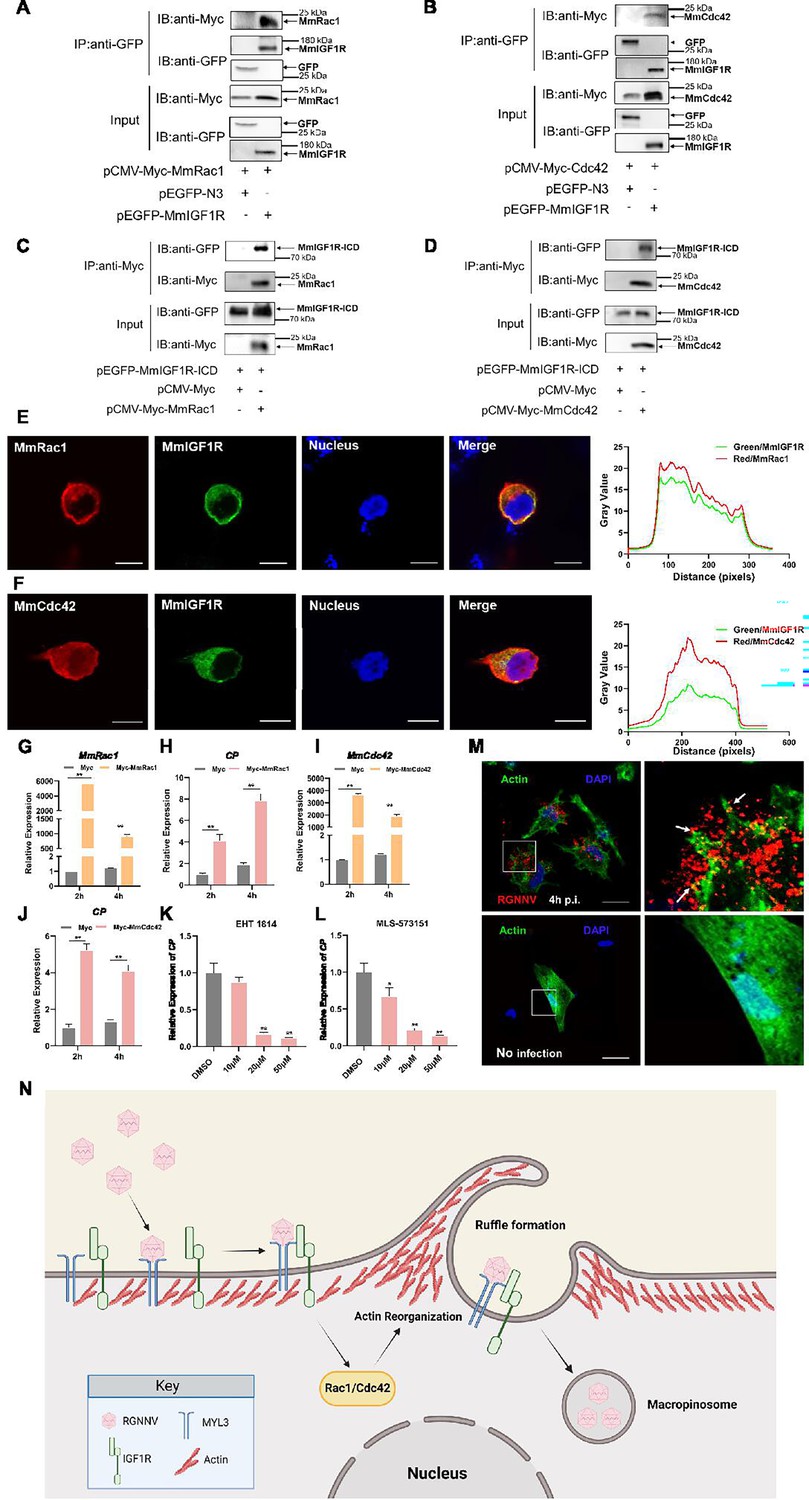
MmRac1 and MmCdc42 regulate RGNNV entry.
(A and B) HEK293T cells were transfected with MmIGF1R-GFP and MmRac1-Myc or MmCdc42-Myc plasmids as indicated for 48 hr, and the cell lysates were subjected to coimmunoprecipitation analysis with anti-GFP magnetic beads as described above. (C and D) HEK293T cells were transfected with MmRac1-Myc, MmCdc42-Myc, and MmIGF1R-ICD-GFP plasmids, respectively. At 48 hr post-transfection, the cell lysates were subjected to coimmunoprecipitation analysis with anti-Myc magnetic beads as indicated. (E and F) MmIGF1R-GFP and MmRac1-Myc or MmCdc42-Myc were transfected into HEK293T cells as indicated for immunofluorescence analysis by using anti-Myc (red) antibodies. Nuclei were stained with DAPI. Bar = 10 μm. (G–J) hMMES1 cells were transfected with MmRac1-Myc, MmCdc42-Myc, or pCMV-Myc (control) plasmids and infected with RGNNV (multiplicity of infection [MOI] = 1) for 2 and 4 hr, respectively. Then, the cells were lysed for quantitative reverse transcription PCR (qRT-PCR) to detect the expression of MmRac1, MmCdc42, and CP. (K and L) hMMES1 cells were treated with inhibitors of Rac1 (EHT1814) or Cdc42 (MLS-573151) for 4 hr, then infected with RGNNV (MOI = 1) for 4 hr at 28°C, and the cells were lysed for qRT-PCR to detect the expression of CP. (M) Actin cytoskeleton dynamics are involved in RGNNV entry. hMMES1 cells were exposed to RGNNV (MOI = 1) or PBS for 4 hr, and actin filaments were labeled with iFluor 488 phalloidin (green), then fixed and permeabilized as described above. Nuclei were stained with DAPI. Images were captured with a ×100 oil immersion objective. A higher magnification of the boxed area reveals the formation of actin protrusions at the cell surface membrane (arrows). Bar = 10 μm. Data were collected from three independent experiments and presented as mean ± SD. All results are representative of three similar experiments. *, p<0.05; **, p<0.01. (N) Model of RGNNV entry into host cells via macropinocytosis mediated by MmMYL3. RGNNV particles engage hMMES1 cells through interactions between CP and MYL3, a receptor on the cell surface, which is followed by interactions between MYL3 and IGF1R. Then, IGF1R activates and recruits small GTPases Rac1/Cdc42 to induce actin reorganization and facilitate the internalization of RGNNV via macropinocytosis.
-
Figure 7—source data 1
Original files for western blot analysis displayed in Figure 7A.
- https://cdn.elifesciences.org/articles/104772/elife-104772-fig7-data1-v1.zip
-
Figure 7—source data 2
PDF file containing original western blots for Figure 7A, indicating the relevant bands and treatments.
- https://cdn.elifesciences.org/articles/104772/elife-104772-fig7-data2-v1.pdf
-
Figure 7—source data 3
Original files for western blot analysis displayed in Figure 7B.
- https://cdn.elifesciences.org/articles/104772/elife-104772-fig7-data3-v1.zip
-
Figure 7—source data 4
PDF file containing original western blots for Figure 7B, indicating the relevant bands and treatments.
- https://cdn.elifesciences.org/articles/104772/elife-104772-fig7-data4-v1.pdf
-
Figure 7—source data 5
Original files for western blot analysis displayed in Figure 7C.
- https://cdn.elifesciences.org/articles/104772/elife-104772-fig7-data5-v1.zip
-
Figure 7—source data 6
PDF file containing original western blots for Figure 7C, indicating the relevant bands and treatments.
- https://cdn.elifesciences.org/articles/104772/elife-104772-fig7-data6-v1.pdf
-
Figure 7—source data 7
Original files for western blot analysis displayed in Figure 7D.
- https://cdn.elifesciences.org/articles/104772/elife-104772-fig7-data7-v1.zip
-
Figure 7—source data 8
PDF file containing original western blots for Figure 7D, indicating the relevant bands and treatments.
- https://cdn.elifesciences.org/articles/104772/elife-104772-fig7-data8-v1.pdf
-
Figure 7—source data 9
Original data of Figure 7E.
- https://cdn.elifesciences.org/articles/104772/elife-104772-fig7-data9-v1.zip
-
Figure 7—source data 10
Original data of Figure 7F.
- https://cdn.elifesciences.org/articles/104772/elife-104772-fig7-data10-v1.zip
-
Figure 7—source data 11
Original data of Figure 7G.
- https://cdn.elifesciences.org/articles/104772/elife-104772-fig7-data11-v1.zip
-
Figure 7—source data 12
Original data of Figure 7H.
- https://cdn.elifesciences.org/articles/104772/elife-104772-fig7-data12-v1.zip
-
Figure 7—source data 13
Original data of Figure 7I.
- https://cdn.elifesciences.org/articles/104772/elife-104772-fig7-data13-v1.zip
-
Figure 7—source data 14
Original data of Figure 7J.
- https://cdn.elifesciences.org/articles/104772/elife-104772-fig7-data14-v1.zip
-
Figure 7—source data 15
Original data of Figure 7K.
- https://cdn.elifesciences.org/articles/104772/elife-104772-fig7-data15-v1.zip
-
Figure 7—source data 16
Original data of Figure 7L.
- https://cdn.elifesciences.org/articles/104772/elife-104772-fig7-data16-v1.zip
Additional files
Download links
A two-part list of links to download the article, or parts of the article, in various formats.
Downloads (link to download the article as PDF)
Open citations (links to open the citations from this article in various online reference manager services)
Cite this article (links to download the citations from this article in formats compatible with various reference manager tools)
Myosin light chain 3 serves as a receptor for nervous necrosis virus entry into host cells via the macropinocytosis pathway
eLife 13:RP104772.
https://doi.org/10.7554/eLife.104772.4


