Single-molecule fluorimetry and gating currents inspire an improved optical voltage indicator
- University of Chicago, United States
Figures
Figure 1
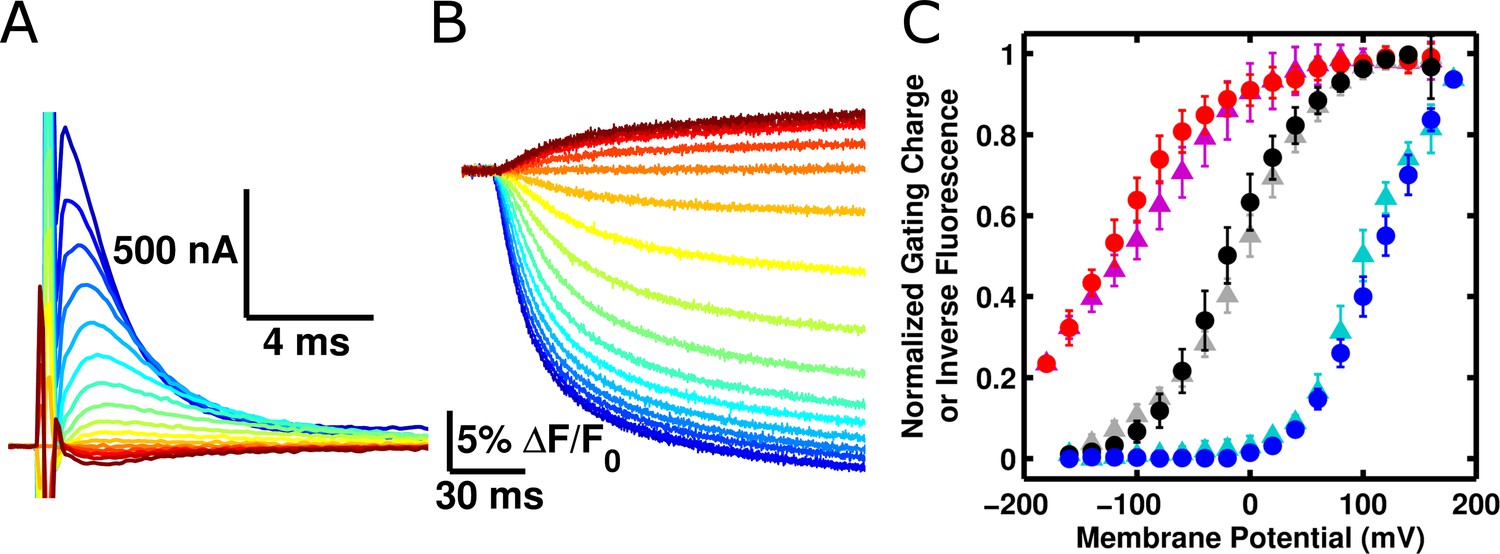
ArcLight fluorescence responds to voltage sensor movements.
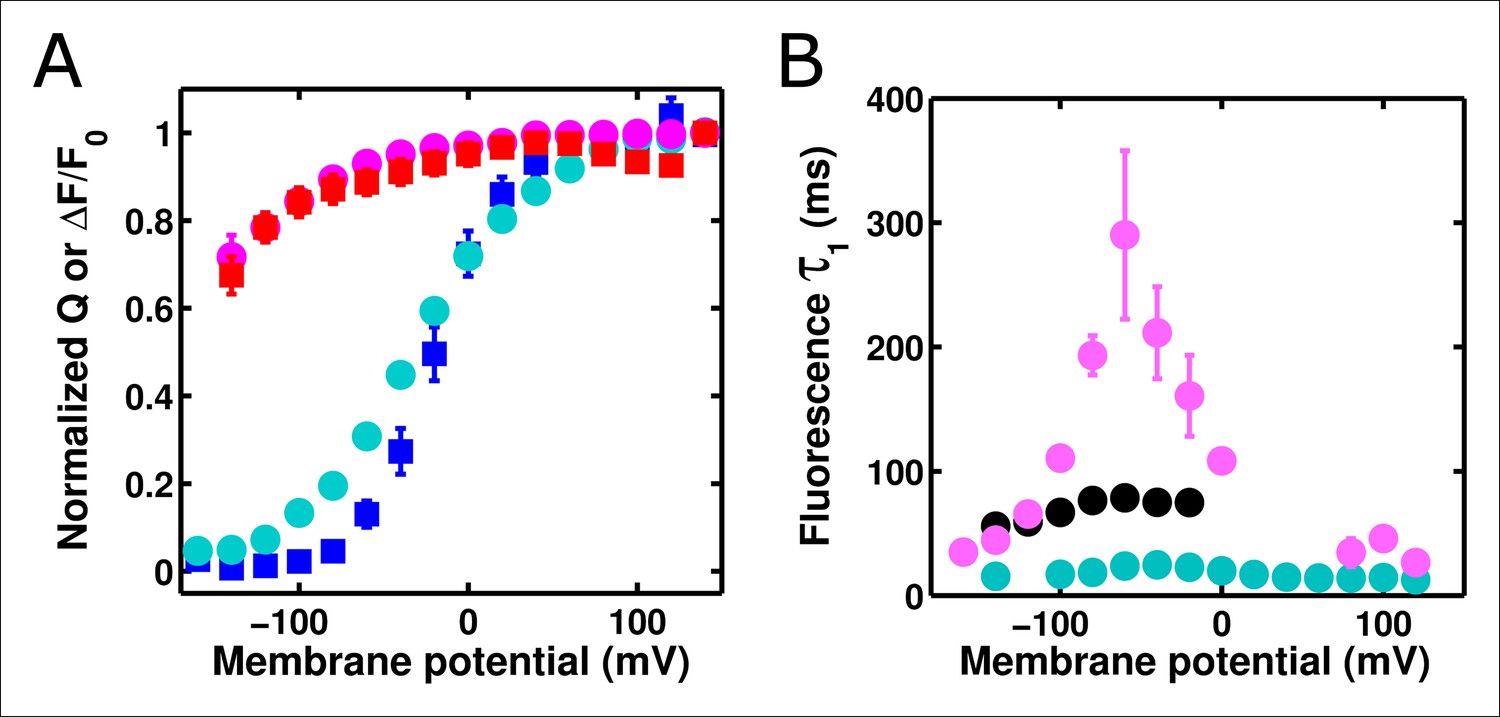
(A) Family of gating currents from an oocyte injected with ArcLight R217Q. The holding potential is -80 mV, and the pulses range from -160 mV (darkest red) to +140 mV (darkest blue) in 20 mV increments. (B) Fluorescence traces simultaneously acquired with gating currents in A. Colors indicate identical membrane potentials as in A. (C) Normalized gating-charge-versus-voltage (Q-V) curves (triangles; cyan – R217R, grey – R217Q, purple – R217E) and fluorescence-versus-voltage (F-V) curves (circles; blue – R217R, black – R217Q, red – R217E) for ArcLight. For clarity of comparison, the fluorescence is plotted as the change in fluorescence over the background fluorescence, multiplied by -1 (i.e., -ΔF/F0). Each Q-V curve was normalized by fitting a Boltzmann function to the data and scaling the limiting values of the function to 0 and 1. These scaling factors were then used to normalize each respective F-V curve. Error bars represent 95% confidence intervals of the mean. N = 5 for R217R, 7 for R217Q, and 6 for R217E.
Figure 2 with 1 supplement
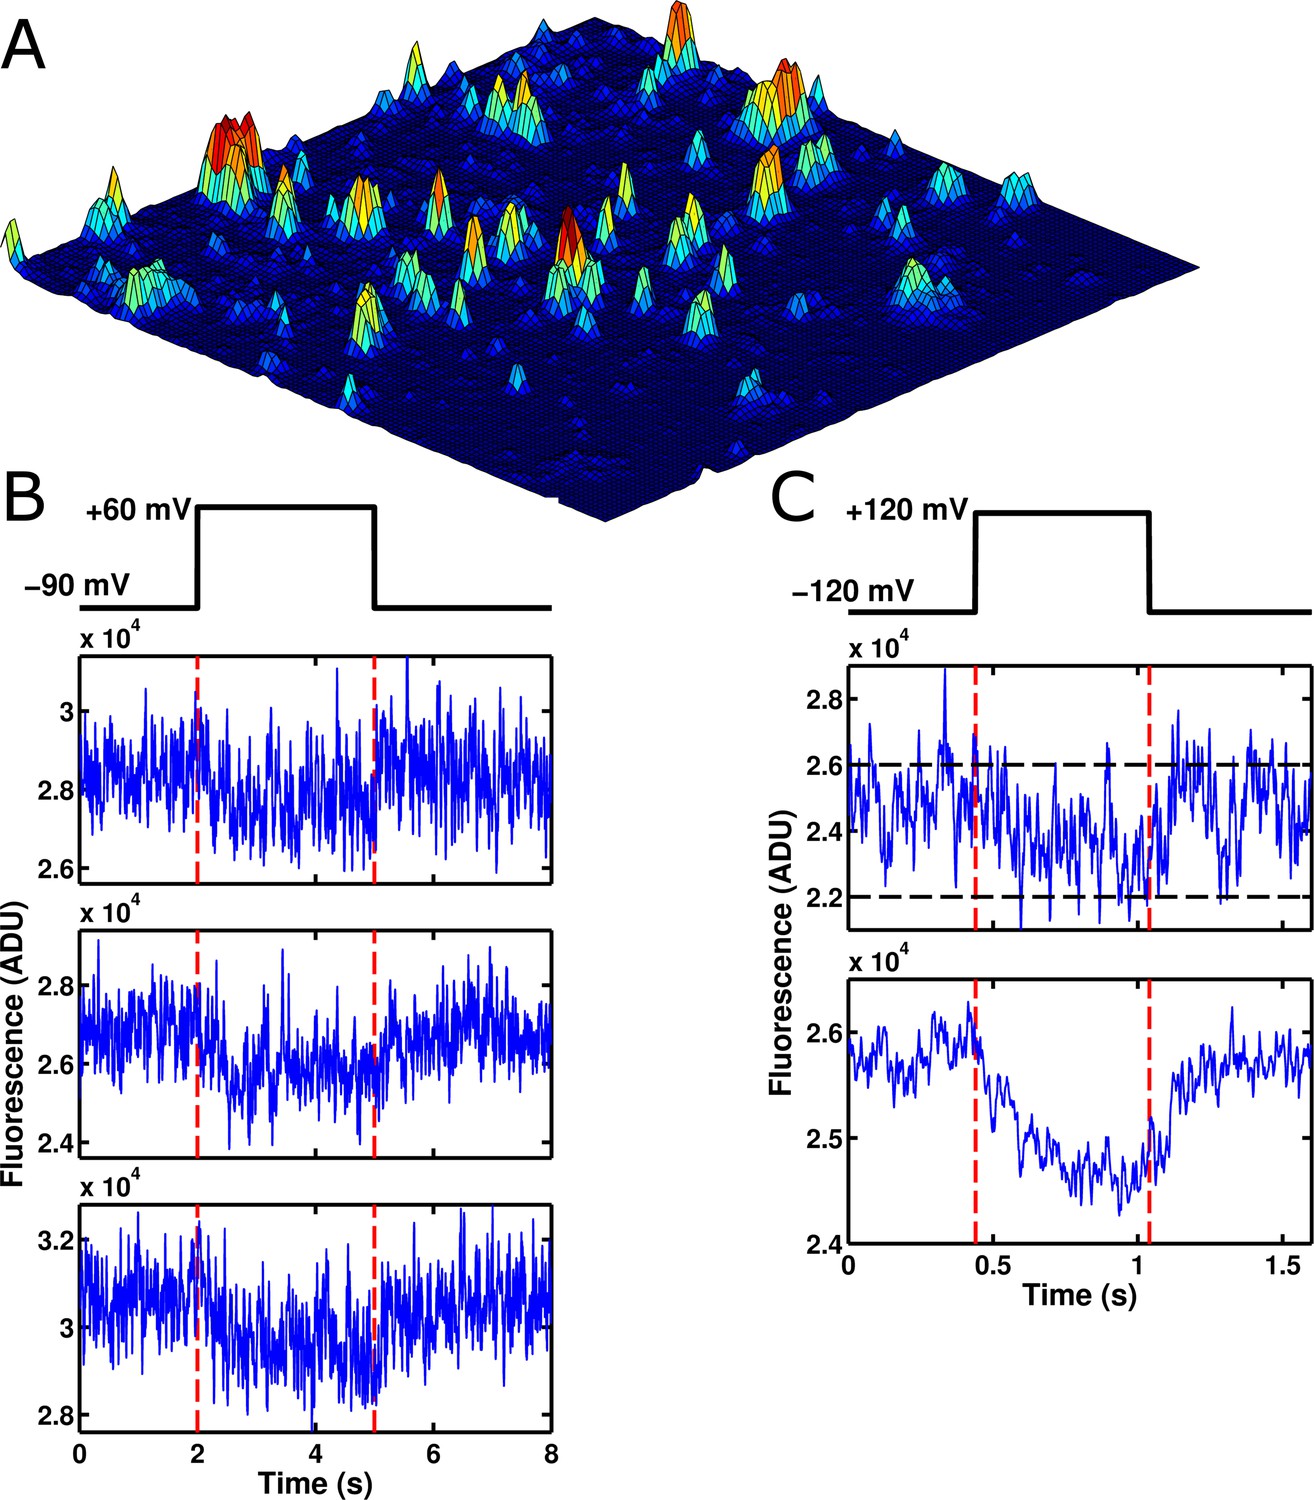
Voltage-sensitive fluorescence can be recorded from single ArcLight' molecules.
(A) An image of the surface of an oocyte expressing ArcLight' in single-molecule concentrations. Square image field is 50 μm × 50 μm. Height in the z-axis corresponds to fluorescence intensity. This image is an average of 800 frames. Background correction has been performed using morphological filtering. (B) Three example traces are shown of single-molecule ArcLight' fluorescence in response to a three second depolarizing pulse from -90 mV to +60 mV. Traces were filtered at 40 Hz and had a linear baseline subtraction applied. (C) The upper of the two traces shows an example trace of single-molecule ArcLight' fluorescence from -120 mV to +120 mV for 600 ms (red dashed lines mark the beginning and end of the depolarizing pulse). The lower of the two traces is the average of 67 traces. This summation demonstrates that the single-molecule data here recapitulates the macroscopic voltage-sensitive fluorescence response of Arclight. Both traces were filtered at 100 Hz. A linear baseline subtraction was applied to the summed trace. ADU is analog-to-digital units, the output unit of the EMCCD camera.
Figure 2—figure supplement 1
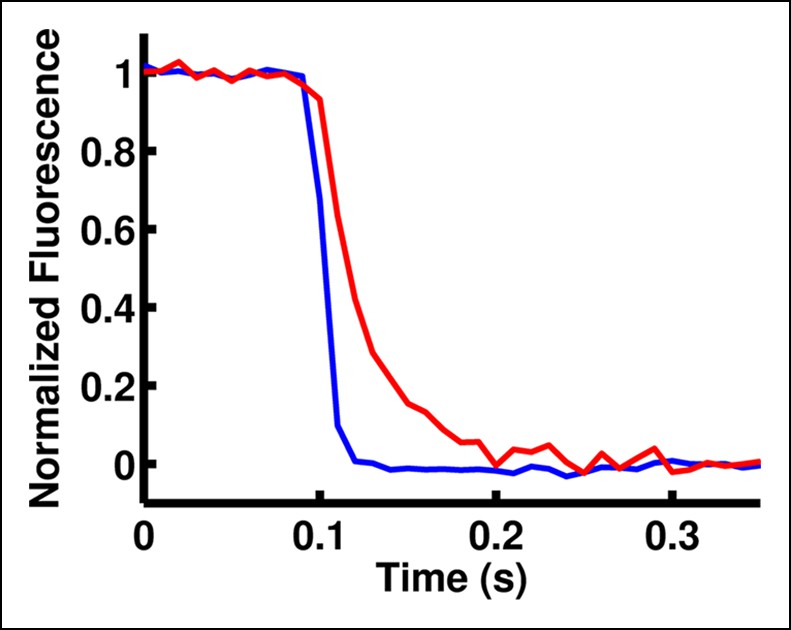
A polymer cushion improves clamp speed under a peeled oocyte.
The speed of the voltage clamp on the bottom side of an oocyte is observed by monitoring the fluorescence of di-8-ANEPPS in the oocyte membrane. When a peeled oocyte is placed directly on a clean glass coverslip, it seals against the glass and creates a slow voltage clamp (red trace). However, coating the coverslip with a water-soluble polymer (polyethylenimine) decreases access resistance under the oocyte and thus improves clamp speed in this region (blue trace).
Figure 3
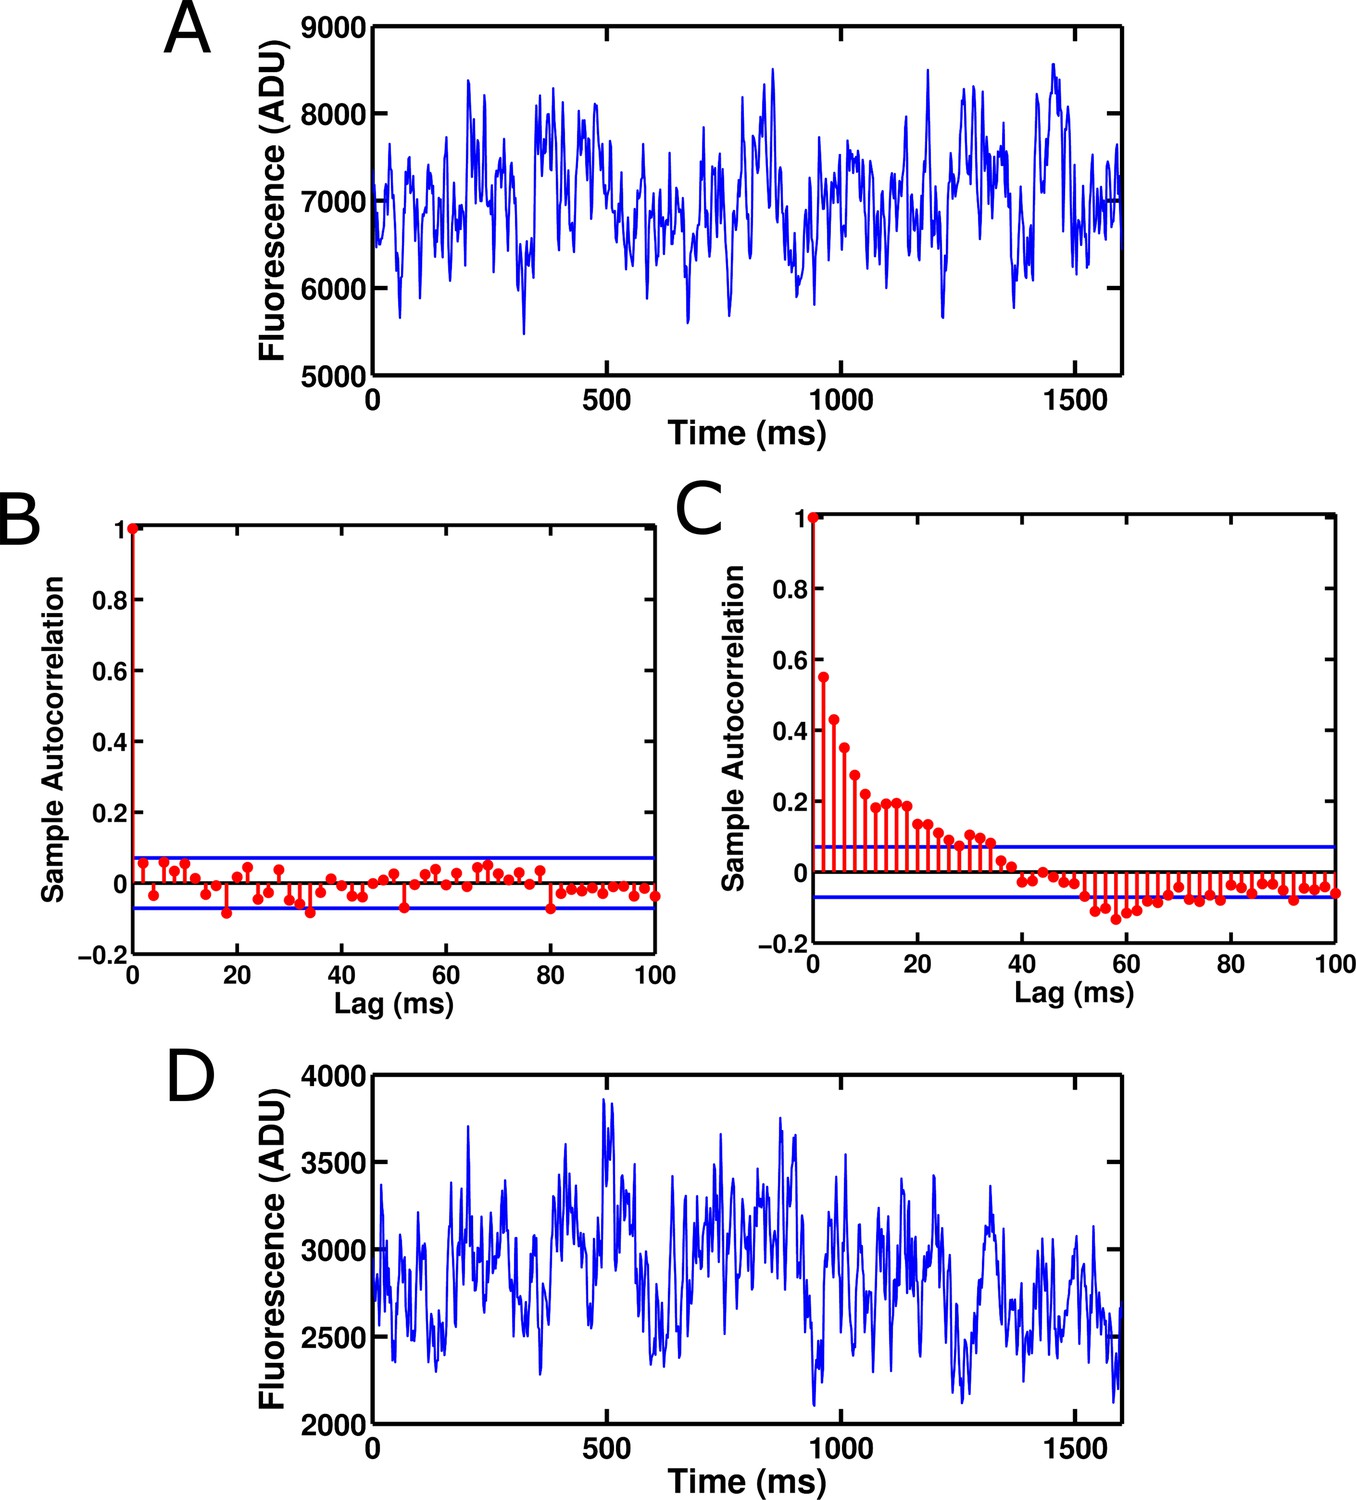
Fluorescence from an isolated ArcLight' GFP domain and eGFP show significant fluctuation noise.
(A) Fluorescence from a single isolated GFP domain from ArcLight' with no attached voltage sensor. The fluorescence displays fluctuations between different levels and does not appear to be Poisson-distributed. The trace was filtered at 100 Hz. (B) Background fluorescence from a region of an image with no GFP molecule displays no significant autocorrelation at any non-zero lag. This suggests that most noise in this regime is due to white processes such as shot noise. (C) The fluorescence from a single isolated GFP domain of ArcLight' displays significant autocorrelation. This suggests that the fluorescence moves between distinct levels corresponding to different conformational, chemical, or electronic states of the GFP domain. Blue bars in B and C represent approximate 95% confidence intervals for a Gaussian-distributed white noise process. No filtering was applied to the data used for the autocorrelations. (D) Single molecules of wild-type eGFP also display fluctuation noise that appears qualitatively similar to that of ArcLight' GFP domains, suggesting that this noise may be present in many GFP derivatives. The trace was filtered at 100 Hz. ADU is analog-to-digital units, the output unit of the EMCCD camera.
Figure 4 with 3 supplements
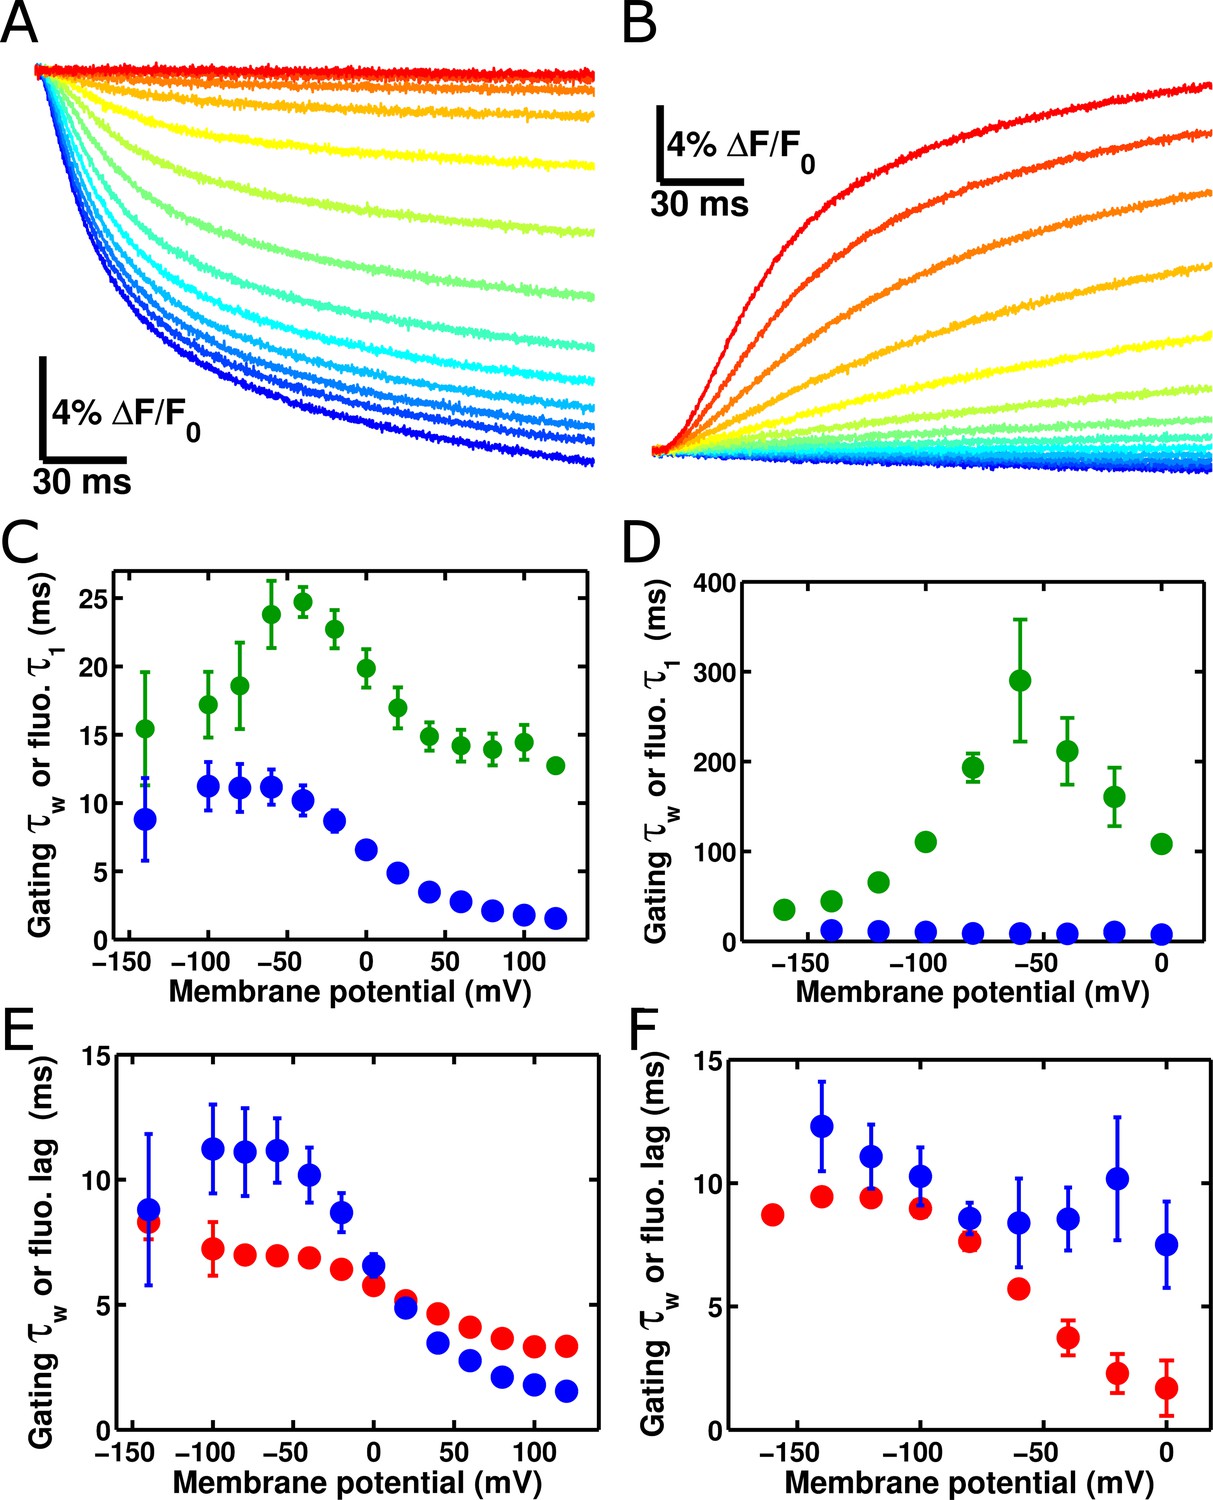
ArcLight fluorescence partially follows the kinetics of voltage sensor movement.
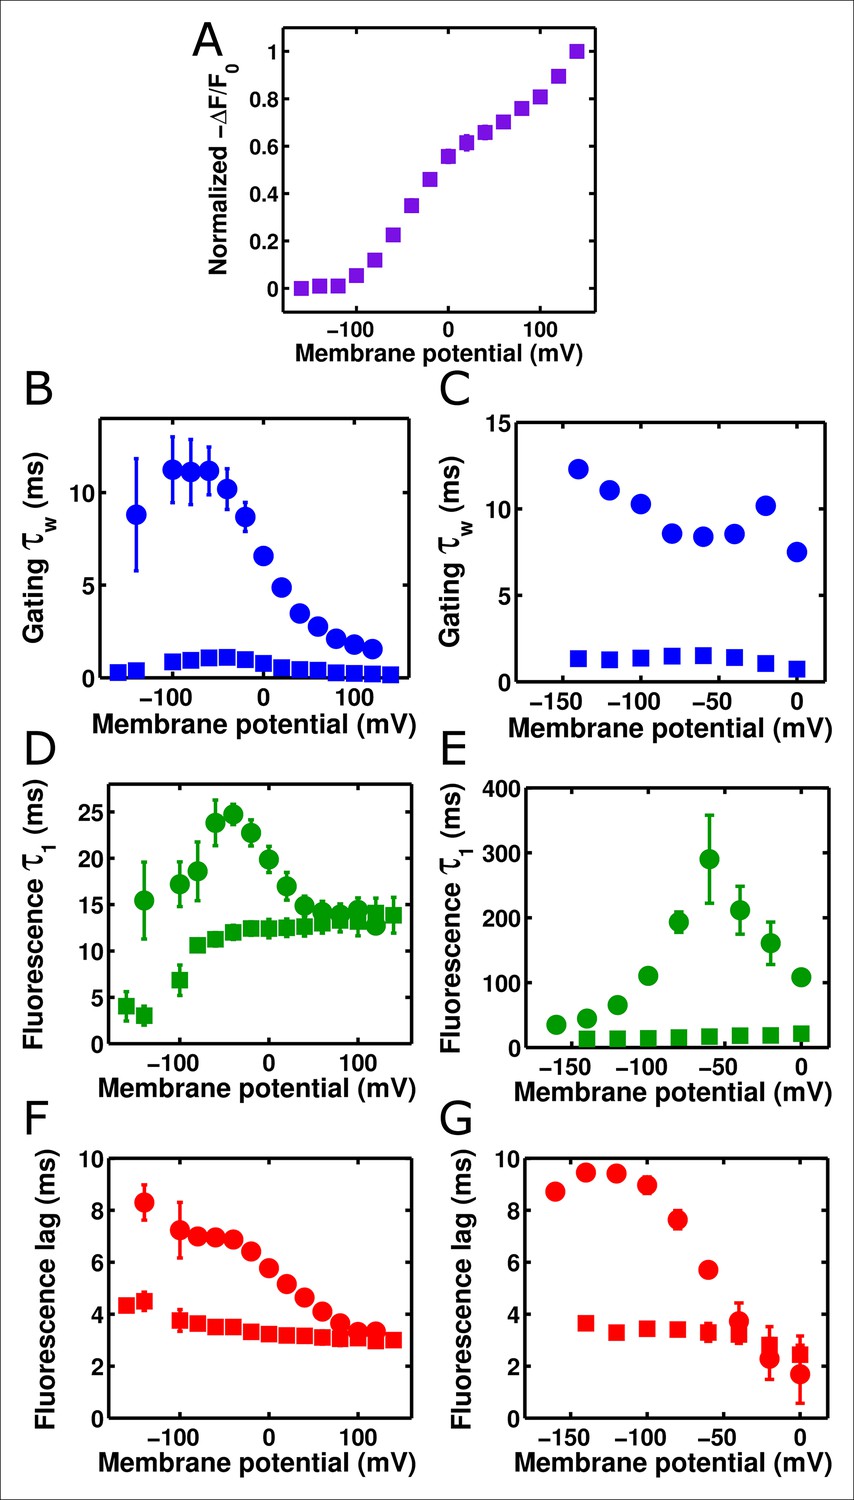
(A) ArcLight fluorescence response to an 'on' pulse protocol with a holding potential of -120 mV with 200 ms pulses ranging from +120 mV to -140 mV by 20 mV intervals. (B) As in A, but in response to an 'off' pulse protocol pulsing from a holding potential of +40 mV to 200 ms pulses ranging from -160 mV to +40 mV by 20 mV intervals. (C) ArcLight on gating kinetics (blue) are faster than and do not correlate strongly with ArcLight fluorescence kinetics (green). Kinetics were obtained from gating currents and fluorescence changes recorded simultaneously from the same oocyte. (D) ArcLight off gating kinetics (blue) are much faster than and do not correlate with ArcLight fluorescence kinetics (green). (E) Upon depolarization, ArcLight fluorescence change shows a distinct lag (see Figure 4—figure supplement 1). This lag is voltage-dependent, becoming shorter with more extreme changes in membrane potential. ArcLight gating current kinetics from the on pulse (blue) correlate quite well with the ArcLight fluorescence lag (red). (F) ArcLight gating current kinetics from the off pulse (blue) correlate with ArcLight fluorescence lag (red) better than they do with ArcLight fluorescence kinetics (shown in D, green). N = 4 for on pulse protocol data, 5 for off pulse protocol data.
Figure 4—figure supplement 1
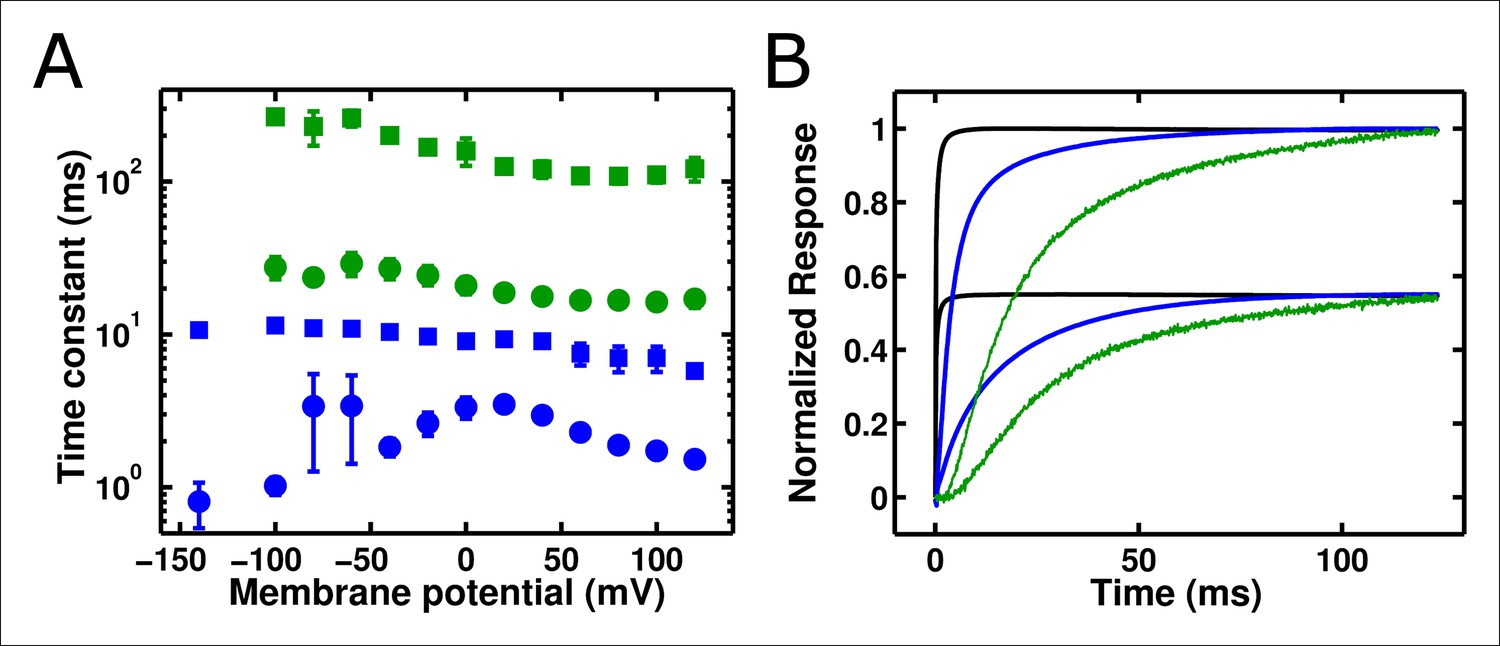
ArcLight fluorescence changes are slower than integrated gating charge kinetics.
(A) Both gating charge movement kinetics (blue, obtained by integrating gating currents) and fluorescence changes (green) of ArcLight are well-fit by a double-exponential function (circles – faster time constant; squares – slower time constant). All fluorescence kinetics are slower than all gating charge kinetics. (B)The slow kinetics of the ArcLight fluorescence response are emphasized by overlaying traces for estimated membrane potential (black), integrated gating charge (blue), and fluorescence (green). The upper group of three traces is for a pulse to +40 mV, while the lower group of three traces is for a pulse to -40 mV. The holding potential is -120 mV for both sets of traces. Estimated membrane potential was calculated by integrating an uncompensated capacitive transient acquired during pulse protocols identical to those used to record the respective gating charge and fluorescence traces. Gating charges were normalized by the maximum charge reached during the +40 mV acquisition. Estimated membrane potential and fluorescence traces were each normalized to their respective integrated gating charge traces.
Figure 4—figure supplement 2
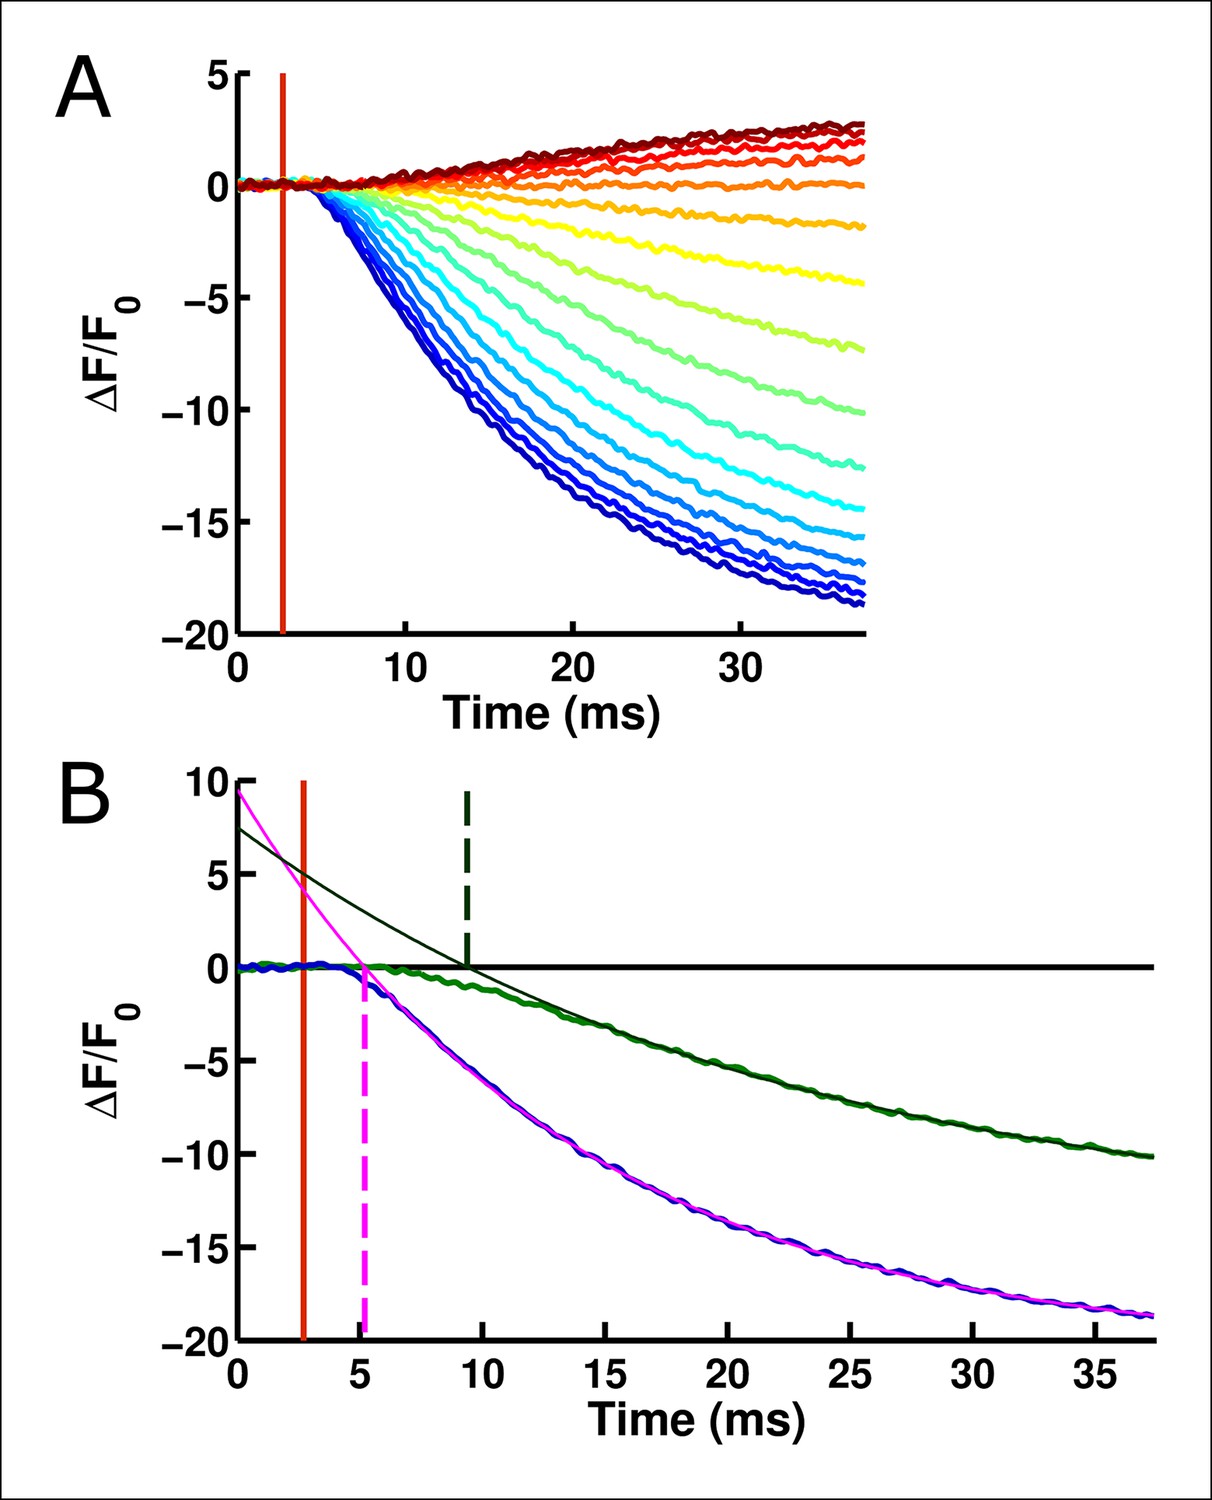
The onset of ArcLight fluorescence change lags behind voltage change onset.
(A) Following the onset of the voltage change (vertical red line), a measurable lag occurs prior to the onset of ArcLight fluorescence change. Traces are shown from a holding potential of -80 mV and range from +140 mV (darkest blue) to -160 mV (darkest red). (B)Exponential fits to the fluorescence response provide a quantitative measure of this delay, taken at the point where the fit crosses the abscissa. For example, at +120 mV (fluorescence trace in blue) the exponential fit (solid pink line) crosses the abscissa shortly after 5 ms (the intersection is marked by a dashed vertical pink line). This is about 2 ms after voltage onset, marked by a vertical red line as in A. Similarly, at 0 mV (fluorescence trace in green, darkened from the trace in A for improved visual clarity) the exponential fit (solid dark green line) crosses the abscissa (intersection marked by a dashed vertical dark green line) at about 9 ms, or 6 ms after voltage onset.
Figure 4—figure supplement 3
The R217R and R217E ArcLight mutants show similar behaviors to R217Q, but with shifted voltage dependence.
(A) Gating current weighted time constants (blue), fluorescence lags (red), and the fast time constants of the fluorescence response (green) were calculated for ArcLight R217R as described above for wild-type ArcLight. The holding potential was -80 mV. This construct follows the same general pattern as the R217Q ArcLight: the fluorescence lags are of similar speed to voltage sensor movement but the fluorescence response itself is considerably slower. (B) As in A, but for ArcLight R217E. The holding potential was -80 mV. This construct also displays a pattern similar to wild-type ArcLight.
Figure 5 with 1 supplement
Accelerated gating kinetics speed up fluorescence, up to a point.
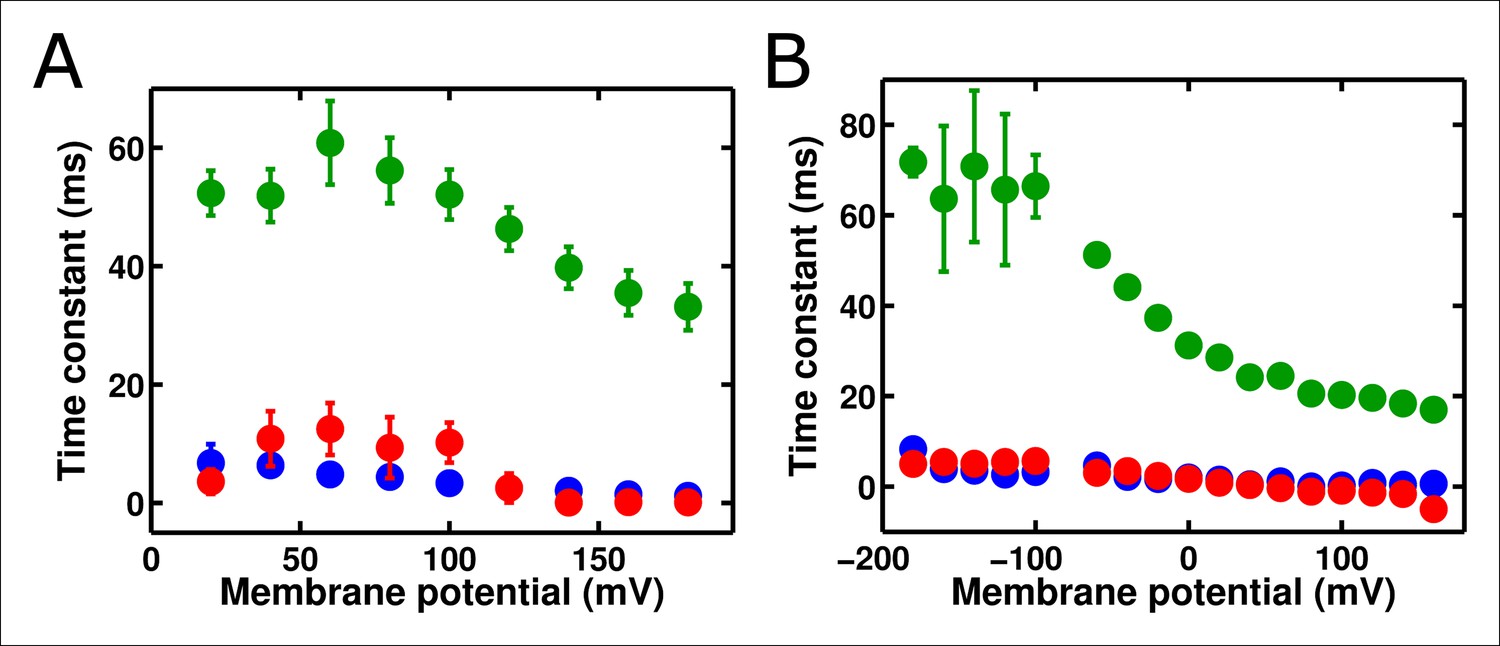
(A) The voltage-dependence of fluorescence change of ArcLight I126F Q217R occurs over a physiological voltage range, as taken from an on protocol identical to that in Figure 4. (B) The gating current kinetics of ArcLight I126F Q217R (squares) obtained from the on pulse protocol are faster than those measured from ArcLight (circles). (C) The gating current kinetics of ArcLight I126F Q217R (squares) obtained from an off pulse protocol identical to that in Figure 4 are faster than those measured from ArcLight (circles). (D) The fluorescence kinetics of ArcLight I126F Q217R (squares) in response to a depolarizing pulse are generally faster than those measured from ArcLight (circles). A notable exception is at more positive potentials, e.g. +80 mV, where the kinetics of the two constructs are essentially equal. (E) The fluorescence kinetics of ArcLight I126F Q217R (squares) obtained in response to a hyperpolarizing pulse are much faster than those measured from ArcLight (circles). (F) The fluorescence lag of ArcLight I126F Q217R (squares) during on pulses is briefer than the lag seen in ArcLight’s fluorescence (circles). (G) As in F, but the fluorescence lag upon an off pulse. On and off protocols were as in Figure 4, and n = 5 for all ArcLight I216F Q217R data.
Figure 5—figure supplement 1
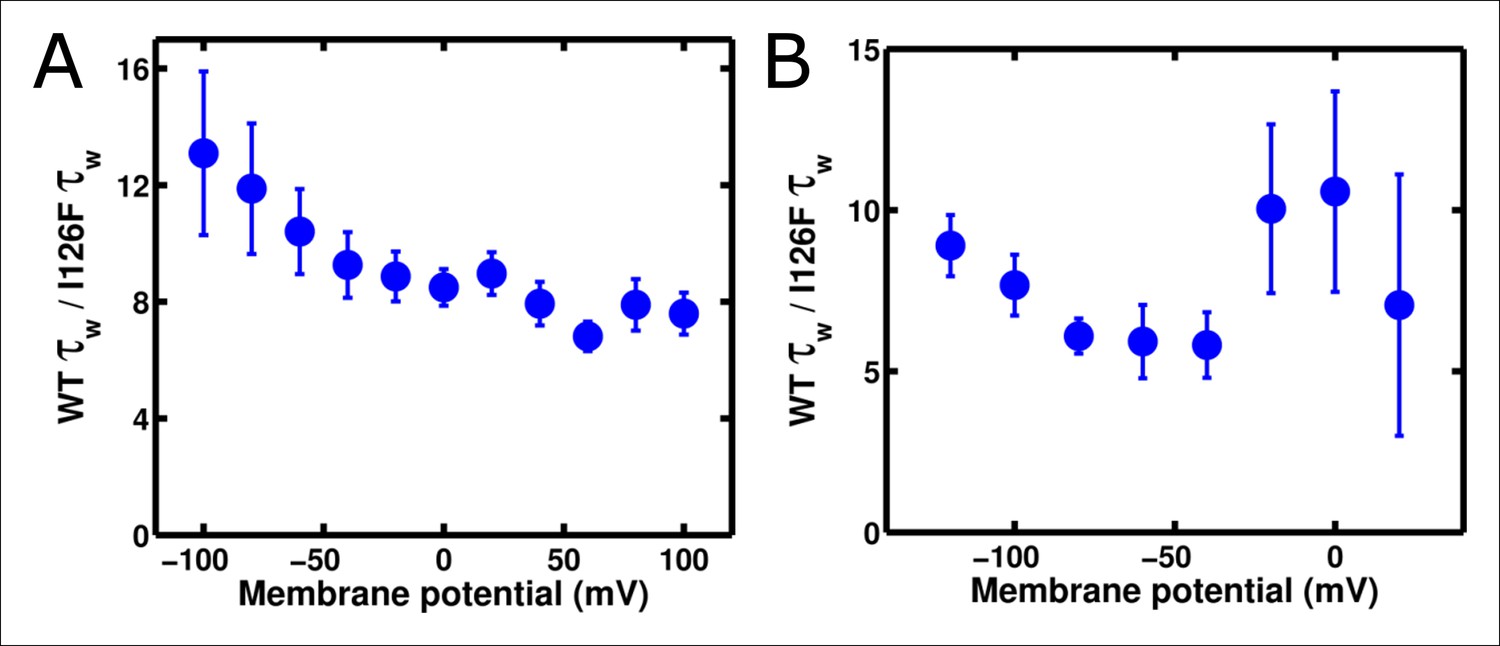
Substitution of I126F and Q217R into ArcLight induces a roughly constant acceleration of gating current.
(A) Ratio of ArcLight gating current kinetics to I126F Q217R gating current kinetics across all voltages in response to an 'on' protocol. (B) As in A, but in response to an 'off' protocol. The on and off protocols were identical to those described in Figure 4. Briefly, depolarizations used a holding potential of -120 mV, with 200 ms pulses from -140 mV to +120 mV; hyperpolarizations used a holding potential of +40 mV, with 200 ms pulses from +40 mV to -140 mV. N = 4 for ArcLight activation kinetics and 5 for all other kinetics.
Figure 6 with 1 supplement

ArcLightning displays improved fluorescence response to repetitive pulses in mammalian cells.
(A) ArcLightning (pink) expressed in HEK cells displays moderately faster kinetics in response to depolarization and much faster kinetics in response to hyperpolarization than ArcLight (blue) at 19°C. Notice that ArcLightning develops a slower component only at potentials exceeding +50 mV. (B) In response to a train of 100 ms pulses, separated by 100 ms of holding at -80 mV, ArcLightning (pink) displays an improved ability to measure discrete events compared to ArcLight (blue). All traces in A and B had no baseline subtraction or filtering. (C) At 35°C, both ArcLight (blue) and ArcLightning (pink) follow 5 ms, 100 mV pulses separated by 10 ms at the resting potential to mimic action potentials at approximately 67 Hz. ArcLightning provides the additional advantage of abolishing the sloping baseline of fluorescence that ArcLight produces in response to repetitive pulses as a result of its slow off kinetics. Both traces had a single-exponential baseline subtracted and were low-pass filtered at 300 Hz.
Figure 6—figure supplement 1
ArcLightning is faster than ArcLight in mammalian cells.
(A) The on kinetics of ArcLightning (pink squares) are faster than those of ArcLight (blue circles) at physiological voltages. As seen in oocytes, kinetics became similar at highly depolarized potentials, suggesting an underlying rate-limiting step of fluorescence change that is not highly voltage-dependent. (B) The fractional amplitude of the fast time constant in response to depolarization is higher in ArcLightning (pink squares) than in ArcLight (blue circles). Thus, in addition to being faster, the first component of ArcLightning comprised a greater percentage of its total fluorescent response. (C) As in A, but for kinetics in response to hyperpolarizations to baseline following the on pulse. (D) As in B, but for fractional amplitude of the fast time constant of responses to hyperpolarizing pulses. Kinetics of ArcLightning responding to hyperpolarization were similar to or faster than those of ArcLight, and the fractional amplitude of the fast time constant was larger for ArcLightning than for ArcLight. To obtain these kinetics, an 100 ms on pulse was made from a holding potential of -80 mV, ranging from +100 mV to -120 mV in increments of 20 mV. Activation kinetics were measured from the on pulse; deactivation kinetics were measured from the off as the potential returned to -80 mV. N = 5 for all data.
Figure 7 with 2 supplements
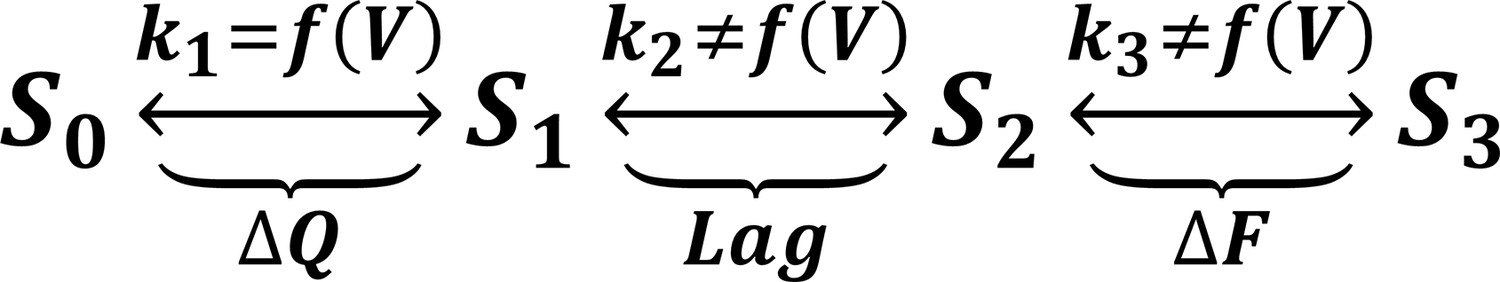
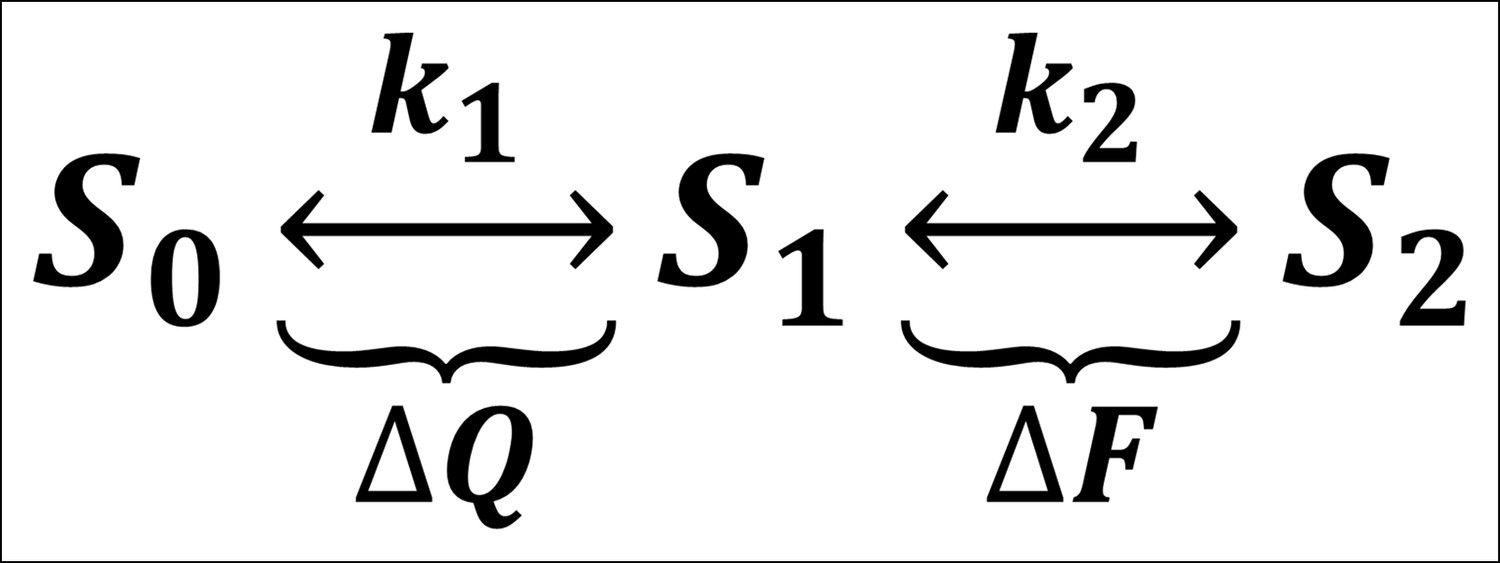
A minimal four-state model of ArcLight kinetics.
The first transition carries the gating charge movement while the third transition carries the fluorescence change and the second transition carries no observable changes. The kinetics of the first transition depend strongly on voltage, while the kinetics of the second two are only weak functions of voltage. Thus, if , the second two transitions will become rate-limiting, and both the lag and fluorescence kinetics will appear nearly voltage-independent, as observed when gating is accelerated with the I126F mutation or in wild type ArcLight when gating becomes fast due to pulsing to extreme potentials. This model explains why wild-type ArcLight fluorescence kinetics and lags approach the same values as the I126F mutant at extreme potentials.
Figure 7—figure supplement 1
A minimal three-state model of ArcLight kinetics.
The first transition carries the gating charge movement while the second transition carries the fluorescence change. If , the fluorescence would be slower than the gating currents, as observed. The lag would be caused by the delay in having a sufficient population reach state such that they can begin making the second transition and undergoing fluorescence change. This model was eventually unable to account for all observed phenomena, prompting the creation of a four-state model (see Figure 7).
Figure 7—figure supplement 2
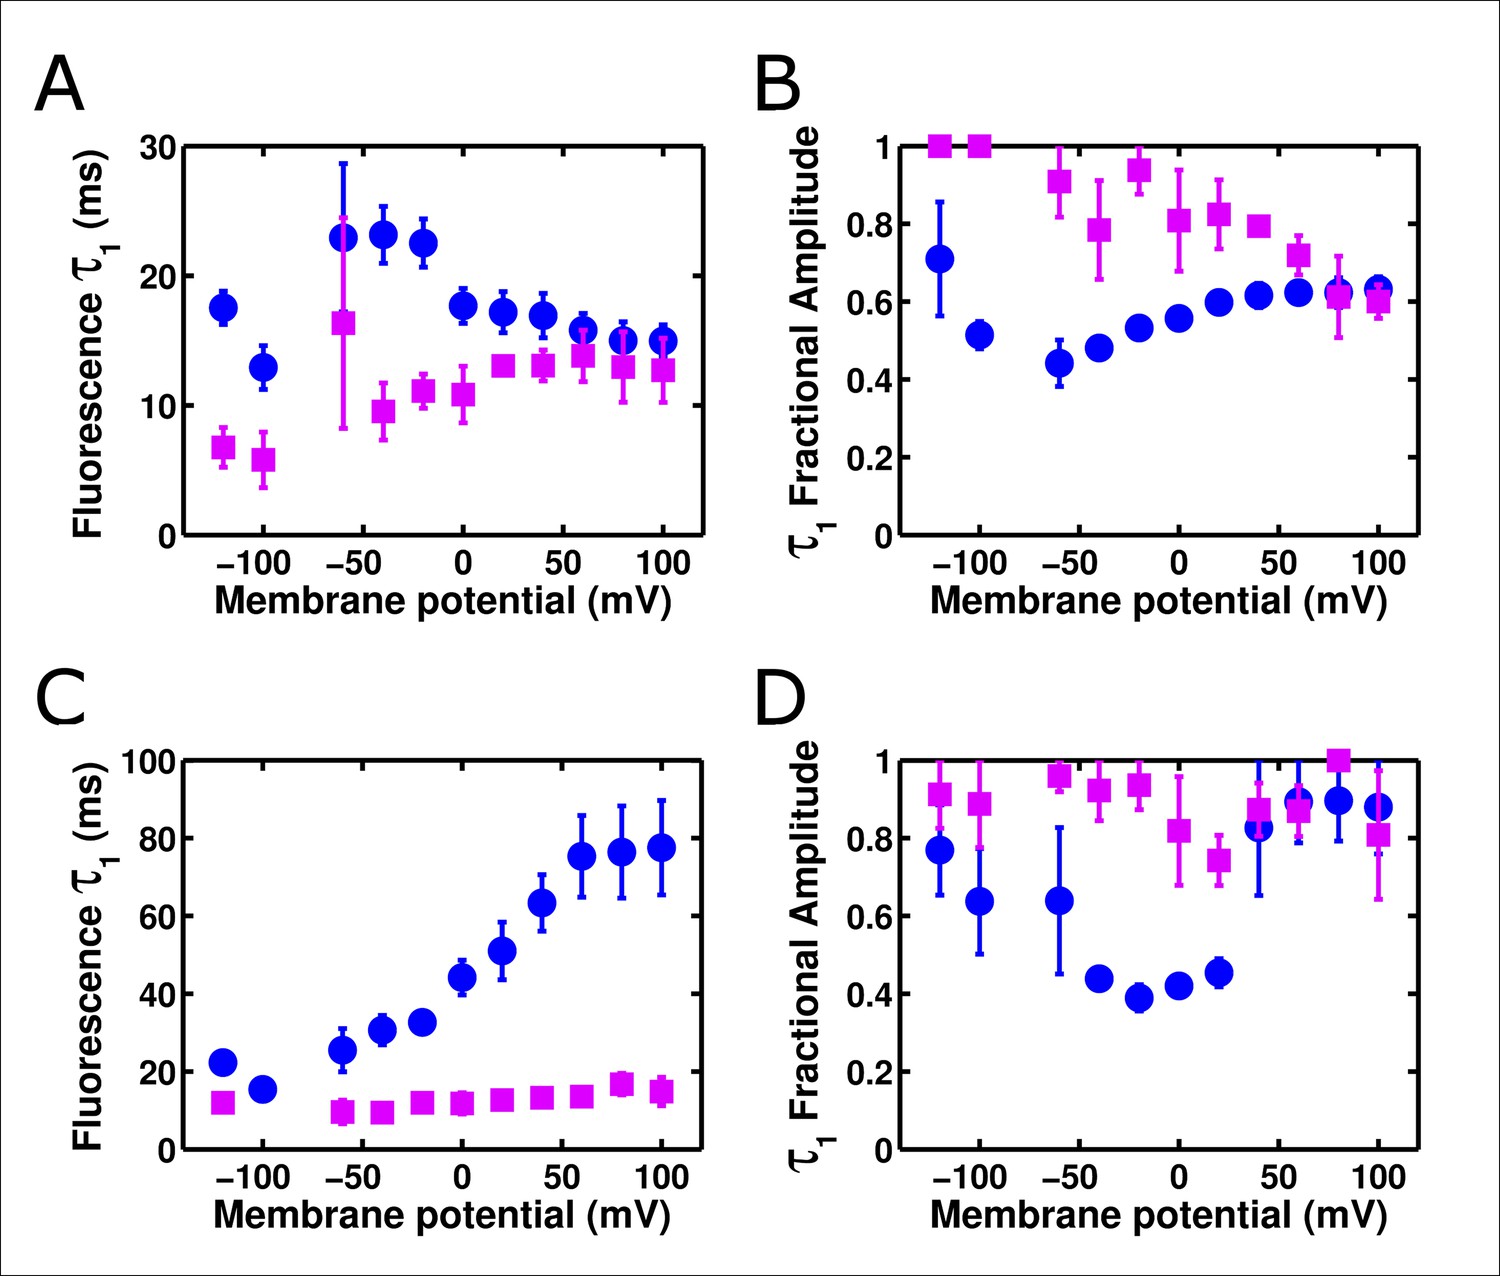
ArcLight fluorescence may be influenced by the relaxed state.
(A) The Q-V curve obtained from a protocol of hyperpolarizing pulses from a +40 mV holding potential (red squares) is shifted to more negative potentials compared to a Q-V curve obtained from depolarizing pulses from a -120 mV holding potential (blue squares), as predicted if relaxation is occurring. The fluorescence response of ArcLight follows Q-V curves from holding potentials of both -120 mV (cyan circles) and +40 mV (pink circles). Data was normalized as described in the Methods. (B) The fluorescence response to variable depolarizing pulses following holding at -120 mV (cyan) is faster than the response to variable hyperpolarizing pulses following a 200 ms pulse to +40 mV (black). Applying a holding potential of +40 mV slows the subsequent fluorescence response upon hyperpolarization still further (pink), consistent with fluorescence responses slowing from an entrance to the relaxed state. On and off protocols are identical to those described for Figure 4, except for the +40 mV pulse protocol, which used a -80 mV holding potential for the remainder of the five second cycle period. N = 4 for holding at -120 mV, 5 for holding at +40 mV, and 6 for pulsing to +40 mV.
Download links
A two-part list of links to download the article, or parts of the article, in various formats.
Downloads (link to download the article as PDF)
Open citations (links to open the citations from this article in various online reference manager services)
Cite this article (links to download the citations from this article in formats compatible with various reference manager tools)
Single-molecule fluorimetry and gating currents inspire an improved optical voltage indicator
eLife 4:e10482.
https://doi.org/10.7554/eLife.10482


