mTOR inhibition in Q175 Huntington’s disease model mice facilitates neuronal autophagy and mutant huntingtin clearance
- Center for Dementia Research, Nathan S. Kline Institute, United States
- Department of Psychiatry, New York University Grossman School of Medicine, United States
- CHDI Management/CHDI Foundation, United States
- Neuroscience Institute, New York University Grossman School of Medicine, United States
- Department of Cell Biology, New York University Grossman School of Medicine, United States
Figures
Figure 1
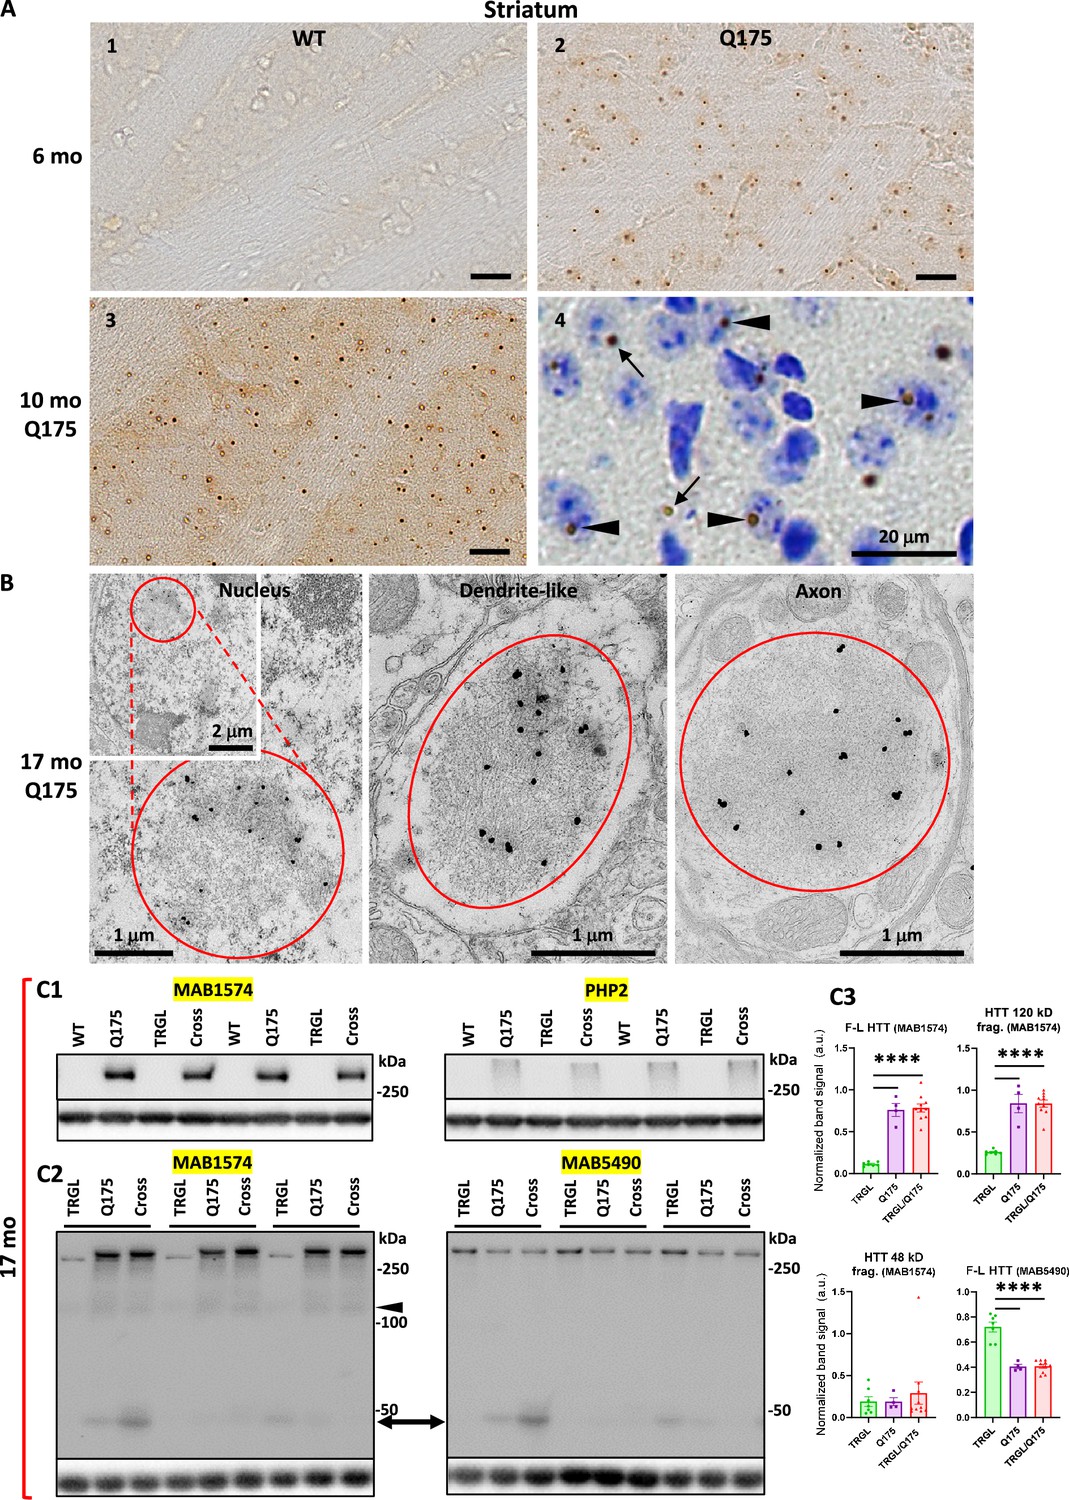
Identification of inclusions and huntingtin protein (HTT) molecular species in Q175 mice.
(A) Immunohistochemistry (IHC) detects age-dependent increase in the number of mutant huntingtin protein (mHTT) inclusions. Brain sections from 6-mo- and 10-mo-old wild-type (WT) and Q175 mice were processed for IHC with antibody mEM48 (MAB5374) directed against mHTT (A). Images from sections without (A1-3) or with (A4) a cresyl violet counterstain are shown where the dark-brown puncta represent mHTT-positive inclusions. Arrowheads depict neuronal intranuclear inclusions (NIIs), determined with the assistance from the nuclear labeling by cresyl violet, while arrows indicate extranuclear inclusions, primarily the neuritic inclusion in the neuropil. Bars = 20 μm. n=4 mice/genotype, 4 sections/mouse. (B) mHTT inclusions are detected in nucleus, dendrites, and axons of Q175 brains by immuno-gold electron microscopy (IEM). Sagittal vibratome brain sections of 17-mo-old Q175 were cut and went through electron microscope (EM) processing. Small blocks were obtained from the striatal areas for ultrathin sectioning. Tissue containing grids were processed for immunogold labeling procedure with antibody mEM48, using 10 nm gold followed by silver enhancement. Structures showing high level of silver-enhanced gold labeling were considered as mHTT-positive. (C) Various forms of HTT molecules are detected with different antibodies by immunoblotting. Equal amounts of proteins from hemibrain homogenates of 17-mo-old WT, TRGL, Q175, and TRGL/Q175 (labeled as ‘Cross’) were subjected to SDS-PAGE and processed for WB with different antibodies directed against HTT/mHTT, including MAB1574 (C1, C2), mAb PHP2 (C1) and MAB5490 (C2). Images were collected by a digital gel imager (Syngene G:Box XX9). The arrowhead and arrow (C2) depict a 120 kDa and a 48 kDa fragment, respectively. (C3) Densitometry was performed with Image J for the blots shown in (C2) and the results were normalized by the immunoblot(s) of given loading control protein(s) (e.g., GAPDH). Values are the Mean ± SEM for each group (n=7 TRGL, 4 Q175, and 10 TRGL/Q175). Significant differences among the groups were analyzed by one-way ANOVA followed by Sidak’s multiple comparisons test. *p<0.05, **p<0.01.
-
Figure 1—source data 1
Original western blots for Figure 1C1 and C2.
- https://cdn.elifesciences.org/articles/104979/elife-104979-fig1-data1-v1.zip
-
Figure 1—source data 2
Original western blots for Figure 1C1 and C2, labeled for the relevant bands.
- https://cdn.elifesciences.org/articles/104979/elife-104979-fig1-data2-v1.zip
Figure 2 with 1 supplement
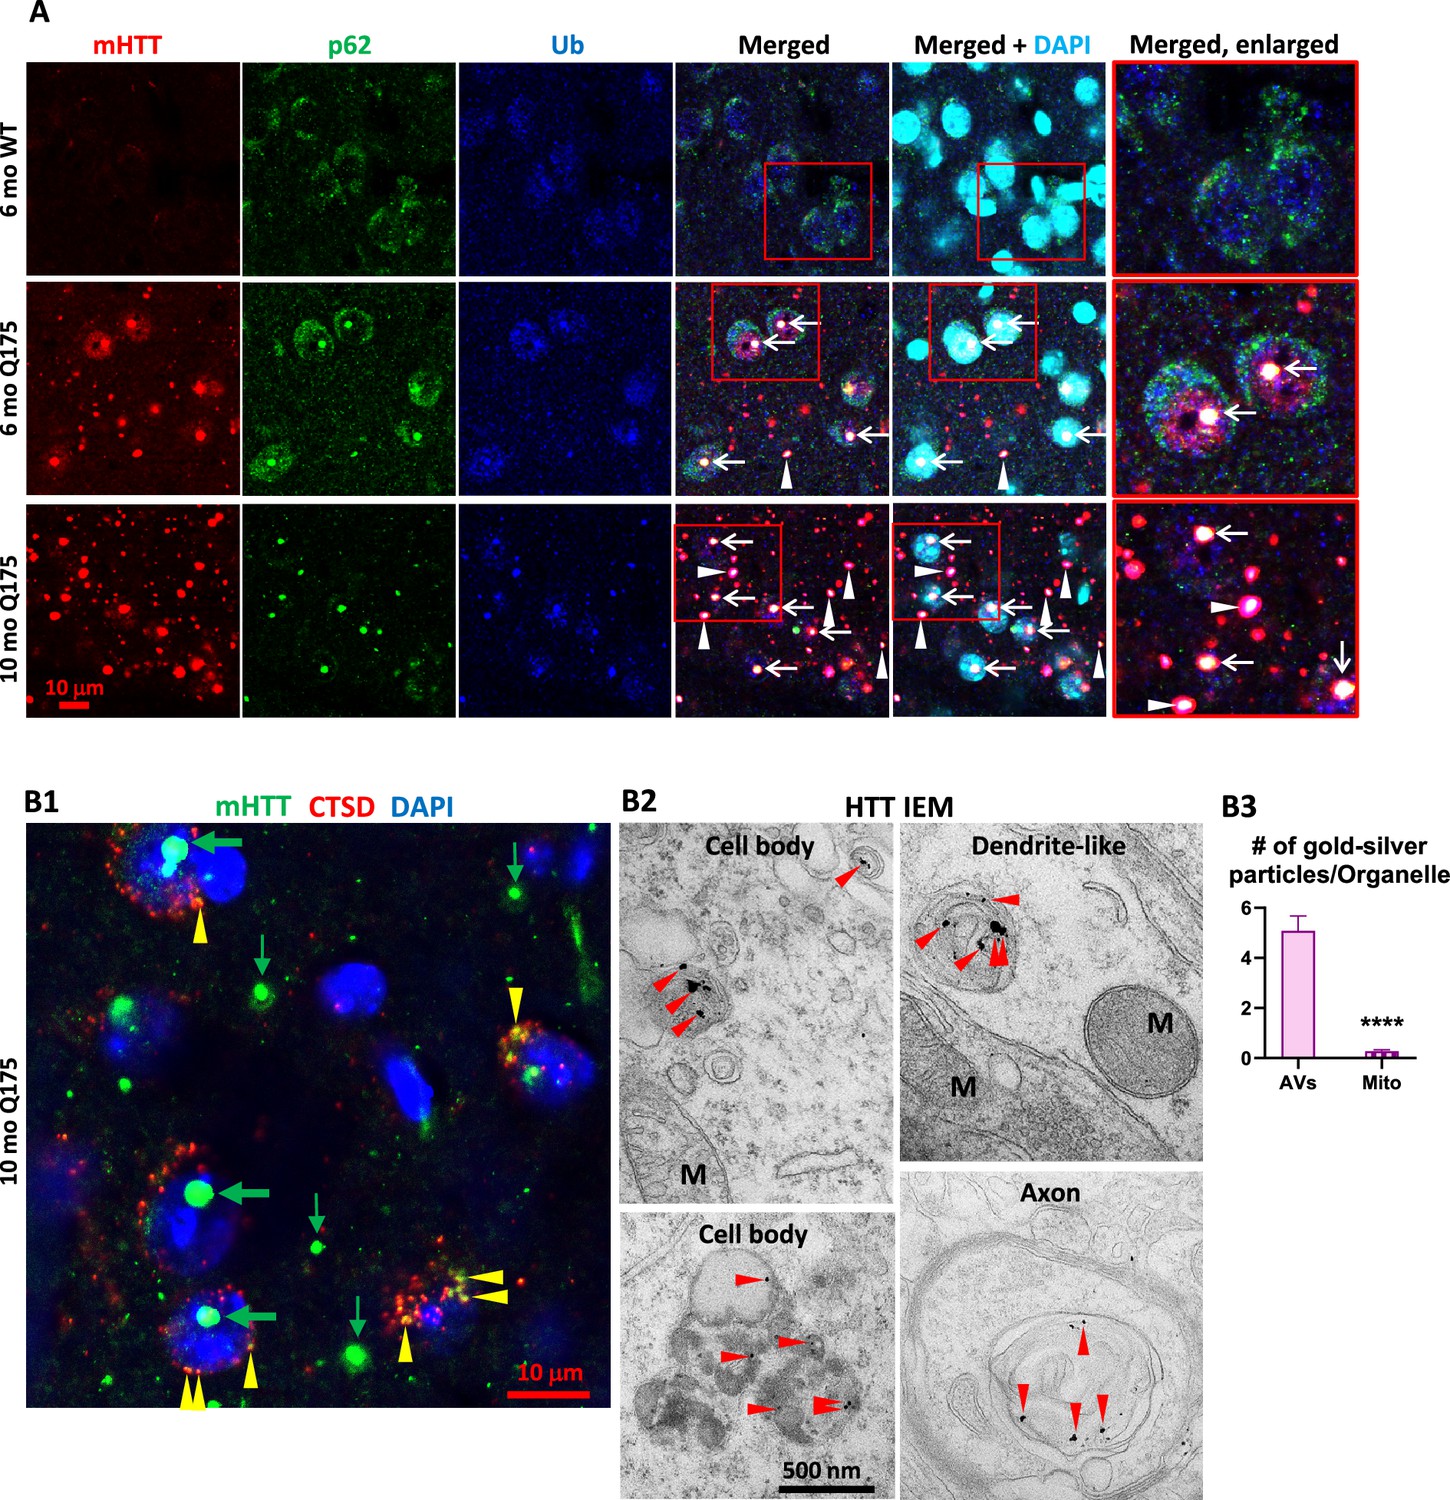
Colocalization of mutant huntingtin protein (mHTT) with p62, Ub, and cathepsin D (CTSD).
(A) Triple labeling detects colocalization of mHTT with both autophagy adaptor proteins p62 and Ub. Brain sections from 6-mo- and 10-mo-old mice were immunostained with antibodies to huntingtin protein (HTT) (antibody MW8; red), p62 (green), or pan-Ub (blue), followed by an additional DAPI (cyan) labeling, and confocal images from the striatum are shown. Boxed areas are enlarged and shown in the last column. Arrows and arrowheads depict the white areas representing triply labeled inclusions containing the signals of the three proteins, where arrows are for NIIs, determined with the assistance from the nuclear DAPI labeling, while the arrowheads are for extranuclear inclusions. Bar = 10 μm. n=4 mice/genotype, 4 sections/mouse. (B) mHTT is detected in vesicles of the autophagic-lysosomal pathway (ALP). (B1) Brain sections from 10-mo-old Q175 were double-immunolabeled with antibodies to HTT (antibody MW8; green) and CTSD (red), followed by an additional DAPI (blue) labeling, and a three-color-merged confocal image from the striatum is shown. Large and small green arrows depict HTT nuclear and extranuclear inclusions, respectively, while yellow arrowheads depict yellow puncta showing HTT and CTSD signal colocalization. Bar = 10 μm. n=4 mice/genotype, 4 sections/mouse. (B2) Immuno-gold electron microscopy (IEM) with anti-HTT antibody (MAB1574) specifically detects HTT signal, represented by the silver-enhanced gold particles (red arrowheads), in autophagic vacuoles (AV)/lysosomes (LY) in cell bodies, dendrites, and axons. (B3) To demonstrate the labeling specificity of the HTT antibody in this IEM study, the number of silver-enhanced gold particles in AV/LY existing in neuronal cell bodies and neurites was counted from 69 electron microscope (EM) images from two 10-mo-old Q175 mice against the number of silver-enhanced gold particles in mitochondria on the same images, and the result is shown in the bar graph. Statistical significances between the two groups were analyzed by unpaired, two-tailed t-test. ****p<0.0001.
Figure 2—figure supplement 1
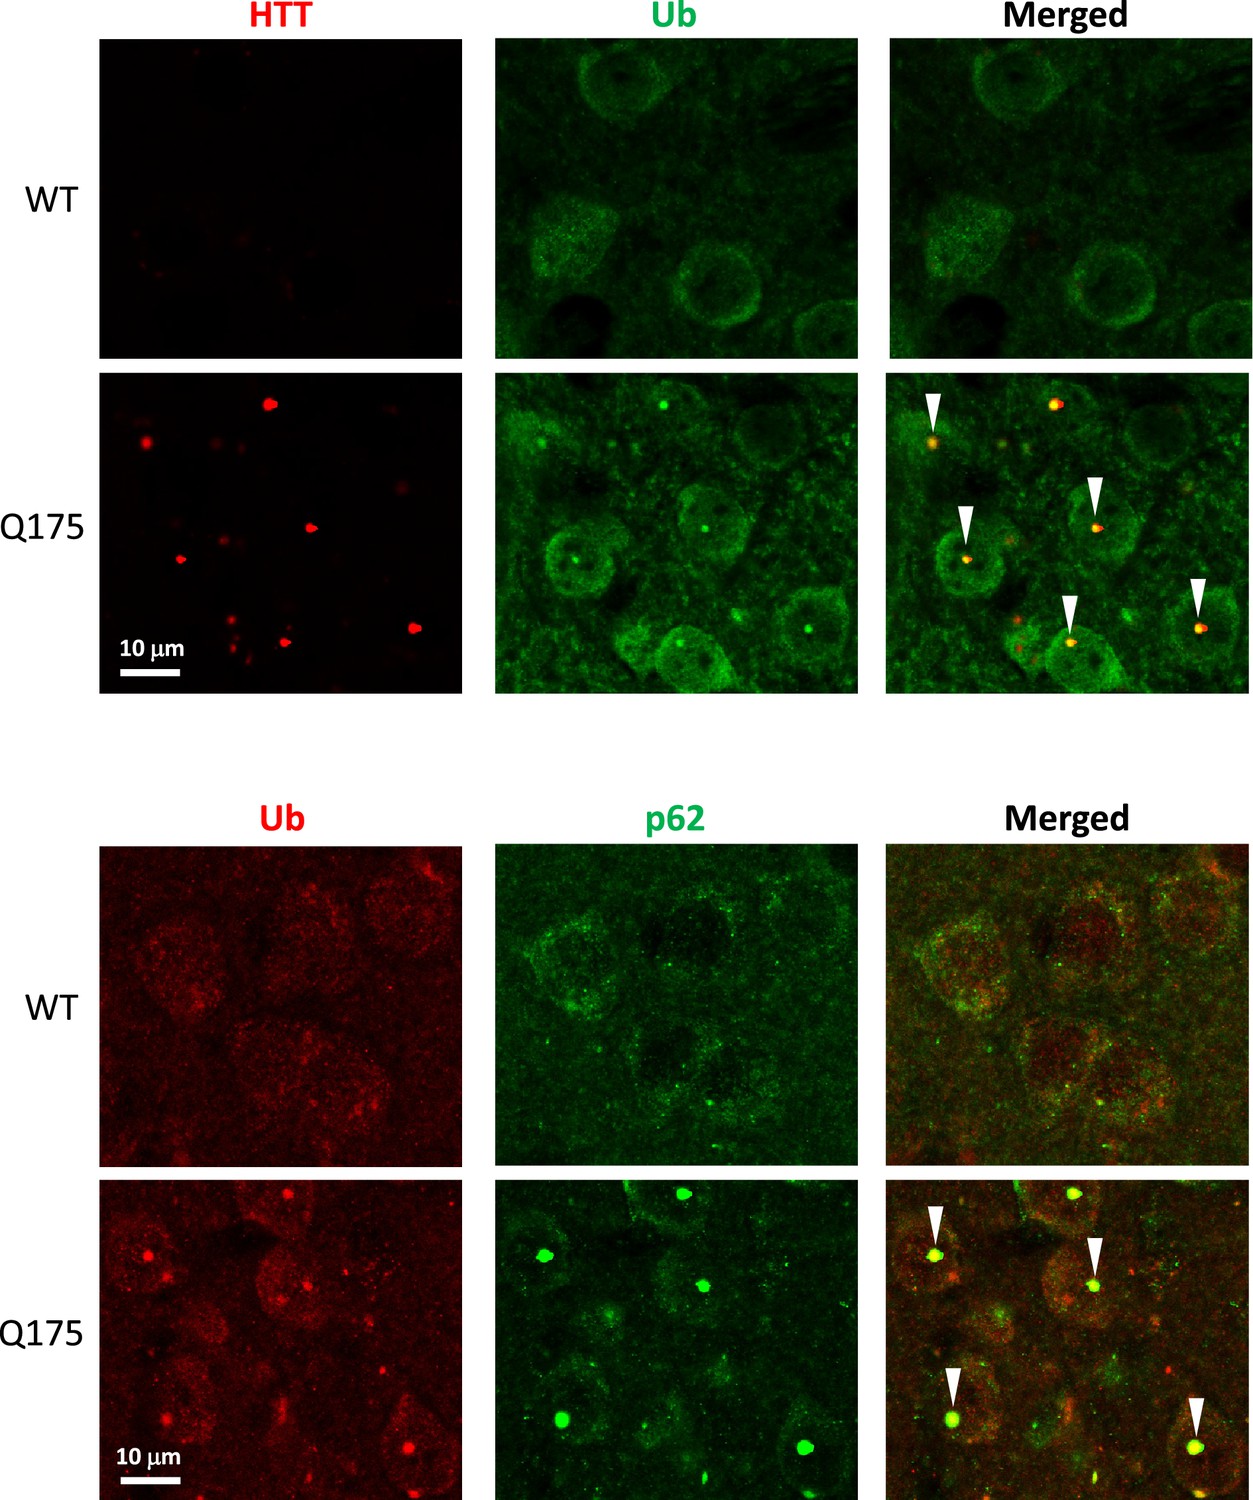
Colocalization of huntingtin protein (HTT)/Ub and Ub/p62 in IBs in the striatum (STR).
Brain sections from 10-mo-old mice were processed for double IF with antibodies against HTT (antibody MW8; red) and pan-Ub (green), or pan-Ub (red) and p62 (green), and confocal images from the striatum are shown. Arrowheads depict IBs showing colocalization signals.
Figure 3 with 4 supplements
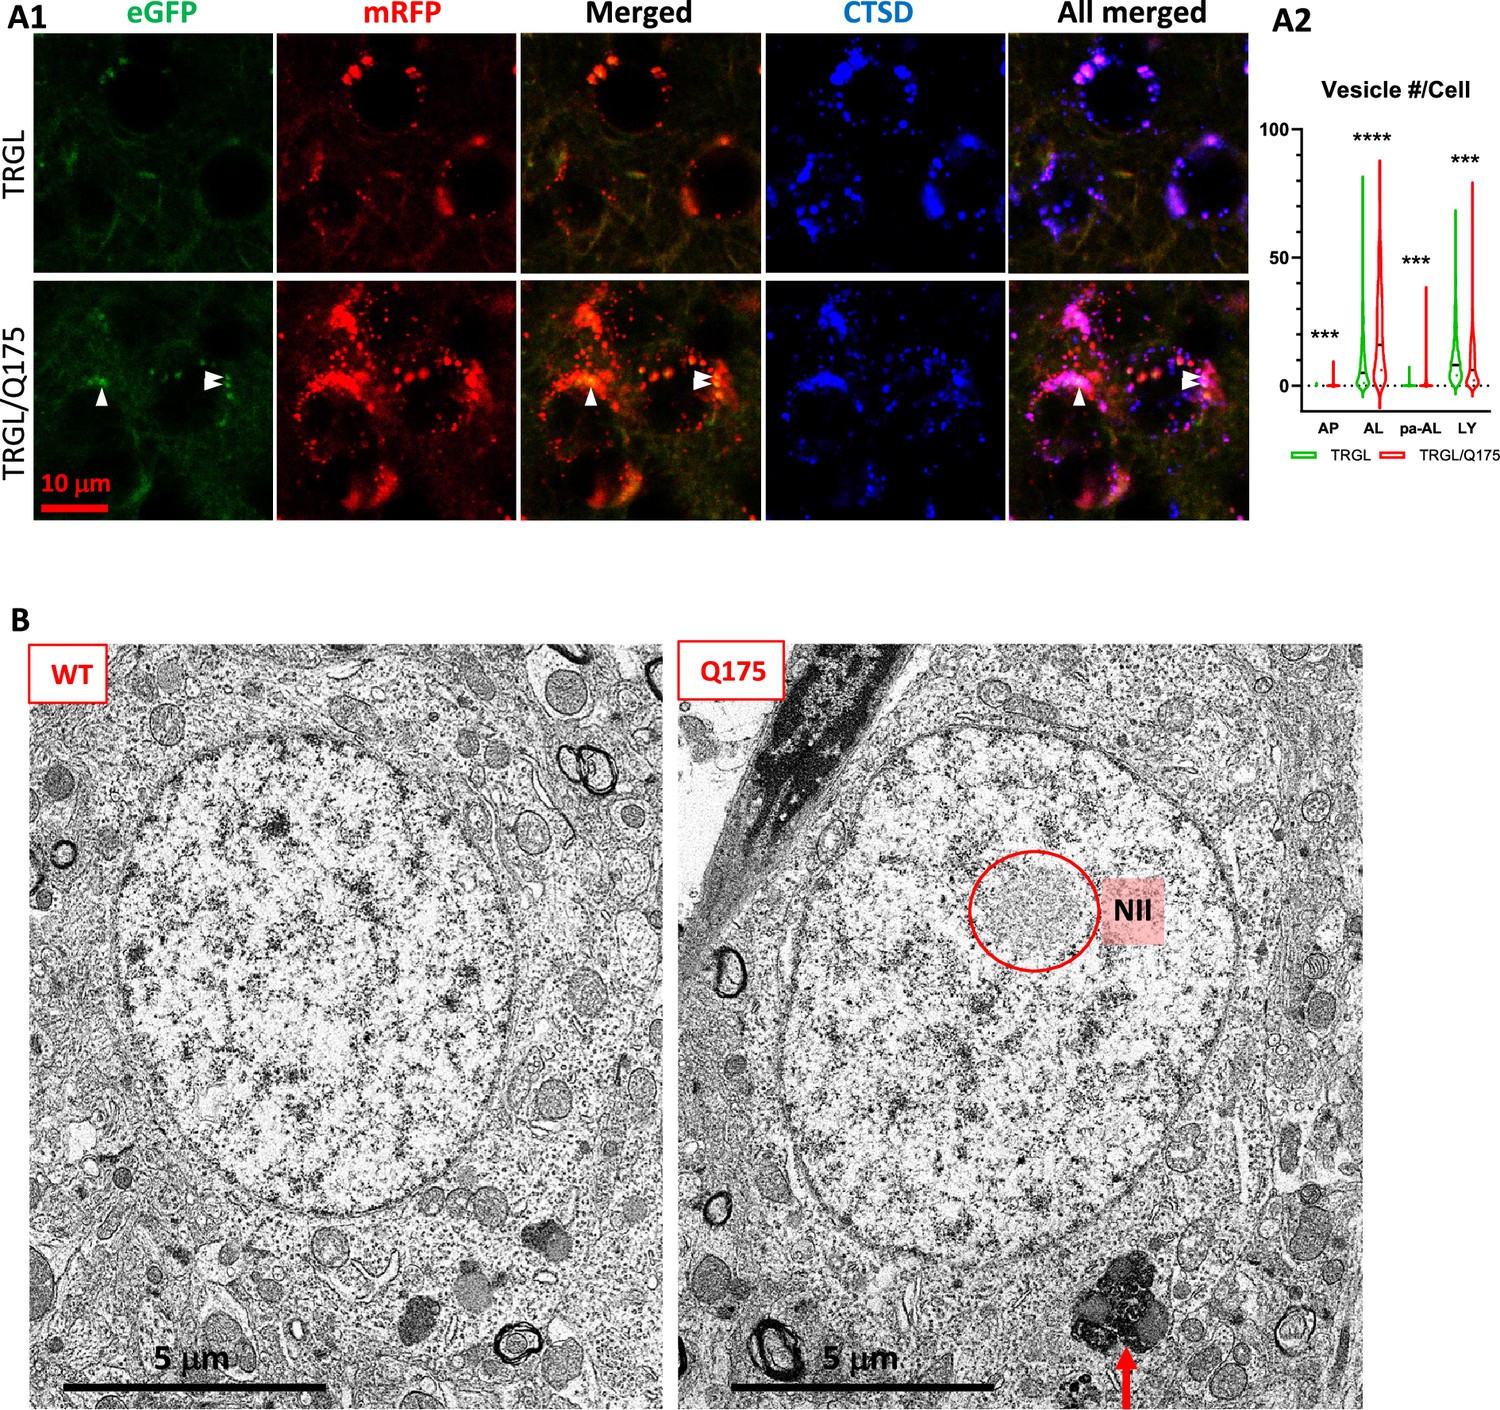
Mild late-onset alterations in the autophagic-lysosomal pathway (ALP) in the striatum of 17-mo-old Q175.
(A) Quantitation of autophagic vacuoles (AV)/lysosomes (LY) subtypes of striatal neurons detect increases in AL, pa-AL, and a decrease in LY in 17-mo-old TRGL/Q175 vs. TRGL. (A1) Brain sections from TRGL and TRGL/Q175 (4 sections/mouse, 10 mice/genotype) were immunostained with an anti-CTSD antibody. Confocal images from the cranial-dorsal portion of the striatum (three images at 120 x/section) were collected and representative images for each eGFP-LC3 (green), mRFP-LC3 (red), and CTSD (blue) are shown. Arrowheads depict pa-AL. (A2) Hue angle-based analysis was performed for AV/LY subtype determination using the methods described in Lee et al., 2019 (see the Materials and methods). Data are presented as Vesicle #/Neuron (TRGL: n=713 neurons; TRGL/Q175: n=601 neurons). Statistical significances between the two groups for each vesicle type were analyzed by unpaired t-test. Two-tailed p-value: ***p<0.001, ****p<0.0001. (B) EM detects larger AL/lipofuscin granules in the Q175 striatum. Sagittal vibratome brain sections from 17-mo-old mice were cut and went through EM processing. Small blocks were obtained from the striatal area for ultrathin sectioning, followed by EM examinations of the grids. The red circle depicts NII, and the arrow depicts larger sized (>1 µm) lipofuscin granules, which were counted on randomly collected images of neurons from striatum of WT (420 neurons from n=6 mice) or Q175 (586 neurons from n=9 mice).
Figure 3—figure supplement 1
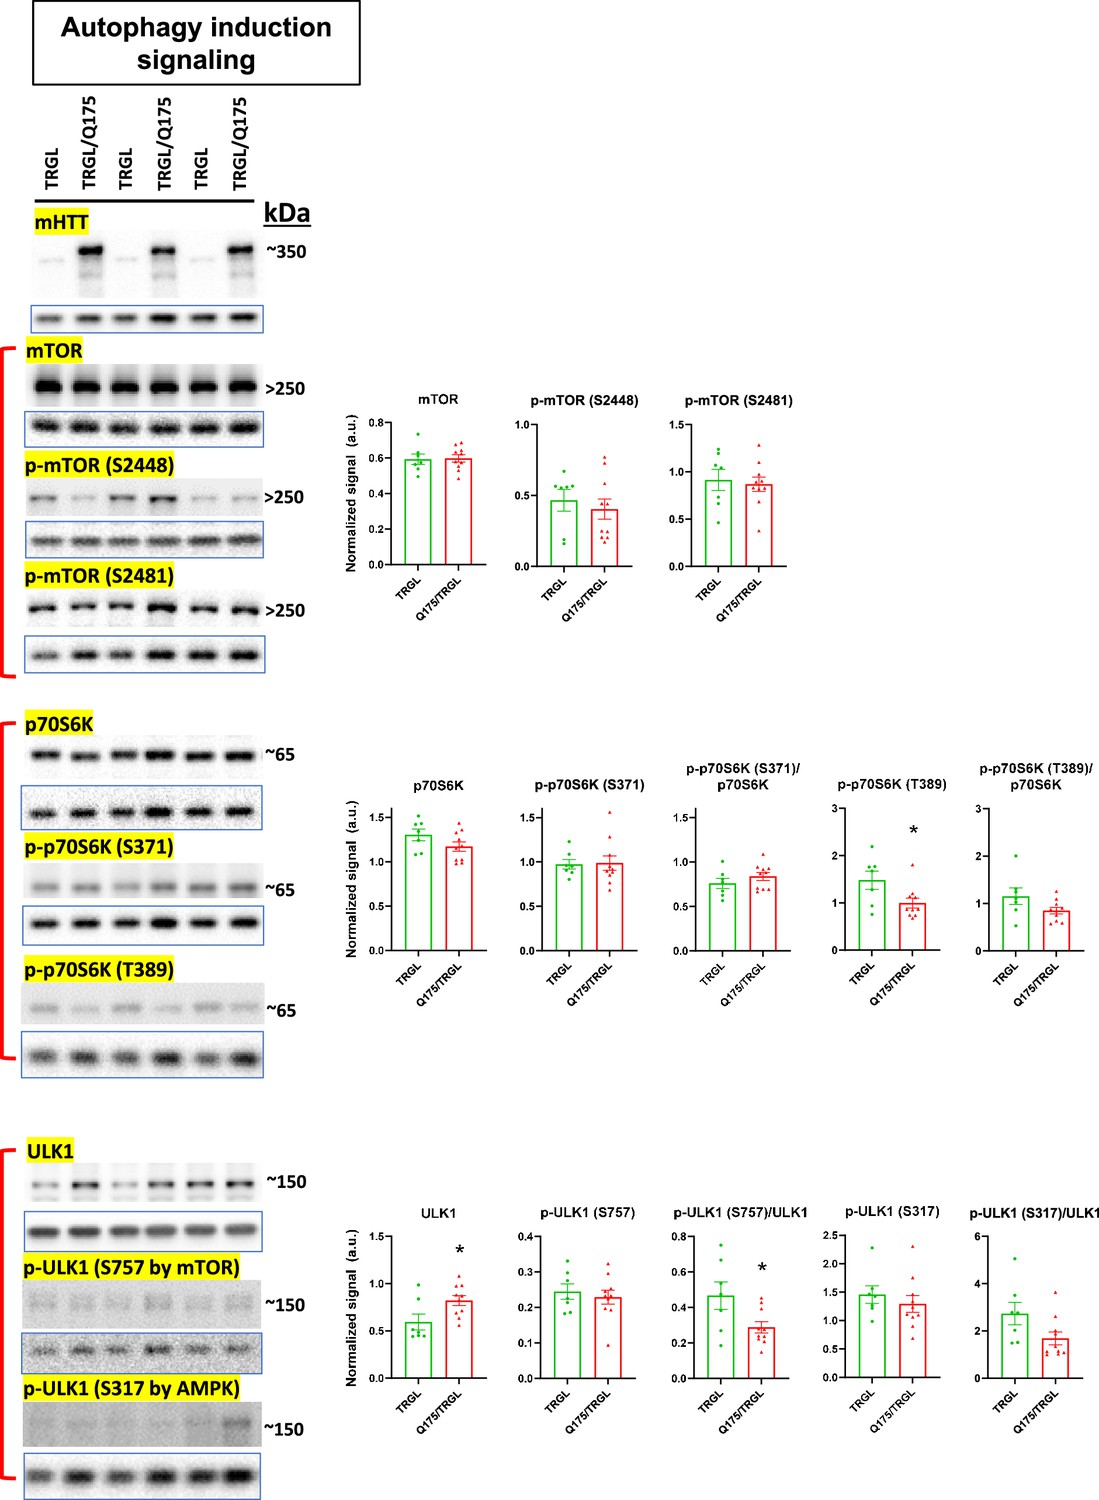
Molecules involved in autophagy induction signaling of the autophagic-lysosomal pathway (ALP) are largely unchanged in 17-mo-old TRGL/Q175.
Equal amounts of proteins from brain homogenates of 17-mo-old TRGL and TRGL/Q175 were subjected to SDS-PAGE and processed for western blotting (WB) with antibodies directed against a number of interested marker proteins in autophagy induction signaling of the ALP. Immunoblotting for each marker protein was performed one or more times depending on the quality of the blots. The blot of the loading control protein GAPDH is boxed and placed under each protein of interest. Images were collected by a digital gel imager (Syngene G:Box XX9). Densitometry was performed with Image J and the result for each protein of interest was normalized by its corresponding GAPDH blot and presented in the bar graph. Values are the Mean +/- SEM for each group (n = 7 TRGL and 10 TRGL/Q175). Significant differences between the two groups were analyzed by unpaired, two-tailed t-test. *p<0.05, **p<0.01, ***p<0.001.
-
Figure 3—figure supplement 1—source data 1
Original western blots for Figure 3—figure supplement 1.
- https://cdn.elifesciences.org/articles/104979/elife-104979-fig3-figsupp1-data1-v1.zip
-
Figure 3—figure supplement 1—source data 2
Original western blots for Figure 3—figure supplement 1, labeled for the relevant bands.
- https://cdn.elifesciences.org/articles/104979/elife-104979-fig3-figsupp1-data2-v1.zip
Figure 3—figure supplement 2
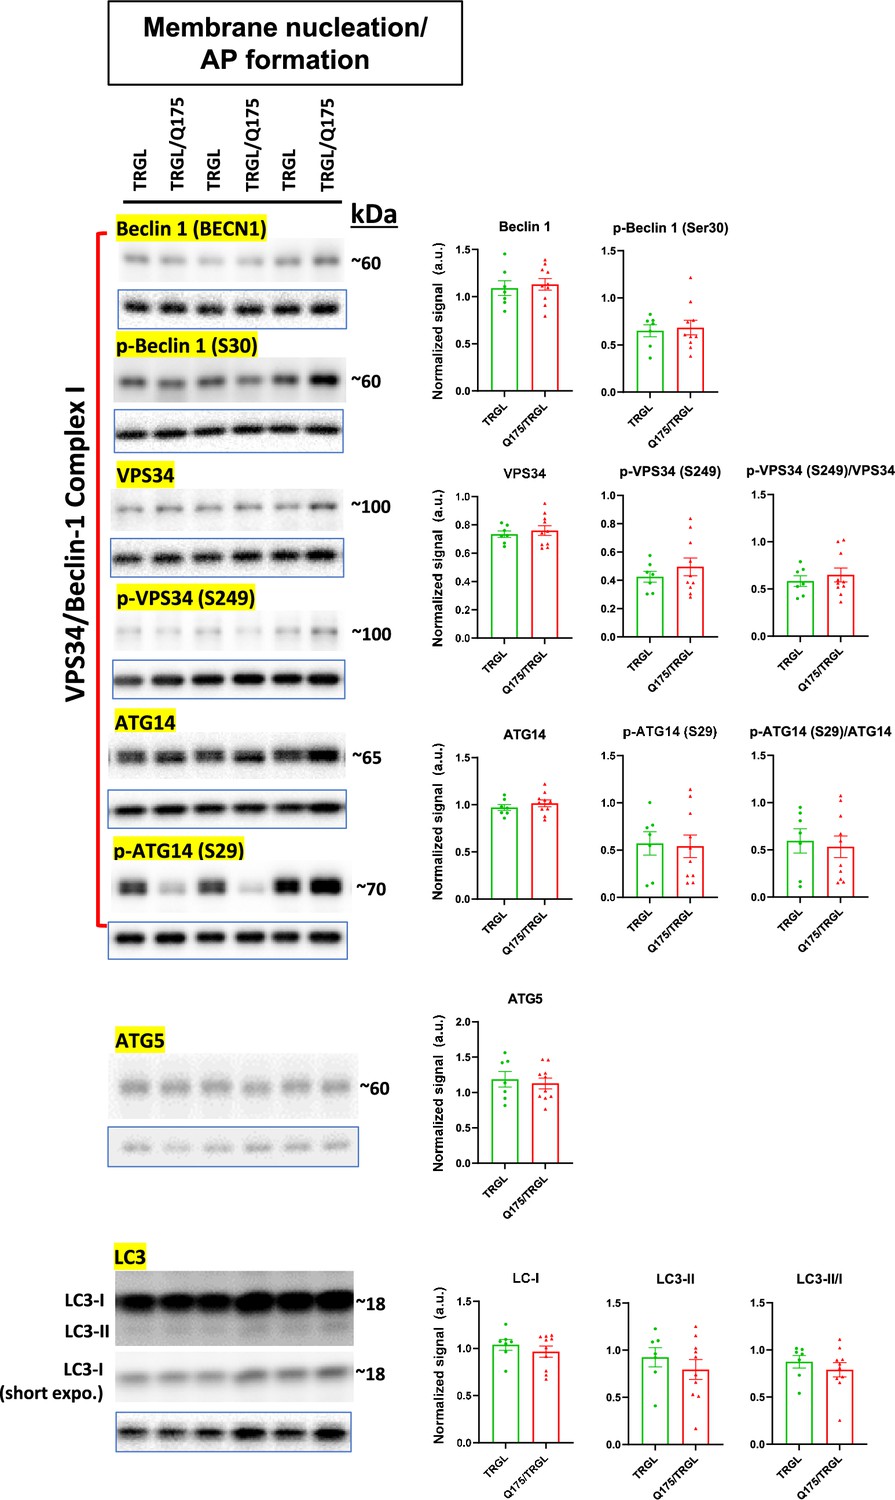
Molecules involved in membrane nucleation/autophagosome (AP) formation of the autophagic-lysosomal pathway (ALP) are largely unchanged in 17-mo-old TRGL/Q175.
Equal amounts of proteins from brain homogenates of 17-mo-old TRGL and TRGL/Q175 were subjected to SDS-PAGE and processed for western blotting (WB) with antibodies directed against a number of interested marker proteins in membrane nucleation/AP formation of the ALP. Immunoblotting for each marker protein was performed one or more times depending on the quality of the blots. The blot of the loading control protein GAPDH is boxed and placed under each protein of interest. Images were collected by a digital gel imager (Syngene G:Box XX9). Densitometry was performed with Image J and the result for each protein of interest was normalized by its corresponding GAPDH blot and presented in the bar graph. Values are the Mean +/- SEM for each group (n = 7 TRGL and 10 TRGL/Q175). Significant differences between the two groups were analyzed by unpaired, two-tailed t-test. *p<0.05, **p<0.01, ***p<0.001.
-
Figure 3—figure supplement 2—source data 1
Original western blots for Figure 3—figure supplement 2.
- https://cdn.elifesciences.org/articles/104979/elife-104979-fig3-figsupp2-data1-v1.zip
-
Figure 3—figure supplement 2—source data 2
Original western blots for Figure 3—figure supplement 2, labeled for the relevant bands.
- https://cdn.elifesciences.org/articles/104979/elife-104979-fig3-figsupp2-data2-v1.zip
Figure 3—figure supplement 3
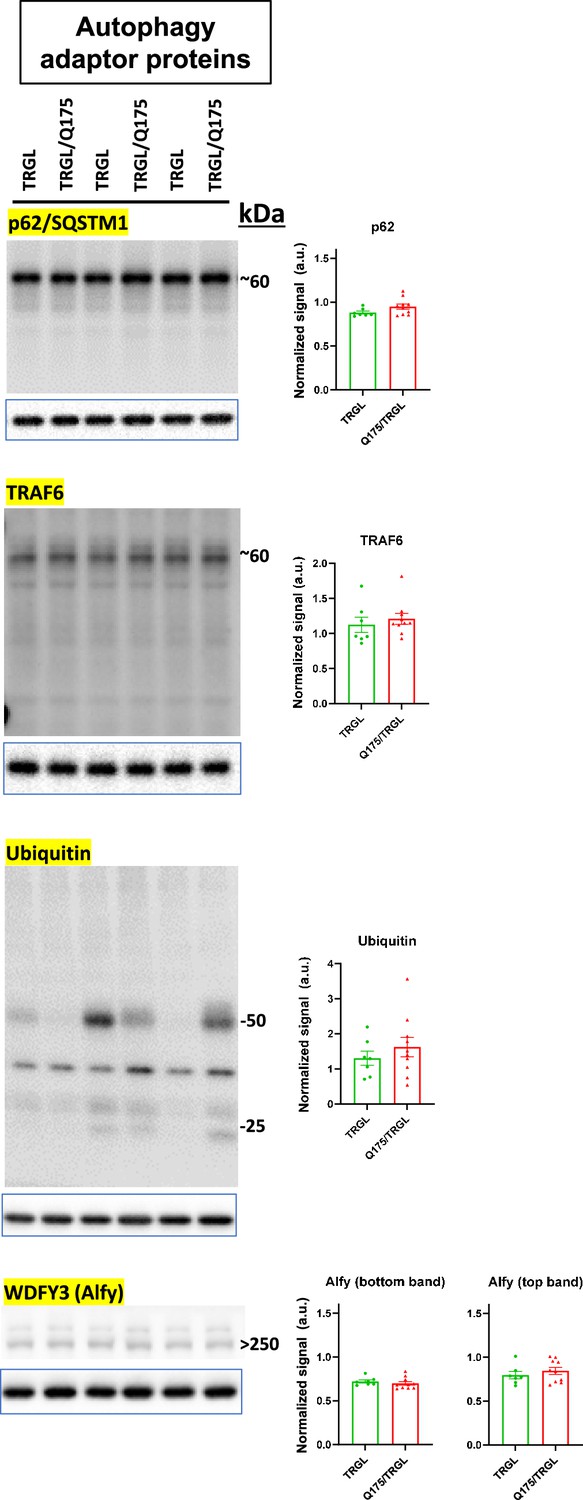
Autophagy adaptor proteins in the autophagic-lysosomal pathway (ALP) are largely unchanged in 17-mo-old TRGL/Q175.
Equal amounts of proteins from brain homogenates of 17-mo-old TRGL and TRGL/Q175 were subjected to SDS-PAGE and processed for western blotting (WB) with antibodies directed against a number of interested autophagy adaptor proteins in the ALP. Immunoblotting for each marker protein was performed one or more times depending on the quality of the blots. The blot of the loading control protein GAPDH is boxed and placed under each protein of interest. Images were collected by a digital gel imager (Syngene G:Box XX9). Densitometry was performed with Image J and the result for each protein of interest was normalized by its corresponding GAPDH blot and presented in the bar graph. Values are the Mean +/- SEM for each group (n = 7 TRGL and 10 TRGL/Q175). Significant differences between the two groups were analyzed by unpaired, two-tailed t-test. *p<0.05, **p<0.01, ***p<0.001.
-
Figure 3—figure supplement 3—source data 1
Original western blots for Figure 3—figure supplement 3.
- https://cdn.elifesciences.org/articles/104979/elife-104979-fig3-figsupp3-data1-v1.zip
-
Figure 3—figure supplement 3—source data 2
Original western blots for Figure 3—figure supplement 3, labeled for the relevant bands.
- https://cdn.elifesciences.org/articles/104979/elife-104979-fig3-figsupp3-data2-v1.zip
Figure 3—figure supplement 4
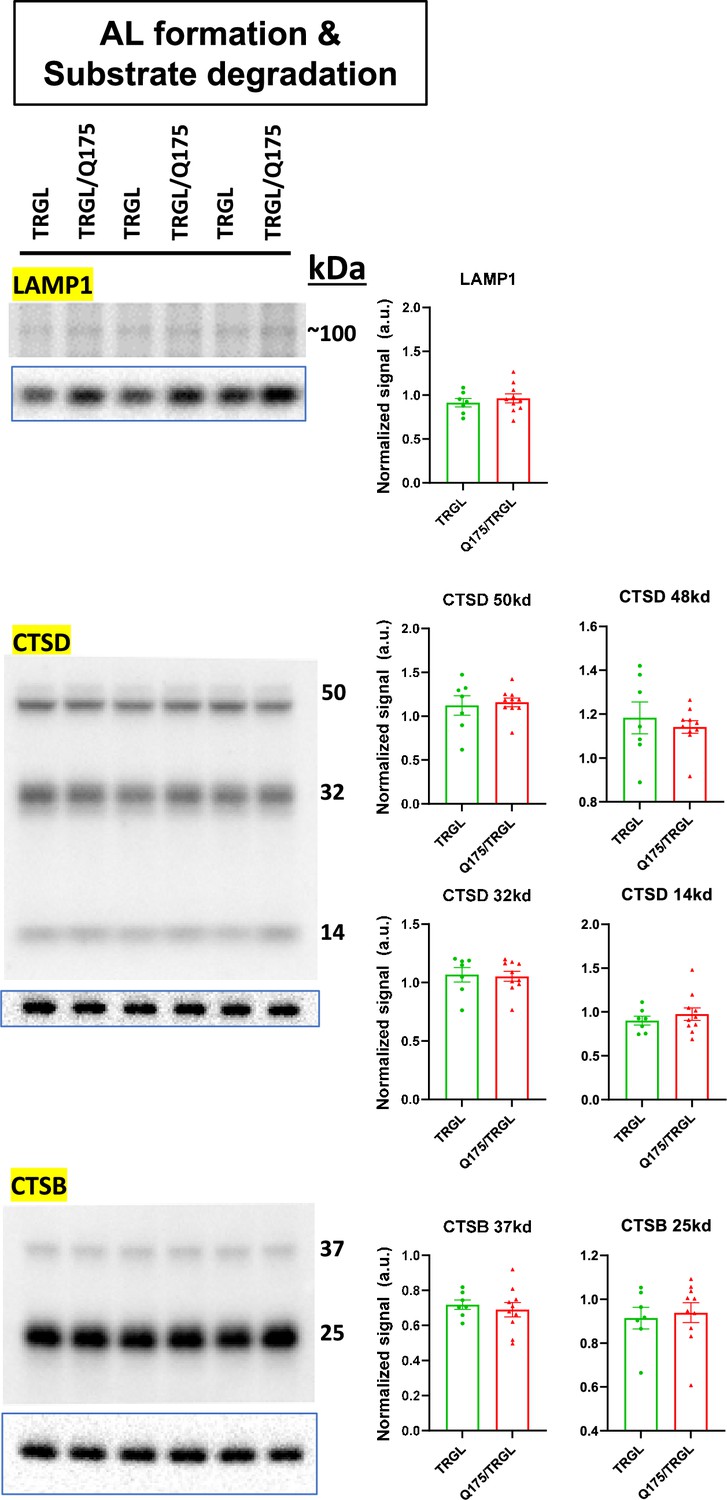
Molecules involved in autolysosomes (AL) formation/substrate degradation of the autophagic-lysosomal pathway (ALP) are largely unchanged in 17-mo-old TRGL/Q175.
Equal amounts of proteins from brain homogenates of 17-mo-old TRGL and TRGL/Q175 were subjected to SDS-PAGE and processed for western blotting (WB) with antibodies directed against a number of interested marker proteins in AL formation/substrate degradation (e.g., lysosomal hydrolases or structural components) of the ALP. Immunoblotting for each marker protein was performed one or more times depending on the quality of the blots. The blot of the loading control protein GAPDH is boxed and placed under each protein of interest. Images were collected by a digital gel imager (Syngene G:Box XX9). Densitometry was performed with Image J and the result for each protein of interest was normalized by its corresponding GAPDH blot and presented in the bar graph. Values are the Mean +/- SEM for each group (n = 7 TRGL and 10 TRGL/Q175). Significant differences between the two groups were analyzed by unpaired, two-tailed t-test. *p<0.05, **p<0.01, ***p<0.001.
-
Figure 3—figure supplement 4—source data 1
Original western blots for Figure 3—figure supplement 4.
- https://cdn.elifesciences.org/articles/104979/elife-104979-fig3-figsupp4-data1-v1.zip
-
Figure 3—figure supplement 4—source data 2
Original western blots for Figure 3—figure supplement 4, labeled for the relevant bands.
- https://cdn.elifesciences.org/articles/104979/elife-104979-fig3-figsupp4-data2-v1.zip
Figure 4
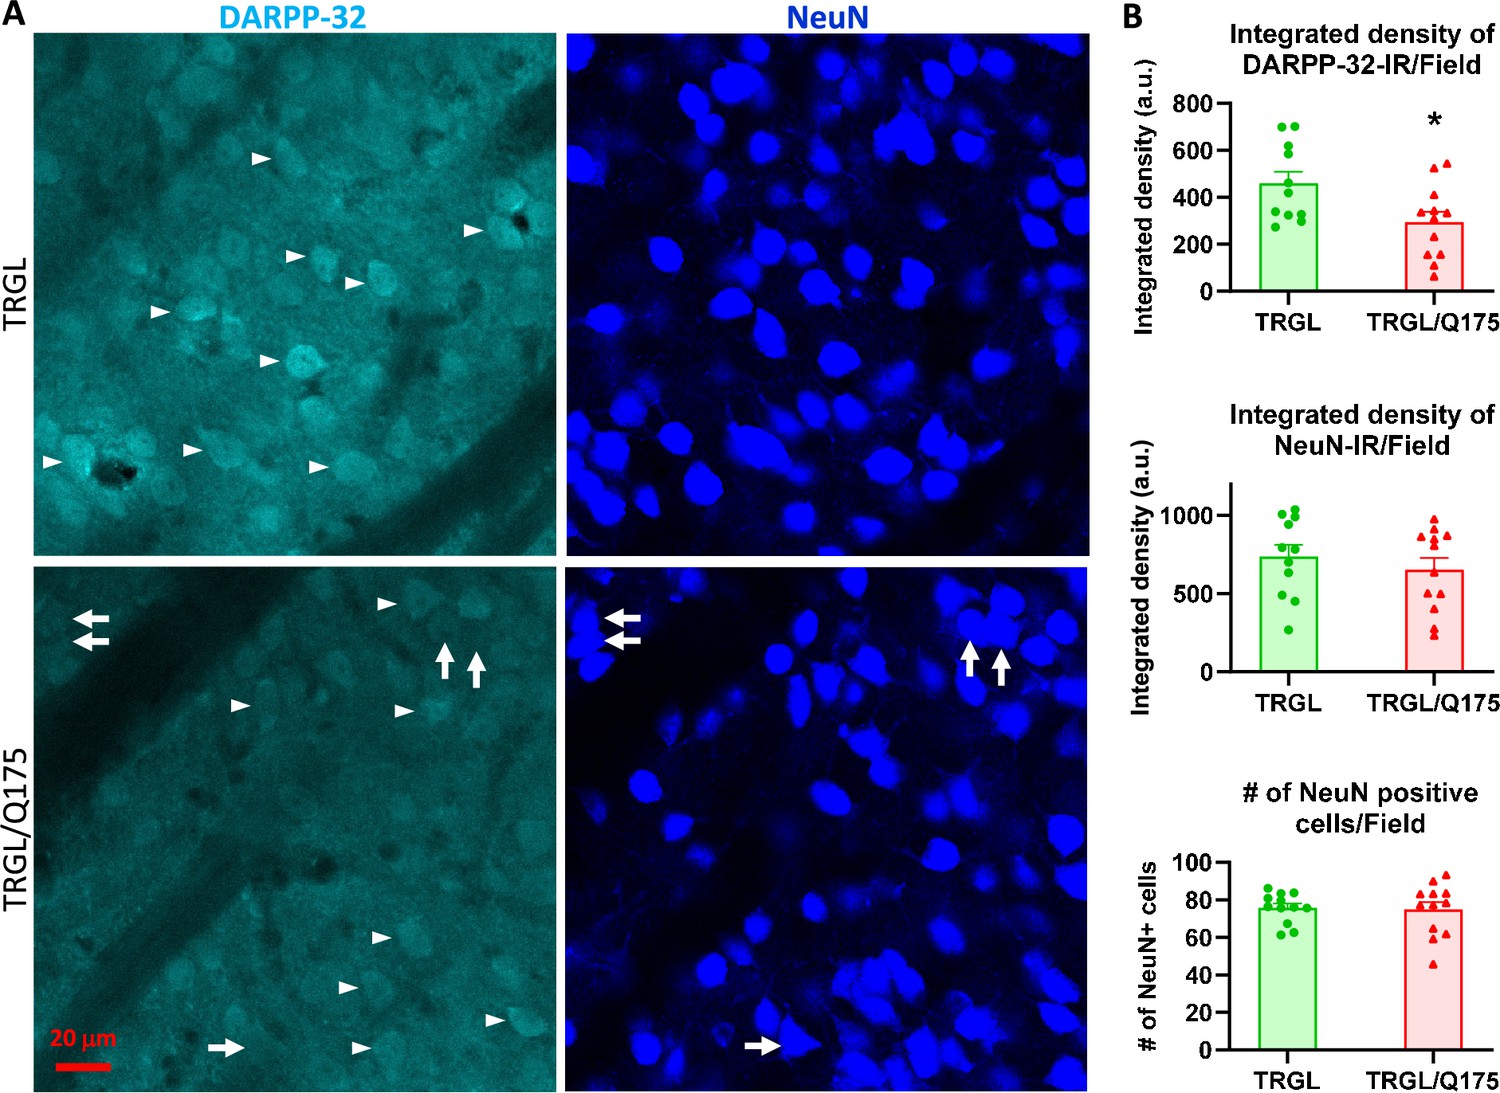
Decrease of DARPP-32-IR in striatal neurons of 17-mo-old TRGL/Q175 in the absence of a NeuN signal reduction.
Brain sections from TRGL and TRGL/Q175 (n=10 mice/genotype, four sections/mouse) were double-immunostained with anti-DARPP-32 and -NeuN antibodies. Confocal images from the cranial-dorsal portion of the striatum (three images at 120 x/section) were collected and representative images are shown (A). Arrows depict examples of neurons showing strong NeuN signal while minimal DARPP-32-IR. (B) Images were quantified by Image J for Integrated Density of DARPP-32- (top) or NeuN-IR/Image field (middle), and for # of NeuN positive cells/Image field (bottom). Statistical significances between the two groups were analyzed by unpaired, two-tailed t-test. *p<0.05.
Figure 5 with 1 supplement
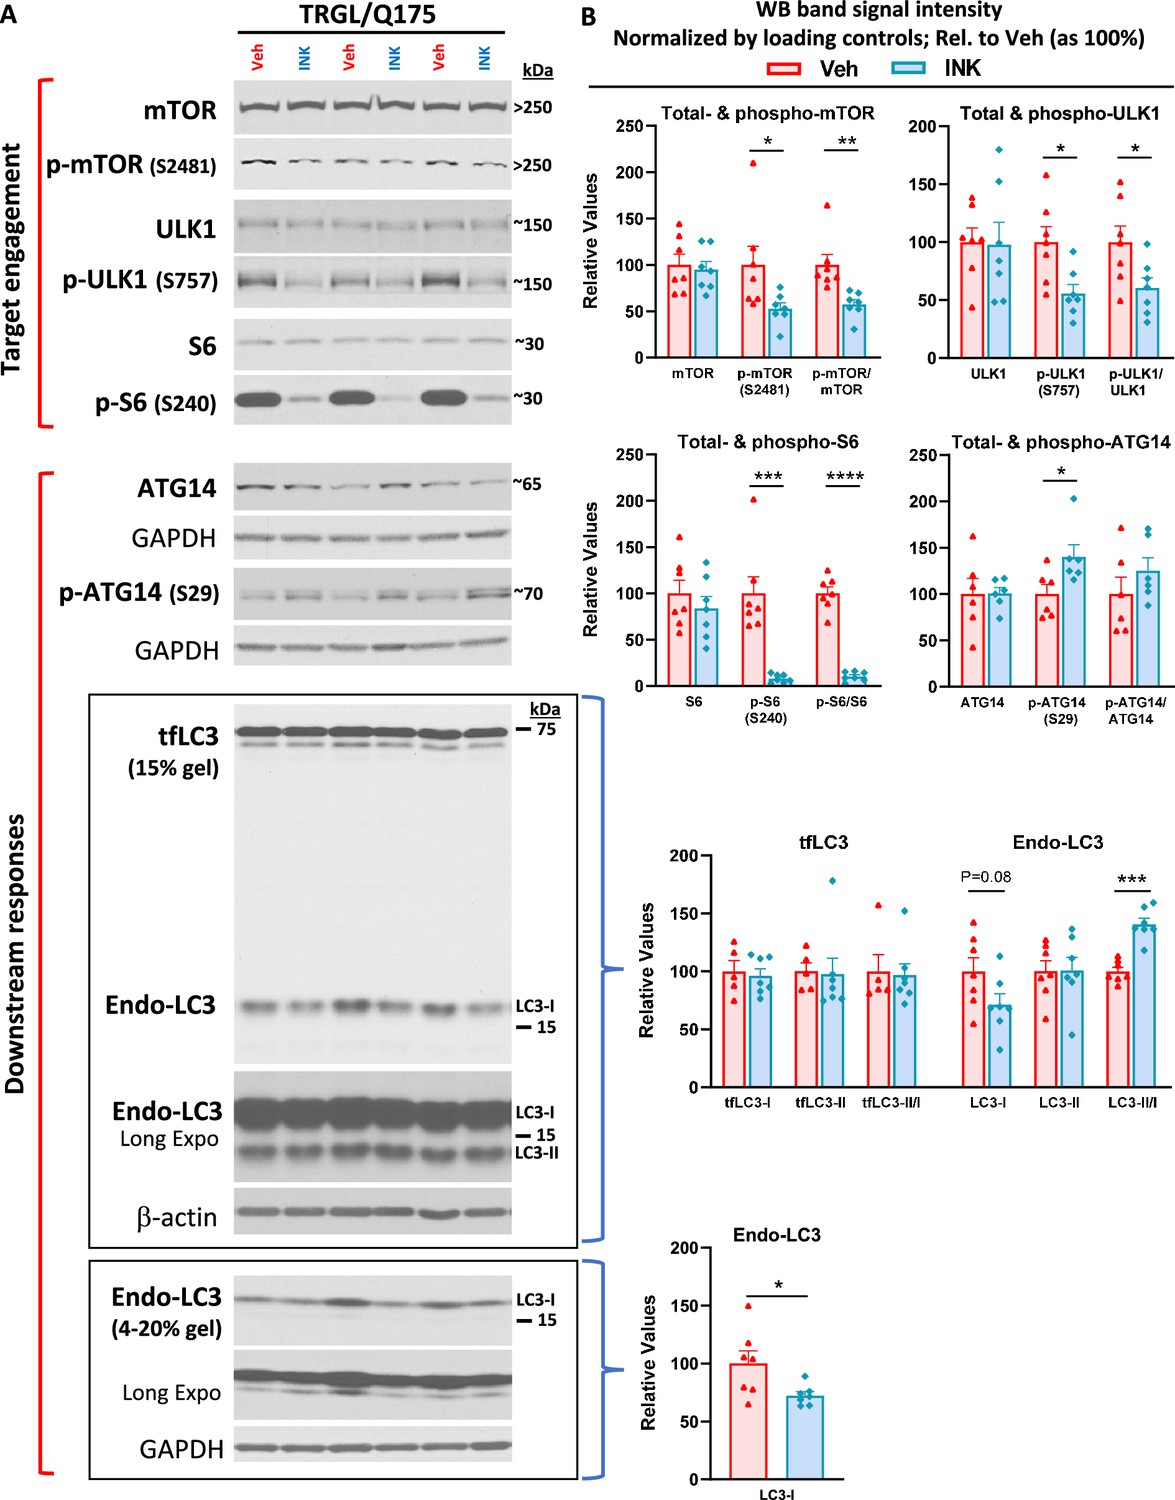
mTORi INK exhibits target engagement and induces downstream responses in the autophagic-lysosomal pathway (ALP) in 7-mo-old TRGL/Q175.
Equal amounts of proteins from brain homogenates of 7-mo-old TRGL/Q175 mice untreated (labeled as ‘Veh’) or mechanistic target of rapamycin kinase inhibitor (mTORi) INK treated [4 mg/kg (4-mpk), daily, 3 wk; labeled as ‘INK’] were subjected to SDS-PAGE and processed for western blotting (WB) with antibodies directed against several marker proteins in the autophagy pathway, representing target engagement of INK or downstream responses. Immunoblotting for each marker protein was performed one or more times depending on the quality of the blots. Representative blots are shown on the left (A) while quantitative results of the blots are shown on the right (B). The bottom LC3 blots represent a repeated immunoblotting experiment. Values are the Mean ± SEM for each group (n=6–7 mice per condition). Significant differences between the two groups were analyzed by unpaired, two-tailed t-test. *p<0.05, **p<0.01, ***p<0.001, ****p<0.0001. tfLC3=mRFP-eGFP-LC3; Endo-LC3=endogenous LC3.
-
Figure 5—source data 1
Original western blots for Figure 5A.
- https://cdn.elifesciences.org/articles/104979/elife-104979-fig5-data1-v1.zip
-
Figure 5—source data 2
Original western blots for Figure 5A, labeled for the relevant bands.
- https://cdn.elifesciences.org/articles/104979/elife-104979-fig5-data2-v1.zip
Figure 5—figure supplement 1
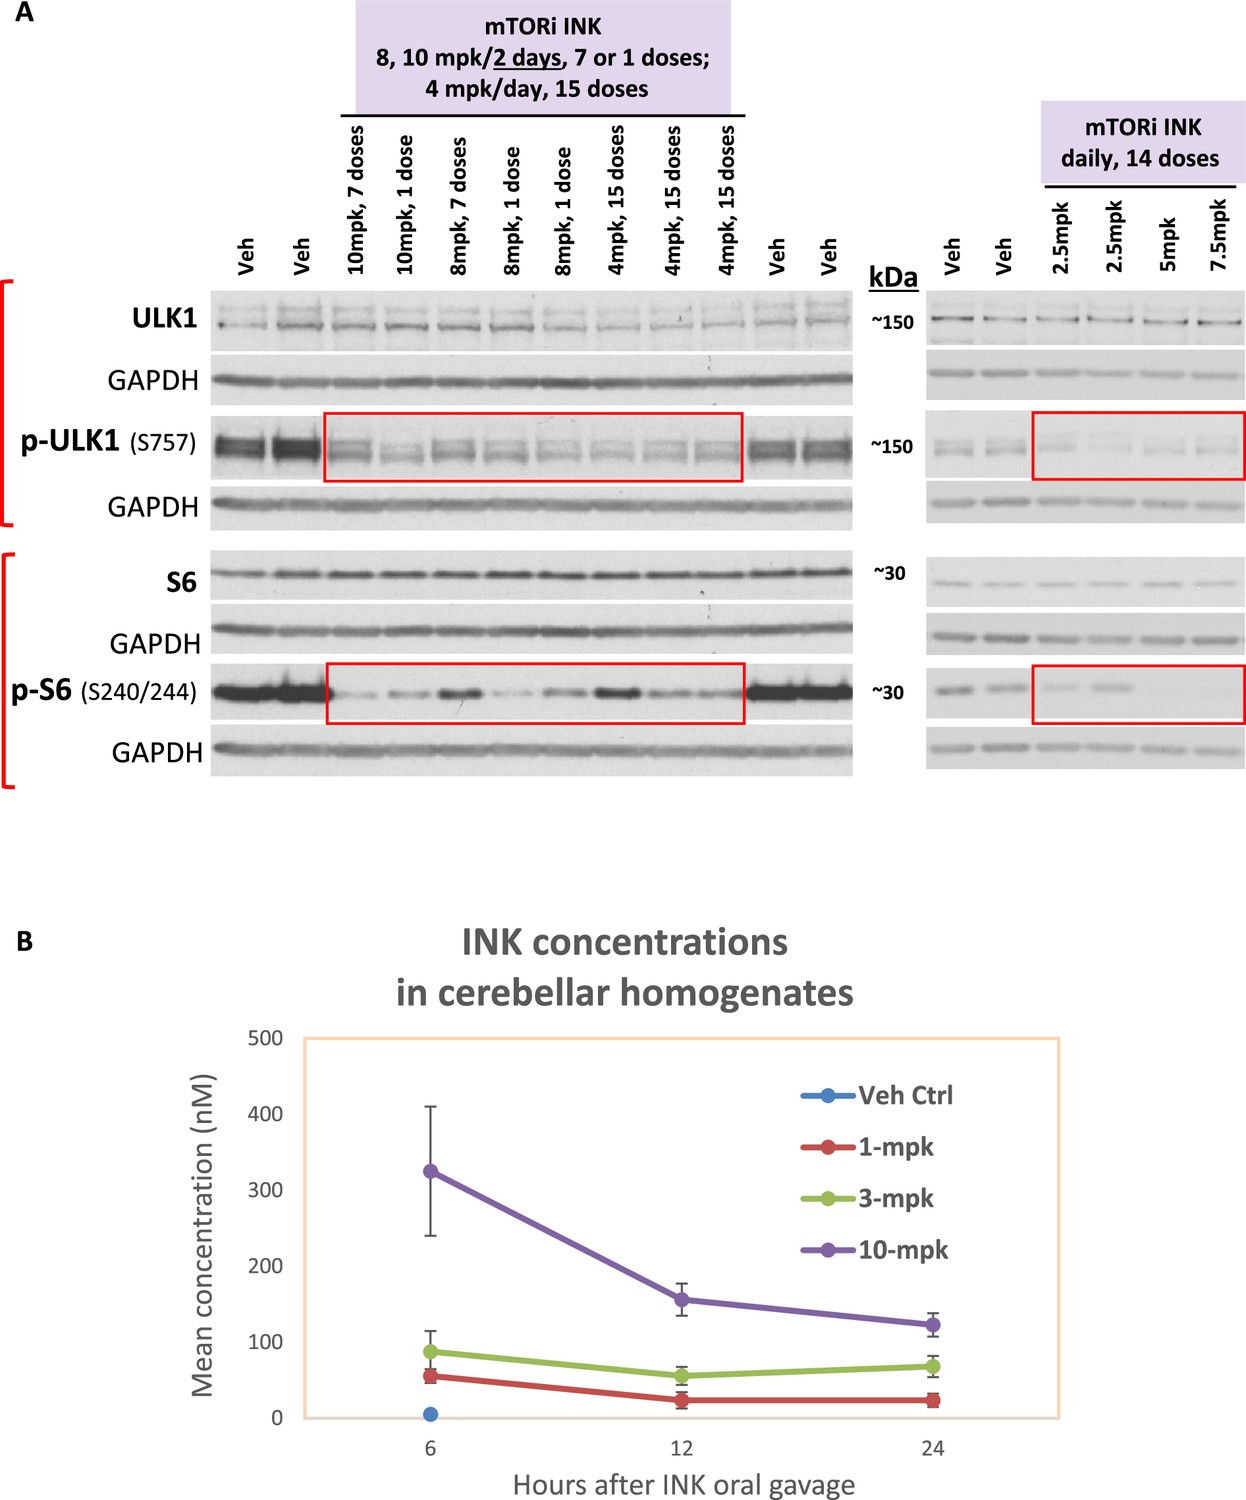
Dosing tests demonstrate mechanistic target of rapamycin kinase inhibitor (mTORi) INK blood-brain barrier (BBB) penetration and target engagement even at low dosages.
(A) Dosing tests for INK. INK or the vehicle was administered by oral gavage. Two dosing tests were done in 6-mo-old wild-type (WT) mice, one with 10, 8 mg/kg (mpk) every other day or 4-mpk daily for 2 wk and the other with 7.5, 5, 2.5-mpk daily for 2 wk. Equal amounts of proteins from brain homogenates of mice receiving vehicle (labeled as ‘Veh’) or INK were subjected to SDS PAGE and processed for WB with antibodies directed against marker proteins representing target engagement of INK, such as p-ULK1 (S757) and p-S6 – the drug effects are reflected by the changes within the boxed areas compared to the signals of Veh outside the boxed areas. Immunoblotting for each marker protein was performed one or more times depending on the quality of the blots. (B) INK was detected in the brains of mice receiving a single dose via oral gavage. After 6, 12 or 24 hrs post INK administration to 6-mo-old WT mice, INK was detected in cerebellum of mice treated with 1, 3 or 10-mpk INK. Total 60 mice: n = 6 mice/dose/time point, where the Vehicle control group was just tested once at the 6-hr time point.
-
Figure 5—figure supplement 1—source data 1
Original western blots for Figure 5—figure supplement 1.
- https://cdn.elifesciences.org/articles/104979/elife-104979-fig5-figsupp1-data1-v1.zip
-
Figure 5—figure supplement 1—source data 2
Original western blots for Figure 5—figure supplement 1, labeled for the relevant bands.
- https://cdn.elifesciences.org/articles/104979/elife-104979-fig5-figsupp1-data2-v1.zip
Figure 6
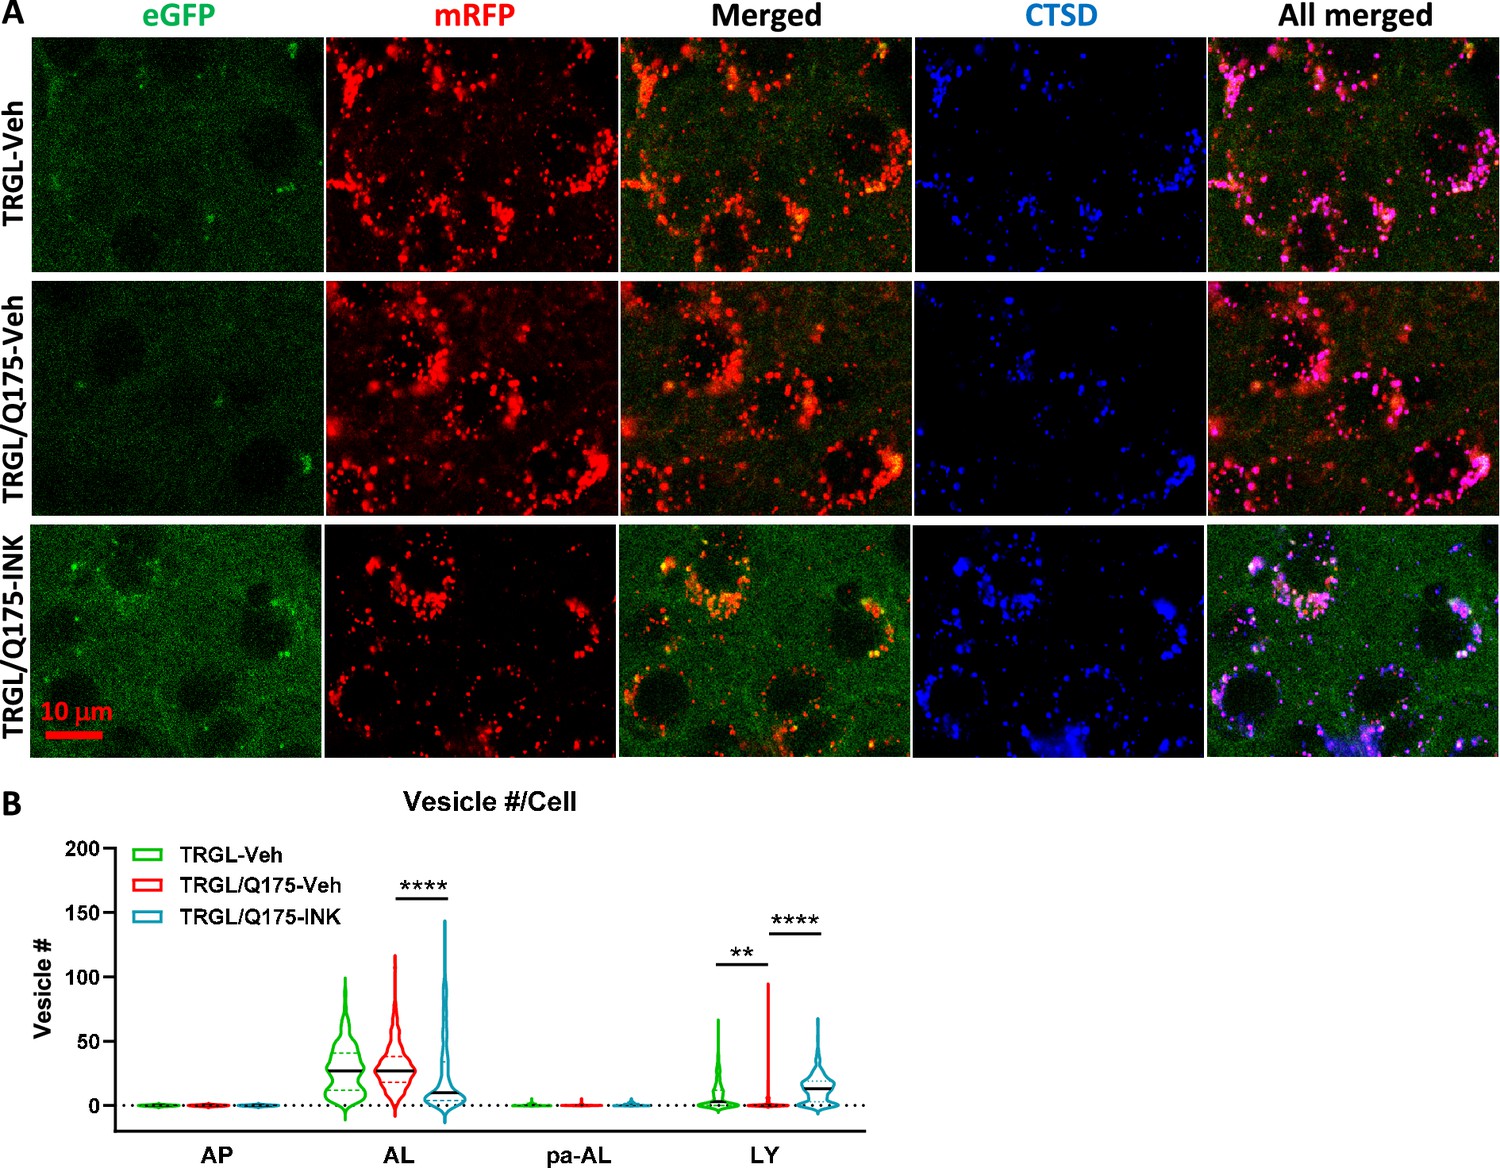
Mechanistic target of rapamycin kinase inhibitor (mTORi) INK reverses the mild alteration of autophagic vacuole (AV)/lysosomes (LY) subtypes in the striatum of 7-mo-old TRGL/Q175.
(A) Brain sections from untreated or INK (4-mpk, 3 w)-treated TRGL/Q175 vs. TRGL (four sections/mouse, 5–6 mice per condition) were immunostained with an anti-cathepsin D (CTSD) antibody. Confocal images from the cranial-dorsal portion of the striatum (three images at 120 x/section) were collected and representative images for each eGFP-LC3 (green), mRFP-LC3 (red), and CTSD (blue) are shown. (B) Hue angle-based analysis was performed for AV/LY subtype determination using the methods described in Lee et al., 2019. Data are presented as Vesicle #/Neuron (TRGL-Veh: n=260 neurons; TRGL/Q175-Veh: n=218 neurons; TRGL/Q175-INK: n=287 neurons). Statistical significances among the groups were analyzed by one-way ANOVA followed by Sidak’s multiple comparisons test. **p<0.01, ****p<0.0001.
Figure 7
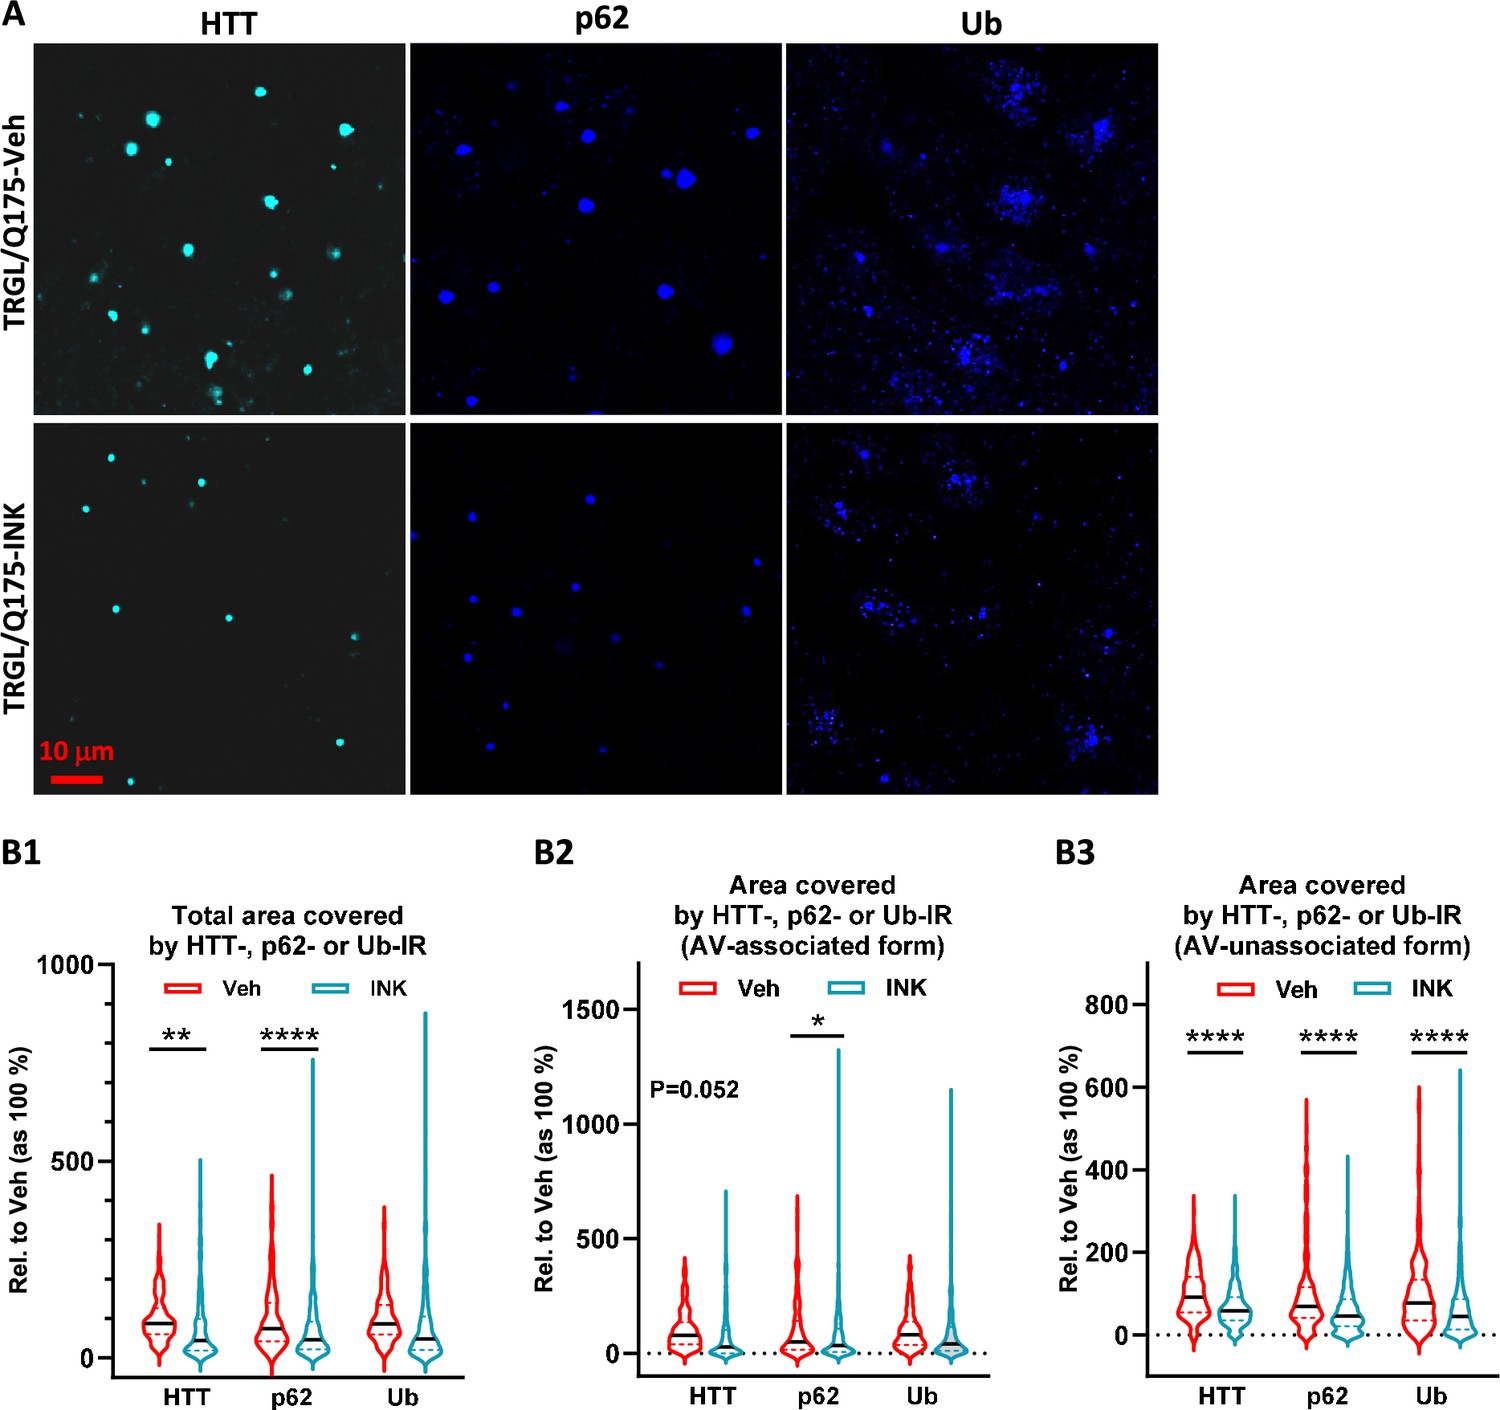
Mechanistic target of rapamycin kinase inhibitor (mTORi) INK reduces HTT-, Ub-, or p62-IR-covered areas parallelly in the striatum of 7-mo-old TRGL/Q175.
(A) Brain sections from INK (4-mpk, 3 w)-treated or untreated TRGL/Q175 (four sections/mouse, 6–7 mice/condition) were immunostained with anti-HTT (MW8), -p62, or -pan-Ub antibodies. Confocal images from the cranial-dorsal portion of the striatum (three images at 120 x/section) were collected. Shown are single-channel images (i.e. without showing the eGFP and mRFP signals). (B1–B3) Areas covered by either the HTT-, p62-, or Ub-IR on a per cell basis are quantified (for HTT-IR, TRGL/Q175-Veh: n=196 neurons, TRGL/Q175-INK: n=385 neurons; for p62-IR, TRGL/Q175-Veh: n=311 neurons, TRGL/Q175-INK: n=378 neurons; for Ub-IR, TRGL/Q175-Veh: n=244 neurons, TRGL/Q175-INK: n=347 neurons) and grouped as ‘Total Area’ (B1), 'AV-associated Form’ (i.e. the IR which was associated with tfLC3 signals representing autophagic vacuoles, AVs) (B2) or ‘AV-unassociated Form’ (i.e. the IR which was not associated with the tfLC3 signals) (B3). Statistical significances between the two groups were analyzed by unpaired t-test. Two-tailed p-value: *p<0.05, ****p<0.0001.
Figure 8
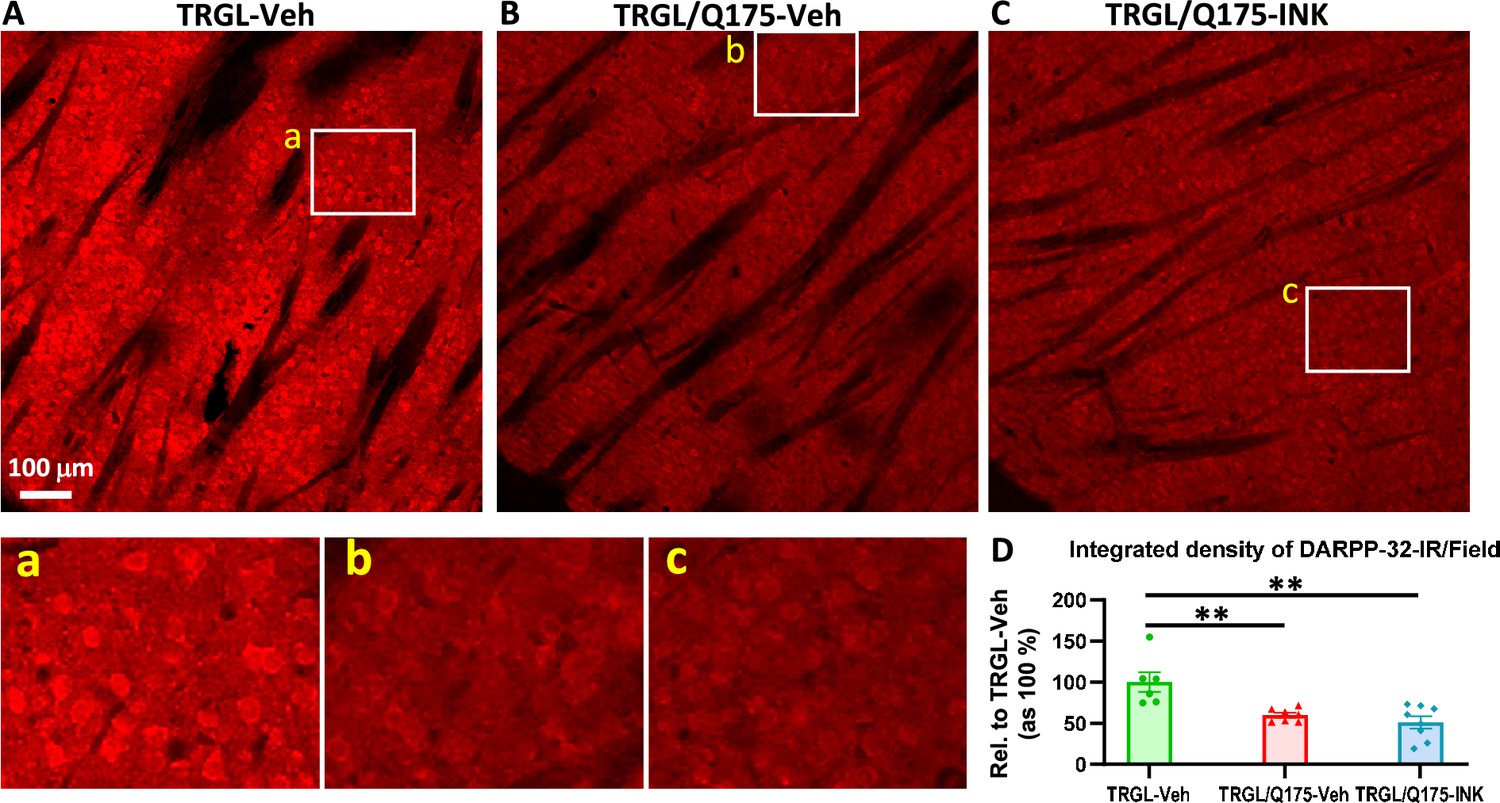
INK treatment does not reverse the reduction of DARPP-32-IR in the striatum of 7-mo-old TRGL/Q175.
(A-C) Sagittal brain sections containing the striatum area were immunostained with an anti-DARPP-32 antibody, and 10 x images taken from the cranial-dorsal portion of the striatum are shown (first row). Boxed areas on the first row are enlarged and shown on the second row for easy viewing of the immunostaining patterns for each condition. (D) For quantitation purposes, each whole 10 x image (excluding the areas covered by the fiber bundles which usually exhibited minimal background staining – achieved by threshold setting) was quantified by ImageJ (one image/section, four sections/mouse) and the results are expressed as the Integrated Density of DARPP-32-IR. n=6–8 mice/condition. Statistical significances among the groups were analyzed by one-way ANOVA followed by Sidak’s multiple comparisons test. **p<0.01 compared to TRGL-Veh.
Tables
Key resources table
| Reagent type (species) or resource | Designation | Source or reference | Identifiers | Additional information |
|---|---|---|---|---|
| Genetic reagent, KI-mouse (Mus musculus male and female) | Q175 KI | CHDI-81003003 | N/A | Knock-in Mouse human HTT exon 1 sequence containing a ~190 CAG repeat tract |
| Genetic reagent, Transgenic (Mus musculus male and female) | TRGL6 | Lee et al., 2019 | N/A | Transgenic with Thy1 promoter |
| Genetic reagent, Transgenic (Mus musculus male and female) cross with KI (Mus musculus male and female) | Q175/TRGL | This study | N/A | Crossed the zQ175 KI with the TRGL6 mice |
| Sequence-based reagent | Forward primer for genotyping TRGL: 50-CTT TCC CCA CAG AAT CCA AGT CGG AAC-30 | Lee et al., 2019 | ||
| Sequence-based reagent | Reverse primer for genotyping TRGL: 50-GCA CGA ATT CGG GCG CCG GTG GAG TGG CGG-30 | Lee et al., 2019 | ||
| Antibody | tHTT | Cell Signaling Technology | Cat# 5656; RRID:AB_10827977 | WB: 1:1000 |
| Antibody | ntHTT mEM48 | Millipore sigma | Cat# MAB5374; RRID:AB_177645 | WB 1:200 IHC 1:50 |
| Antibody | HTT 1C2 | Millipore sigma | Cat# mab1574; RRID:AB_94263 | WB 1:1000 |
| Antibody | HTT human | Millipore sigma | Cat# mab5490; RRID:AB_2233522 | WB 1:1000 IHC 1:200 |
| Antibody | HTT MW8 | Develop Studies Hybridoma Bank, University of Iowa | Cat# MW8; RRID:AB_528297 | |
| Antibody | HTT PHP2 | CHDI/Coriell | Cat# CHDI-90001516–2 | |
| Antibody | MTOR | Cell Signaling Technology | Cat# 2983; RRID:AB_2105622 | WB: 1:1000 |
| Antibody | p-MTOR S2481 | Cell Signaling Technology | Cat# 2874 | WB 1:1000 |
| Antibody | p-MTOR S2448 | Cell Signaling Technology | Cat# 2971; RRID:AB_330970 | WB: 1:1000 |
| Antibody | p70S6K | Cell Signaling Technology | Cat# 2708; RRID:AB_390722 | WB: 1:1000 |
| Antibody | p-p70S6K S371 | Cell Signaling Technology | Cat#: 9208 | WB: 1:1000 |
| Antibody | p-p70S6K T389 | Cell Signaling Technology | Cat# 9234; RRID:AB_2269803 | WB: 1:1000 |
| Antibody | S6 ribosomal | Cell Signaling Technology | Cat# 2317; RRID:AB_2238583 | WB: 1:1000 |
| Antibody | p-S6 ribosomal S240/S244 | Cell Signaling Technology | Cat# 5364; RRID:AB_10694233 | WB: 1:1000 |
| Antibody | ULK1 | Cell Signaling Technology | Cat# 6439; RRID:AB_11178933 | WB: 1:500 |
| Antibody | p-ULK S757 | Cell Signaling Technology | Cat# 6888; RRID:AB_10829226 | WB: 1:500 |
| Antibody | p-ULK S317 | Cell Signaling Technology | Cat# 37762; RRID:AB_2922992 | WB: 1:500 |
| Antibody | ATG5 | Cell Signaling Technology | Cat# 12994; RRID:AB_2630393 | WB: 1:1000 |
| Antibody | ATG5 | Millipore sigma | Cat# abc14 | WB: 1:750 IHC 1:500 |
| Antibody | ATG14 | Cell Signaling Technology | Cat# 5504; RRID:AB_10695397 | WB: 1:1000 |
| Antibody | p-ATG14 S29 | Cell Signaling Technology | Cat# 92340; RRID:AB_2800182 | WB: 1:1000 |
| Antibody | Beclin 1 | BD Bioscience | Cat# 612113; RRID:AB_399484 | WB: 1:1000 |
| Antibody | p-Beclin 1 S30 | Cell Signaling Technology | Cat# 35955 | WB: 1:1000 |
| Antibody | VPS34 | Cell Signaling Technology | Cat# 4263 | WB 1:1000 |
| Antibody | p-VPS34 S249 | Cell Signaling Technology | Cat# 13857; RRID:AB_2798332 | WB 1:1000 |
| Antibody | TRAF6 | Cell Signaling Technology | Cat# 8028 | WB 1:1000 |
| Antibody | LC3 | Millipore sigma | Cat# abc929 | WB 1:500 IHC 1:100 |
| Antibody | LC3 | Novus Biologics | Cat# NB100-2220; RRID:AB_10003146 | WB 1:1000 IHC 1:200 |
| Antibody | p62/sqstm1 | BD Biosciences | Cat# 610832; RRID:AB_398152 | WB 1:2000 IHC 1:200 |
| Antibody | p62/SQSTM1 c-term | Progen Biotechnik | Cat# GP62-C; RRID:AB_2687531 | WB 1:1000 IHC 1:250 |
| Antibody | Ubiquitin | Dako Agilent | Cat# z0458; RRID:AB_2315524 | |
| Antibody | Ubiquitin | Abcam | Cat# ab7780; RRID:AB_306069 | |
| Antibody | LAMP1 | Develop Studies Hybridoma Bank, University of Iowa | Cat# H4A3; RRID:AB_2296838 | IHC 1:50 |
| Antibody | CTSB | Neuromics | Cat# GT15047; RRID:AB_2737184 | WB 1:5000 IHC 1:500 |
| Antibody | CTSD | In house | RU4 | WB 1:10,000 IHC 1:5000 |
| Antibody | CTSD sheep | In house | D-2–3 | WB 1:1000 IHC 1:500 |
| Antibody | DARPP32 | Abcam | Cat# ab40801; RRID:AB_731843 | WB 1:1000 IHC 1:100 |
| Antibody | NeuN | Millipore Sigma | Cat# mab377; RRID:AB_2298772 | IHC 1:400 |
| Antibody | β−actin | Millipore Sigma | Cat# A1978; RRID:AB_476692 | WB 1:10,000 |
| Antibody | Goat anti-rabbit secondary | Vector Laboratories | Cat# 68–4140 | IHC: 1:500 |
| Antibody | Goat anti-mouse secondary | Vector Laboratories | Cat# BA-9200 | IHC: 1:500 |
| Antibody | Alexa Fluor 488-conjugated goat anti-rabbit IgG | Thermo Fisher Scientific | Cat# A11034; RRID:AB_2576217 | IHC: 1:500 |
| Antibody | Alexa Fluor 568- goat anti-rabbit IgG | Thermo Fisher Scientific | Cat# A11036; RRID:AB_10563566 | IHC: 1:500 |
| Antibody | Alexa Fluor 647- goat anti-rabbit IgG | Thermo Fisher Scientific | Cat# A21245; RRID:AB_2535813 | IHC: 1:500 |
| Antibody | Alexa Fluor 405- goat anti-rabbit IgG | Thermo Fisher Scientific | Cat# A48254; RRID:AB_2890548 | IHC: 1:500 |
| Antibody | Alexa Fluor 568- goat anti-mouse IgG | Thermo Fisher Scientific | Cat# A11031; RRID:AB_144696 | IHC: 1:500 |
| Antibody | Alexa Fluor 647- goat anti-mouse IgG | Thermo Fisher Scientific | Cat# A21235; RRID:AB_2535804 | IHC: 1:500 |
| Antibody | Alexa Fluor 568- goat anti-rat IgG | Thermo Fisher Scientific | Cat# A21247; RRID:AB_141778 | IHC: 1:500 |
| Antibody | Donkey anti-Rabbit IgG HRP | Jackson ImmunoResearch | Cat# 711-035-152; RRID:AB_10015282 | WB: 1:5000 |
| Antibody | Donkey anti-Mouse IgG HRP | Jackson ImmunoResearch | Cat# 712-035-150; RRID:AB_2340638 | WB: 1:5000 |
| Antibody | Donkey anti-goat IgG HRP | Jackson ImmunoResearch | Cat# 705-035-003; RRID:AB_2340390 | WB: 1:5000 |
| Antibody | 10 nm gold anti mouse IgG | Electron Microscopy Sciences | Cat# 25129 | IEM 1:50 |
| Antibody | 10 nm gold anti rabbit IgG | Electron Microscopy Sciences | Cat# 25109 | IEM 1:50 |
| Chemical compound, drug | INK (mTOR i) | ChemScene | CAS 1224844-38-5 | Dissolved in 0.5% carboxymethyl cellulose (Sigma, Cat #5678) and 0.05% tween 80 in water |
| Chemical compound, drug | PBS | Thermo Fisher Scientific | Cat# BP339-4 | |
| Chemical compound, drug | Sodium cacodylate buffer | Electron Microscopy Sciences | Cat#11652 | 0.1 M for fixation of brains |
| Chemical compound, drug | Paraformaldehyde | Electron Microscopy Sciences | Cat#15714 | 4% for fixation of brains |
| Chemical compound, drug | 25% glutaraldehyde | Electron Microscopy Sciences | Cat# 16220 | |
| Chemical compound, drug | Uranyl acetate | Electron Microscopy Sciences | Cat# 22400–4 | EM processing |
| Chemical compound, drug | Lead citrate | Electron Microscopy Sciences | Cat#22410 | EM processing |
| Chemical compound, drug | Osmium tetroxide | Ted Pella | Cat#18465 | EM processing |
| Chemical compound, drug | Sodium metaperiodate | Sigma-Aldrich | Cat#S1878-25g | EM processing |
| Chemical compound, drug | Permount | Electron Microscopy Sciences | Cat# 17986 | Dab IHC |
| Chemical compound, drug | Flouro-gel | Electron Microscopy Sciences | Cat# 17985–10 | IF IHC |
| Chemical compound, drug | FBS | Thermo Fisher Scientific | Cat# 26140 | IHC blocking |
| Chemical compound, drug | Horse serum | Thermo Fisher Scientific | Cat# 16050 | IHC blocking |
| Chemical compound, drug | Spurr resin | Electron Microscopy Sciences | Cat# 14300 | |
| Commercial assay kit | Vectastain ABC | Vector Laboratories | Cat# PK-4000; RRID:AB_2336818 | For DAB staining |
| Commercial assay kit | DAB Peroxidase Substrate kit | Vector Laboratories | Cat# SK-4100; RRID:AB_2336382 | For DAB staining |
| Commercial assay kit | HQ silver kit | NanoProbes | Cat# 2012–45 ml | EM processing |
| Software | ImageJ | NIH | https://imagej.nih.gov/ij/ | |
| Software | Excel | Microsoft | Microsoft 365 | |
| Software | GraphPad Prism 8.0.1 | GraphPad | ||
| Other | Nitrocellulose membrane | Whatman | WB 0.2µm-pore | |
| Other | Aclar embedding film | Electron Microscopy Sciences | Cat# 50425–25 | EM processing |
| Other | 75 mesh nickel grids with carbon coating and formvar | Electron Microscopy Sciences | Cat# pi-75-ni-25 | EM processing |
| Other | EM block | Electron Microscopy Sciences | Cat# 25596 | EM processing |
Additional files
Download links
A two-part list of links to download the article, or parts of the article, in various formats.
Downloads (link to download the article as PDF)
Open citations (links to open the citations from this article in various online reference manager services)
Cite this article (links to download the citations from this article in formats compatible with various reference manager tools)
mTOR inhibition in Q175 Huntington’s disease model mice facilitates neuronal autophagy and mutant huntingtin clearance
eLife 14:RP104979.
https://doi.org/10.7554/eLife.104979.3


