Mutations that prevent phosphorylation of the BMP4 prodomain impair proteolytic maturation of homodimers leading to lethality in mice
- Department of Neurobiology, University of Utah, United States
- Department of Biochemistry, University of Utah, United States
- Internal Medicine, Division of Hematology and Hematologic Malignancies, University of Utah, United States
Figures
Figure 1 with 2 supplements
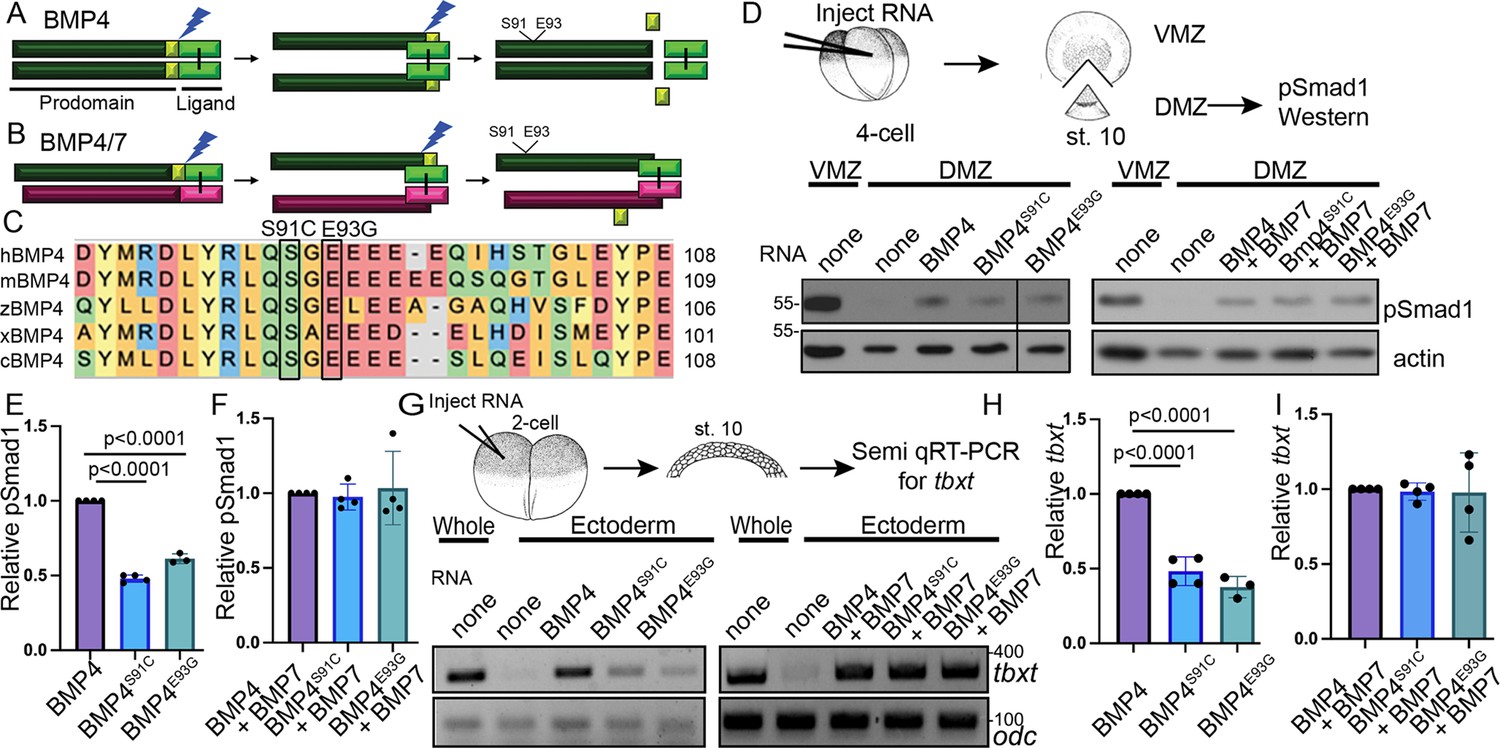
Point mutations predicted to interfere with phosphorylation of the BMP4 prodomain selectively interfere with BMP4 homodimer but not BMP4/7 heterodimer activity.
Schematic illustrating sequential cleavage of BMP4 homodimers (A) and BMP4/7 heterodimers (B). BMP4 is sequentially cleaved at two sites to generate the mature ligand (light green) together with large (dark green) and small (yellow) prodomain fragments. (C) Sequence alignment of a portion of the prodomain of human (h), mouse (m), zebrafish (z), Xenopus (x), and chick (c) BMP4 to illustrate the conserved S-X-G FAM20C recognition motif. (D) RNA encoding wild type or point mutant forms of BMP4 were injected alone or together with BMP7 near the dorsal marginal zone (DMZ) of 4-cell embryos. DMZ and ventral marginal zone (VMZ) explants were isolated at stage 10 and pSmad1 levels were analyzed by immunoblot as illustrated. Blots were reprobed with actin as a loading control. Black bar indicates where a non-relevant intervening lane was removed using photoshop. (E, F) Quantitation of relative pSmad1 levels normalized to actin in at least three independent experiments (mean ± SD, data analyzed using an unpaired t-test). (G) RNA encoding wild type or point mutant forms of BMP4 were injected alone or together with BMP7 near the animal pole of 2-cell embryos. Ectodermal explants were isolated at stage 10 and tbxt levels were analyzed by semi-quantitative RT-PCR as illustrated. (H, I) Quantitation of relative tbxt levels normalized to odc in at least three independent experiments (mean ± SD, data analyzed using an unpaired t-test).
-
Figure 1—source data 1
TIFF files containing original western blots for Figure 1D, indicating the relevant bands, explants, and deleted lane.
- https://cdn.elifesciences.org/articles/105018/elife-105018-fig1-data1-v1.zip
-
Figure 1—source data 2
TIFF files containing original western blots for Figure 1D.
- https://cdn.elifesciences.org/articles/105018/elife-105018-fig1-data2-v1.zip
-
Figure 1—source data 3
TIFF files containing original PCR scans for Figure 1G, indicating the relevant bands and injected RNAs.
- https://cdn.elifesciences.org/articles/105018/elife-105018-fig1-data3-v1.zip
-
Figure 1—source data 4
TIFF files containing original PCR scans for Figure 1G, indicating injected RNAs.
- https://cdn.elifesciences.org/articles/105018/elife-105018-fig1-data4-v1.zip
Figure 1—figure supplement 1
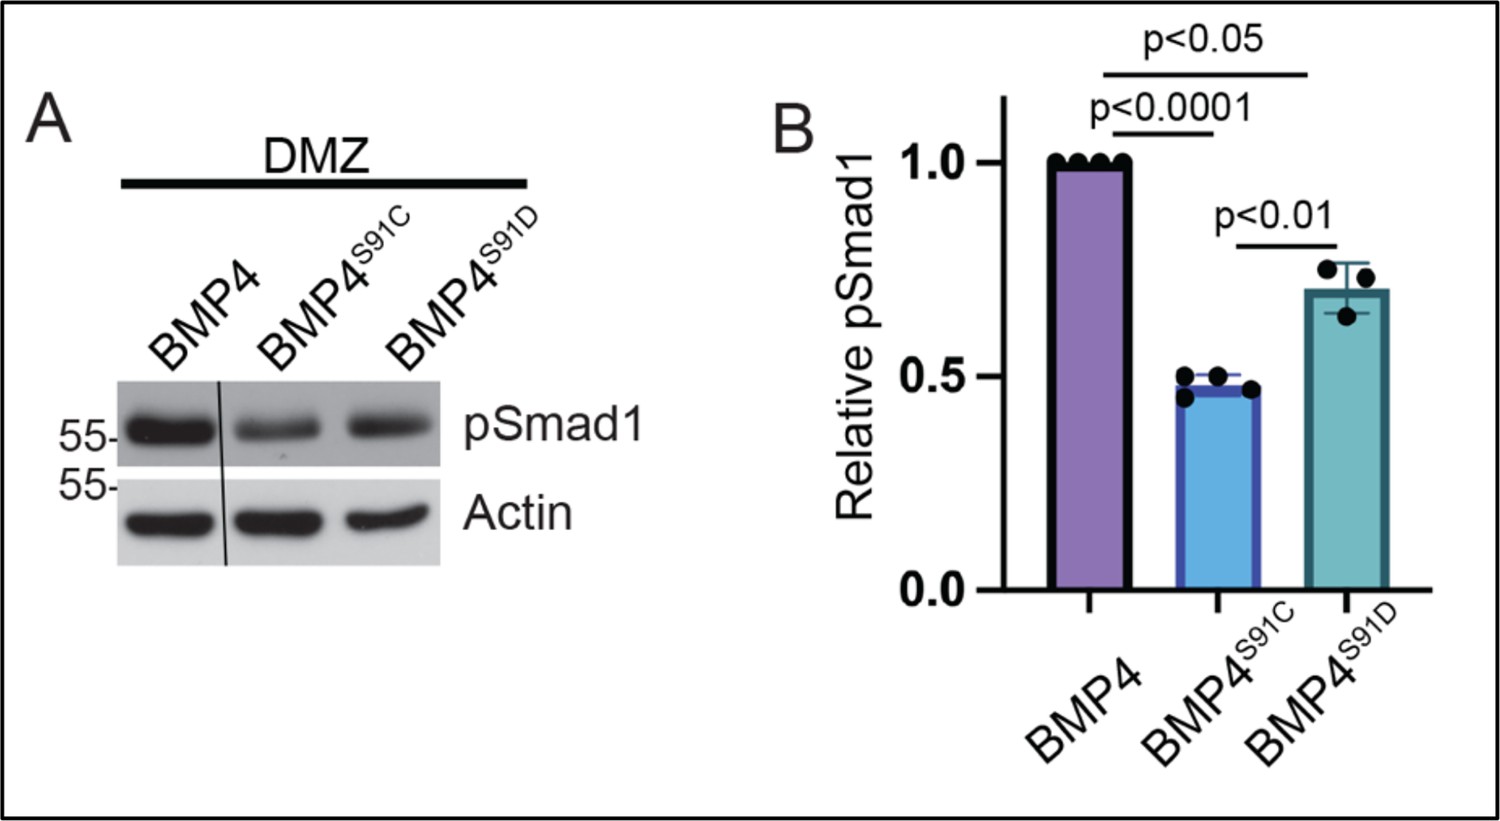
Ectopic expression of a phosphomimetic mutant form of BMP4 (BMP4S91D) generates more activity than BMP4S91C but less activity than native BMP4.
(A) RNA encoding a wild type or point mutant form of BMP4 (25 pg) was injected near the dorsal marginal zone (DMZ) of 4-cell embryos. DMZ explants were isolated at stage 10 and pSmad1 levels analyzed by immunoblot. Blots were reprobed with actin as a loading control. Black bar indicates where a non-relevant intervening lane was removed using photoshop. (B) Quantitation of relative pSmad1 levels normalized to actin in at least 3 independent experiments (mean +/- SD, data analyzed using an unpaired t-test).
-
Figure 1—figure supplement 1—source data 1
TIFF files containing original western blots for Figure 1—figure supplement 1A, indicating the relevant bands and genotypes.
- https://cdn.elifesciences.org/articles/105018/elife-105018-fig1-figsupp1-data1-v1.zip
-
Figure 1—figure supplement 1—source data 2
TIFF files containing original western blots for Figure 1—figure supplement 1A.
- https://cdn.elifesciences.org/articles/105018/elife-105018-fig1-figsupp1-data2-v1.zip
Figure 1—figure supplement 2
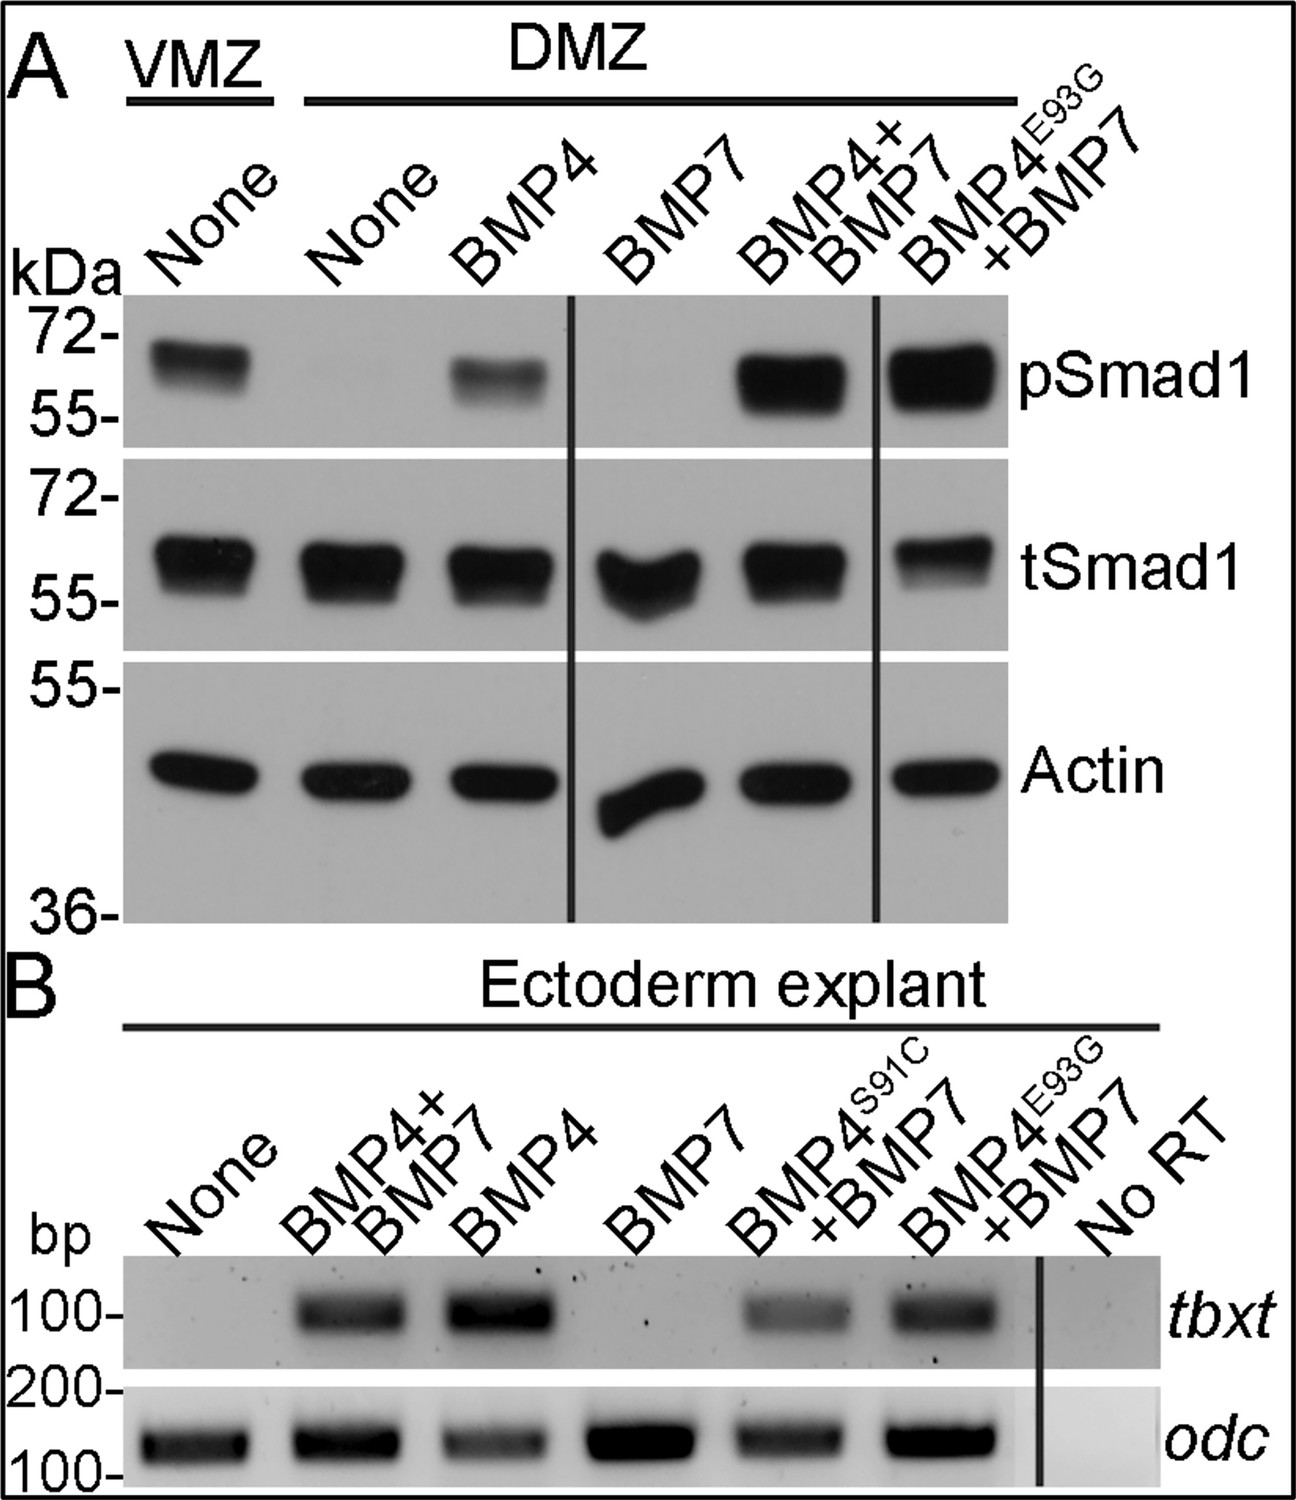
Point mutations predicted to interfere with phosphorylation of the BMP4 prodomain do not interfere with BMP4/7 heterodimer activity.
(A) RNA encoding wild type BMP4 or BMP7 alone (25 pg), or one half dose wild type or point mutant BMP4 together with BMP7 (12.5 pg each) were injected near the dorsal marginal zone (DMZ) of 4-cell embryos. DMZ and ventral marginal zone (VMZ) explants were isolated at stage 10 and pSmad1 levels were analyzed by immunoblot. Duplicate blots were probed with actin as a loading control. (B) RNA encoding wild type BMP4 or BMP7 alone (25 pg), or one half dose wild type or point mutant forms of BMP4 together with BMP7 (12.5 pg each) were injected near the animal pole of two-cell embryos. Ectodermal explants were isolated at stage 10 and tbxt levels were analyzed by semi-quantitative RT-PCR. Black bars indicate where a non-relevant intervening lane was removed using photoshop.
-
Figure 1—figure supplement 2—source data 1
TIFF files containing original western blots for Figure 1—figure supplement 2A, indicating the relevant bands and genotypes.
- https://cdn.elifesciences.org/articles/105018/elife-105018-fig1-figsupp2-data1-v1.zip
-
Figure 1—figure supplement 2—source data 2
TIFF files containing original western blots for Figure 1—figure supplement 2A.
- https://cdn.elifesciences.org/articles/105018/elife-105018-fig1-figsupp2-data2-v1.zip
-
Figure 1—figure supplement 2—source data 3
TIFF files containing original PCR scans for Figure 1—figure supplement 2, indicating the relevant bands and injected RNAs.
- https://cdn.elifesciences.org/articles/105018/elife-105018-fig1-figsupp2-data3-v1.zip
-
Figure 1—figure supplement 2—source data 4
TIFF files containing original PCR scans for Figure 1—figure supplement 2.
- https://cdn.elifesciences.org/articles/105018/elife-105018-fig1-figsupp2-data4-v1.zip
Figure 2 with 1 supplement
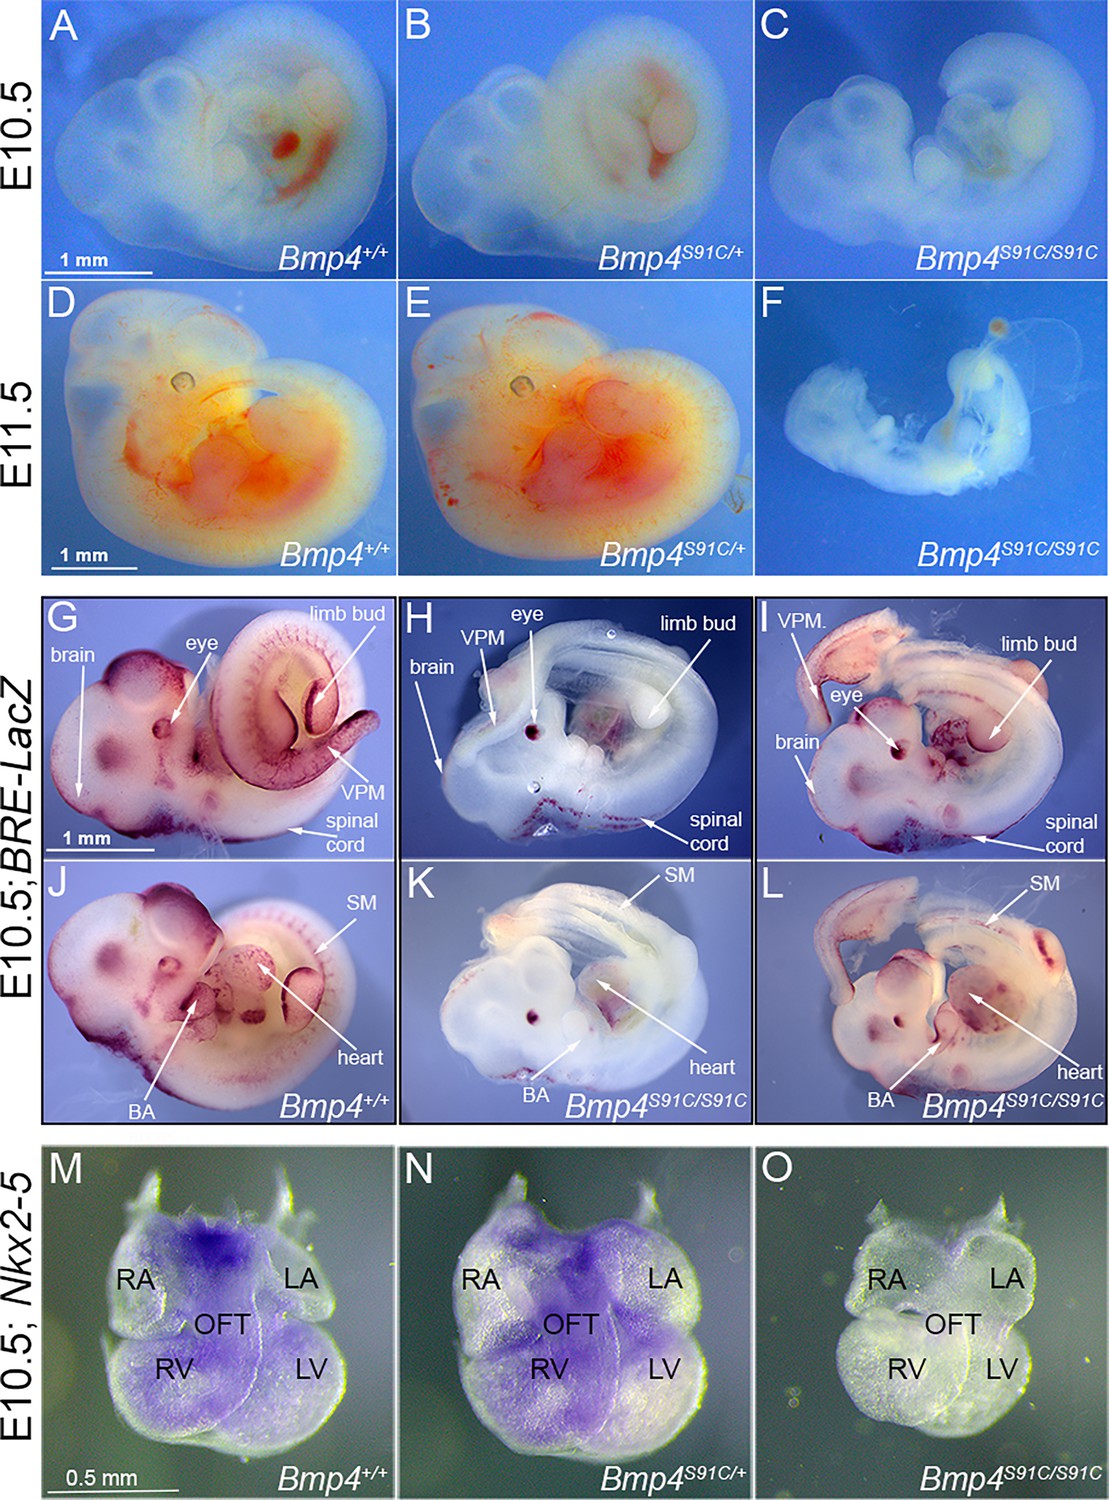
Bmp4S91C homozygotes die during mid-embryogenesis and show reduced BMP activity in multiple tissues (A–F).
Photograph of E10.5 or E11.5 wild type (A, D) or mutant (B, C, E, F) littermates. Scale bars in panels A and D apply across each row. (G–J) E10.5 wild type (G, J) or Bmp4S91C/S91C mutant littermates (H, I, K, L) carrying a BRE-LacZ transgene were stained for β-galactosidase activity to detect endogenous BMP pathway activation. (G–I) show right side and (J–L) the left side of the same embryos. Embryos from a single litter were stained for an identical time under identical conditions. A minimum of three embryos of each genotype were examined and results shown were reproduced in all. VPM: ventral posterior mesoderm, BA: branchial arches, SM: somitic mesoderm. Scale bar corresponds to 1 mm in all panels. Expression of Nkx2.5 was analyzed by whole mount in situ hybridization in E10.5 wild type (M) and mutant (N, O) littermates. Photographs of hearts dissected free of embryos are shown. Scale bar in M applies across the row. RA: right atrium, LA: left atrium, RV: right ventricle, LV: left ventricle, OFT: outflow tract.
Figure 2—figure supplement 1
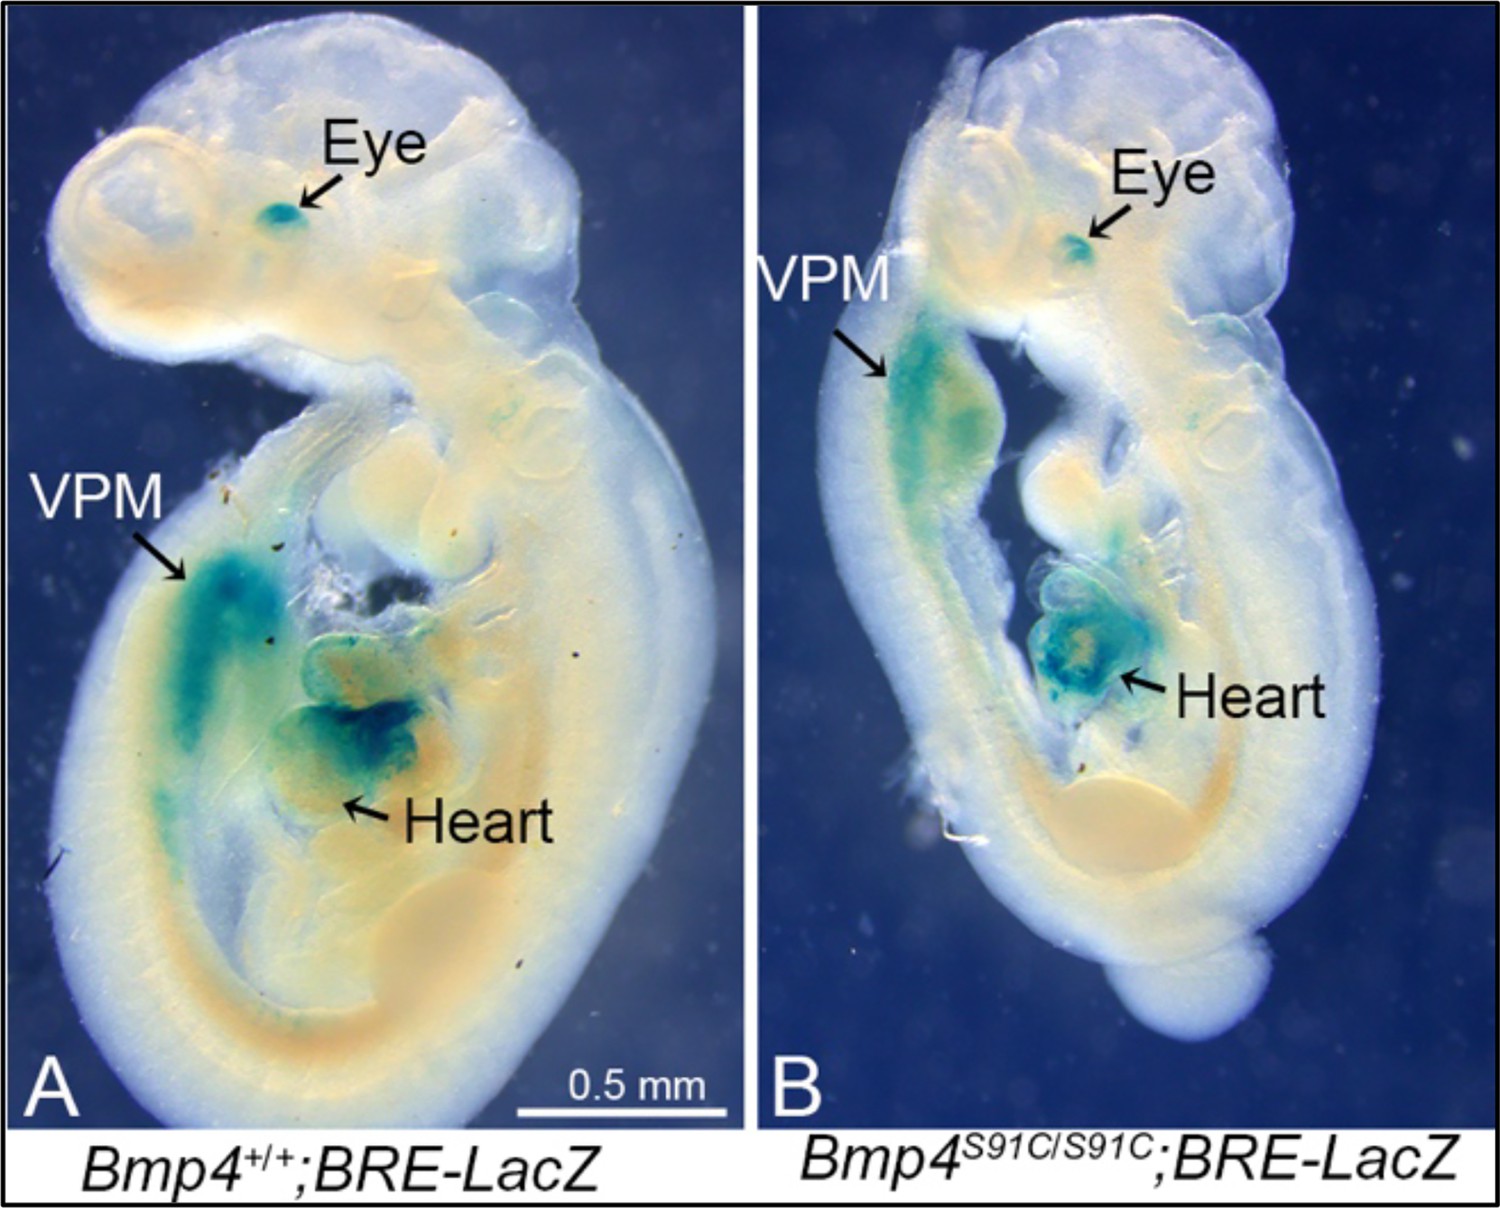
Bmp4S91C homozygotes show reduced BMP activity in the heart and ventral posterior mesoderm at E9.5.
(A, B) E9.5 wild type (A) or Bmp4S91C/S91C mutant littermates (B) carrying a BRE-LacZ transgene were stained for ß-galactosidase activity to detect endogenous BMP pathway activation. Embryos from the same litter were stained for an identical time under identical conditions. Three embryos of each genotype were examined and results shown were reproduced. VPM; ventral posterior mesoderm.
Figure 3
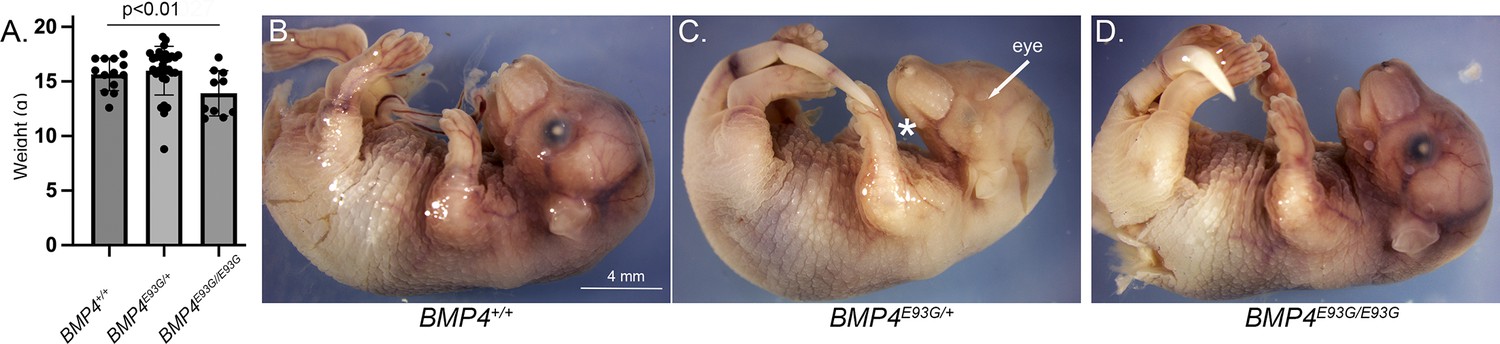
Bmp4E93G homozygotes are smaller than wild type littermates and a subset of mutants have eye and/or craniofacial defects.
(A) Weights of male wild type and Bmp4E93G heterozygous and homozygous mutant littermates at P28 (mean ± SD, data analyzed using an unpaired t-test). (B–D) Photographs of E17.5 wild type and mutant littermates. A subset of Bmp4E93G heterozygotes show craniofacial defects such as a small mandible (asterisk) and small or absent eyes (arrow) at low frequency (n = 1/12).
Figure 4
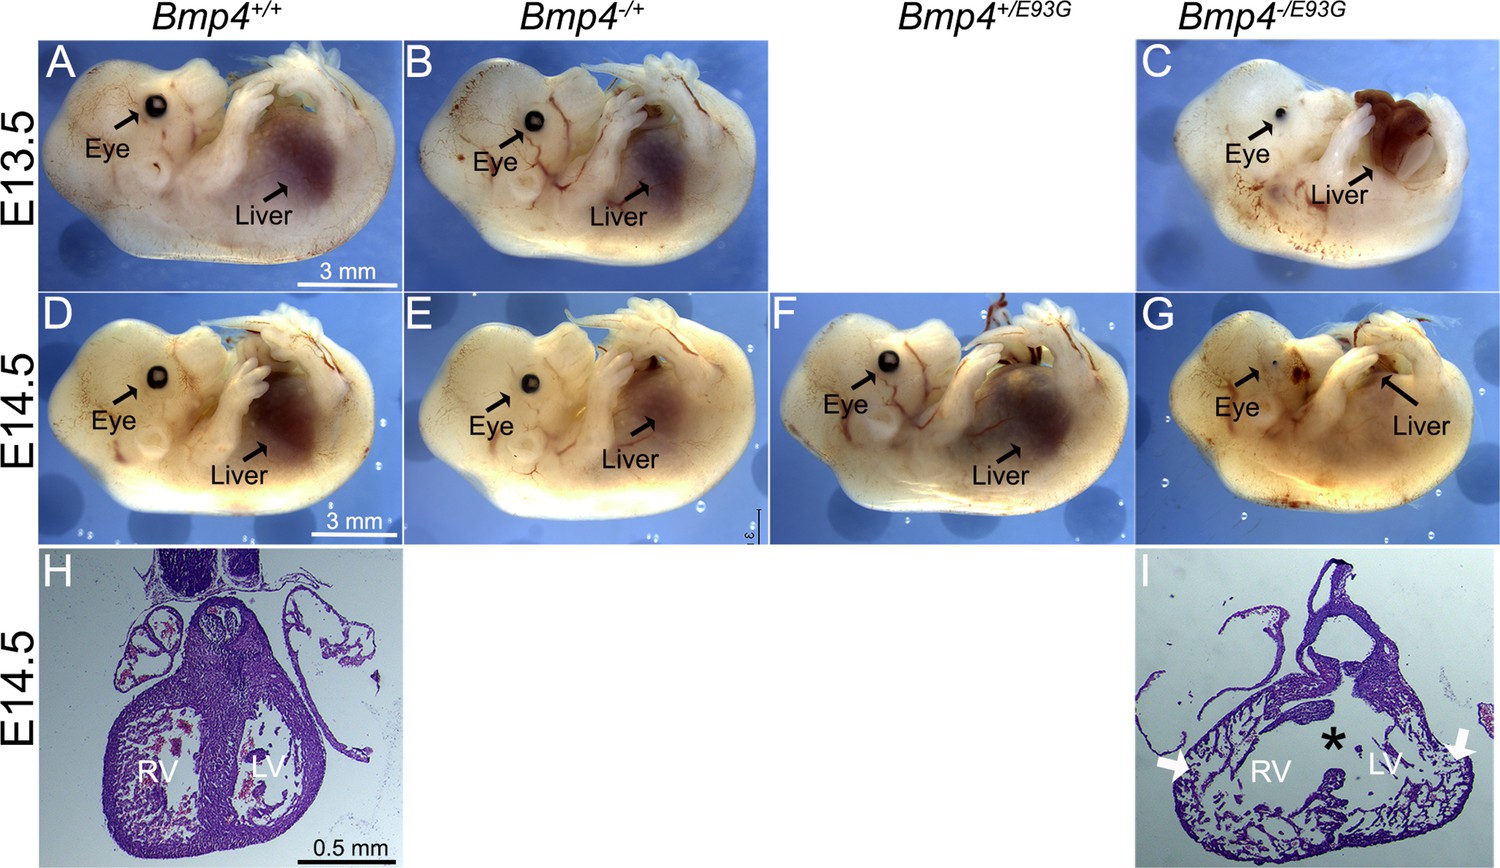
Bmp4−/E93G mutants die during embryogenesis with defects in ventral body wall closure, small or absent eyes and heart defects.
Photographs of E13.5 (A–C) or E14.5 (D–G) wild type (A, D) or mutant (B, C, E–G) littermates. The position of the liver inside (A–F) or outside (C, G) of the abdomen is indicated. Hematoxylin and eosin-stained coronal sections of hearts dissected from E14.5 wild type (H) or Bmp4−/E93G littermates (I). Asterisk denotes ventricular septal defect and arrowheads indicate thin, non-compacted ventricular wall (I). Scale bar applies across each row.
-
Figure 4—source data 1
TIFF files containing original western blots for Figure 1D, indicating the relevant bands, explants and deleted lane.
- https://cdn.elifesciences.org/articles/105018/elife-105018-fig4-data1-v1.zip
Figure 5
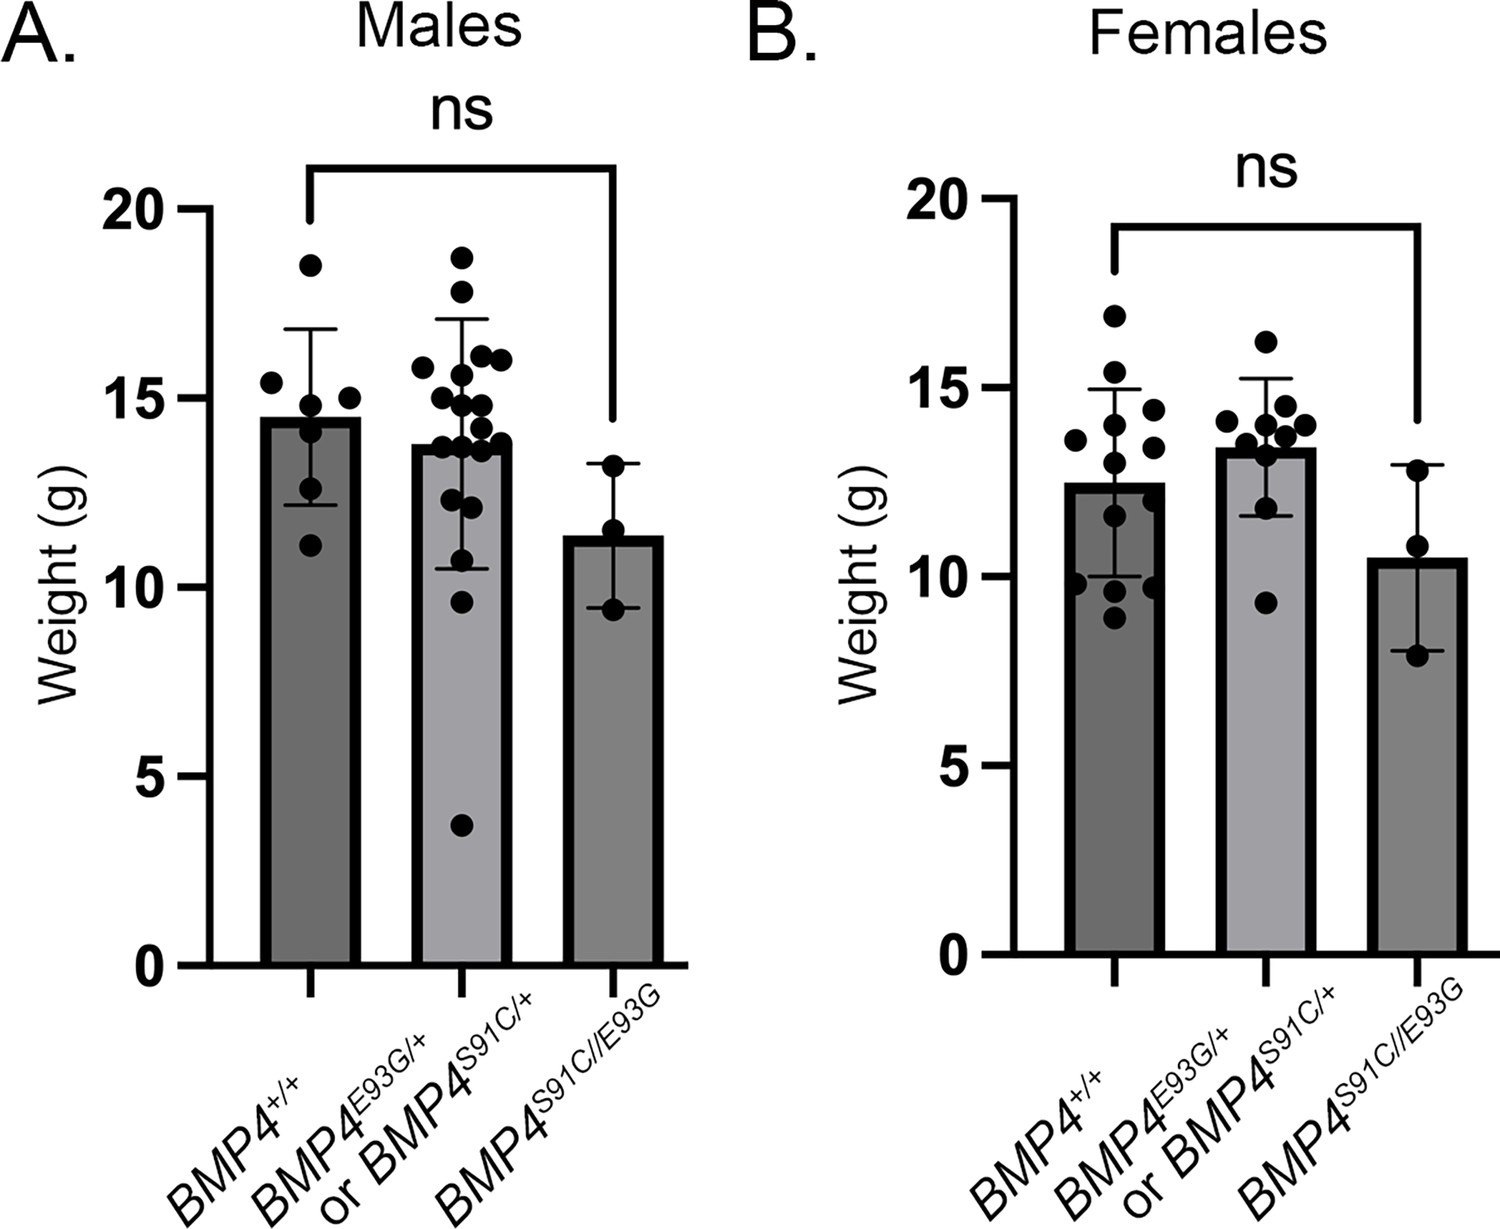
Bmp4S91C/E93G compound heterozygotes are slightly smaller than heterozygous or wild type littermates.
Weights of male (A) and female (B) wild type, heterozygous and compound heterozygous mutant littermates at P28 (mean ± SD, data analyzed using an unpaired t-test). Genotyping protocol does not distinguish between the Bmp4S91C/+ or Bmp4E9G3G/+ allele and thus weights of Bmp4S91C/+ or Bmp4E9G3G/+ heterozygotes are reported together.
Figure 6 with 1 supplement
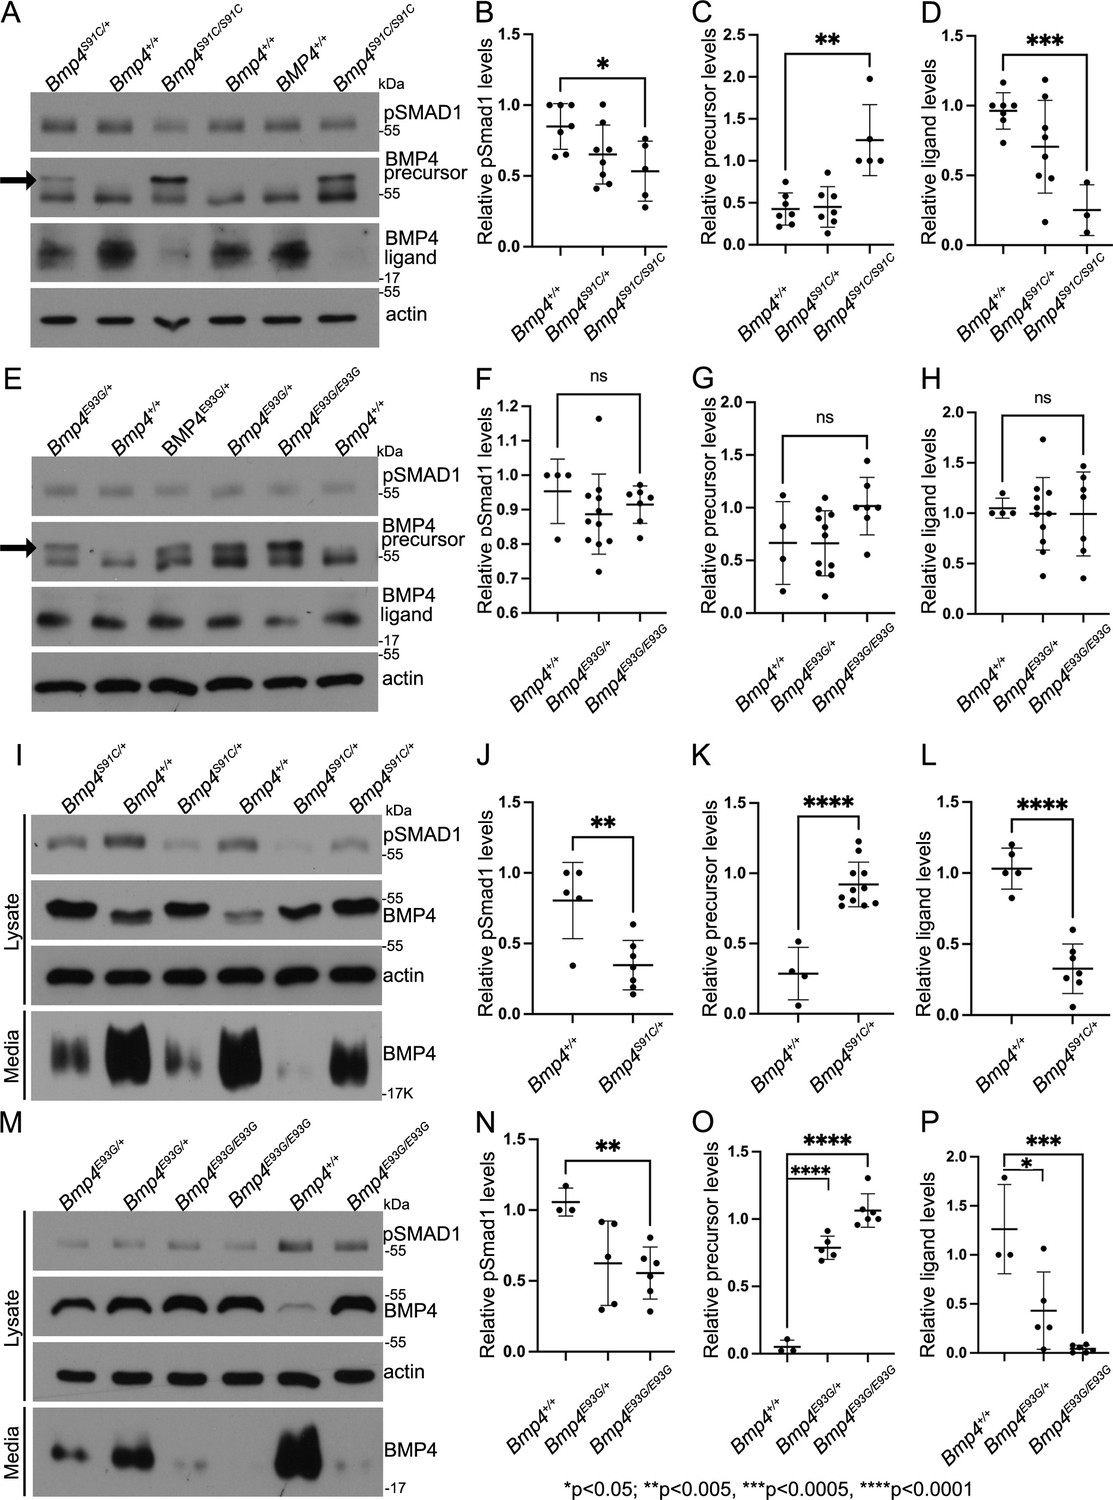
E93G and S91C mutations lead to accumulation of BMP4 precursor protein and reduced levels of cleaved ligand and pSmad1 in vivo.
Levels of pSmad1 and BMP4 were analyzed in protein lysates isolated from E10.5 Bmp4S91C (A–D) or Bmp4E93G (E–H) homozygotes, heterozygotes, or wild type littermates. Arrows in panels A and E denote a more slowly migrating BMP4 precursor protein band detected in lysates from mutant, but not wild type embryos. (I–P) Levels of pSmad1, BMP4 precursor protein, and cleaved BMP4 ligand were analyzed in cell lysates and conditioned media of mouse embryonic fibroblasts (MEFs) isolated from E13.5 Bmp4S91C heterozygotes or wild type littermates (I–L) or from Bmp4E93G homozygotes, heterozygotes, or wild type littermates (M–P). Representative blots (A, E, I, K) and quantitation of protein levels normalized to actin (mean ± SD, data analyzed using an unpaired t-test) (B–D, F–H, J–L, N, O) are shown.
-
Figure 6—source data 1
TIFF files containing original western blots for Figure 6A, indicating the relevant bands and genotypes.
- https://cdn.elifesciences.org/articles/105018/elife-105018-fig6-data1-v1.zip
-
Figure 6—source data 2
TIFF files containing original western blots for Figure 6A.
- https://cdn.elifesciences.org/articles/105018/elife-105018-fig6-data2-v1.zip
-
Figure 6—source data 3
TIFF files containing original western blots for Figure 6E, indicating the relevant bands and genotypes.
- https://cdn.elifesciences.org/articles/105018/elife-105018-fig6-data3-v1.zip
-
Figure 6—source data 4
TIFF files containing original western blots for Figure 6E.
- https://cdn.elifesciences.org/articles/105018/elife-105018-fig6-data4-v1.zip
-
Figure 6—source data 5
TIFF files containing original western blots for Figure 6I, indicating the relevant bands and genotypes.
- https://cdn.elifesciences.org/articles/105018/elife-105018-fig6-data5-v1.zip
-
Figure 6—source data 6
TIFF files containing original western blots for Figure 6I.
- https://cdn.elifesciences.org/articles/105018/elife-105018-fig6-data6-v1.zip
-
Figure 6—source data 7
TIFF files containing original western blots for Figure 6M, indicating the relevant bands and genotypes.
- https://cdn.elifesciences.org/articles/105018/elife-105018-fig6-data7-v1.zip
-
Figure 6—source data 8
TIFF files containing original western blots for Figure 6M.
- https://cdn.elifesciences.org/articles/105018/elife-105018-fig6-data8-v1.zip
Figure 6—figure supplement 1
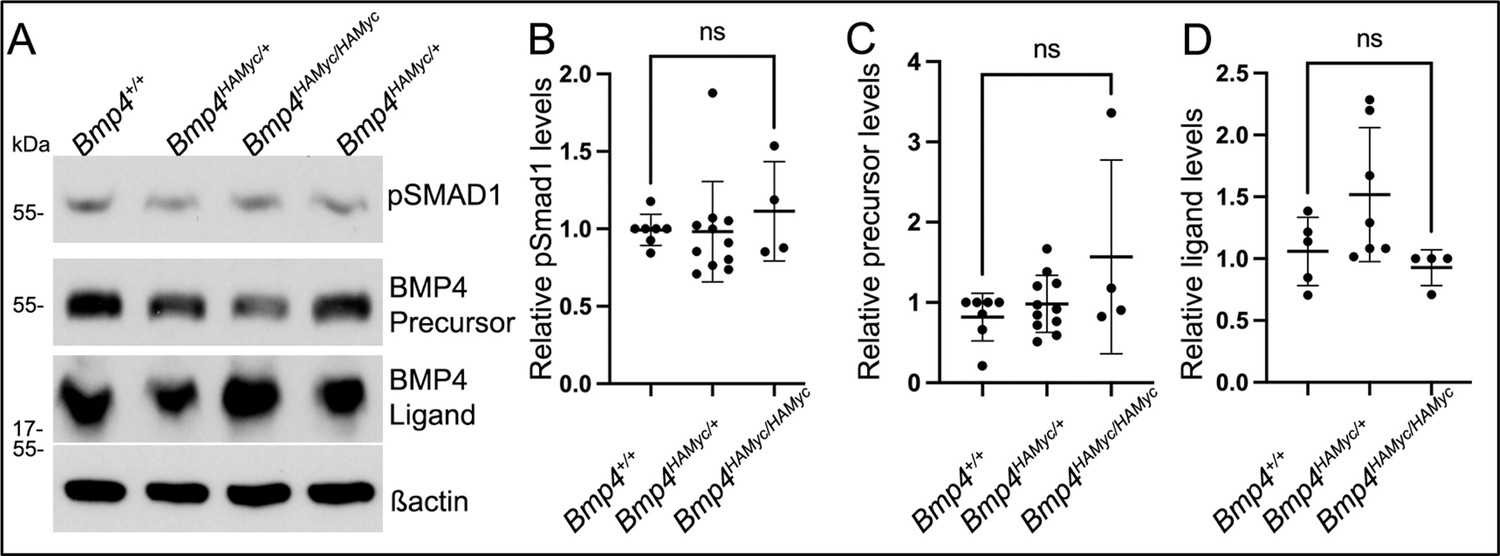
Levels of BMP4 precursor protein, cleaved ligand and pSMAD1 are unchanged in MEFs isolated from Bmp4+/+ embryos carrying epitope tags relative to untagged littermates.
(A-D) Levels of pSMAD1, BMP4 precursor protein or cleaved BMP4 ligand were analyzed in MEFs isolated from Bmp4HAMyc embryos or wild type littermates at E13.5. A representative blot (A) and quantitation of protein levels normalized to actin (mean +/- SD) (B-D) are shown.
-
Figure 6—figure supplement 1—source data 1
TIFF files containing original western blots for Figure 6—figure supplement 1A, indicating the relevant bands and genotypes.
- https://cdn.elifesciences.org/articles/105018/elife-105018-fig6-figsupp1-data1-v1.zip
-
Figure 6—figure supplement 1—source data 2
TIFF files containing original western blots for Figure 6—figure supplement 1A.
- https://cdn.elifesciences.org/articles/105018/elife-105018-fig6-figsupp1-data2-v1.zip
Figure 7
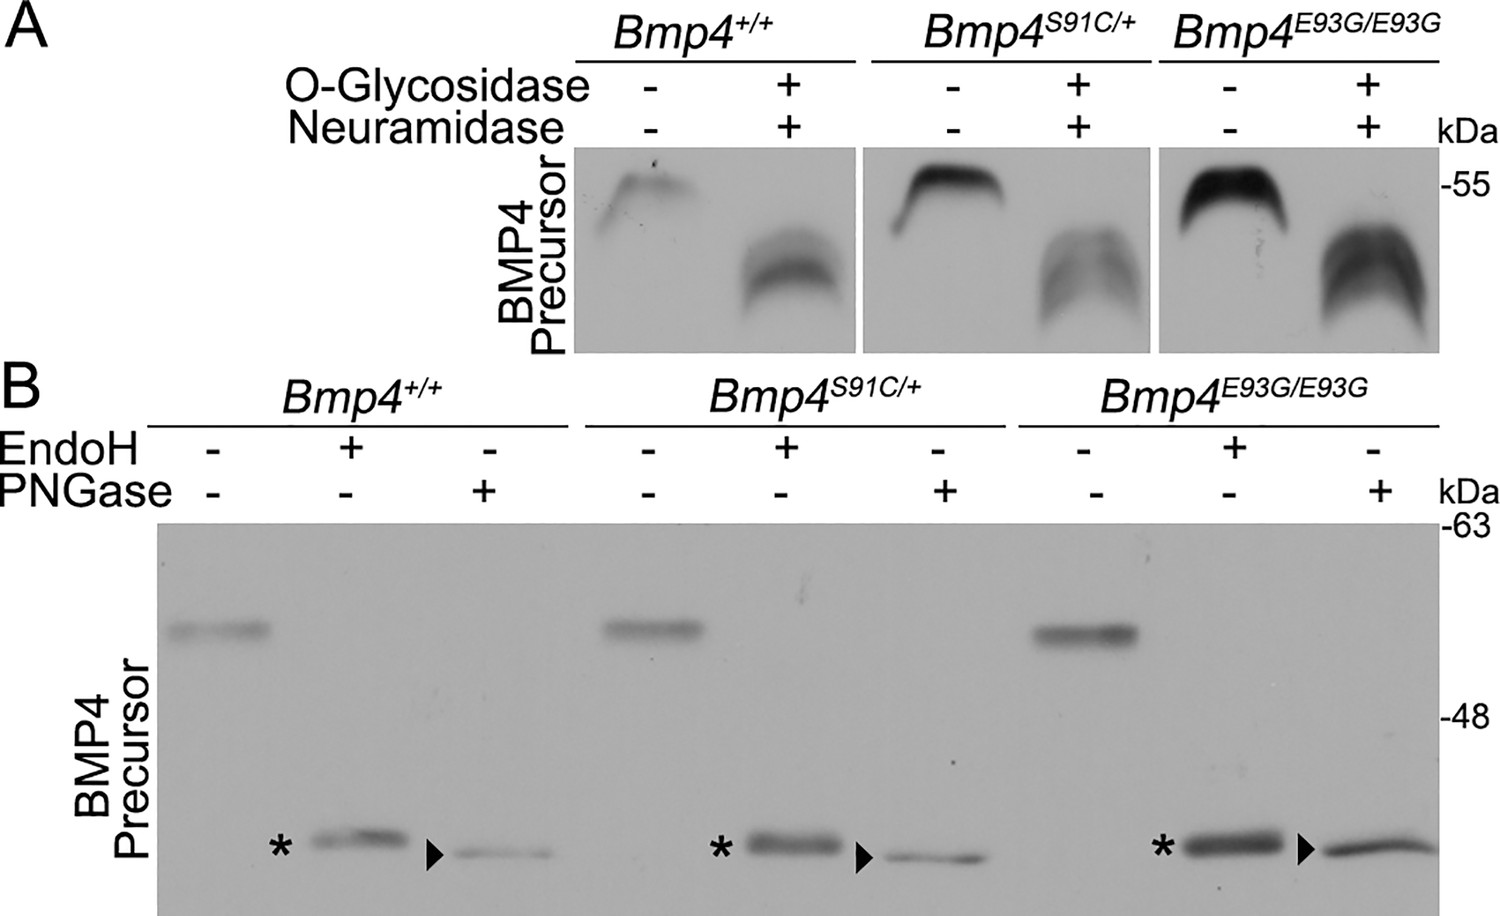
BMP4E93G and BMP4S91C precursor proteins are O- and N-glycosylated and exit the ER.
(A, B) Mouse embryonic fibroblasts (MEFs) were isolated from E13.5 Bmp4S91C heterozygotes, Bmp4E93G homozygotes, or wild type littermates. Protein lysates were left untreated or were treated with O-glycosidase and α-neuraminidase to remove O-linked glycosylation (A) or with EndoH or PNGase to remove N-linked glycosylation (B). Immunoblots were probed with antibodies directed against BMP4 to detect BMP4 precursor protein. Bands corresponding to Endo H-sensitive (asterisks) and Endo H-resistant PNGase-sensitive BMP4 (arrowheads) are indicated in B.
-
Figure 7—source data 1
TIFF files containing original western blots for Figure 7A, indicating the relevant bands and genotypes.
- https://cdn.elifesciences.org/articles/105018/elife-105018-fig7-data1-v1.zip
-
Figure 7—source data 2
TIFF files containing original western blots for Figure 7A.
- https://cdn.elifesciences.org/articles/105018/elife-105018-fig7-data2-v1.zip
-
Figure 7—source data 3
TIFF files containing original western blots for Figure 7B, indicating the relevant bands and genotypes.
- https://cdn.elifesciences.org/articles/105018/elife-105018-fig7-data3-v1.zip
-
Figure 7—source data 4
TIFF files containing original western blots for Figure 7B.
- https://cdn.elifesciences.org/articles/105018/elife-105018-fig7-data4-v1.zip
Figure 8 with 1 supplement
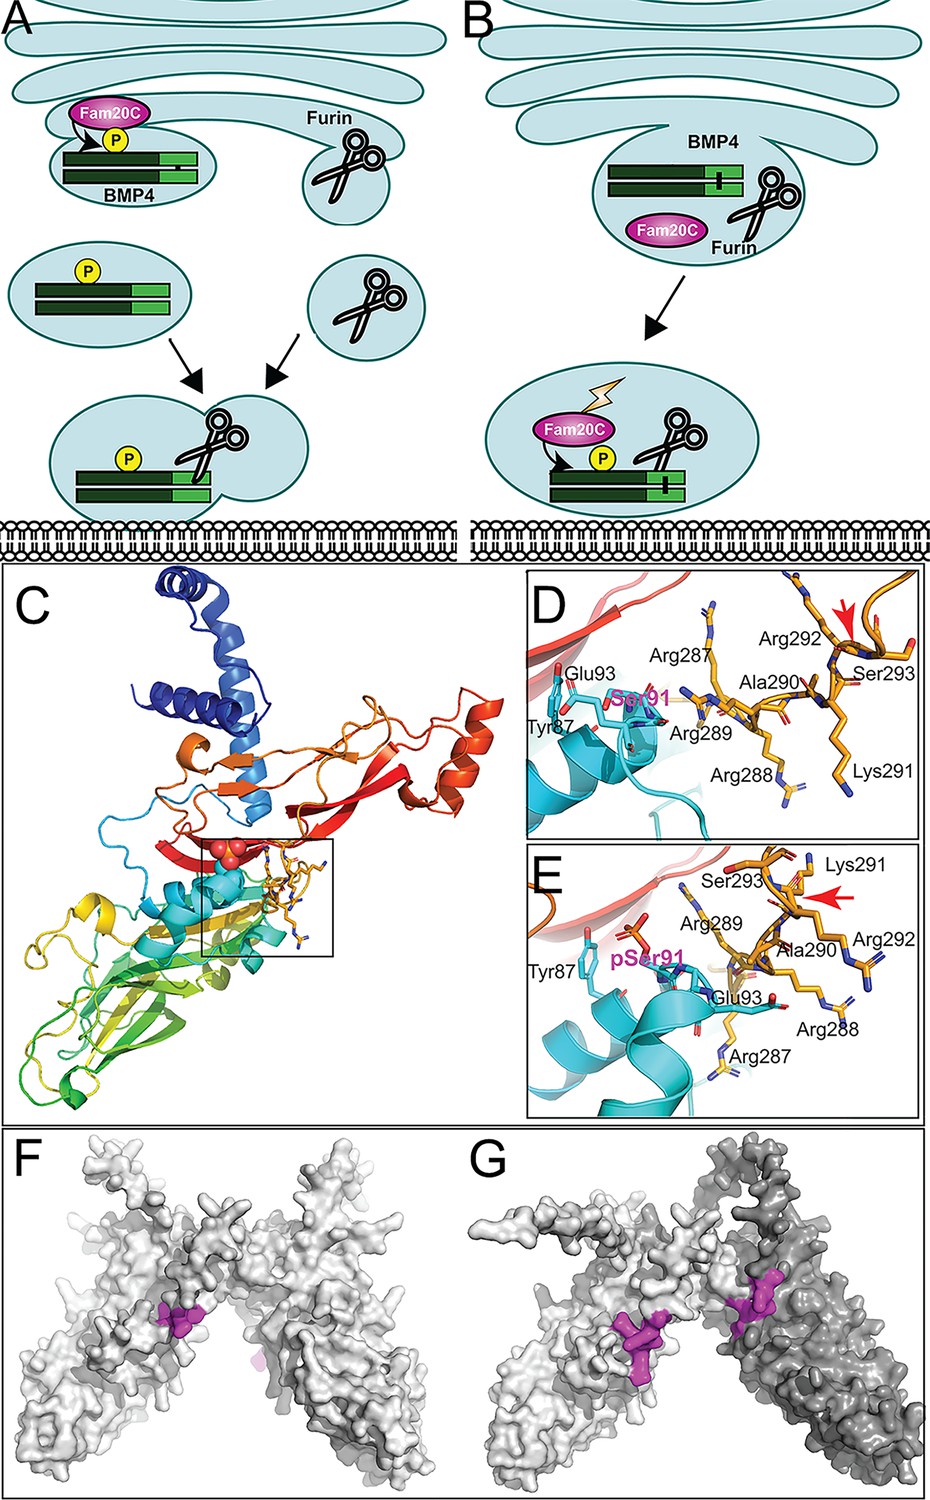
Hypothetical models for how prodomain phosphorylation regulates proteolytic maturation of BMP4.
(A) Model 1: Phosphorylation of BMP4 by Fam20C within the trans-Golgi network (TGN) directs subcellular trafficking of BMP4 out of the Golgi to the cell surface via a route that is distinct from the pathway taken by furin. Furin- and BMP4-containing vesicles fuse in a region adjacent to the cell surface where furin cleaves BMP4 to release the active ligand. (B) Model 2: Fam20C, BMP4, and furin traffic together to a membrane proximal subcellular compartment where Fam20C becomes catalytically activated (lightning bolt) and phosphorylates the prodomain of BMP4. Phosphorylation enables furin to access and cleave the consensus motif on BMP4. (C) Structure of BMP4 precursor monomer predicted by alphafold. N-terminus in blue, C-terminus in red. Boxed region includes Ser91 and the furin consensus motif. Close up of boxed region in C illustrating the close proximity between Ser91 (pink letters) within the prodomain in its unphosphorylated (D) or phosphorylated (E) form and the -R287-R-R-A-K-R292 furin consensus motif at the C-terminus of the prodomain. Red arrows indicate the site of furin cleavage. Spacefill representation of the of the structures of BMP4 precursor protein homodimers (F) or BMP4 (light gray) and BMP7 (dark gray) precursor protein heterodimers (G) predicted by alphafold with the location of furin recognition motifs denoted in purple.
Figure 8—figure supplement 1
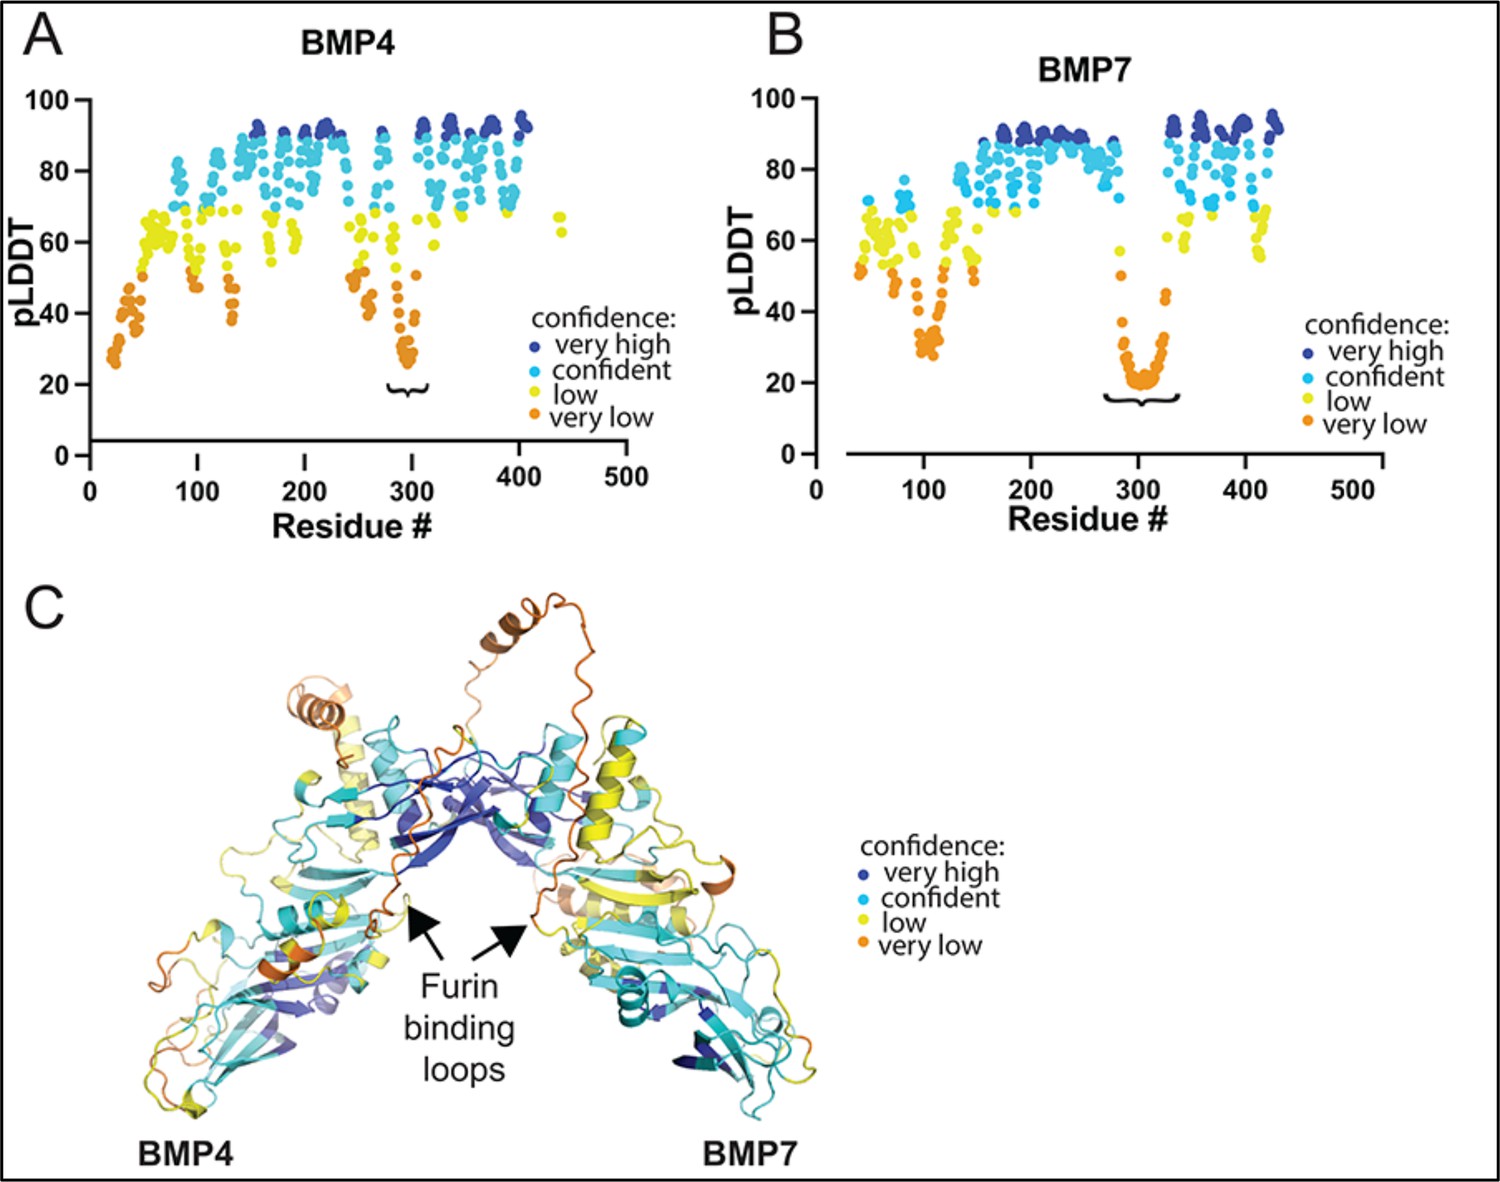
Relative confidence in structural predictions across different regions of BMP4 and BMP7 precursor proteins.
(A-C) Bmp4 and Bmp7 precursor proteins were modeled in Alphafoldserver.com (version 3). Representative predictions are shown colored according to relative confidence (pLDDT) at the level of amino acid residues from N- to C-terminus in BMP4 (A) and BMP7 (B) monomers and in the predicted structure of BMP4/7 heterodimers (C). The furin binding motifs (denoted by “} “in A, B; arrows in C) lie within a poorly predicted region, but the location of that region with respect to the overall structure is reproducible across multiple types of predictions (homodimer, heterodimer, pSer-modified dimers).
Tables
Table 1
Progeny from Bmp4S91C/+ or Bmp4E93G/+ intercrosses, or from Bmp4−/+ and Bmp4E93G/+ crosses at P28.
| A. Progeny from Bmp4S91C/+ intercrosses | ||||||
|---|---|---|---|---|---|---|
| Sex | Bmp4+/+ | Bmp4S91C/+ | Bmp4S91C/S91C | n | p | |
| Both | 12 (14) | 44 (28) | 0 (14) | 56 | 1E−05 | |
| Male | 7 (8) | 23 (15) | 0 (8) | 30 | 0.0027 | |
| Female | 6 (7) | 20 (13) | 0 (7) | 26 | 0.0034 | |
| B. Progeny from Bmp4E93G/+ intercrosses | ||||||
| Sex | Bmp4+/+ | Bmp4E9G3G/+ | Bmp4E93G/E93G | n | p | |
| Both | 35 (31) | 74 (63) | 16 (31) | 125 | 0.007 | |
| Male | 19 (16) | 31 (31) | 12 (16) | 62 | 0.454 | |
| Female | 17 (16) | 44 (32) | 4 (16) | 63 | 0.002 | |
| C. Progeny from Bmp4−/+ × Bmp4E93G/+ crosses | ||||||
| Sex | Bmp4+/+ | Bmp4E9G3G/+ | Bmp4−/+ | Bmp4E93G/− | n | p |
| Both | 22 (15) | 22 (15) | 17 (15) | 0 (15) | 61 | 1E−04 |
| Male | 10 (8) | 9 (8) | 11 (8) | 0 (8) | 30 | 0.016 |
| Female | 13 (8) | 11 (8) | 7 (8) | 0 (8) | 31 | 0.005 |
| D. Progeny from Bmp4S91C/+ × Bmp4E93G/+ crosses | ||||||
| Sex | Bmp4+/+ | *Bmp4S91C/+ or Bmp4E9G3G/+ | Bmp4ES91C/E93G | n | p | |
| Both | 23 (17) | 39 (34) | 7 (17) | 69 | 0.014 | |
| Male | 9 (9) | 23 (18) | 4 (9) | 36 | 0.125 | |
| Female | 14 (8) | 6 (17) | 3 (8) | 33 | 0.025 | |
-
(A–D) Numbers of observed and expected (in parenthesis) mice of each genotype listed in the top row are indicated. Genotypes reported at P28. The p value is based on X2 test.
-
(D) *Genotyping protocol does not distinguish between Bmp4S91C/+ or Bmp4E9G3G/+ alleles and thus heterozygotes are pooled.
Table 2
Progeny from Bmp4S91C/+ intercrosses, or from Bmp4−/+ and Bmp4E93G/+ intercrosses at embryonic ages.
| A. Progeny from Bmp4S91C/+ intercrosses | ||||||
|---|---|---|---|---|---|---|
| Age | Bmp4+/+ | Bmp4S91C/+ | Bmp4S91C/S91C | n | p | |
| E13.5 | 22 (19) | 55 (39) | 0 (19) | 77 | 1E−05 | |
| E11.5 | 21 (14) | 35 (28) | 0 (14) | 56 | 2E−04 | |
| E10.5 | 43 (51) | 18 (102) | 43 (51) | 204 | 0.211 | |
| E9.5 | 7 (12) | 31 (24) | 9 (12) | 47 | 0.084 | |
| B. Progeny from Bmp4E93G/+ × Bmp4−/+ crosses | ||||||
| Age | Bmp4+/+ | Bmp4E93G/+ | Bmp4−/+ | Bmp4−/E93G | n | p |
| E13.5–14.5 | 17 (17) | 13 (17) | 19 (17) | 17 (17) | 66 | 0.77 |
| E11.5–12.5 | 11 (10) | 4 (10) | 12 (10) | 14 (10) | 41 | 0.14 |
| E10.5 | 7 (7) | 10 (7) | 7 (7) | 5 (7) | 29 | 0.62 |
-
(A, B) Numbers of observed and expected (in parenthesis) embryos of each genotype listed in the top row are indicated. The p value is based on X2 test.
Key resources table
| Reagent type (species) or resource | Designation | Source or reference | Identifiers | Additional information |
|---|---|---|---|---|
| Genetic reagent (M. musculus) | Bmp4−/+ | PMID:10049358 | RRID:MGI:2158495 | Dr. Brigid Hogan (Duke University) |
| Genetic reagent (M. musculus) | BRE-LacZ | PMID:15331632 | Dr. Christine Mummery (Leiden University) | |
| Genetic reagent (M. musculus) | Bmp4S91C | This paper | Generated using CRISPR–Cas9 technology | |
| Genetic reagent (M. musculus) | Bmp4E93G | This paper | Generated using CRISPR–Cas9 technology | |
| Recombinant DNA reagent | CS2+mouse BMP4HAMyc | PMID:15356272 | Catherine Degnin (Oregon Health and Science University) | |
| Recombinant DNA reagent | CS2+mouse BMP7Flag | PMCID:PMC6785266 | Hyungseok Kim (University of Utah) | |
| Recombinant DNA reagent | CS2+mouse BMP4HAMycS91C | This paper | Site-directed mutagenesis (Agilent) | |
| Recombinant DNA reagent | CS2+mouse BMP4HAMycS91D | This paper | Site-directed mutagenesis (Agilent) | |
| Recombinant DNA reagent | CS2+mouse BMP4HAMycE93G | This paper | Site-directed mutagenesis (Agilent) | |
| Antibody | Rabbit polyclonal anti-pSmad1/5 | Cell Signaling, Cat. #9511S | RRID:AB_491015 | WB (1:1000) |
| Antibody | Mouse monoclonal anti-BMP4 | Santa Cruz | RRID:AB_2063534 | WB (1:1000) |
| Antibody | Rabbit polyclonal anti-beta actin | Sigma | RRID:AB_476693 | WB (1:10,000) |
| Antibody | HRP-conjugated anti-rabbit polyclonal IgG | Jackson Immuno Research | Cat. # 111-035-144 | WB (1:10,000) |
| Antibody | HRP-conjugated anti-mouse polyclonal IgG2b | Jackson Immuno Research | Cat. # 115-035-207 | WB (1:10,000) |
| Commercial assay or kit | Pierce ECL western blotting substrate | Fisher | Cat. # 32209 | |
| Commercial assay or kit | BCA Protein Assay Kit | Fisher | Cat. # 23225 | |
| Chemical compound, drug | Halt protein and phosphatase inhibitor | Fisher | Cat. # 78442 | |
| Commercial assay or kit | QuickChange II XL site-directed mutagenesis kit | Agilent | Cat. # 20052 |
Additional files
-
Supplementary file 1
Progeny from Bmp4S91C/+ intercrosses at embryonic stages by sex.
- https://cdn.elifesciences.org/articles/105018/elife-105018-supp1-v1.docx
-
Supplementary file 2
Progeny from Bmp4E93G/+ x Bmp4-/+ crosses at embryonic stages by sex.
- https://cdn.elifesciences.org/articles/105018/elife-105018-supp2-v1.docx
-
Supplementary file 3
Primers used for PCR.
- https://cdn.elifesciences.org/articles/105018/elife-105018-supp3-v1.docx
-
MDAR checklist
- https://cdn.elifesciences.org/articles/105018/elife-105018-mdarchecklist1-v1.docx
Download links
A two-part list of links to download the article, or parts of the article, in various formats.
Downloads (link to download the article as PDF)
Open citations (links to open the citations from this article in various online reference manager services)
Cite this article (links to download the citations from this article in formats compatible with various reference manager tools)
Mutations that prevent phosphorylation of the BMP4 prodomain impair proteolytic maturation of homodimers leading to lethality in mice
eLife 14:RP105018.
https://doi.org/10.7554/eLife.105018.4


