The primary σ factor in Escherichia coli can access the transcription elongation complex from solution in vivo
- Harvard Medical School, United States
- Rutgers University, United States
Figures
Figure 1

σ70 trans loading on a σ70-dependent transcription unit in vivo (MG1655).
(A) Top: schematic of DNA template carrying λPR', transcribed-region consensus extended –10 element (wild-type or mutant) and terminator (see ‘Materials and methods’ for the λPR′ promoter sequence). Transcribed-region sequences that are complementary to the LNA probe are underlined (grey bar) and the positions corresponding to pause sites are indicated. middle Analysis of RNA transcripts in vivo by LNA probe-hybridization. RNA was isolated from MG1655 cells harvested at an OD600 of 0.8–1.0 (see ‘Materials and methods’). Pausing is quantified by dividing the signal in the ∼35-nt pause RNA band by the sum of this signal and the signal in the terminated (full-length) band; this ratio is expressed as a percentage (relative abundance). Mean and SEM of six independent measurements are shown. Asterisks (*) designate values that were too low (<approximately threefold above background) for accurate quantification. M, 10-nt RNA ladder. bottom Analysis of σ70 levels by Western blot. Amount of soluble σ70 is normalized to the amount in cells carrying the experimental template (wt) and a vector that does not direct σ70 over-production. Mean and SEM of three independent measurements are shown. (B) Top: schematic of DNA template carrying λPR′, initial-transcribed-region σ70-dependent pause element, transcribed-region consensus −10 element and terminator. middle Analysis of RNA transcripts in vivo by locked-nucleic-acid (LNA) probe-hybridization, as in panel A. bottom Analysis of σ70 levels by Western blot.
Figure 2
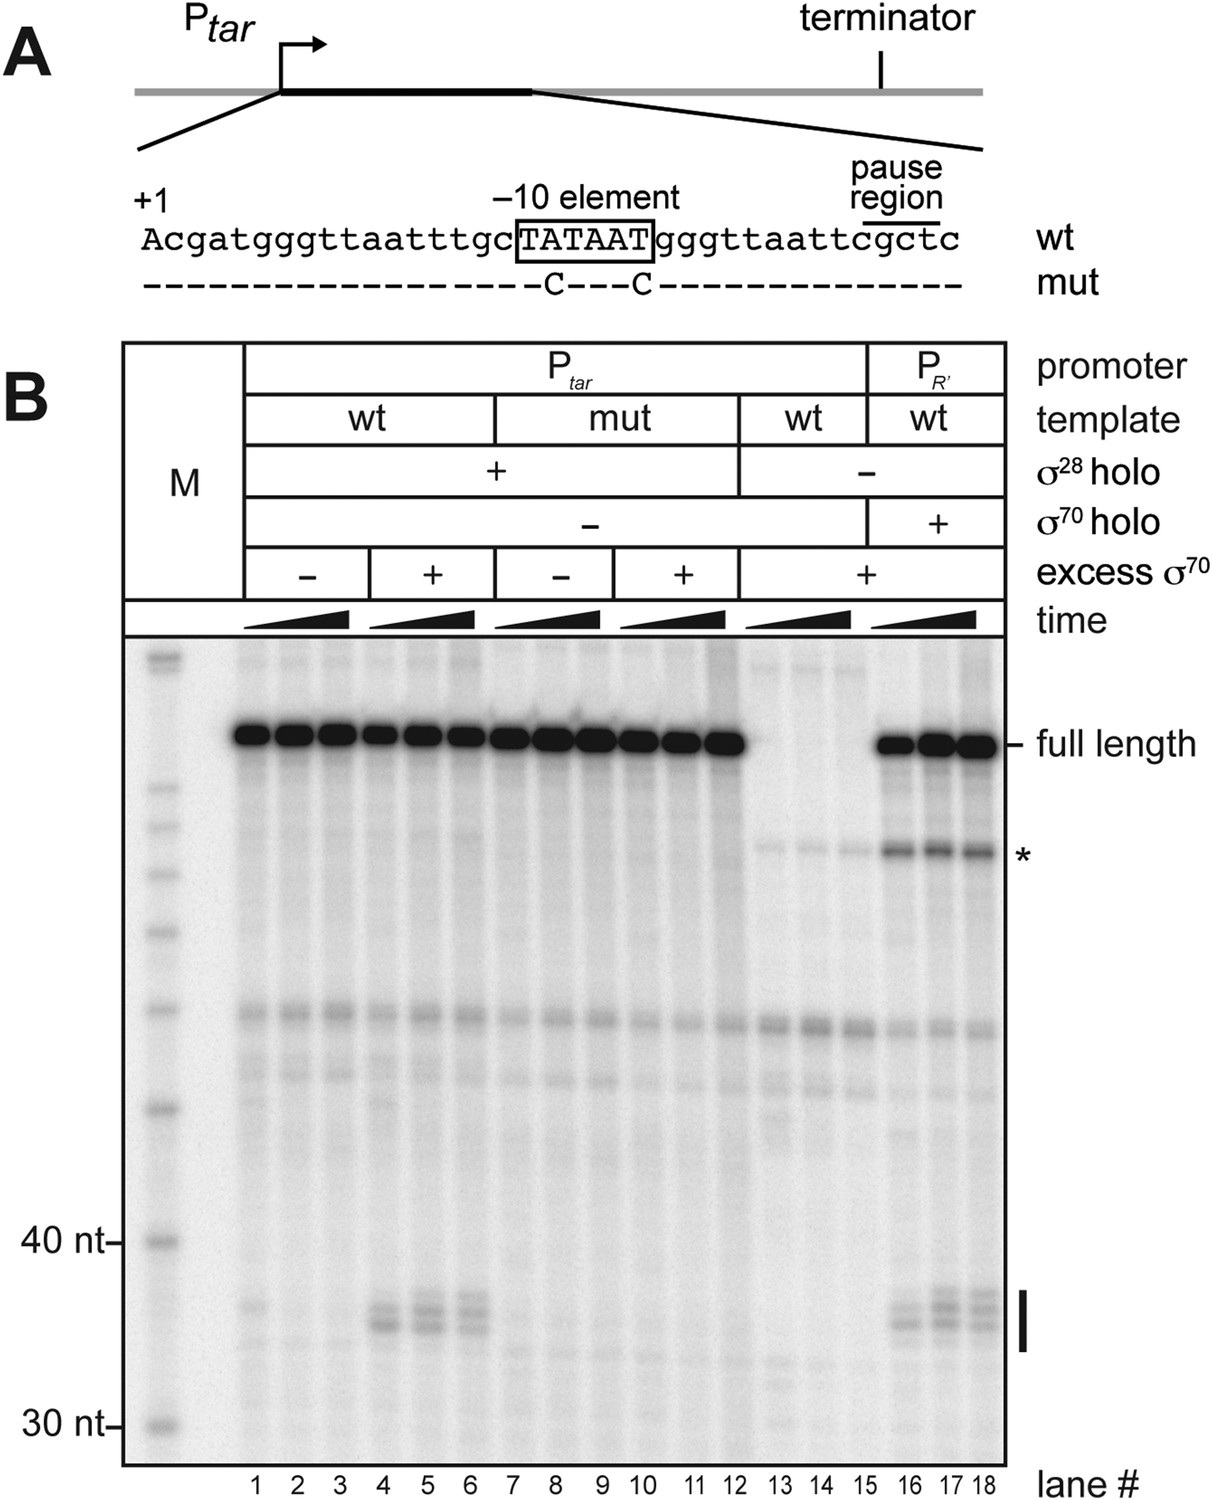
σ70 trans loading on a σ28-dependent transcription unit in vitro.
(A). Schematic of DNA template carrying Ptar, transcribed-region consensus −10 element (wild-type or mutant) and terminator. Template positions corresponding to pause sites are indicated. Note that the pause sites and terminated transcripts emanating from the Ptar promoter are located one base closer to the transcription start site (+1) than on the λPR′ template (Figure 1A). (See ‘Materials and methods’ for the Ptar promoter sequence.) (B). Analysis of RNA transcripts in vitro. Single-round in vitro transcription reactions were performed with reconstituted RNA polymerase (RNAP) holoenzyme containing σ28 (lanes 1–12), RNAP core enzyme (lanes 13–15) or reconstituted RNAP holoenzyme containing σ70 (lanes 16–18) and three different templates: Ptar with a wild-type (wt) transcribed-region −10 element (lanes 1–6 & 13–15) or a mutated (mut) transcribed-region −10 element (lanes 7–12) and λPR′ with a wild-type transcribed-region −10 element (lanes 16–18). The reactions were performed as a time course with samples taken at 1, 6 and 18 min after transcription was initiated; these reactions were performed in the absence of transcript cleavage factors GreA and GreB, resulting in a characteristic pattern of long-lived pause species (Deighan et al., 2011). Where indicated, excess σ70 (1 μM) was added with the ‘start mix’ after open complex formation. RNAs associated with paused transcription elongation complexes (TECs) (pause) and terminated transcripts (full length) are labeled. The asterisk (*) indicates a shorter terminated transcript that is the result of transcription initiating under the control of the transcribed-region −10 element when the σ70-containing holoenzyme is present in the reaction.
Figure 3
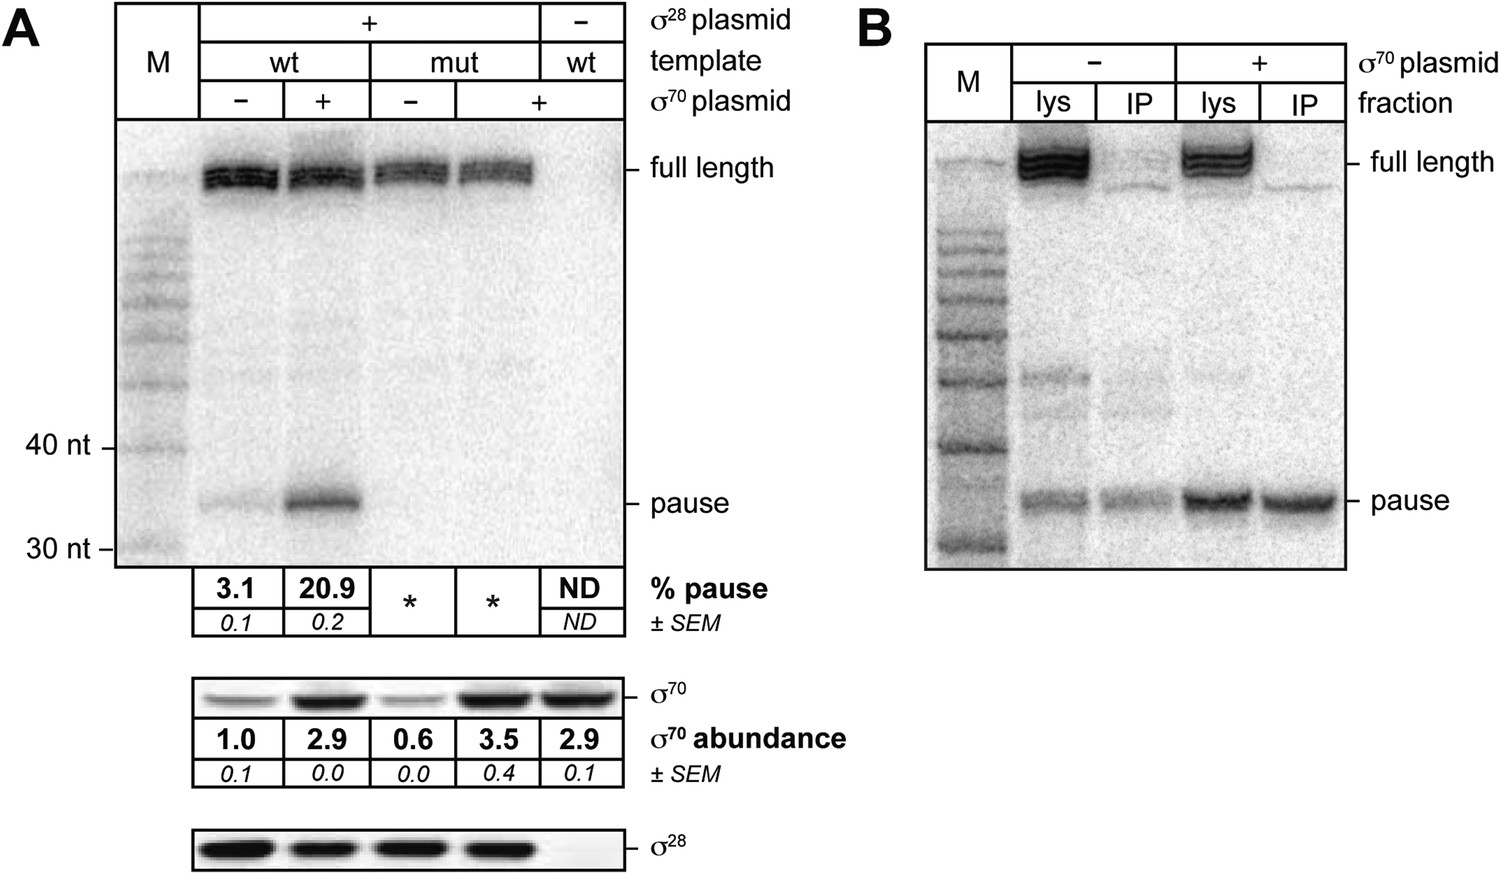
σ70 trans loading on a σ28-dependent transcription unit in vivo.
(A). top Detection of RNA transcripts in vivo from the templates shown in Figure 2A by LNA probe-hybridization. Transcribed-region sequences that are complementary to the LNA probe are as in Figure 1A. RNA was isolated from MG1655 cells harvested at an OD600 of 0.8–1.0. Pausing is quantified by dividing the signal in the ∼35-nt pause RNA band by the sum of this signal and the signal in the terminated (full-length) band. Mean and SEM of three independent measurements are shown. Asterisks (*) designate values that were too low for accurate quantification. M, 10-nt RNA ladder. middle Analysis of σ70 levels by Western blot. Amount of soluble σ70 is normalized to the amount in cells carrying the experimental template (wt) and a vector that does not direct σ70 over-production. Mean and SEM of three independent measurements are shown. bottom Analysis of σ28 levels by Western blot. (B). Analysis of RNAP-associated transcripts produced from the wild-type Ptar template. RNA was isolated from the lysate fraction (lys) or the immunoprecipitated fraction (IP) of SG110 cells (OD600 ∼0.5) and analyzed by LNA probe-hybridization. The cells contained a vector directing the synthesis of σ28, as well as a vector that did or did not direct σ70 overproduction.
Figure 4 with 1 supplement
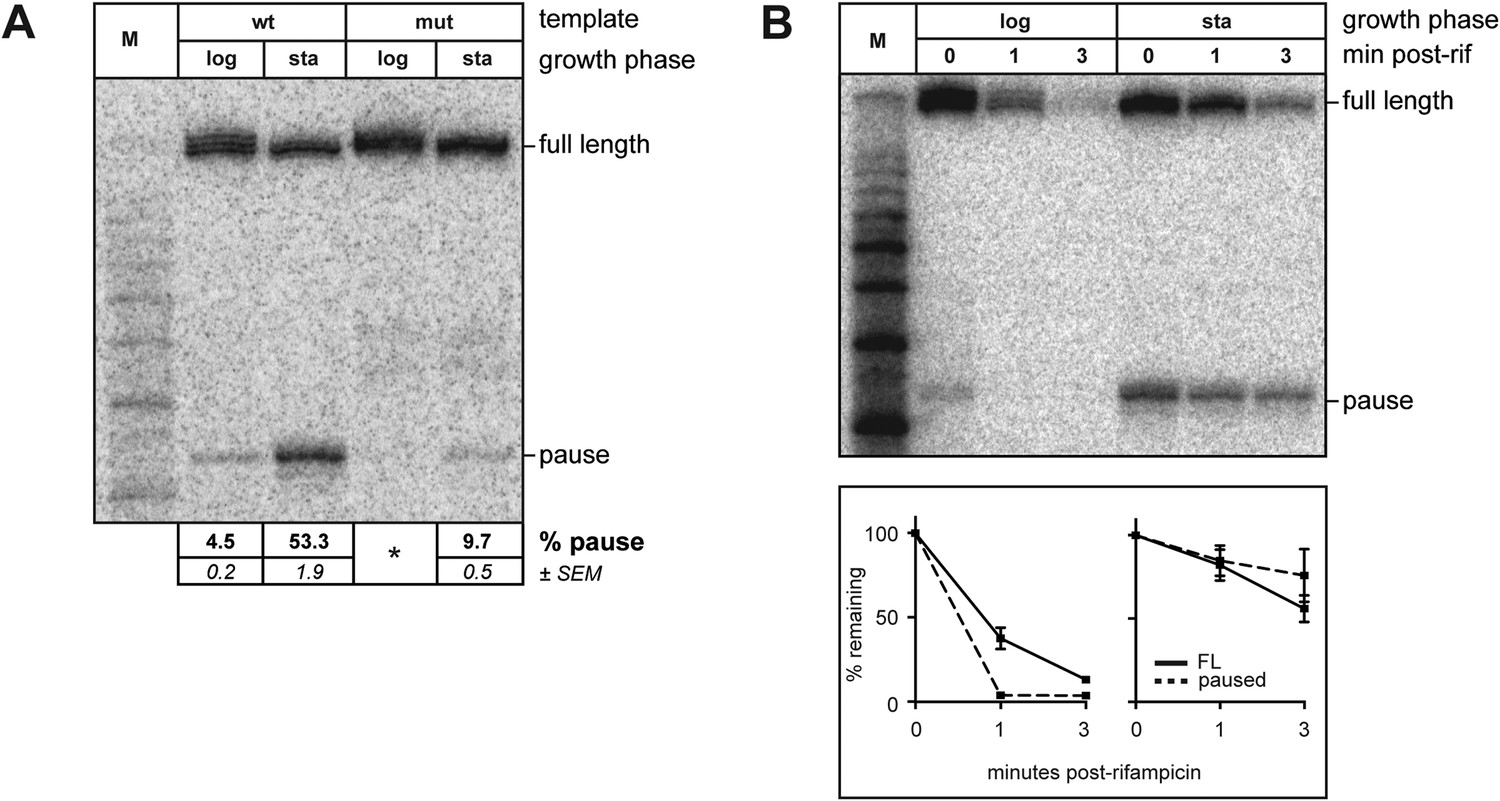
Growth phase dependent σ70 trans loading on a σ28-dependent transcription unit in vivo.
(A). Detection of RNA transcripts in vivo from the templates shown in Figure 2A by LNA probe-hybridization. Transcribed-region sequences that are complementary to the LNA probe are as in Figure 1A. RNA was isolated from SG110 cells harvested at an OD600 of ∼0.5 (log) or ∼2.5 (sta). Pausing is quantified by dividing the signal in the ∼35-nt pause RNA band by the sum of this signal and the signal in the terminated (full-length) band. Mean and SEM of six independent measurements are shown. Asterisks (*) designate values that were too low for accurate quantification. M, 10-nt RNA ladder. (B). top Detection of RNA transcripts derived from the wt template in vivo after treatment with rifampicin. bottom Percent of transcript remaining relative to T = 0 at indicated time points after addition of rifampicin. Mean and SEM of ten (log, 1 m), eight (sta, 1 m), or six (log and sta, 3 m) independent measurements are shown.
Figure 4—figure supplement 1

(A). Analysis of RNAP-associated transcripts produced from the wild-type Ptar template.
RNA was isolated from the lysate fraction (lys) or the immunoprecipitated fraction (IP) of SG110 cells (OD600 ∼2.5) and analyzed by LNA probe-hybridization. The cells contained a vector directing the synthesis of σ28. (B). Analysis of σ70 levels by Western blot. Relative quantification of σ70 (top) is normalized to the abundance of rpoA (α) in each sample (bottom). Mean and SEM of six independent measurements are shown.
Figure 5

Dual pathways for σ70 to associate with the TEC in vivo.
(A). Cis-acting pathway (Deighan et al., 2011). The retention in the TEC of the σ70 that was used during initiation enables pausing at transcribed-region −10-like elements on transcription units that are expressed under the control of σ70-dependent promoters. Presence of an initial-transcribed-region σ70-dependent −10-like element increases the σ70 content of downstream TECs and increases the efficiency of pausing at a second σ70-dependent pause element further downstream. Promoter, grey rectangle; σ70-dependent pause elements, black rectangles; RNA, wavy red line. (B). Trans-acting pathway. Binding of σ70 to TECs that have lost the σ factor used during initiation (here, σ28) increases the efficiency of pausing at a transcribed-region σ70-dependent pause element. Promoter, blue rectangle; σ70-dependent pause element, black rectangle; RNA, wavy red line.
Tables
Table 1
Plasmids
| Plasmid | Description | Source |
|---|---|---|
| pLHN12-His | pT7-His6-rpoD | (Panaghie et al., 2000) |
| pET15b-His-fliA | pT7-His6-fliA | This work |
| pFW11tet-PR′_+19 | λPR′ promoter and native σ70-dependent pause element with a second σ70-dependent pause element located 19 bp downstream of the +1 transcription start site. The tR′ intrinsic terminator is positioned to terminate transcription ∼116 bp downstream of +1. | (Deighan et al., 2011) |
| pFW11tet-mutPR′_+19 | Same as pFW11tet-PR′_+19 but with A+2 G/T+6 G mutations in the native σ70-dependent pause element. | (Deighan et al., 2011) |
| pFW11tet-Ptar_+19 (pNUN175) | Same as pFW11tet-PR′_+19 except that the promoter (up to and including +1) has been replaced with the σ28-dependent Ptar promoter. | This work |
| pFW11tet-Ptar_mut+19 (pNUN176) | Same as pFW11tet-Ptar_+19 but with mutations in the pause element. | This work |
| pBR-fliA | pSG585-fliA | This work |
| pSG585 | colE1 origin plasmid with lacUV5 upstream of multiple cloning site | This work |
| pNUN191 | pCDFlacMUT3-rpoD | This work |
| pCDFlacMUT3 | pCDFlac with attenuated −35 element (AATACA) | This work |
| pCDFlac | derivative of pCDF-1b into which the lacUV5 promoter has been inserted | (Montero-Diez et al., 2013) |
Download links
A two-part list of links to download the article, or parts of the article, in various formats.
Downloads (link to download the article as PDF)
Open citations (links to open the citations from this article in various online reference manager services)
Cite this article (links to download the citations from this article in formats compatible with various reference manager tools)
The primary σ factor in Escherichia coli can access the transcription elongation complex from solution in vivo
eLife 4:e10514.
https://doi.org/10.7554/eLife.10514


