Force transmission through the inner kinetochore is enhanced by centromeric DNA sequences
- Department of Biochemistry, University of Washington, United States
- Department of Neurobiology and Biophysics, University of Washington, United States
- Department of Structural Biology, Genentech, Inc, United States
Figures
Figure 1
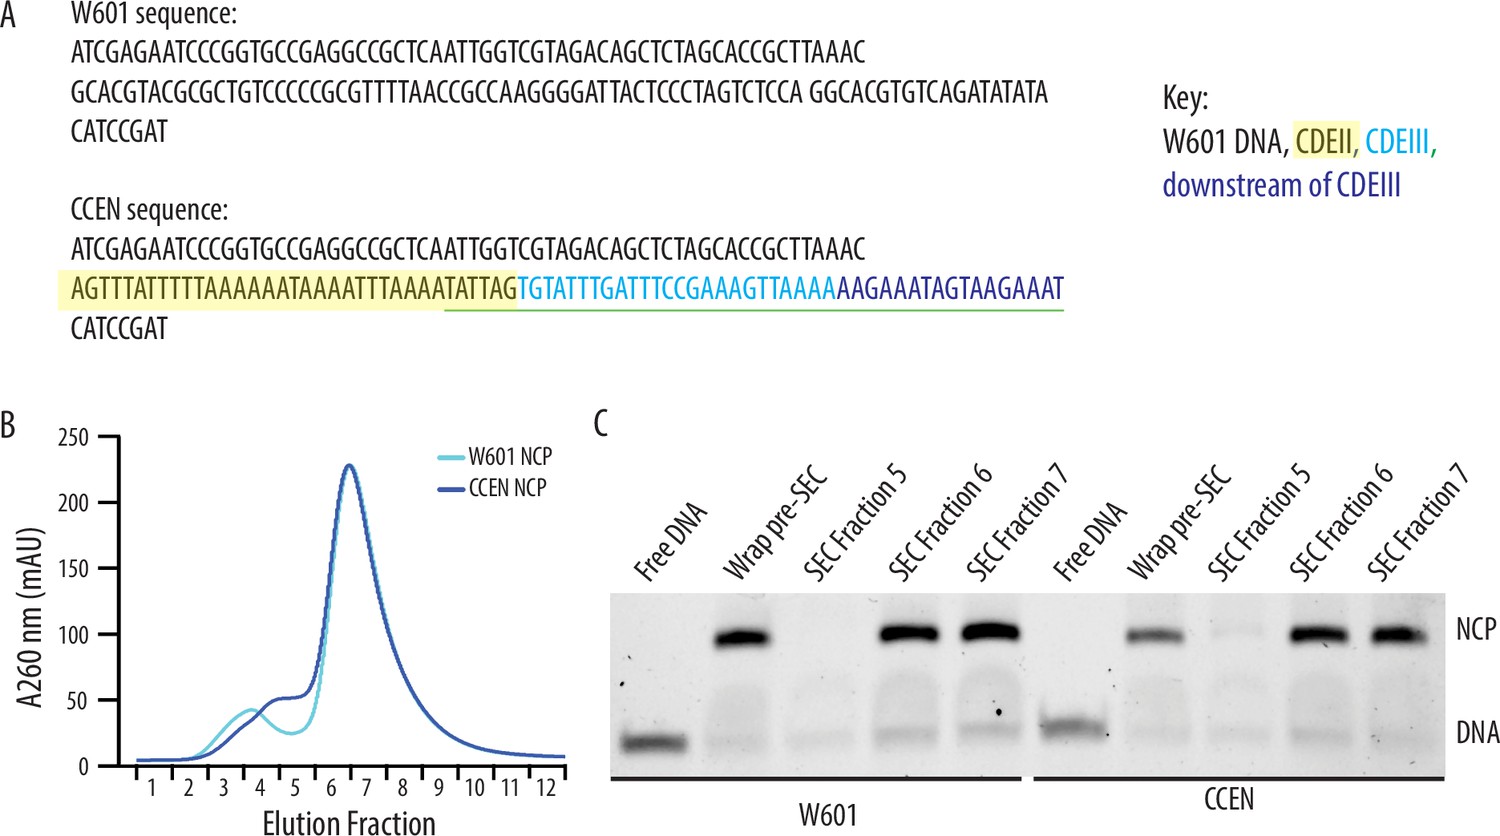
Recombinantly wrapped nucleosome core particles (NCPs) with W601 or CCEN DNA.
(A) Sequences of the W601 and CCEN DNA used to wrap histone octamers. The black text is W601 DNA, the black text highlighted in yellow is the portion of CDEII corresponding to the Mif2 footprint (Xiao et al., 2017), the cyan text is CDEIII, the sequence underlined in green is the CBF3 binding site (Guan et al., 2021), and the blue text is the pericentromeric DNA sequence just downstream of CDEIII on chromosome III. (B) Chromatogram representing elution fractions from size-exclusion chromatography column used to purify wrapped NCPs from excess free DNA. 260 nm signal is shown for both W601 and CCEN NCPs. (C) Native gel of elution fractions indicated in the chromatogram in (B). NCPs from both SEC Fraction 6 and SEC Fraction 7 were used to collect data on the optical trap. There was no statistically significant difference between rupture forces of assemblies measured with NCPs from either Fraction 6 or Fraction 7.
-
Figure 1—source data 1
Native gel for Figure 1C, including the relevant bands and conditions.
- https://cdn.elifesciences.org/articles/105150/elife-105150-fig1-data1-v1.zip
-
Figure 1—source data 2
Original file of native gel for Figure 1C.
- https://cdn.elifesciences.org/articles/105150/elife-105150-fig1-data2-v1.zip
Figure 2
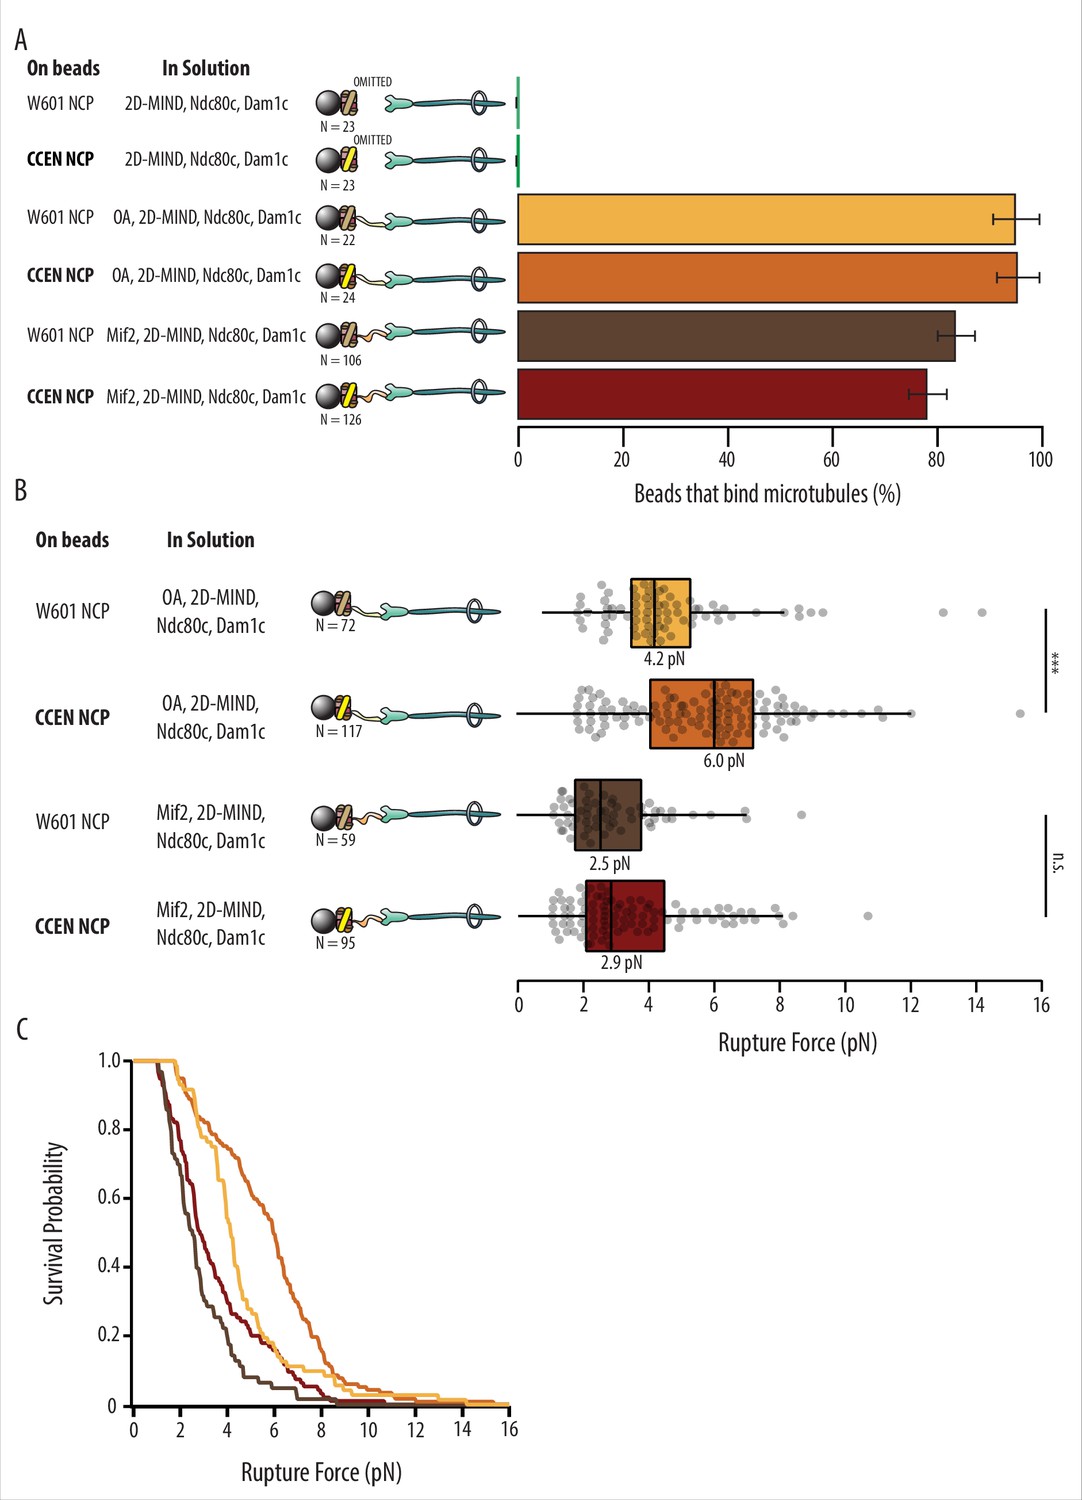
Kinetochore assemblies built on CCEN-NCPs and OA form stronger attachments to microtubules.
(A) Percentages of beads that had microtubule binding capability. Error bars indicate the standard error of the proportion. Barnard’s test was used to compare contingency tables. The p-values for the significance of the difference between fraction of beads bound if either OA or Mif2 were included compared to if neither were included are given in Table 1. Data were combined from two biological replicates (see Figure 2—source data 1). (B) Boxplot of rupture forces for each of the kinetochore assemblies tested. Dots represent individual rupture events, and boxes enclose the interquartile range, with indicated medians. Whiskers extend to the inner fences. Data were combined from four biological replicates of each condition (see Figure 2—source data 1). A Kolmogorov–Smirnov test was performed to compare the probability distributions of rupture forces across conditions. *** indicates p-value of 1.87 × 10⁻⁶, n.s., not significant. (C) Survival probability curves for the data plotted in (B).
-
Figure 2—source data 1
Excel file of data for Figure 2A and B and a list of the number of technical and biological replicates for Figure 2A and B.
- https://cdn.elifesciences.org/articles/105150/elife-105150-fig2-data1-v1.xlsx
Tables
Table 1
Statistical analyses for microtubule binding assay*.
| Condition | CCEN NCP neither OA nor Mif2 | W601 NCP neither OA nor Mif2 |
|---|---|---|
| W601 NCP, OA | N/A | 2.61 × 10⁻¹² |
| CCEN NCP, OA | 3.55 × 10⁻¹³ | N/A |
| W601 NCP, Mif2 | N/A | 2.31 × 10⁻¹² |
| CCEN NCP, Mif2 | 4.27 × 10⁻⁷ | N/A |
-
N/A, not applicable.
-
*
p-Values for comparison of data in Figure 2A determined by a Barnard’s test.
Key resources table
| Reagent type (species) or resource | Designation | Source or reference | Identifiers | Additional information |
|---|---|---|---|---|
| Strain, strain background (Escherichia coli) | Rosetta (DE3) pLys competent cells | Novagen | Cat# 71403 | |
| Antibody | MonoRab anti-DYKDDDDK Affinity Resin | GenScript | Cat# L00766 | |
| Biological sample (Bos taurus) | Tubulin | Lab purification | Isolated from Bos taurus brains Protocol adopted from Castoldi and Popov, 2003 | |
| Antibody | Biotinylated Anti-His tag antibody | R&D Systems | Cat# BAM050 RRID:AB_356845 | |
| Chemical compound, drug | Glucose oxidase | MilliporeSigma | Cat# 345386 | |
| Chemical compound, drug | Catalase | MilliporeSigma | Cat# E3289 | |
| Chemical compound, drug | Biotinylated bovine serum albumin (BSA) | Vector laboratories | Cat# B-2007 | |
| Chemical compound, drug | Avidin DN | Vector Laboratories | Cat# A-3100 | |
| Chemical compound, drug | TCEP | Thermo Fisher | Cat# 20490 | |
| Other | Streptavidin-coated polystyrene beads | Spherotech | SVP-05-10 | |
| Software | Labview | National Instruments | RRID:SCR_014325 | |
| Software | Igor Pro | Wavemetrics | RRID:SCR_000325 |
Table 2
Plasmids used for expression of kinetochore proteins*.
| Protein | Plasmid | Components | References |
|---|---|---|---|
| Nucleosome | pScKl2 | K. lactis His6-H2A, K. lactis His6-H2B, Cse4, K. lactis His6-H4 | Migl et al., 2020 |
| OA | pGH3 | Okp1, Ame1-FLAG | Hamilton et al., 2020 |
| Mif2 | pAZ144 | Mif2-MBP | This study |
| 2D-MIND | pGH62 | FLAG-Nsl1, S240D & S250D Dsn1, Mtw1, Nnf1 | Hamilton et al., 2020 |
| (230-576) 2D-MIND | pEHM4 | FLAG-Nsl1, (230-576) S240D & S250D Dsn1, Mtw1, Nnf1 | Hamilton et al., 2020 |
| Ndc80c | pJT48 Ndc80/Nuf2 | Spc24-FLAG, Spc25 Ndc80, Nuf2 | Kudalkar et al., 2015; Wei et al., 2005 |
| Dam1c | pJT44 | Spc34-FLAG, Dad1, Dad2, Dad3, Dad4 Duo1, Dam1, Hsk3, Spc19, Ask1 | Umbreit et al., 2014 |
-
*
All proteins are from Saccharomyces cerevisiae except as noted.
Table 3
DNA sequences tested for ability to wrap centromeric nucleosomes.
| Name | Sequence* | Wrapped? | Stable duringSEC? |
|---|---|---|---|
| W601† | ATCGAGAATCCCGGTGCCGAGGCCGCTCAATTGGTCGTAGACAGC TCTAGCACCGCTTAAACGCACGTACGCGCTGTCCCCCGCGTTTTA ACCGCCAAGGGGATTACTCCCTAGTCTCCAGGCACGTGTCAGATA TATACATCCGAT | Yes | Yes |
| CEN 3 ‡ | AAAGCTATTCATTGAAAAAATAGTACAAATAAGTCACATGATGATATTTGATTTTATTATATTTTTAAAAAAAGTAAAAAATAAAAAGTA GTTTATTTTTAAAAAATAAAATTTAAAATATTAGTGTATTTGATT TCCGAAAGTTAAAAAAGAAATAGTAAGAAATATATATTT | Some | No |
| CEN 5.1 | AAAGCTATTCATTGAAAAAATAGTACAAATAAGTCACATGATCGA GAATCCCGGTGCCGAGGCCGCTCAATTGGTCGTAGACAGCTCTAG CACCGCTTAAACGCACGTACGCGCTGTCCCCCGCGTTTTAACCGC CAAGGGGATTACTCCCTAGTCTCCAGGCACGTGTCAGATATATAC ATCCGATTATTTGATTTCCGAAAGTTAAAAAAGAAATAGTAAGAA ATATATATTT | Yes | Yes |
| CEN3-601 (Xiao et al., 2017) | ATCGAGAATCCCGGTGCCGAGGCCGCTCAATTGGTCGTAGACAGC TCTAGCACCGCTTAAACGCACGTACGCGCTGTCCCCCGCGTTTTA ATATTAGTGTATTTGATTTCCGAAAGTTAAAAAAGAAATAGTAAG AAATCATCCGAT | Yes | Yes |
| CCEN† | ATCGAGAATCCCGGTGCCGAGGCCGCTCAATTGGTCGTAGACAGC TCTAGCACCGCTTAAACAGTTTATTTTTAAAAAATAAAATTTAAA ATATTAGTGTATTTGATTTCCGAAAGTTAAAAAAGAAATAGTAAG AAATCATCCGAT | Yes | Yes |
| CEN 6.3 | ATCGAGAATCCCGGTGCCGAGGCCGCTCAATTGGTCGTAGACAGC TCTAGCACCGCTTAAACAGTTTATTTTTAAAAAATAAAATTTAAA ATATTAGAGGGGATTACTCCCTAGTCTCCAGGCACGTGTCAGATA TATACATCCGAT | Yes | ND § |
| CEN 6.4 | ATCGAGAATCCCGGTGCCGAGGCCGCTCAATTGGTCGTAGACAGC TCTAGCACCGCTTAAACGCACGTACGCGCTGTCCCCCGCGTTTTA ACCGCCAAGGGGATTACTCCCTAGTCTCCAGGCACGTGTCAGATA TATACATCCGATGCCGCCAGTTTATTTTTAAAAAATAAAATTTAA AATATTAG | Some | ND § |
| CON3 ¶ (Dendooven et al., 2023) | ATAAGTCACATGGTGCCGAGGCCGCTCAATTGGTCGTAGACAGCT CTAGCACCGCTTAAACGCACGTACGCGCTGTCCCCCGCGTTTTAA TATTAGTGTATTTGATTTCCGAAAGTTAAAAAAGAAATAGTAAGA AATATATATTTCATTGAA | ND § | ND § |
-
ND, not determined.
-
*
W601 DNA in black font; Genomic DNA upstream or downstream of CEN3 in blue font; CDEI in purple font; CDEII in red font; CDEII Mif2 footprint in red font and underlined; CDEIII in purple font and underlined; linker DNA highlighted in bold.
-
†
These are the DNA sequences used to wrap the nucleosomes tested in the optical trapping assay in this paper.
-
‡
The construct used by Xiao et al., 2017 included only the 147 bp of CEN3 and none of the upstream or downstream sequences.
-
§
Not determined.
-
¶
Shown for comparison only.
Table 4
Kinetochore protein purification buffers.
| Protein | Purification buffers |
|---|---|
| Dam1c-FLAG | Lysis: 50 mM sodium phosphate buffer pH 6.9, 500 mM NaCl, 1 mM PMSF, Roche protease inhibitor tablets FLAG wash: 50 mM sodium phosphate buffer pH 6.9, 500 mM NaCl, 1 mM PMSF, Roche protease inhibitor tablets FLAG elution: 50 mM sodium phosphate buffer pH 6.9, 500 mM NaCl, 1 mM PMSF, Roche protease inhibitor tablets, 200 ug/ml 3x FLAG peptide SEC: 50 mM sodium phosphate buffer pH 6.9, 500 mM NaCl |
| Mif2-MBP | Lysis: 30 mM HEPES buffer pH 7.5, 2 M NaCl, 10% glycerol, 1 mM TCEP, 1 mM PMSF, Roche protease inhibitor tablets Amylose resin elution: 30 mM HEPES buffer pH 7.5, 100 mM NaCl, 10% glycerol, 1 mM TCEP, 1 mM PMSF, Roche protease inhibitor tablets, 10 mM maltose QA: 30 mM HEPES buffer pH 7.5, 100 mM NaCl, 10% glycerol, 1 mM TCEP, 1 mM PMSF, Roche protease inhibitor tablets QB: 30 mM HEPES buffer pH 7.5, 1 M NaCl, 10% glycerol, 1 mM TCEP |
| MIND-FLAG | Lysis: 50 mM HEPES buffer pH 7.5, 200 mM NaCl, 10% glycerol, 0.5% NP40, 1 mM EDTA, 1 mM PMSF, Roche protease inhibitor tablets FLAG wash: 50 mM HEPES buffer pH 7.5, 200 mM NaCl, 10% glycerol, 1 mM EDTA, 1 mM PMSF, Roche protease inhibitor tablets FLAG elution: 50 mM HEPES buffer pH 7.5, 200 mM NaCl, 10% glycerol, 1 mM EDTA, 1 mM PMSF, Roche protease inhibitor tablets, 200 ug/ml 3x FLAG peptide SEC: 50 mM HEPES buffer pH 7.5, 200 mM NaCl, 1 mM EDTA |
| Ndc80c-FLAG | Lysis: 50 mM HEPES buffer pH 7.6, 200 mM NaCl, 10% glycerol, 1 mM EDTA, 1 mM PMSF, Roche protease inhibitor tablets FLAG wash: 50 mM HEPES buffer pH 7.6, 200 mM NaCl, 10% glycerol, 1 mM EDTA, 1 mM PMSF, Roche protease inhibitor tablets FLAG elution: 50 mM HEPES buffer pH 7.6, 200 mM NaCl, 10% glycerol, 1 mM EDTA, 1 mM PMSF, Roche protease inhibitor tablets, 200 ug/ml 3x peptide SEC: 50 mM HEPES buffer pH 7.6, 200 mM NaCl, 1 mM EDTA |
| OA-FLAG | Lysis: 50 mM HEPES buffer pH 7.5, 200 mM NaCl, 10% glycerol, 0.5% NP40, 1 mM PMSF, Roche protease inhibitor tablets Low salt FLAG wash: 50 mM HEPES buffer pH 7.5, 200 mM NaCl, 10% glycerol, 1 mM EDTA, 1 mM PMSF, Roche protease inhibitor tablets High salt FLAG wash: 50 mM HEPES buffer pH 7.5, 2 M NaCl, 10% glycerol, 1 mM EDTA, 1 mM PMSF, Roche protease inhibitor tablets FLAG elution: 50 mM HEPES buffer pH 7.5, 200 mM NaCl, 10% glycerol, 1 mM EDTA, 1 mM PMSF, Roche protease inhibitor tablets, 200 ug/ml 3x FLAG peptide SEC: 50 mM HEPES buffer pH 7.5, 200 mM NaCl, 1 mM EDTA |
Additional files
Download links
A two-part list of links to download the article, or parts of the article, in various formats.
Downloads (link to download the article as PDF)
Open citations (links to open the citations from this article in various online reference manager services)
Cite this article (links to download the citations from this article in formats compatible with various reference manager tools)
Force transmission through the inner kinetochore is enhanced by centromeric DNA sequences
eLife 14:RP105150.
https://doi.org/10.7554/eLife.105150.3


