Modular DNA barcoding of nanobodies enables multiplexed in situ protein imaging and high-throughput biomolecule detection
- School of Life Sciences, Peking University, China
- National Institute of Biological Sciences (NIBS), China
- Peking University-Tsinghua University-National Institute of Biological Sciences Joint Graduate Program, NIBS, China
- Chinese Institute for Brain Research, China
- School of Biomedical Engineering, Capital Medical University, China
- Tsinghua Institute of Multidisciplinary Biomedical Research (TIMBR), China
- New Cornerstone Science Laboratory, China
- Research Unit of Medical Neurobiology, Chinese Academy of Medical Sciences, China
- Beijing Institute for Brain Research, Chinese Academy of Medical Sciences & Peking Union Medical College, China
Figures
Figure 1 with 6 supplements
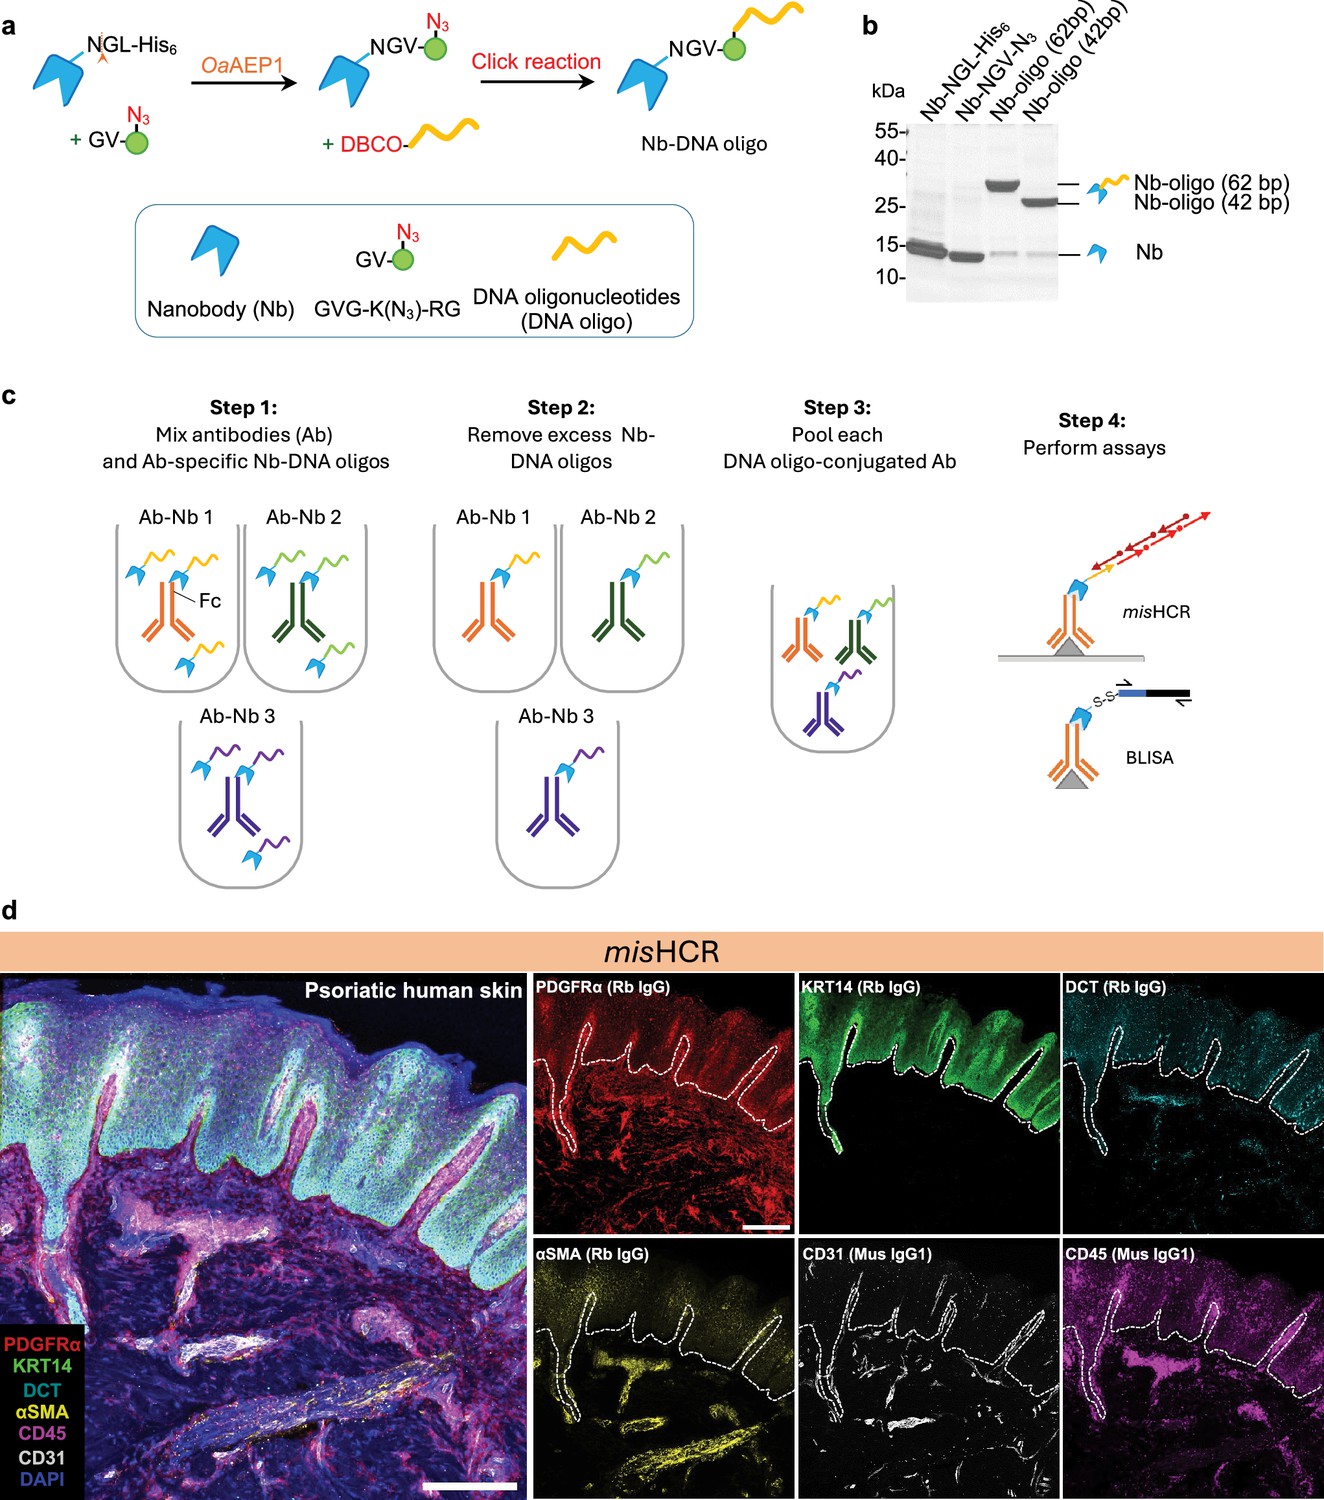
Development and application of multiplexed and modular barcoding of antibodies (MaMBA) and MaMBA-assisted immunosignal hybridization chain reaction (misHCR).
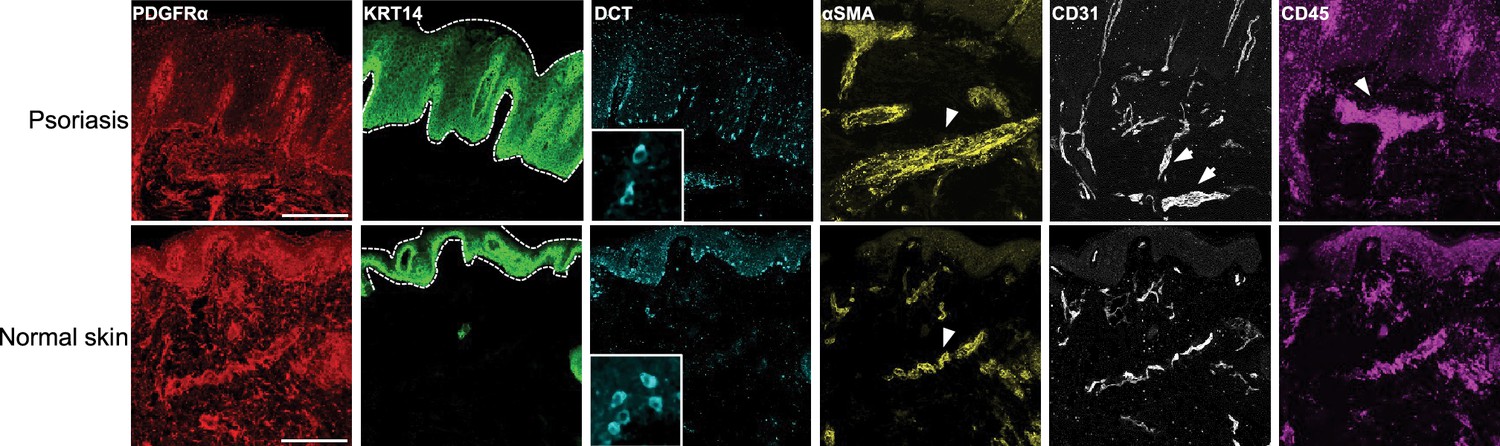
(a) Schematics of the DNA oligo-conjugated nanobody production process. (b) Coomassie-stained SDS-PAGE gel of purified nanobody (Nb-NGL-His6), OaAEP1 reaction product (Nb-NGV-N3), and click reaction products (Nb-DNA oligo). (c) MaMBA workflow. IgG antibodies are separately incubated with DNA oligo-conjugated nanobodies bearing unique DNA barcodes, forming antibody-Nb-DNA oligo complexes (Ab-Nb 1 to Ab-Nb 3). These complexes are subsequently purified using ultracentrifugal filters or IgG-conjugated beads, pooled, and applied to various assays. (d) Fluorescence confocal images of human psoriatic skin section stained for DAPI and six antigens by three rounds of misHCR. IgG types of the employed antibodies are indicated in parentheses. Scale bar, 300 μm. Rb, rabbit; Mus, mouse; Th, tyrosine hydroxylase; PDGFRα, platelet-derived growth factor receptor A; KRT14, keratin 14; DCT, dopachrome tautomerase; αSMA, alpha-smooth muscle actin.
-
Figure 1—source data 1
Original file for PAGE gel displayed in Figure 1b.
- https://cdn.elifesciences.org/articles/105225/elife-105225-fig1-data1-v1.zip
-
Figure 1—source data 2
PNG file for PAGE gel in Figure 1b, indicating the relevant bands.
- https://cdn.elifesciences.org/articles/105225/elife-105225-fig1-data2-v1.zip
-
Figure 1—source data 3
Source image file in Figure 1d.
- https://cdn.elifesciences.org/articles/105225/elife-105225-fig1-data3-v1.zip
Figure 1—figure supplement 1
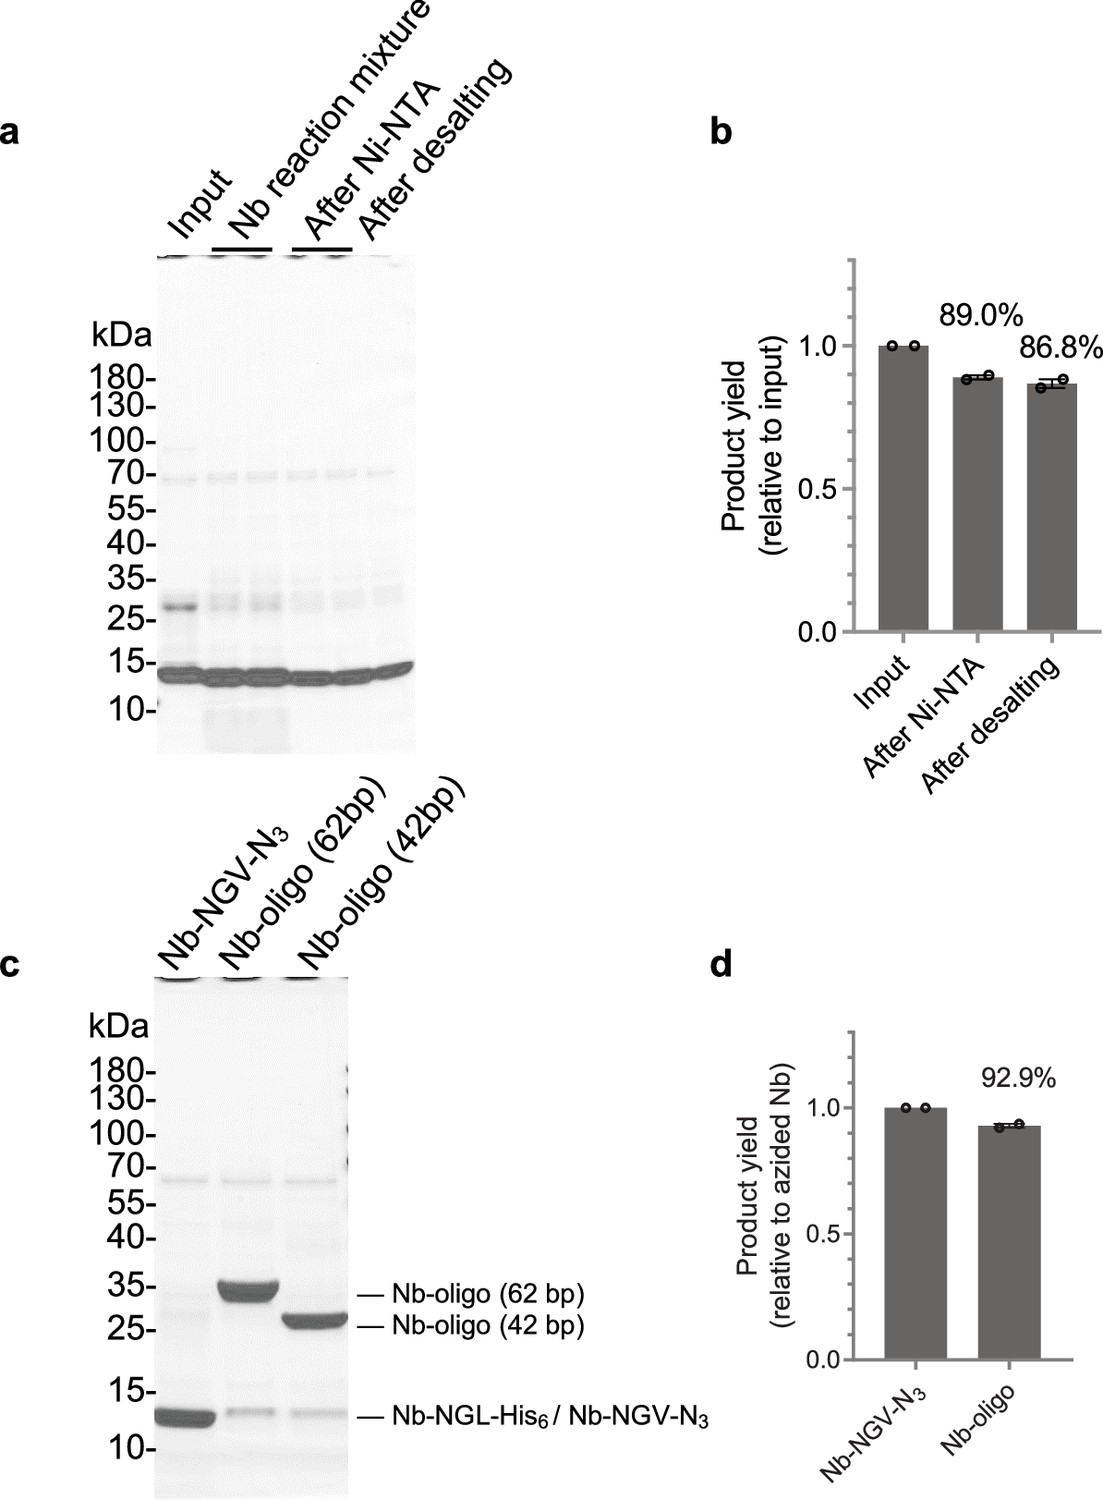
Efficiency assessment of nanobody-DNA oligo conjugation.
(a) Coomassie-stained reducing SDS-PAGE gel of protein products at each step of OaAEP1-mediated azide functional groups addition to nanobodies. The purified nanobody (i.e., input) was incubated with OaAPE1 and azide-bearing substrate peptides (i.e., Nb reaction mixture). After the reaction, the products (i.e. Nb-NGV-N3) were purified by Ni-NTA agarose beads to remove unreacted His6-tagged nanobody (i.e., after Ni-NTA). The excess substrate peptides were further depleted using desalting columns (i.e., after desalting). (b) Quantification of OaAPE1-mediated reaction yields, determined by densitometric measurement of Nb-NGV-N3 band intensities. (c) Coomassie-stained reducing SDS-PAGE gel of Nb-NGV-N3 and nanobodies conjugated with DNA oligo of different lengths (i.e., Nb-oligo [62 bp] and Nb-oligo [42 bp]). (d) Quantification of DNA conjugation yields, determined by densitometric measurement of band intensities corresponding to nanobody-DNA conjugates.
-
Figure 1—figure supplement 1—source data 1
Original file for PAGE gel displayed in Figure 1—figure supplement 1a.
- https://cdn.elifesciences.org/articles/105225/elife-105225-fig1-figsupp1-data1-v1.zip
-
Figure 1—figure supplement 1—source data 2
PNG file for PAGE gel in Figure 1—figure supplement 1a, indicating the relevant bands.
- https://cdn.elifesciences.org/articles/105225/elife-105225-fig1-figsupp1-data2-v1.zip
Figure 1—figure supplement 2
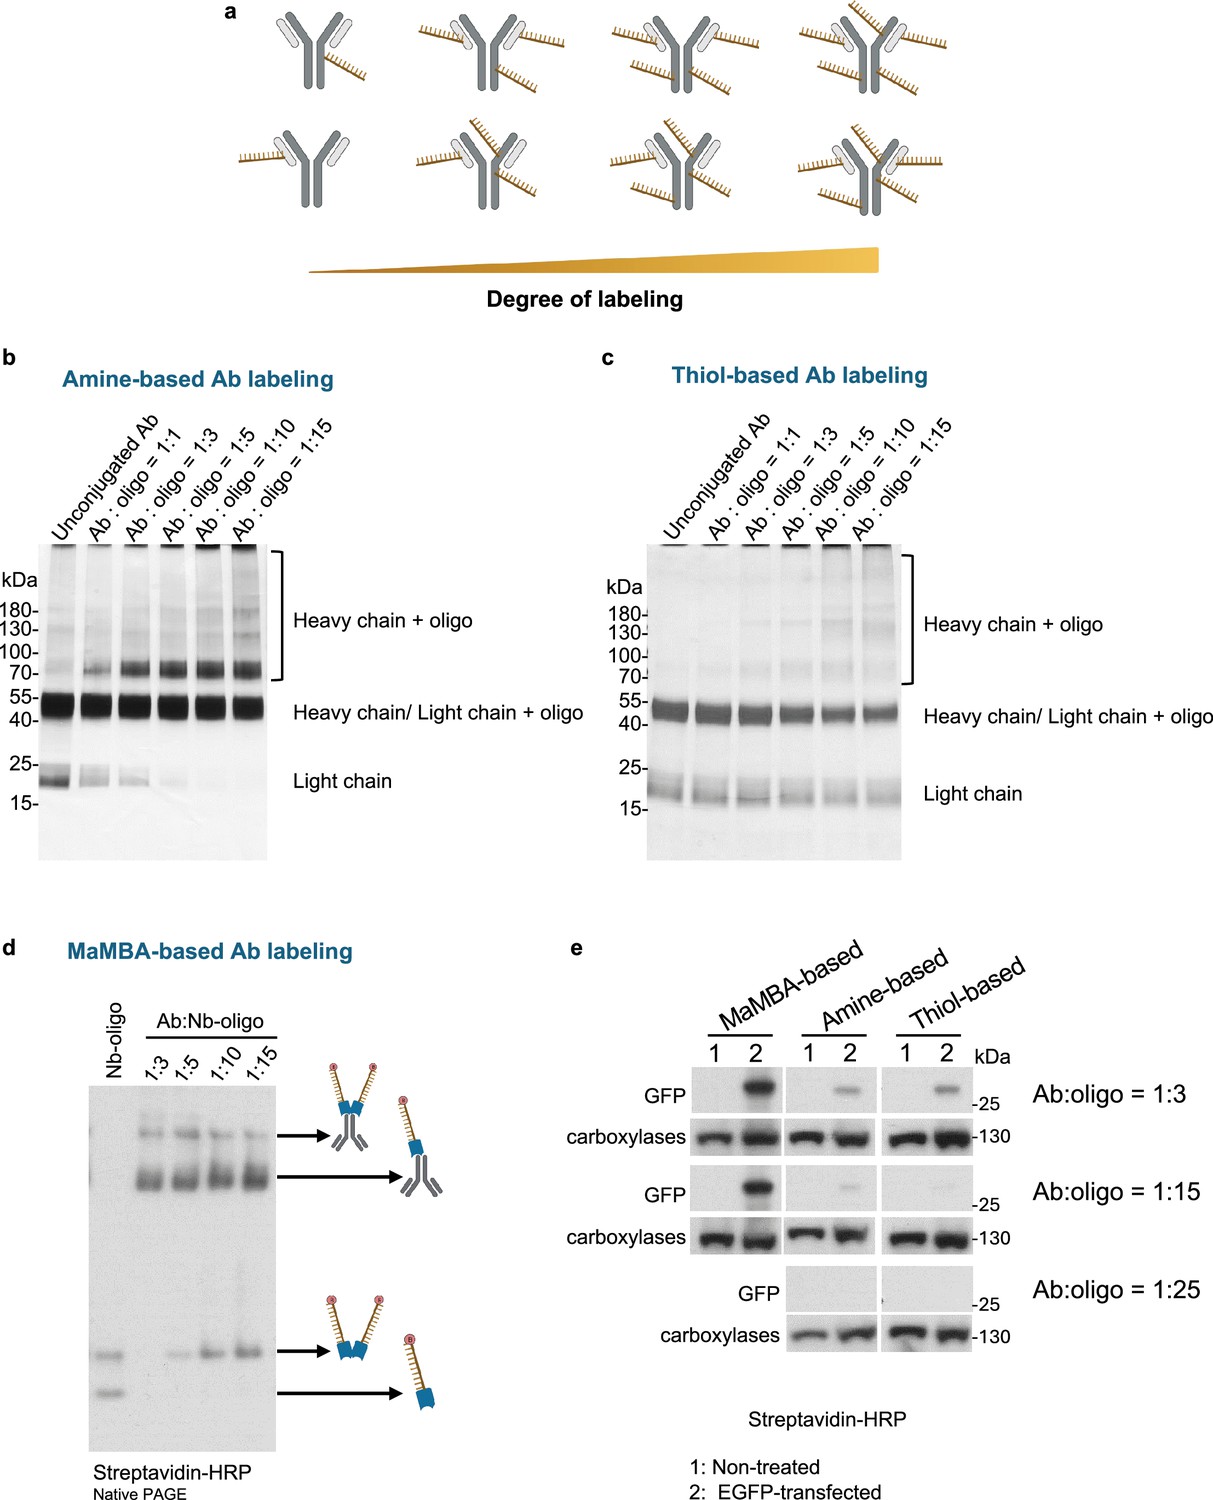
Comparison of antibody-DNA oligo labeling methods.
(a) Schematics of non-site-specific labeling methods for generating DNA oligo-conjugated antibodies with increased labeling degree. This panel was created using BioRender.com. (b) Silver-stained reducing SDS-PAGE gel of antibodies conjugated with 62 bp DNA oligos using the amine-based method (Thunder-link antibody labeling kit) at various antibody:DNA ratios. (c) Silver-stained reducing SDS-PAGE gel of antibodies conjugated with 62 bp DNA oligos using the thiol-based method (thiol-maleimide reaction) at various antibody:DNA ratios. (d) Western blot of DNA oligo-labeled antibodies generated by multiplexed and modular barcoding of antibodies (MaMBA) strategy using different antibody:nanobody-DNA oligo (Nb-oligo) ratios. Samples were separated by native PAGE and transferred to PVDF membrane for western blot. DNA oligos were 3'-biotin modified and detected using streptavidin. (e) Western blot of HEK 293T cell lysates with or without EGFP expression using different DNA oligo-labeled antibodies. The concentrations of anti-GFP antibodies were identical for each group. DNA oligos were 3'-biotin modified and detected using streptavidin. All groups were chemiluminescently detected simultaneously. Endogenous biotinylated carboxylases in cell lysates served as loading controls.
-
Figure 1—figure supplement 2—source data 1
Original files for gels and western blots displayed in Figure 1—figure supplement 2b–e.
- https://cdn.elifesciences.org/articles/105225/elife-105225-fig1-figsupp2-data1-v1.zip
-
Figure 1—figure supplement 2—source data 2
PNG files for gels and western blots in Figure 1—figure supplement 2b–e, indicating the relevant bands.
- https://cdn.elifesciences.org/articles/105225/elife-105225-fig1-figsupp2-data2-v1.zip
Figure 1—figure supplement 3
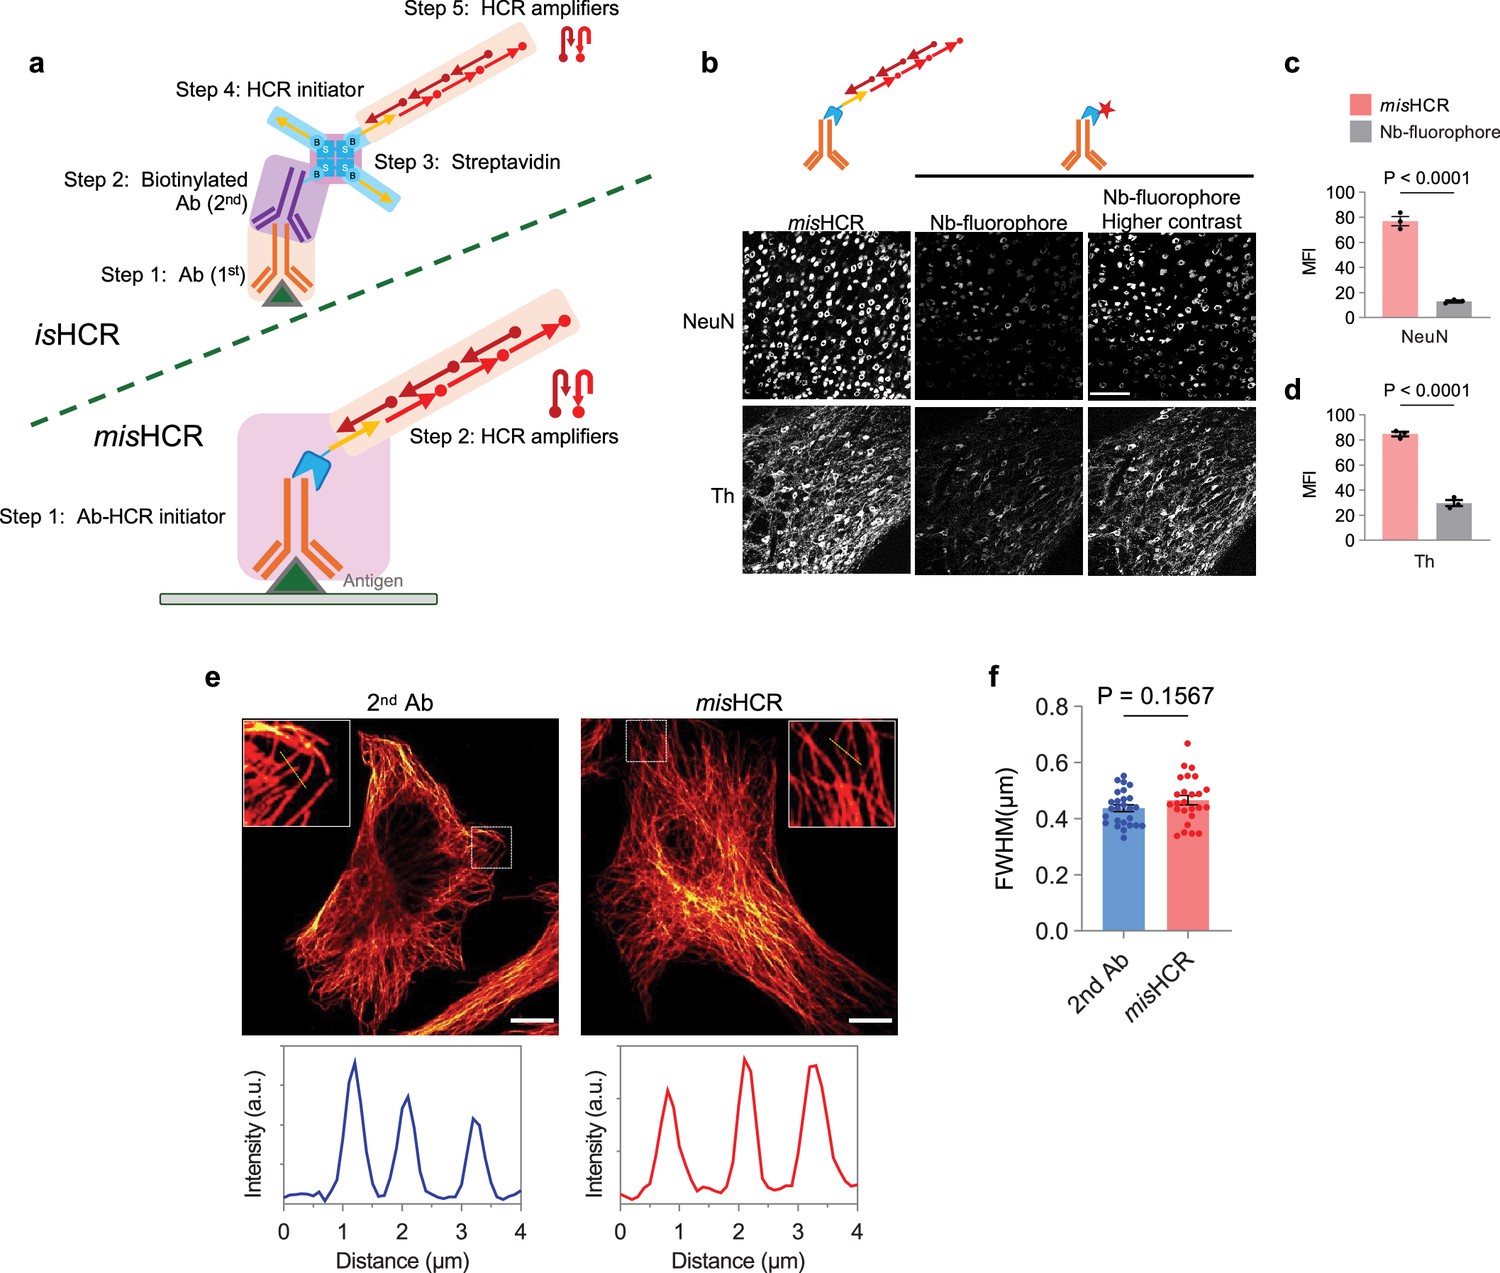
Characterization of multiplexed and modular barcoding of antibodies-assisted immunosignal hybridization chain reaction (misHCR).
(a) Schematics of isHCR and misHCR procedures. (b–d) Fluorescence confocal images of mouse brain sections stained using misHCR or conventional fluorescent immunohistochemistry with fluorophore-conjugated nanobodies. n=3 brain sections for each group; mean ± s.e.m.; two-sided unpaired t-test. Scale bar, 100 μm. (e) Fluorescence confocal images of HeLa cells stained against α-tubulin using a conventional method with a fluorophore-conjugated secondary antibody (2nd Ab) (left) or misHCR (right). Insets show zoomed-in views of the boxed region. Scale bar, 10 μm. Bottom panel shows representative intensity profiles along straight lines drawn perpendicular to microtubule structures. (f) Quantification of full width at half maximum (FWHM) derived from intensity profiles along a straight line drawn perpendicular to microtubule structure stained using traditional immunohistochemistry (2nd Ab) or misHCR. n = 26 for 2nd Ab and 25 for misHCR; mean ± s.e.m.; two-sided unpaired t-test.
-
Figure 1—figure supplement 3—source data 1
Source image files in Figure 1—figure supplement 3b.
- https://cdn.elifesciences.org/articles/105225/elife-105225-fig1-figsupp3-data1-v1.zip
-
Figure 1—figure supplement 3—source data 2
Source image files in Figure 1—figure supplement 3e.
- https://cdn.elifesciences.org/articles/105225/elife-105225-fig1-figsupp3-data2-v1.zip
Figure 1—figure supplement 4
Efficient and reproducible hybridization chain reaction (HCR) signal removal by formamide treatment.
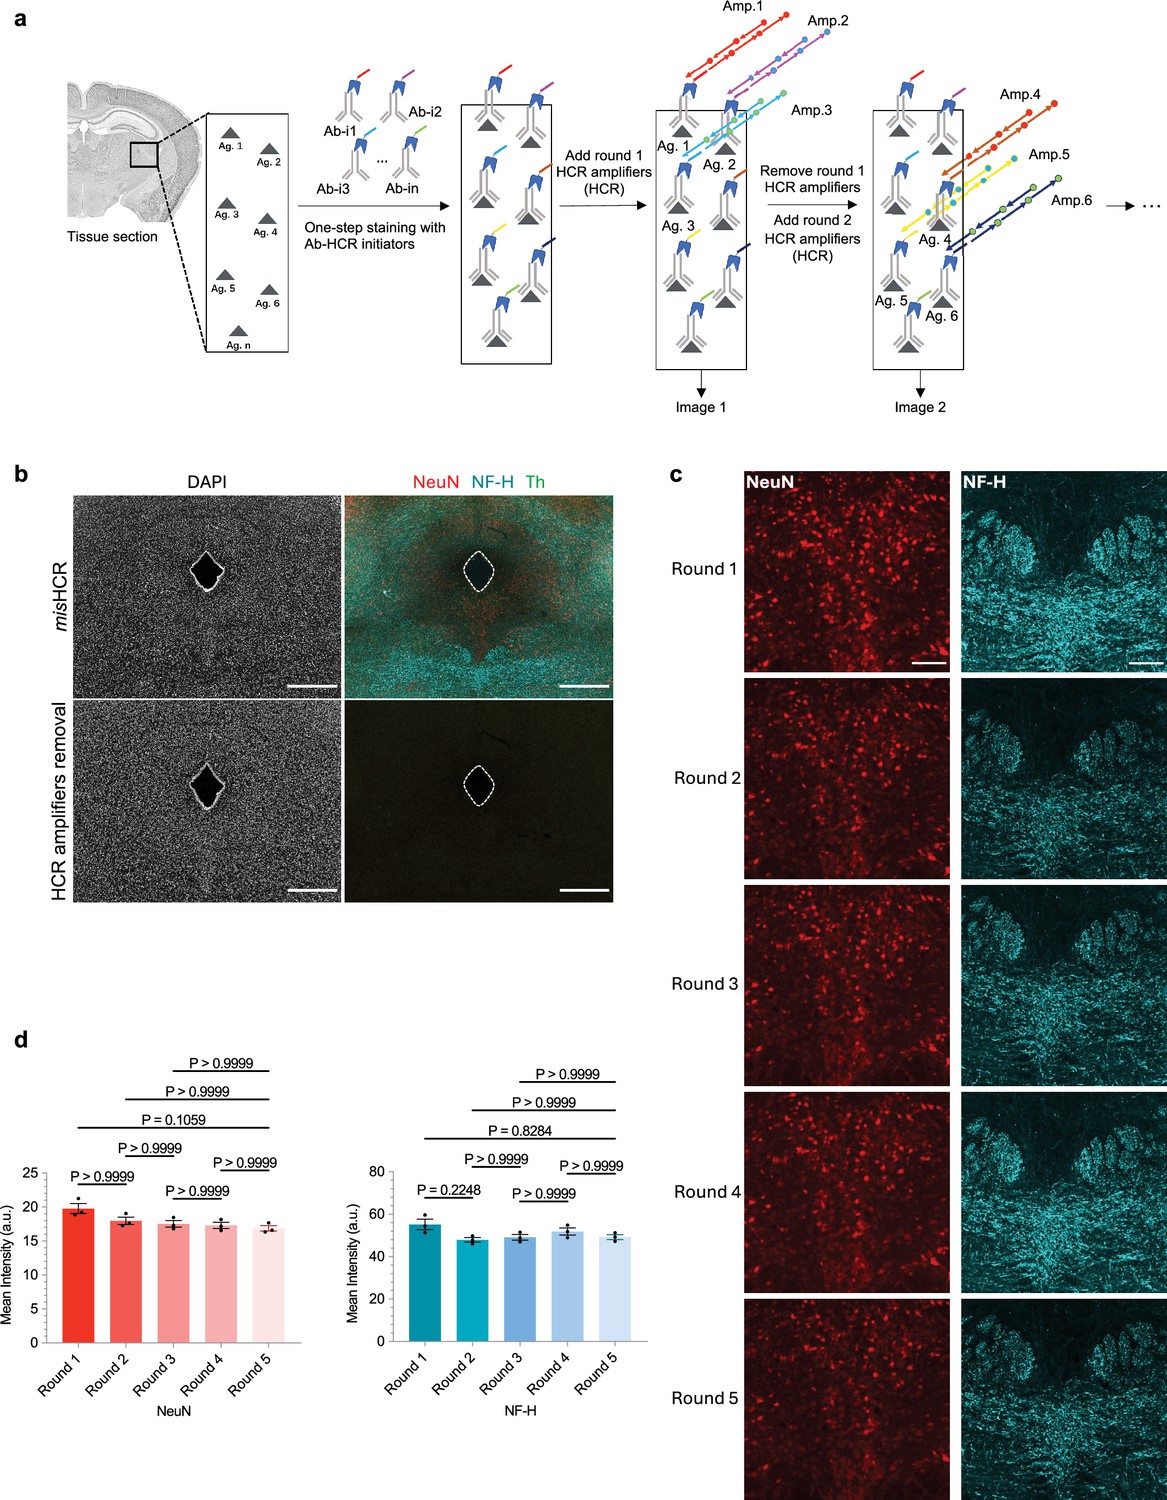
(a) Workflow of multiplexed and modular barcoding of antibodies-assisted immunosignal HCR (misHCR) imaging. Pooled antibodies (Ab-i1 to Ab-in), each conjugated with distinct HCR initiators, are applied simultaneously for antigen (Ag. 1 to Ag. n) detection. Subsequently, sequential rounds of imaging are performed via hybridization and dehybridization of orthogonal HCR amplifier pairs (Amp.). (b) Fluorescence confocal images of mouse brain sections before and after HCR amplifiers removal using formamide. Scale bar, 500 μm. (c) Fluorescence confocal images of the dorsal raphe nucleus (DRN) in mouse brain sections stained against neuronal nuclei (NeuN) and neurofilament H (NF-H) through five consecutive cycles of HCR amplification/formamide treatment. Scale bar, 100 μm. (d) Quantification of mean fluorescence intensity for NeuN (left) and NF-H (right) after each round of HCR amplification. Images of each group were acquired using identical microscopy settings. n=3 brain sections for each group; mean ± s.e.m.; Dunn’s multiple comparison tests.
-
Figure 1—figure supplement 4—source data 1
Source image files in Figure 1—figure supplement 4b.
- https://cdn.elifesciences.org/articles/105225/elife-105225-fig1-figsupp4-data1-v1.zip
-
Figure 1—figure supplement 4—source data 2
Source image files in Figure 1—figure supplement 4c.
- https://cdn.elifesciences.org/articles/105225/elife-105225-fig1-figsupp4-data2-v1.zip
Figure 1—figure supplement 5
Multiplexed and modular barcoding of antibodies-assisted immunosignal hybridization chain reaction (misHCR) imaging of human psoriatic and healthy skin sections.
Fluorescence confocal images of skin sections from a patient with psoriasis (up) and a healthy donor (bottom) stained against six antigens. The psoriatic skin sample corresponds to that shown in Figure 1d. Dotted lines and arrows indicate pathological features characteristic of psoriatic skins. Scale bar, 300 μm.
-
Figure 1—figure supplement 5—source data 1
Source image files in Figure 1—figure supplement 5.
- https://cdn.elifesciences.org/articles/105225/elife-105225-fig1-figsupp5-data1-v1.zip
Figure 1—figure supplement 6
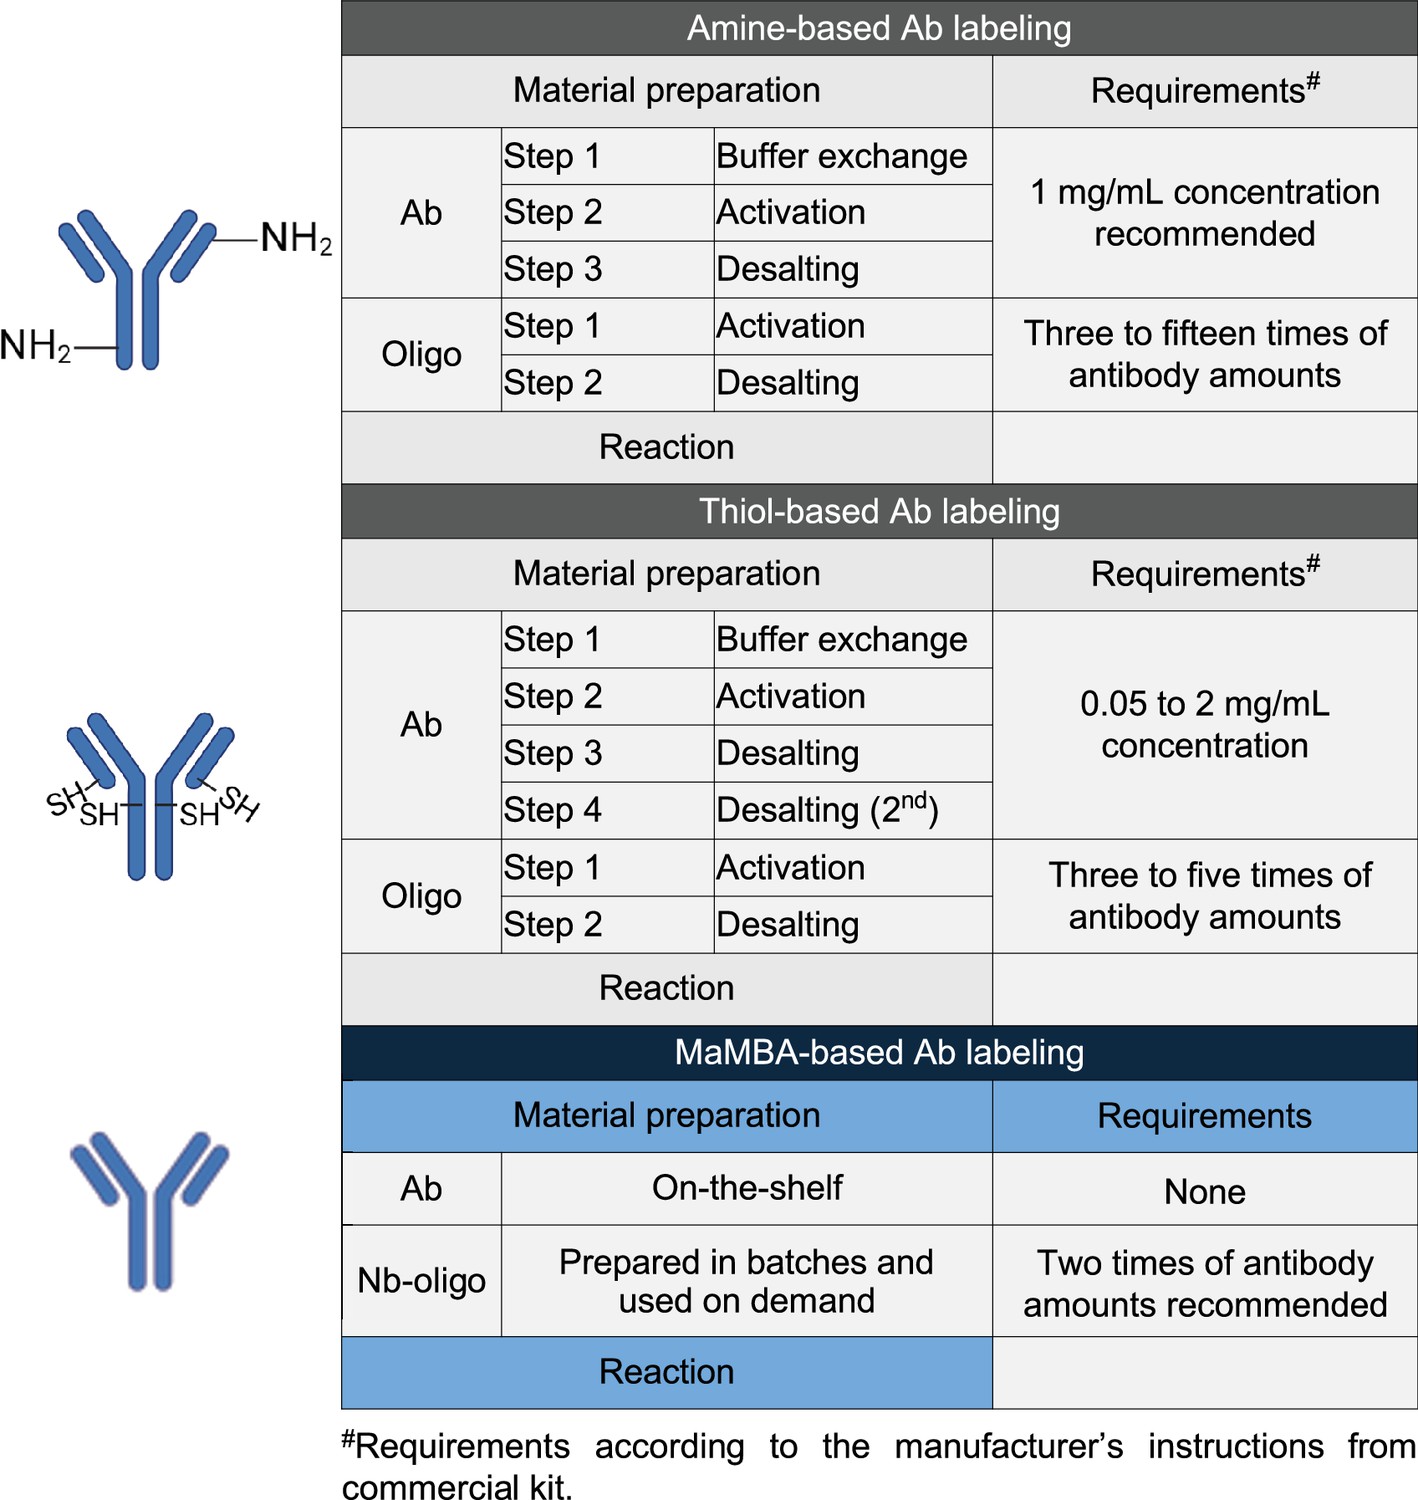
Comparison of the amine-based, thiol-based, and multiplexed and modular barcoding of antibodies (MaMBA)-based antibody labeling methods.
This panel was created using BioRender.com.
Figure 2 with 3 supplements
Multi-round immunostaining using misHCRn.
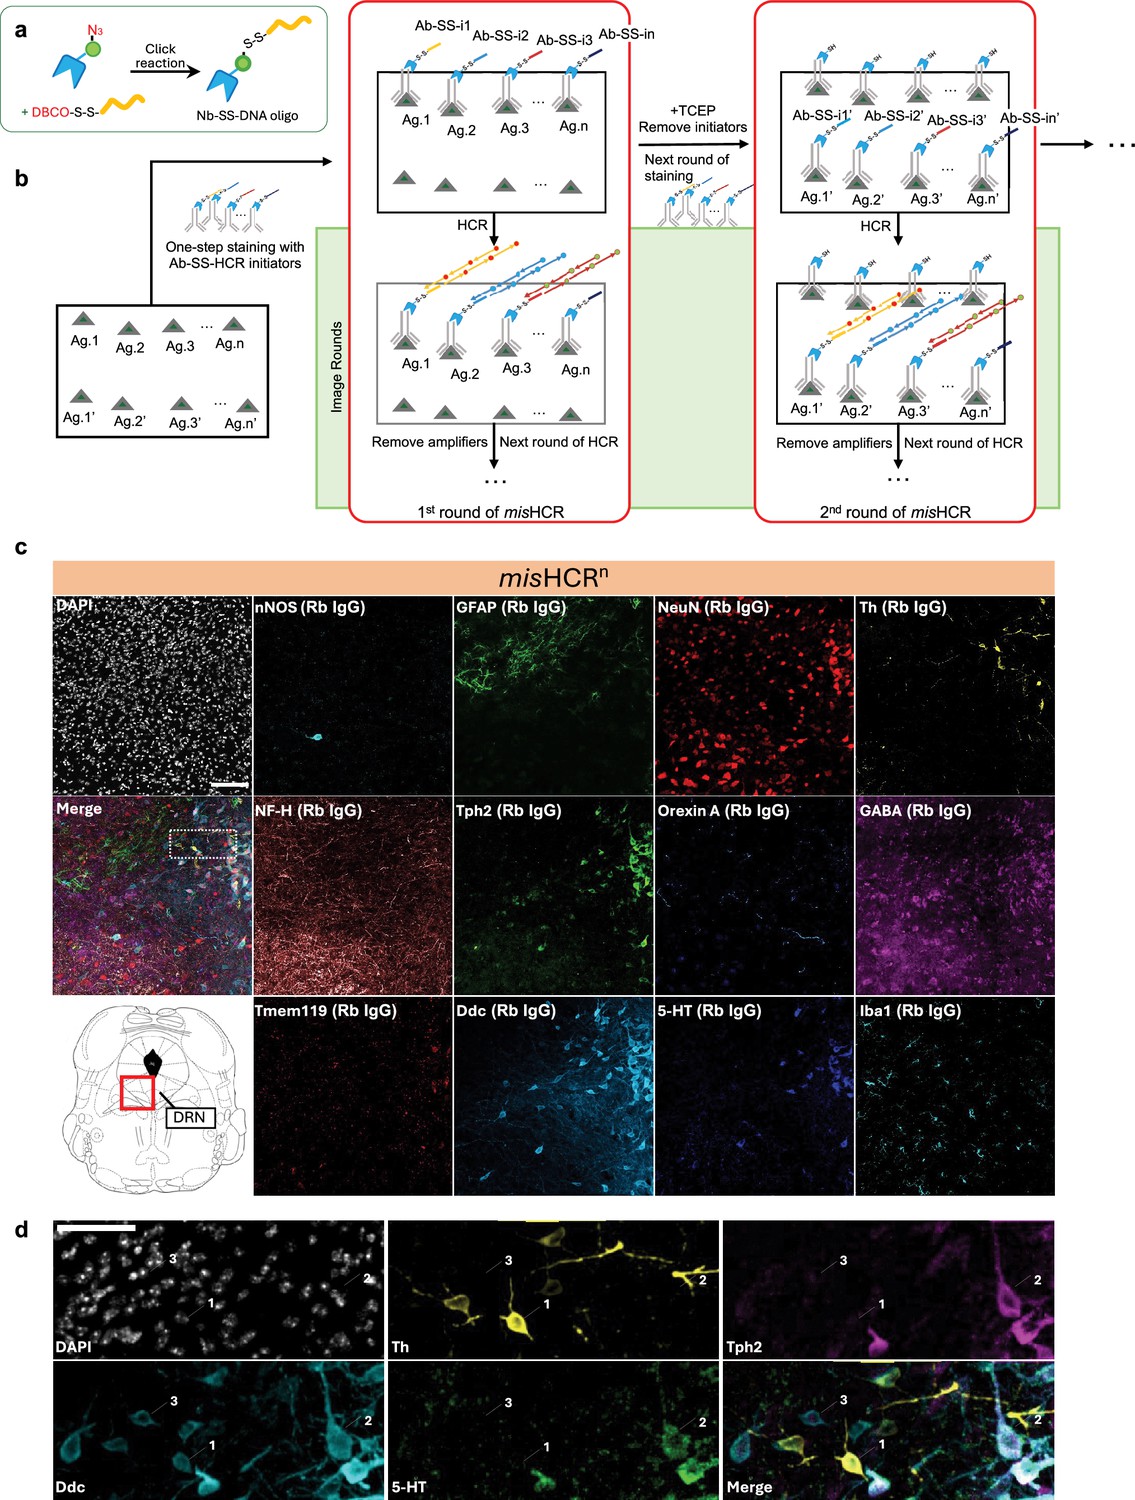
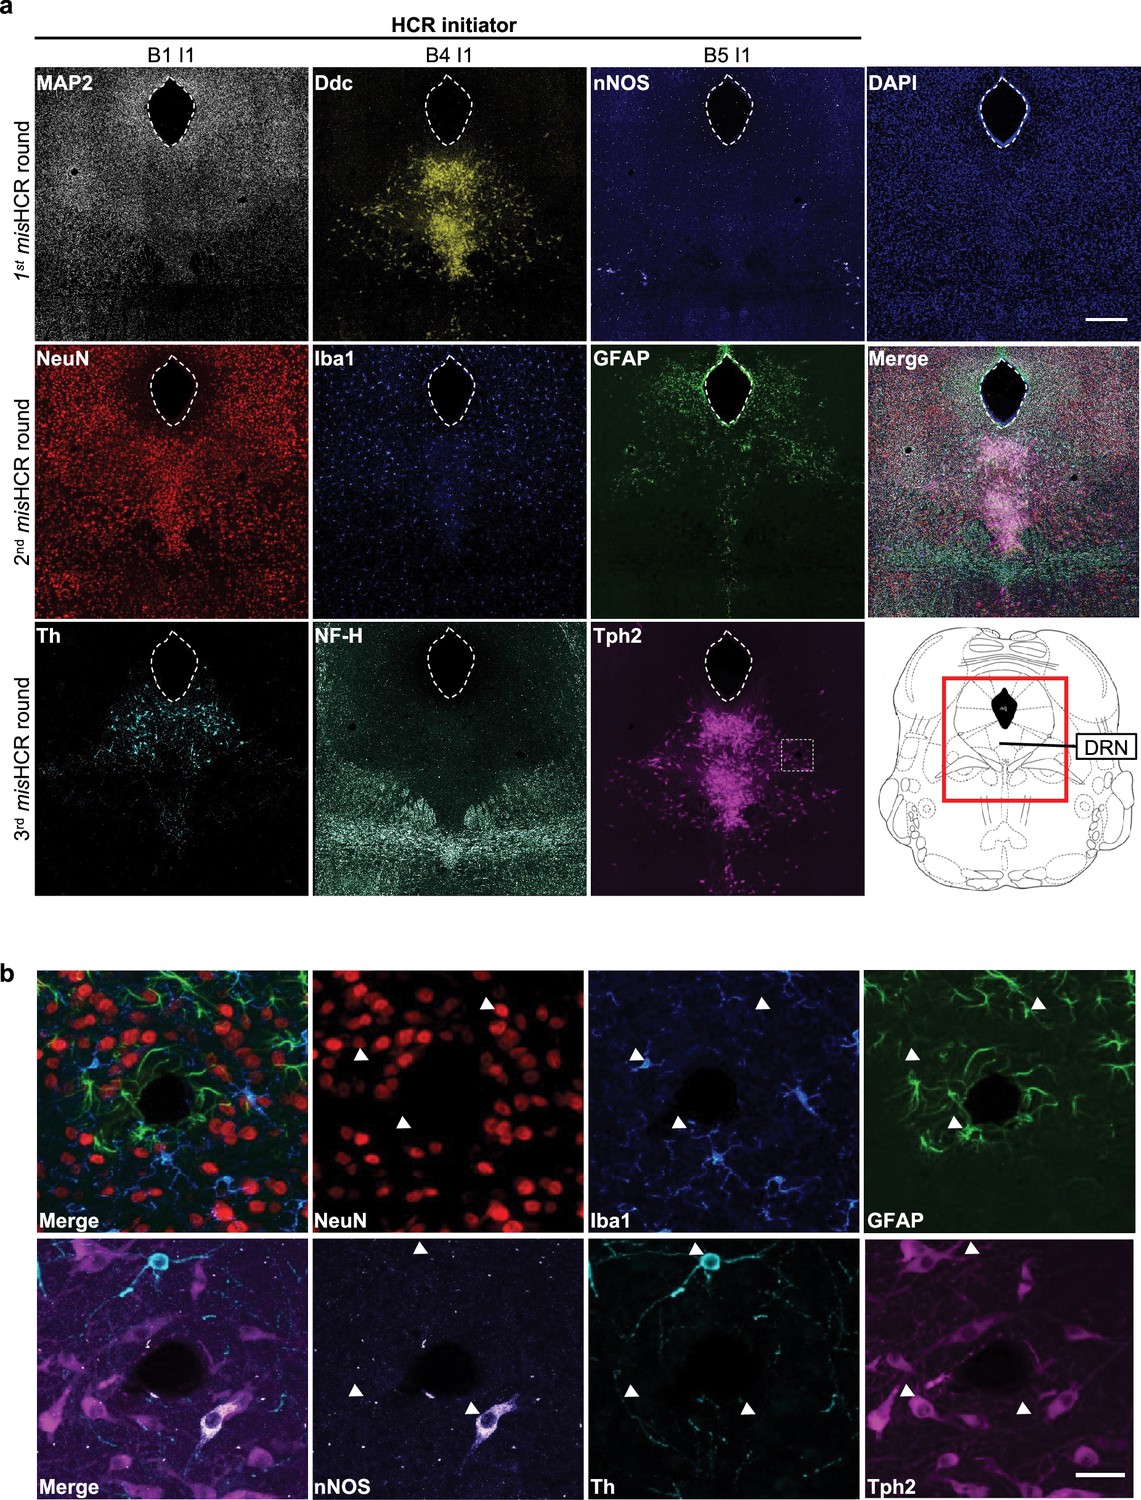
(a) Schematics of the production process for cleavable DNA oligo-conjugated nanobodies. (b) Workflow of misHCRn staining and imaging. The process begins with the first round of staining (1st round of misHCR), where a pool of primary antibodies barcoded with orthogonal cleavable hybridization chain reaction (HCR) initiators (Ab-SS-i1 to Ab-SS-in) is applied to the sample simultaneously. This is followed by sequential rounds of HCR imaging (image rounds). Upon completion of the image rounds, HCR initiators are removed using TCEP to cleave the disulfide bonds, enabling the start of the second round of staining (2nd round of misHCR). Antibodies used in the 2nd round of misHCR can be equipped with the same set of HCR initiators as in the 1st round of misHCR (Ab-SS-i1’ to Ab-SS-in’). This process can be iteratively performed for multi-round misHCR. (c) Fluorescence confocal images of the dorsal raphe nucleus (DRN) in a mouse brain section, stained for 12 antigens by misHCR (Scott et al., 2012) and counterstained with DAPI. The imaging location is highlighted in the red boxed region of the mouse brain atlas shown at the bottom left. IgG types of the employed antibodies are indicated in parentheses. Scale bar, 100 μm. (d) Zoomed-in views of the region marked by a dotted box in panel (c). Arrows indicate three cell types (1, Ddc+Th+Tph2- cells; 2, Ddc+Th-Tph2+ cells; 3, Ddc+Th-Tph2-5-HT- cells). Scale bar, 50 μm. nNOS, neuronal nitric oxide synthase; GFAP, glial fibrillary acidic protein; NF-H, neurofilament H; Tph2, tryptophan hydroxylase 2; GABA, gamma-aminobutyric acid; Tmem119, transmembrane protein 119; Ddc, DOPA decarboxylase; 5-HT, 5-hydroxytryptamine; Iba1, ionized calcium binding adaptor molecule.
-
Figure 2—source data 1
Source image file in Figure 2c.
- https://cdn.elifesciences.org/articles/105225/elife-105225-fig2-data1-v1.zip
Figure 2—figure supplement 1

Efficient multiplexed and modular barcoding of antibodies-assisted immunosignal hybridization chain reaction (misHCR) signal removal by TECP treatment.
Fluorescence confocal images of mouse brain sections before and after TCEP treatment to remove HCR amplifiers and initiators. The target molecules were MAP2, Ddc, and nNOS for the first round; neuronal nuclei (NeuN), Iba1, and GFAP for the second round; tyrosine hydroxylase (Th) and neurofilament H (NF-H) for the third round. Scale bar, 300 μm. MAP2, microtubule-associated protein 2.
-
Figure 2—figure supplement 1—source data 1
Source image files in Figure 2—figure supplement 1.
- https://cdn.elifesciences.org/articles/105225/elife-105225-fig2-figsupp1-data1-v1.zip
Figure 2—figure supplement 2
misHCRn for immunostaining nine target antigens using three orthogonal hybridization chain reaction (HCR) initiators.
(a) Fluorescence confocal images of mouse brain sections stained against nine targets by three rounds of multiplexed and modular barcoding of antibodies-assisted immunosignal HCR (misHCR). The red boxed region of the mouse brain atlas shown in the bottom right indicates the imaging location. Scale bar, 300 μm. (b) Zoomed-in views of the dotted box region marked in a. Scale bar, 25 μm.
-
Figure 2—figure supplement 2—source data 1
Source image file in Figure 2—figure supplement 2.
Due to the large size, the files are deposited on a public repository (Zenodo; DOI: 10.5281/zenodo.15790283).
- https://cdn.elifesciences.org/articles/105225/elife-105225-fig2-figsupp2-data1-v1.xlsx
Figure 2—figure supplement 3
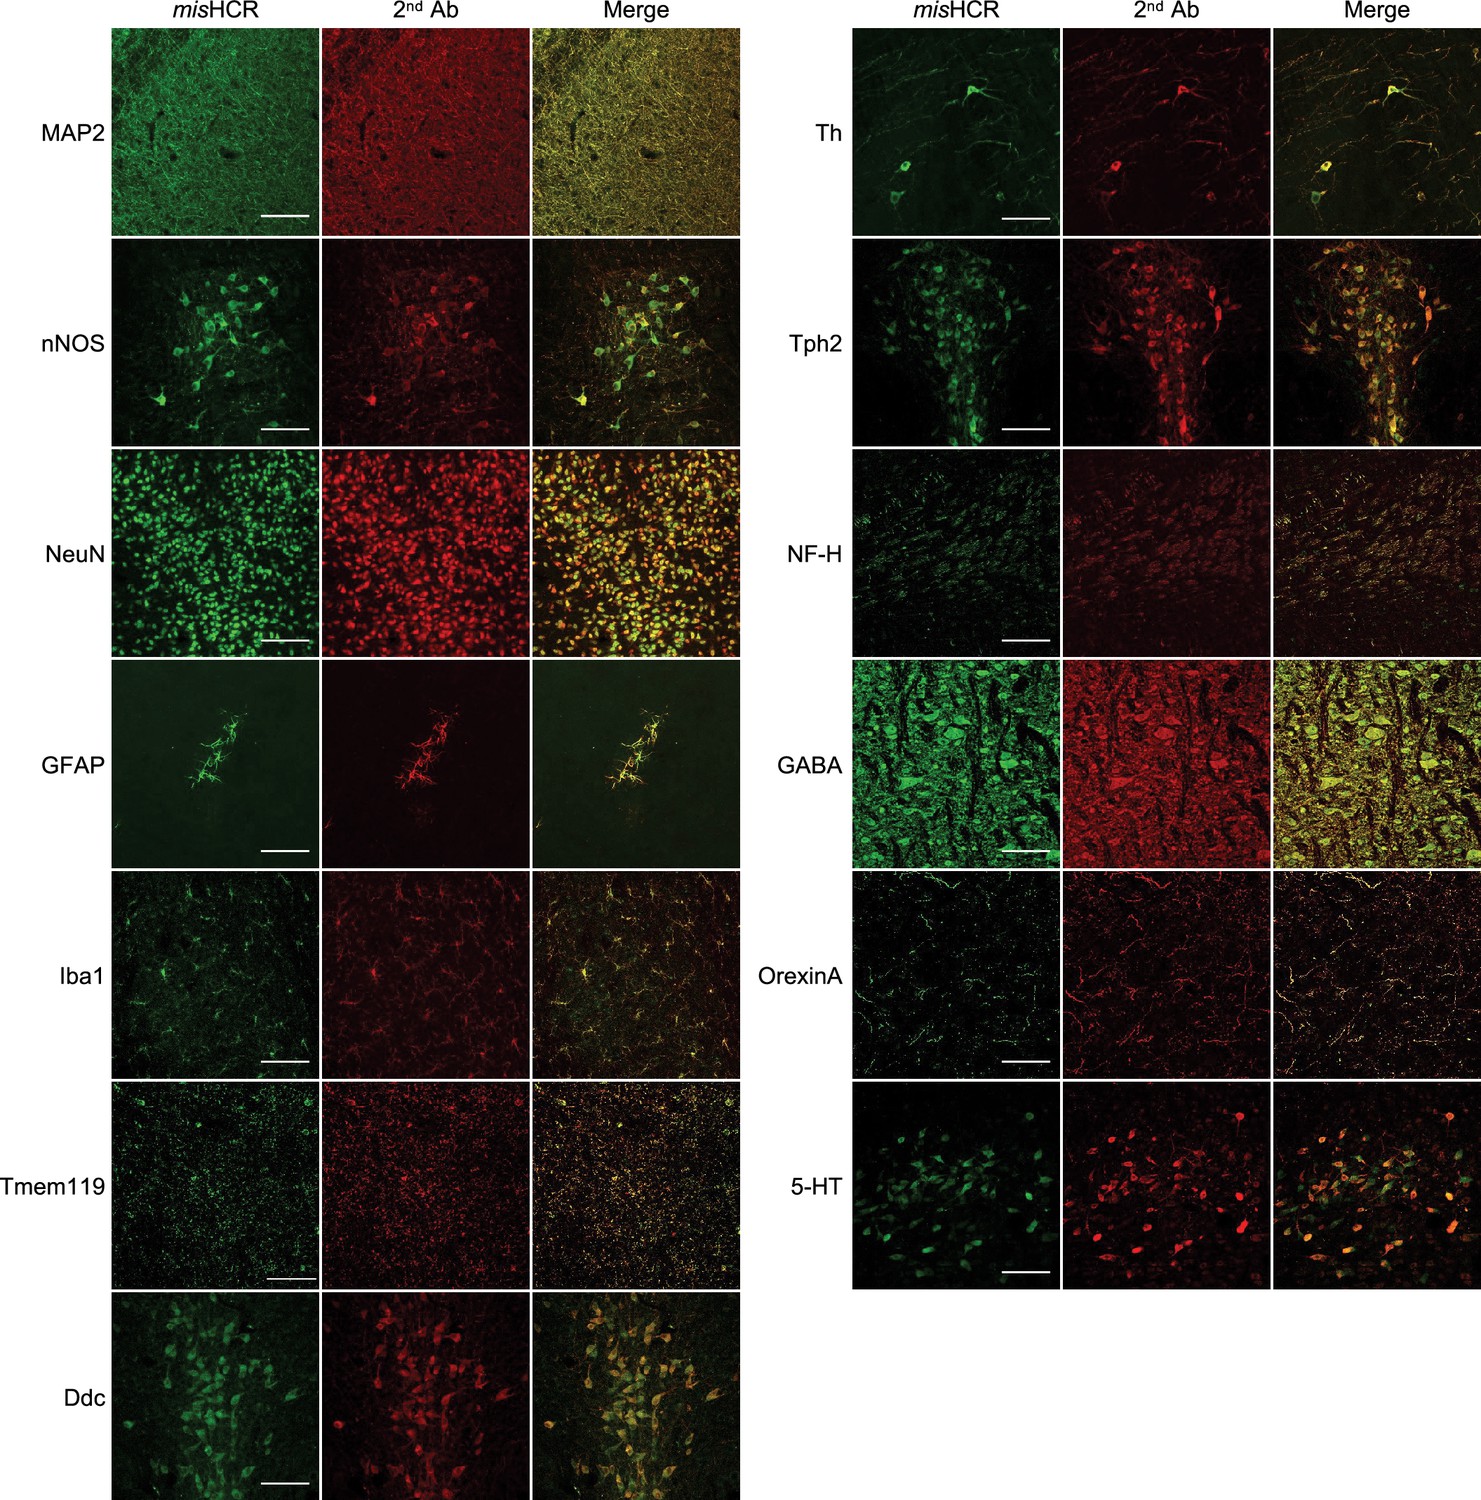
Validation of the specificity of multiplexed and modular barcoding of antibodies-assisted immunosignal hybridization chain reaction (misHCR).
Mouse brain sections were immunostained with primary antibodies against different antigens, followed by and simultaneous incubation with equal amounts of fluorophore-conjugated secondary antibodies (2nd Ab) and Nb-HCR initiators (misHCR). Scale bar, 100 μm.
-
Figure 2—figure supplement 3—source data 1
Source image files in Figure 2—figure supplement 3.
- https://cdn.elifesciences.org/articles/105225/elife-105225-fig2-figsupp3-data1-v1.zip
Figure 3 with 1 supplement
Barcode-linked immunosorbent assay (BLISA).
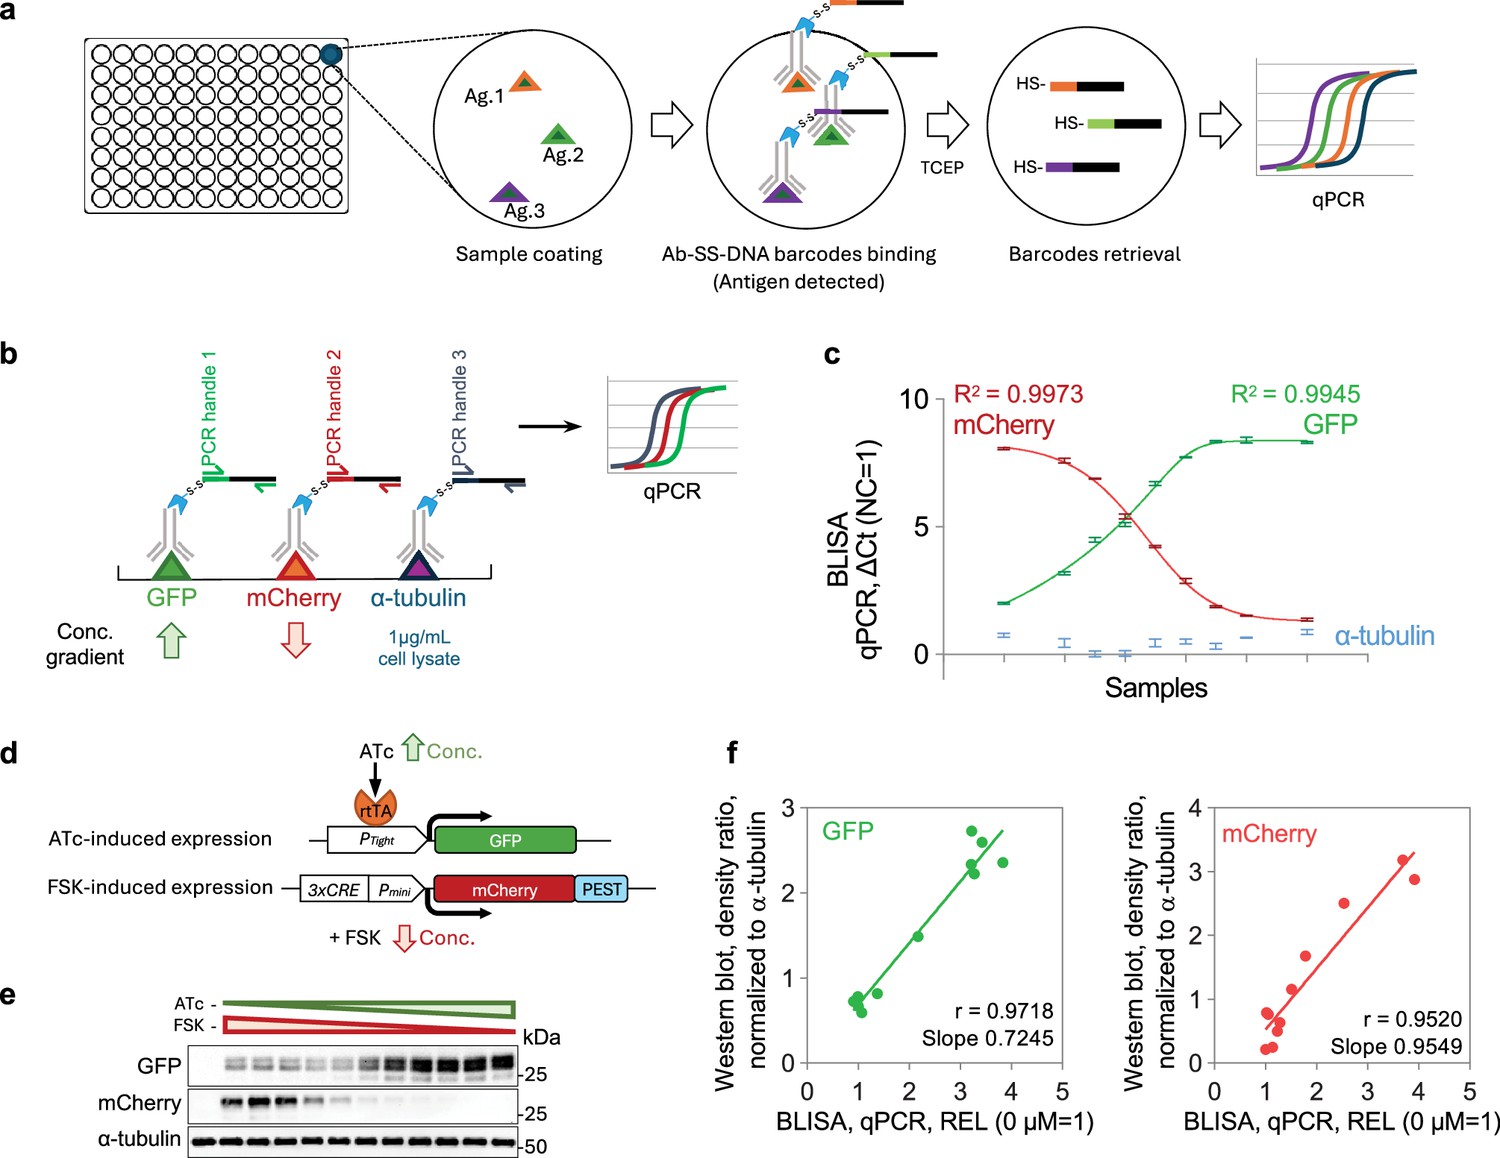
(a) Workflow of direct antigen detection using BLISA. (b) Schematics of multiplexed detection for GFP, mCherry, and α-tubulin using BLISA. (c) Quantification of spiked-in purified GFP, spiked-in purified mCherry, and endogenous α-tubulin in cell lysates using quantitative PCR (qPCR)-based BLISA. Negative control (NC) represents cell lysates without spiked-in proteins. ΔCt values are normalized to the NC group, where ΔCt (NC = 1) = CtNC – CtTarget+1. The dose-response curves for purified GFP (green) and mCherry (red) are fitted using a five-parameter logistic (5PL) function. n=3 replicates; mean ± s.e.m. (d) Schematics of two drug-inducible gene expression systems for expressing GFP and mCherry in HEK293T cells. (e) Western blot of cell samples treated with varying concentrations of ATc and FSK. (f) Pearson’s correlation between BLISA and western blot results for measuring relative expression levels (REL, normalized to α-tubulin) of GFP (left) and mCherry (right). REL = 2–(CtGFP/mCherry-Ctα-tubulin). ATc, anhydrotetracycline hydrochloride; FSK, forskolin.
-
Figure 3—source data 1
Original files for western blots displayed in Figure 3e.
- https://cdn.elifesciences.org/articles/105225/elife-105225-fig3-data1-v1.zip
-
Figure 3—source data 2
PDF files for western blots in Figure 3e, indicating the relevant bands.
- https://cdn.elifesciences.org/articles/105225/elife-105225-fig3-data2-v1.zip
Figure 3—figure supplement 1
Barcode-linked immunosorbent assay (BLISA) for detecting proteins endogenously expressed in cells.
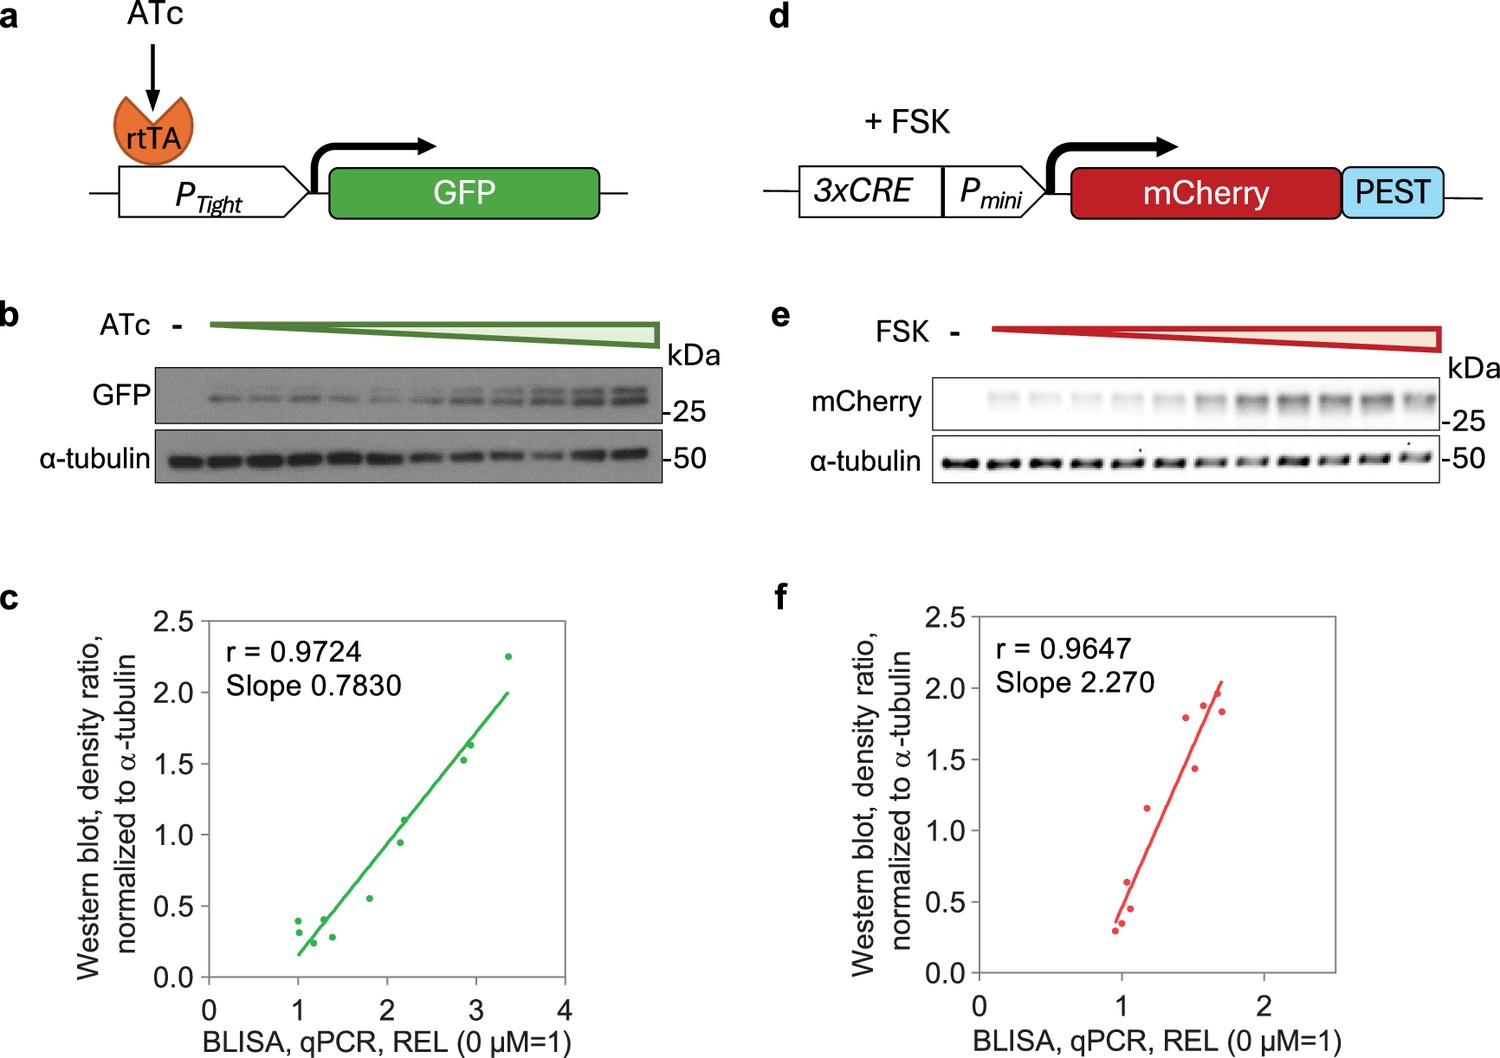
(a) Schematics of the tetracycline-regulated gene expression system for driving GFP expression. (b) Western blot of cell samples treated with varying concentrations of ATc. (c) Pearson’s correlations between quantitative PCR (qPCR)-based BLISA and western blot results for measuring relative expression level (REL, normalized to α-tubulin) of GFP. REL = 2–(CtGFP-Ctα-tubulin). (d) Schematics of the cAMP response element-mediated gene expression system for driving mCherry expression. (e) Western blot of cell samples treated with varying concentrations of FSK. (f) Pearson’s correlations between qPCR-based BLISA and western blot results for measuring REL (normalized to α-tubulin) of mCherry. REL = 2-(CtmCherry-Ctα-tubulin).
-
Figure 3—figure supplement 1—source data 1
Original files for western blots displayed in Figure 3—figure supplement 1b and e.
- https://cdn.elifesciences.org/articles/105225/elife-105225-fig3-figsupp1-data1-v1.zip
-
Figure 3—figure supplement 1—source data 2
PDF files for western blots in Figure 3—figure supplement 1b and e, indicating the relevant bands.
- https://cdn.elifesciences.org/articles/105225/elife-105225-fig3-figsupp1-data2-v1.zip
Figure 4 with 2 supplements
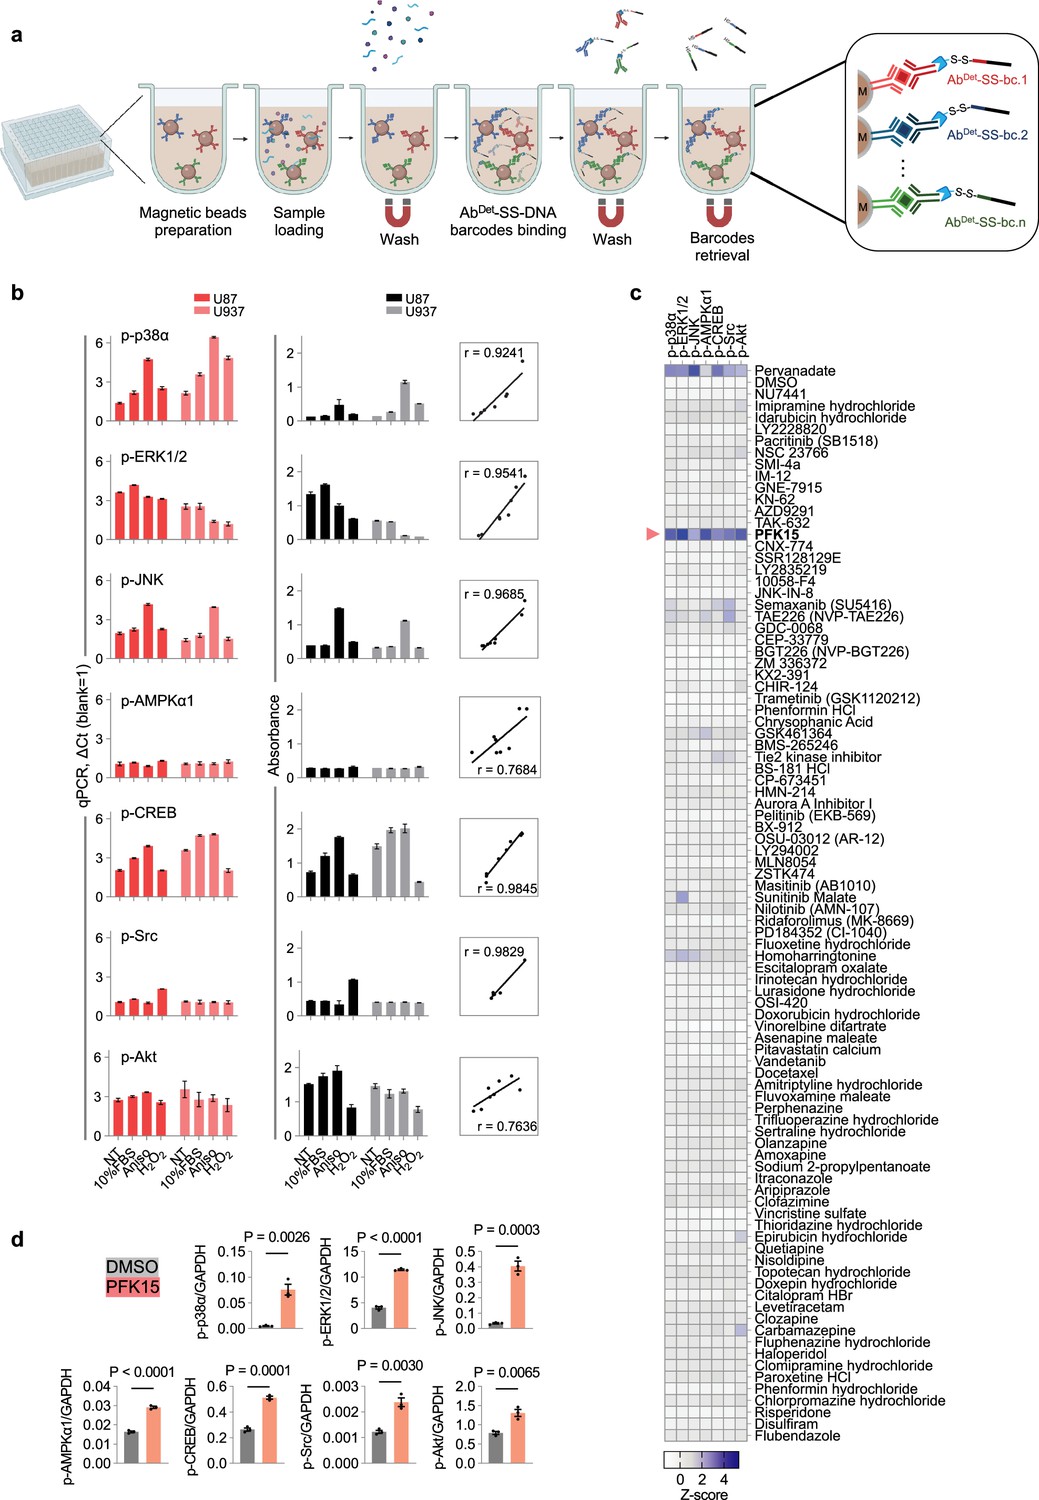
Magnetic bead-based barcode-linked immunosorbent assay (BLISA) for multiplexed detection.
(a) Workflow of the magnetic bead-based BLISA. This panel was created using BioRender.com. (b) Comparison of 7-plex BLISA (left) and enzyme-linked immunosorbent assay (ELISA) (middle) for detecting the phosphorylation of seven endogenous proteins in U87 and U937 cells under various culture conditions. The right panel shows Pearson’s correlation coefficients between BLISA and ELISA results for each target protein. n=3 replicates; mean ± s.e.m. (c) Heatmap showing average Z-scores of the phosphorylation levels of seven proteins in U87 cells following different drug treatments. n=2 biological replicates. (d) ELISA quantification of phosphorylation levels for seven proteins in U87 cells. n=3 biological replicates; two-sided t-tests. p-p38α, phospho-p38α (T180/Y182); p-ERK1/2, phospho-ERK1 (T202/Y204)/ERK2 (T185/Y187); p-JNK, phospho-JNK (Pan Specific); p-AMPKα1, phospho-AMPKα1 (T183); p-CREB, phospho-CREB (S133); p-Src, phospho-Src (Y419); p-Akt, phospho-Akt (S473); NT, non-treated; FBS, fetal bovine serum; Aniso, anisomycin.
Figure 4—figure supplement 1
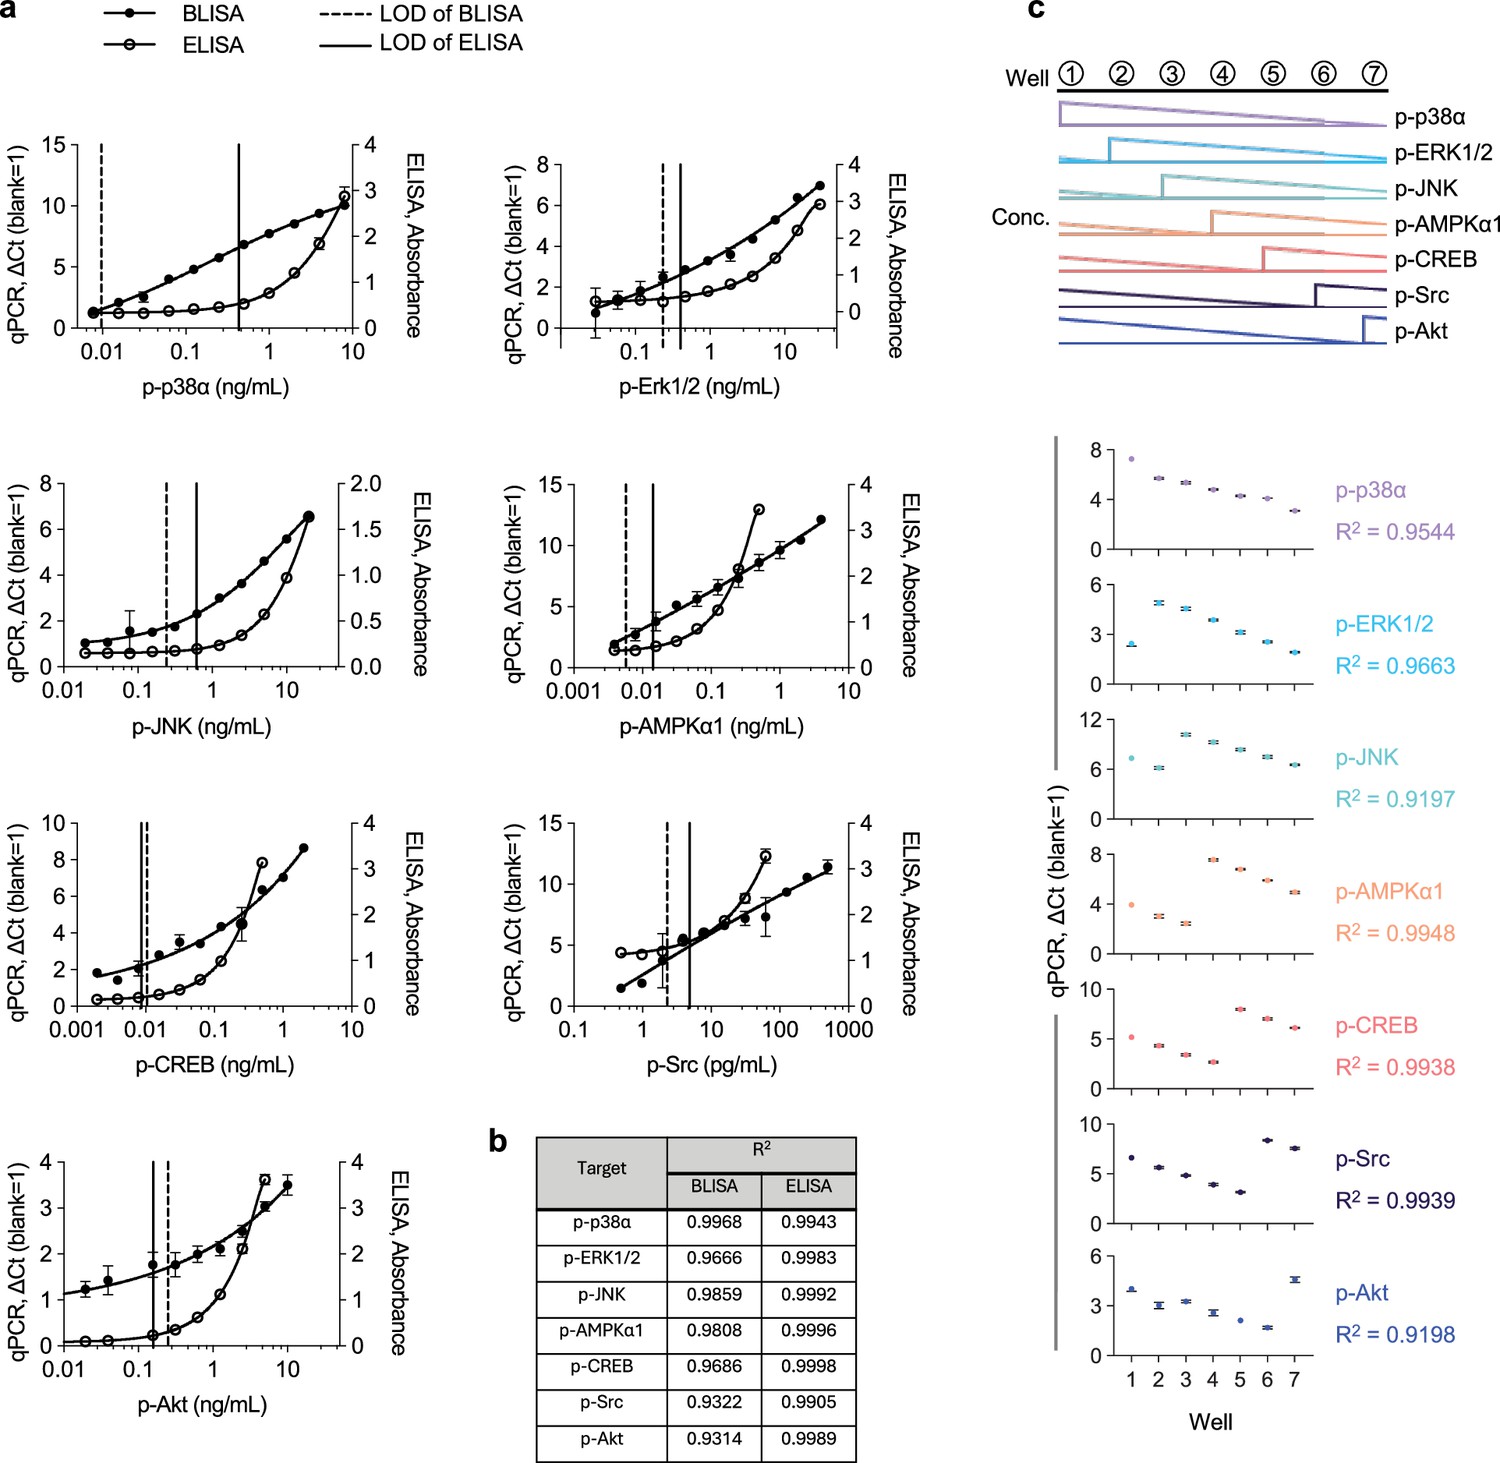
Comparative analysis of standard curves for magnetic bead-based barcode-linked immunosorbent assay (BLISA) and enzyme-linked immunosorbent assay (ELISA).
(a) Dose-response curves for seven purified phosphorylated proteins quantified using BLISA (quantitative PCR [qPCR], ΔCt) and ELISA (Absorbance). Curves were fitted using 4PL or 5PL functions. Limit of detection (LOD) was defined as the mean signal of the blank group plus three standard deviations. (b) R2 for the standard curves shown in a. (c) Multiplexed detection of seven purified phosphorylated proteins using magnetic bead-based BLISA. n=3 replicates; mean ± s.e.m.
Figure 4—figure supplement 2
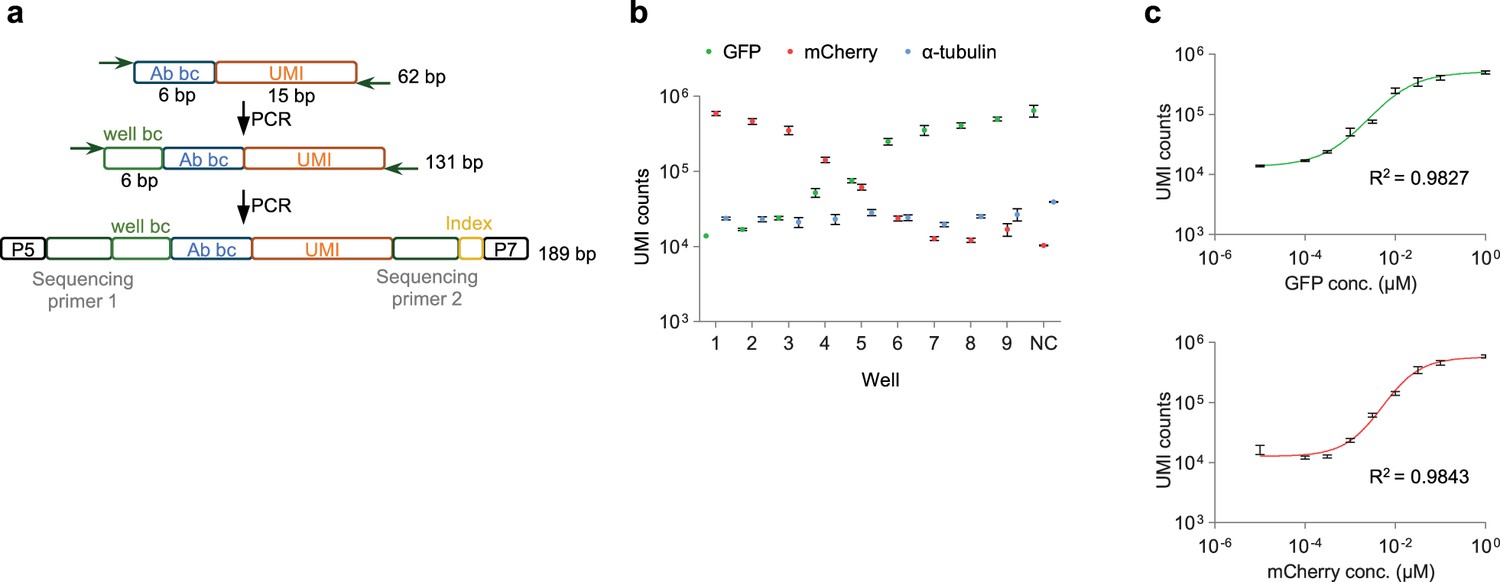
Validation of HTS-based barcode-linked immunosorbent assay (BLISA).
(a) Schematics of DNA barcode design and amplicon generation for BLISA sequencing. Released DNA barcodes undergo a two-step PCR protocol for well barcode (well-bc) addition and Illumina sequencing adaptors tagging. (b) Unique molecular identifier (UMI) counts for three target proteins (GFP, mCherry, and α-tubulin) in cell lysates spiked in with varying concentrations of GFP and mCherry. n=3 replicates; mean ± s.e.m. (c) Dose-response curves for the GFP (upper) and mCherry (bottom) fitted using a 5PL function. n=3 replicates; mean ± s.e.m.
Figure 5 with 3 supplements
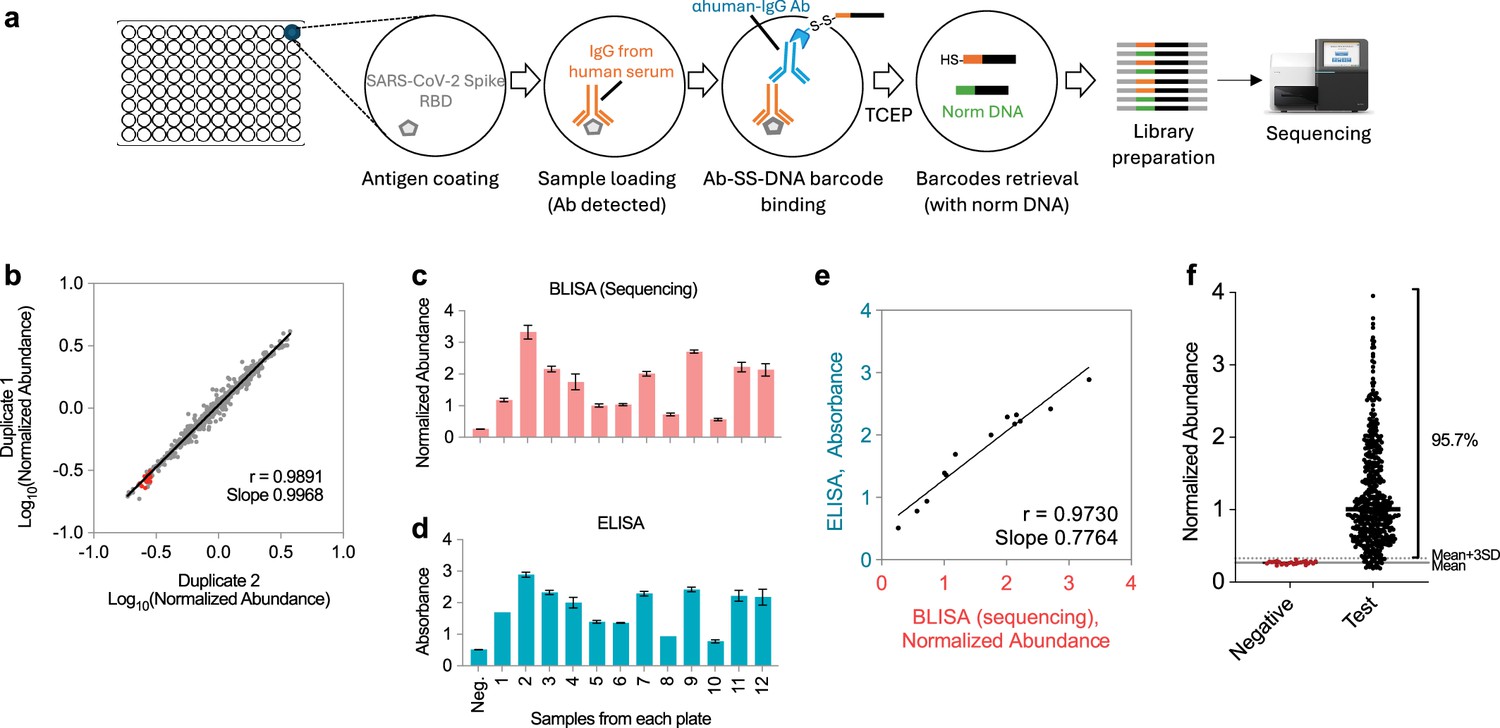
HTS-based barcode-linked immunosorbent assay (BLISA) for high-throughput detection of IgGs in human serum samples.
(a) Workflow of sandwich immunoassay-based IgG detection using BLISA. (b) Pearson’s correlation between results from two technical duplicates. Red dots represent negative samples. (c,d) Quantification of anti-receptor binding domain (RBD) IgG levels in 12 samples from vaccinated donors using HTS-based BLISA (c) and enzyme-linked immunosorbent assay (ELISA) (d). n = 2 replicates; mean ± s.e.m. (e) Pearson’s correlation between BLISA and ELISA results shown in (c) and (d). (f) Distribution of normalized IgG abundance in negative and test samples (n=493 samples). Red dots represent negative samples. The solid gray line indicates the mean normalized abundance of negative samples. The dotted gray line represents the mean plus three standard deviations (mean + 3 SD).
Figure 5—figure supplement 1

Comparative analysis of the sensitivity of barcode-linked immunosorbent assay (BLISA) and enzyme-linked immunosorbent assay (ELISA) for human IgG detection.
(a) Schematics of ELISA (left) and BLISA (right) for human IgG detection. (b) Dose-response curves for human IgG detection by BLISA and ELISA fitted using a five-parameter logistic (5PL) function. The dynamic ranges of ELISA (blue) and BLISA (red) are indicated by dashed lines, spanning from the limit of quantification (LOQ) to the lower limit of 95% confidence interval. n=3 replicates; mean ± s.e.m. (c) Pearson’s correlation between quantitative PCR (qPCR)-based BLISA and ELISA results for anti-receptor binding domain (RBD) IgG detection. The red dot represents the negative sample.
Figure 5—figure supplement 2
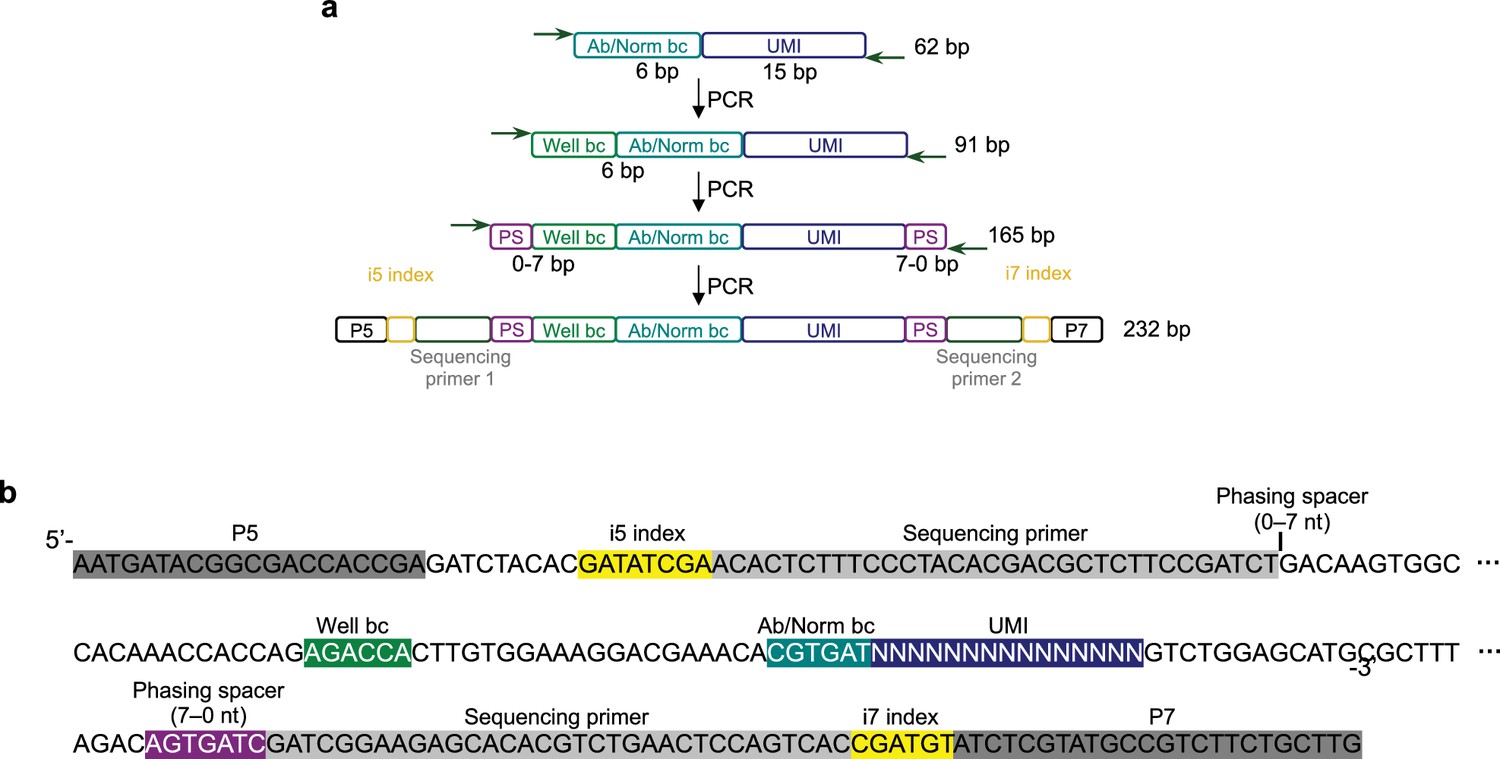
Sequencing library preparation for barcode-linked immunosorbent assay (BLISA).
(a) Schematics of sequencing amplicon generation procedure. (b) Annotated amplicon sequence of BLISA for Illumina sequencing.
Figure 5—figure supplement 3
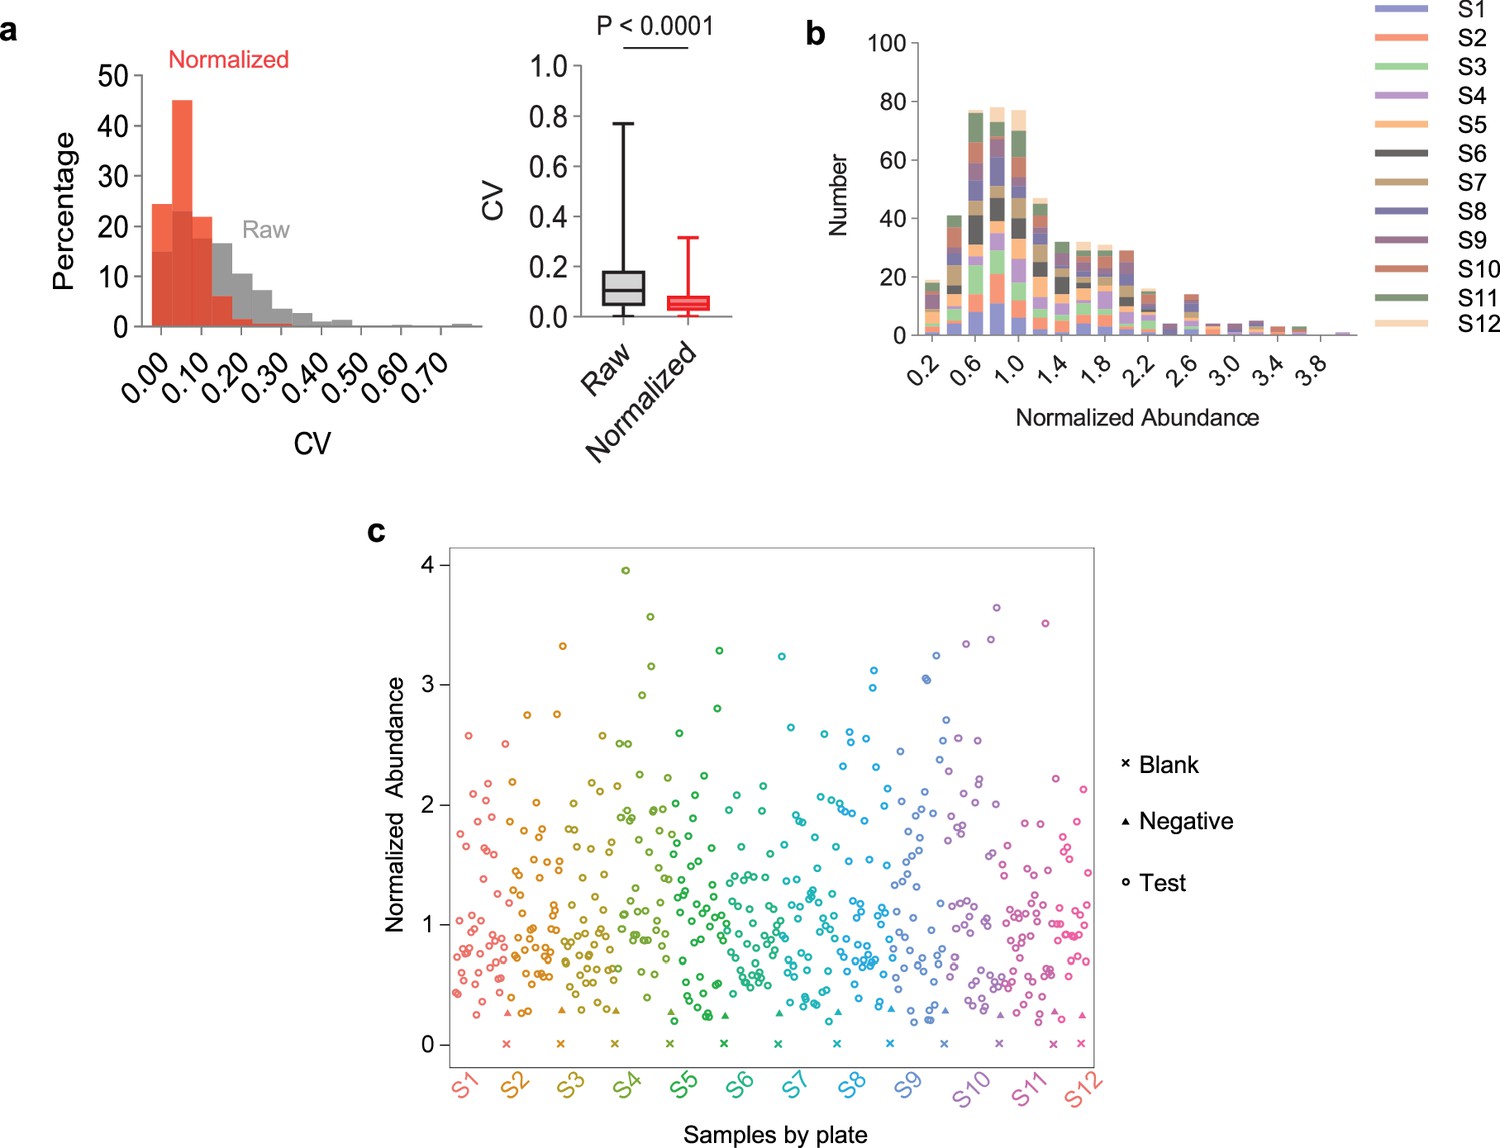
Quantification of anti-receptor binding domain (RBD) IgG in human serum samples using HTS-based barcode-linked immunosorbent assay (BLISA).
(a) Comparison of coefficient of variation (CV) between duplicates for raw (gray) and normalized (red) data. Histogram shows relative distributions of CV between duplicates. Box plots show median, interquartile range, and whiskers extending to the minimum and maximum. n=513 samples with duplicates; two-sided paired t-test. (b) Frequency distribution of normalized anti-RBD IgG abundances of test samples across assay plates. (c) Scatter plot of normalized anti-RBD IgG abundances of individual serum samples (n=517) quantified using HTS-based BLISA. Each plate includes a negative control sample in duplicates.
Figure 6 with 2 supplements
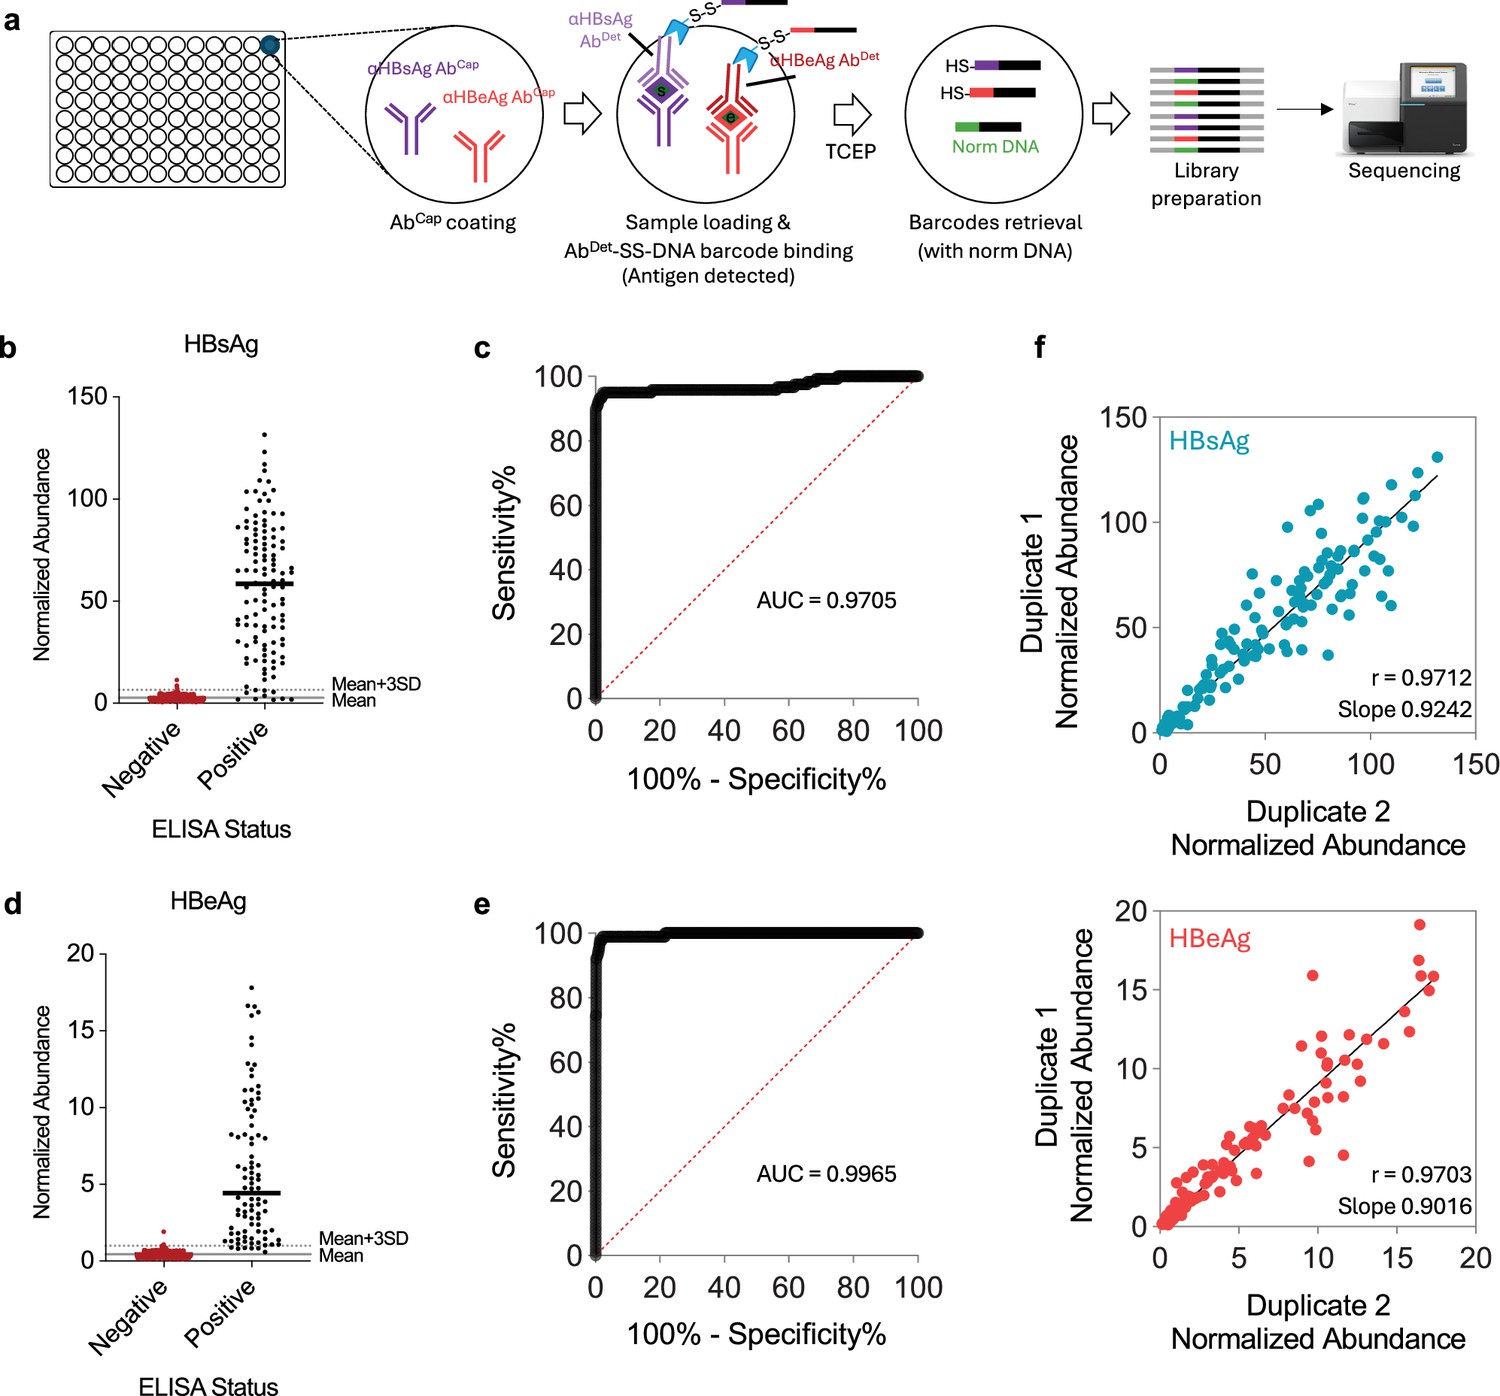
HTS-based barcode-linked immunosorbent assay (BLISA) for high-throughput simultaneous detection of two hepatitis B virus (HBV) antigens in human serum samples.
(a) Workflow of sandwich immunoassay-based HBV antigen detection using BLISA. (b, c) Sensitivity and specificity of 2-plex BLISA for detecting hepatitis B surface antigen (HBsAg). n=462 enzyme-linked immunosorbent assay (ELISA)-negative samples from cohort 2; n=119 ELISA-positive samples from cohort 2. (d, e) Sensitivity and specificity of 2-plex BLISA on detecting hepatitis B e antigen (HBeAg). n=505 ELISA-negative samples from cohort 2; n=90 ELISA-positive samples from cohort 2. Solid gray lines indicate the mean normalized abundance of ELISA-confirmed negative samples. Dotted gray lines represent the mean plus three standard deviations (mean + 3 SD). (f) Pearson’s correlations between technical duplicates for HBsAg (upper) and HBeAg (bottom) measurements in serum samples from cohort 2 (n=600).
Figure 6—figure supplement 1
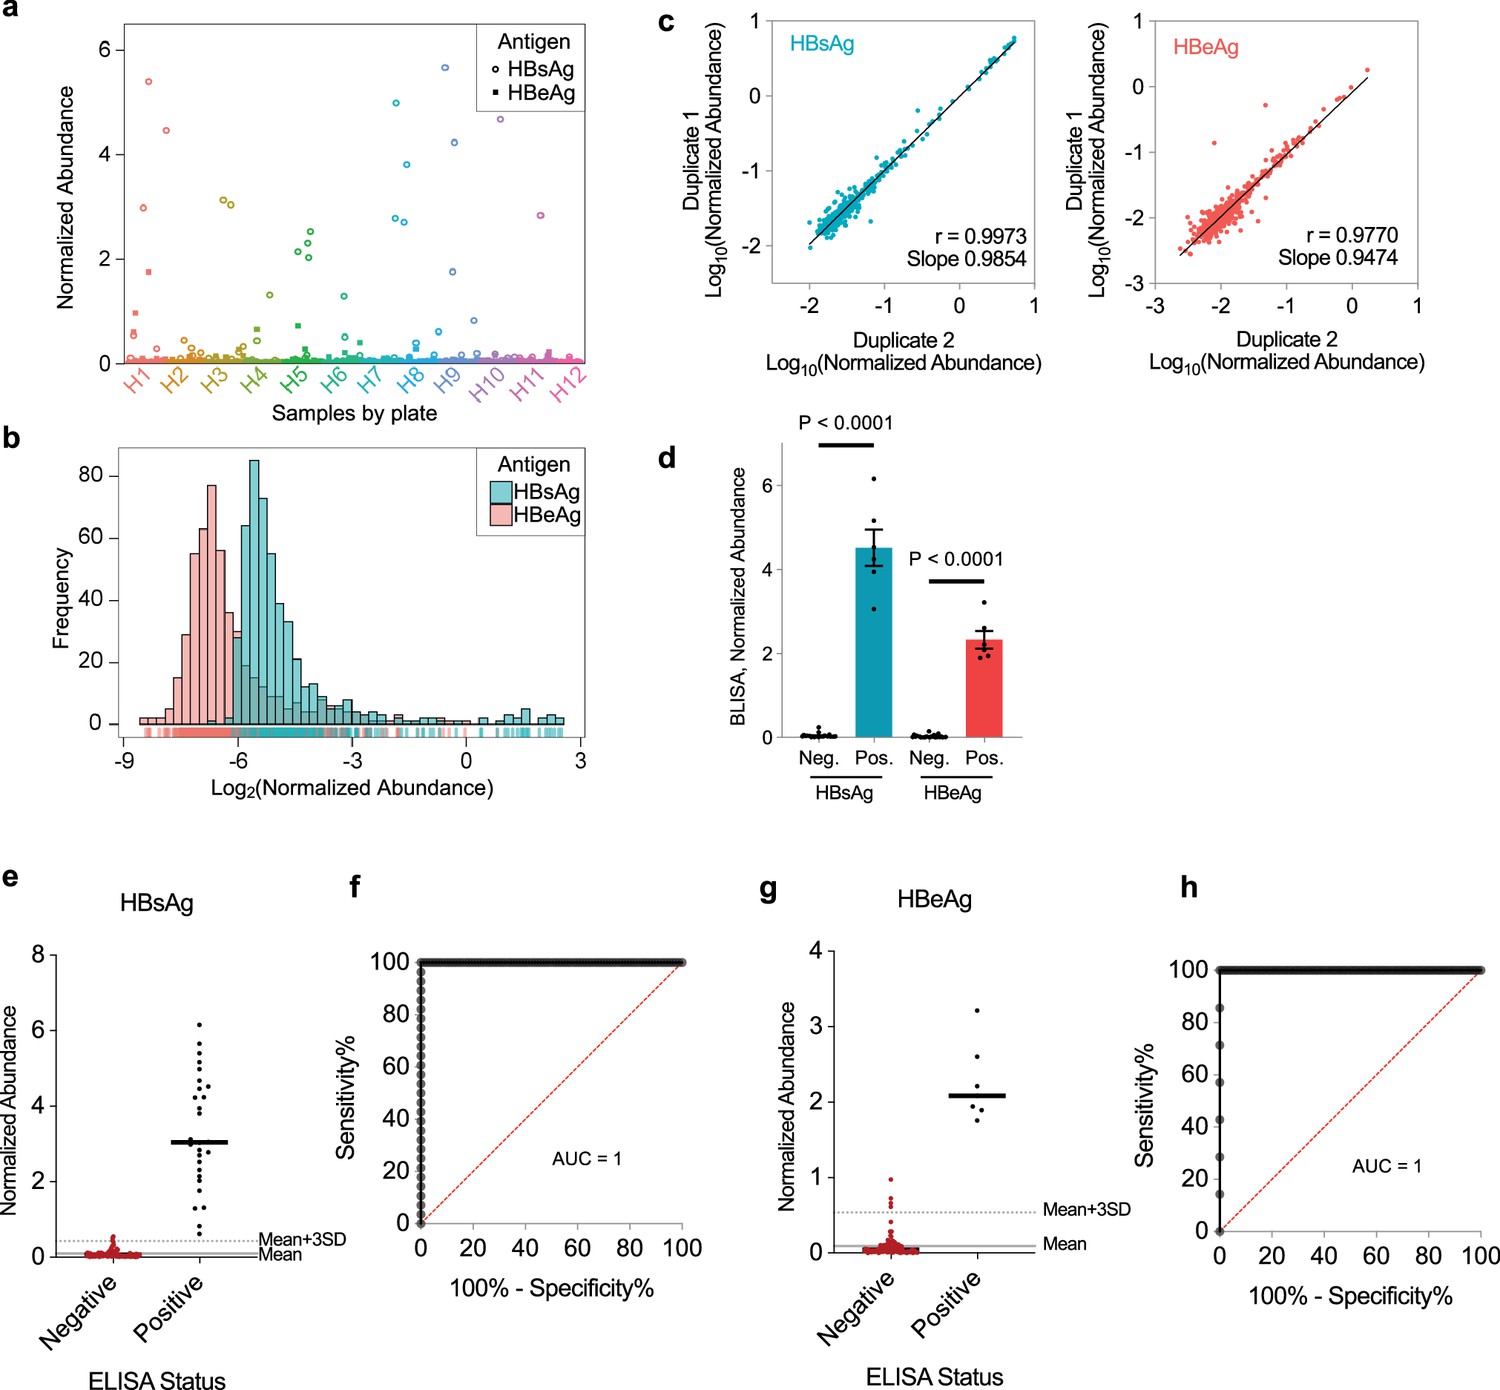
HTS-based barcode-linked immunosorbent assay (BLISA) for high-throughput detection of two hepatitis B virus (HBV) antigens in serum samples from cohort 1.
(a) Scatter plot of normalized hepatitis B surface antigen (HBsAg) and hepatitis B e antigen (HBeAg) abundances of individual serum samples (n=529) quantified using HTS-based 2-plex BLISA. (b) Frequency distributions of normalized HBsAg (blue) and HBeAg (red) abundances of test samples. (c) Pearson’s correlation between technical duplicates for HBsAg (left) and HBeAg (right) measurements. (d) HBsAg and HBeAg levels of control samples in cohort 1 measured by HTS-based BLISA. Histogram of normalized HBsAg and HBeAg abundances in negative (HBsAg-HBeAg-) and positive (HBsAg+HBeAg+) control groups was quantified using HTS-based BLISA. n=25 for HBsAg-HBeAg- and 6 for HBsAg+HBeAg+; mean ± s.e.m. Two-sided unpaired t-tests. (e, f) Sensitivity and specificity of 2-plex BLISA for detecting HBsAg. n=87 ELISA-negative samples and 28 ELISA-positive samples from cohort 1. (g, h) Sensitivity and specificity of 2-plex BLISA for detecting HBeAg. n=108 ELISA-negative samples and 7 ELISA-positive samples from cohort 1. Solid gray lines indicate the mean normalized abundance of ELISA-confirmed negative samples. Dotted gray lines represent the mean plus three standard deviations (mean + 3 SD).
Figure 6—figure supplement 2
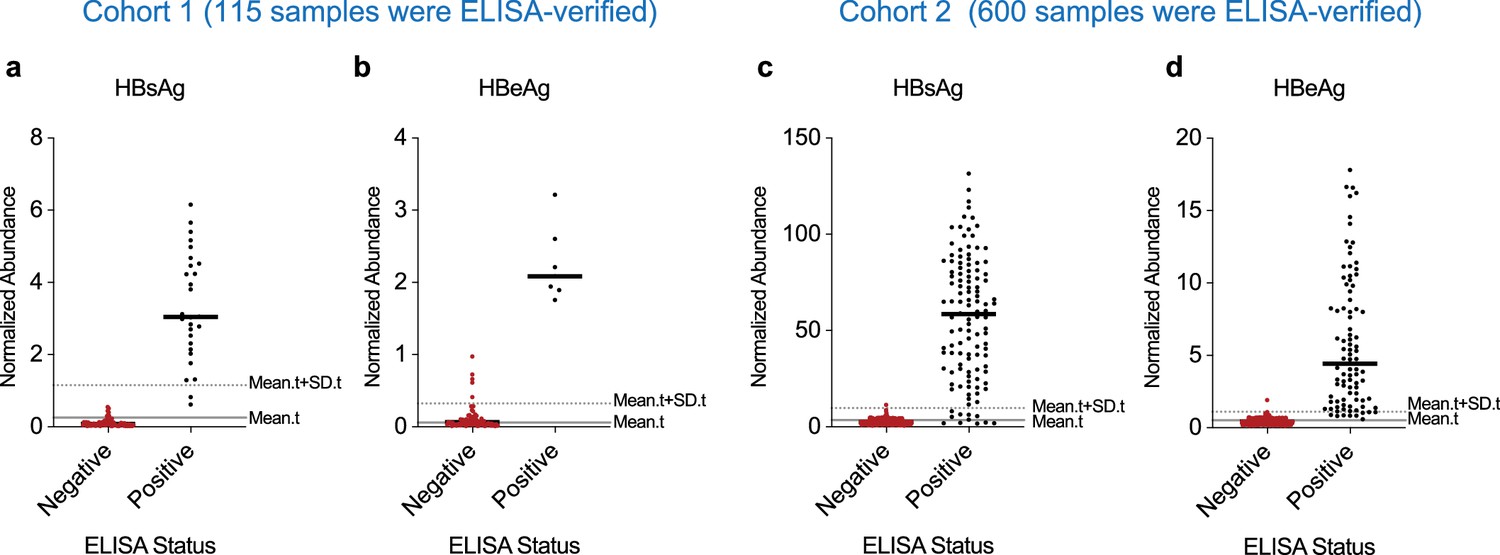
Performance evaluation of 2-plex barcode-linked immunosorbent assay (BLISA) for detecting hepatitis B virus (HBV) antigens using enzyme-linked immunosorbent assay (ELISA)-independent thresholds.
(a, b) Sensitivity and specificity of 2-plex BLISA for detecting hepatitis B surface antigen (HBsAg) (a) and hepatitis B e antigen (HBeAg) (b) in serum samples from cohort 1. Solid gray lines indicate the mean normalized abundance of test samples (mean.t; n=529). Dotted gray lines represent the mean + standard deviations (mean.t + SD .t). (c, d) Sensitivity and specificity of 2-plex BLISA for detecting HBsAg (c) and HBeAg (d) in serum samples from cohort 2. Solid gray lines indicate the mean normalized abundance of test samples (mean.t; n=500). Dotted gray lines represent the mean + standard deviations (mean.t + SD .t).
Tables
Key resources table
| Reagent type (species) or resource | Designation | Source or reference | Identifiers | Additional information |
|---|---|---|---|---|
| Strain, strain background (Escherichia coli) | SHuffe | Weidibio | Cat#EC2031 | |
| Strain, strain background (Escherichia coli) | BL21 (DE3) | TransGen Biotech | Cat#CD601 | |
| Strain, strain background (Mus musculus) | C57BL/6N | Beijing Vital River | RRID:MGI:2159965 | |
| Cell line (Homo sapiens) | HEK293T | ATCC | CRL-3216; RRID:CVCL_0063 | |
| Cell line (Homo sapiens) | HeLa | ATCC | CCL-2; RRID:CVCL_0030 | |
| Cell line (Homo sapiens) | U-87 MG | ATCC | HTB-14; RRID:CVCL_0022 | |
| Cell line (Homo sapiens) | U-937 | ATCC | CRL-1593.2; RRID:CVCL_0007 | |
| Chemical compound, drug | DBCO-PEG3-SS-NHS | Conju-Probe | Cat#CP-2089; CAS: 2163772-16-3 | |
| Chemical compound, drug | Anhydrotetracycline hydrochloride (ATc) | J&K | Cat#541642; CAS: 13803-65-1 | |
| Chemical compound, drug | Forskolin (FSK) | Sigma-Aldrich | Cat#F3917; CAS: 66575-29-9 | |
| Chemical compound, drug | 3-Isobutyl-1-methylxanthine (IBMX) | Sigma-Aldrich | Cat#I5879; CAS: 28822-58-4 | |
| Chemical compound, drug | Anisomycin | MedChem Express | Cat#CS-4981; CAS: 22862-76-6 | |
| Chemical compound, drug | Compounds in HTS-based BLISA | Other | N/A | See Supplementary file 1 |
| Transfected construct | PTight-EGFP-PGK-rtTA | This paper | N/A | See Supplementary file 4 |
| Transfected construct | 3×CRE-mCherry-PEST | This paper | N/A | See Supplementary file 4 |
| Biological sample (Homo sapiens) | Human healthy (male) and psoriasis (female) skins | Other | N/A | From Ting Chen’s Lab; see Materials and methods |
| Biological sample (Homo sapiens) | Human serum | Beijing, China | N/A | See Materials and methods |
| Antibody | anti-PDGFRα (Rabbit monoclonal) | Abcam | Cat#ab203491; RRID:AB_2892065 | 1:500 |
| Antibody | anti-KRT14 (Rabbit monoclonal) | https://doi.org/10.7554/eLife.52712 | N/A | Gift from Ting Chen’s Lab; 1:1000 |
| Antibody | anti-DCT (Rabbit monoclonal) | https://doi.org/10.7554/eLife.52712 | N/A | Gift from Ting Chen’s Lab; 1:500 |
| Antibody | anti-CD31 (Mouse monoclonal) | Abcam | Cat#ab9498; RRID:AB_307284 | 1:500 |
| Antibody | anti-αSMA (Rabbit monoclonal) | Abcam | Cat#ab124964; RRID:AB_11129103 | 1:500 |
| Antibody | anti-CD45 (Mouse monoclonal) | BD Biosciences | Cat#555481; RRID:AB_395873 | 1:300 |
| Antibody | anti-MAP2 (Rabbit polyclonal) | Thermo Fisher Scientific | Cat#PA5-85755; RRID:AB_2792892 | 1:500 |
| Antibody | anti-NeuN (Rabbit monoclonal) | Abcam | Cat#ab177487; RRID:AB_2532109 | 1:500 |
| Antibody | anti-TPH2 (Rabbit monoclonal) | Abcam | Cat#ab184505; RRID:AB_2892828 | 1:200 |
| Antibody | anti-TH (Rabbit monoclonal) | Millipore | Cat#AB152; RRID:AB_390204 | 1:500 |
| Antibody | anti-nNOS (Rabbit monoclonal) | Sigma-Aldrich | Cat#N7280; RRID:AB_260796 | 1:500 |
| Antibody | anti-GFAP (Rabbit monoclonal) | Abcam | Cat#ab7260; RRID:AB_305808 | 1:750 |
| Antibody | anti-Iba1 (Rabbit monoclonal) | FUJIFILM Wako | Cat#019–19741; RRID:AB_839504 | 1:500 |
| Antibody | anti-DDC (Rabbit polyclonal) | Abcam | Cat#ab3905; RRID:AB_304145 | 1:50 |
| Antibody | anti-NF-H (Rabbit monoclonal) | Thermo Fisher Scientific | Cat#711025; RRID:AB_2609477 | 1:100 |
| Antibody | anti-TMEM119 (Rabbit monoclonal) | Abcam | Cat#ab209064; RRID:AB_2800343 | 1:500 |
| Antibody | anti-GABA (Rabbit polyclonal) | Sigma-Aldrich | Cat#A2025; RRID:AB_3698410 | 1:750 |
| Antibody | anti-Orexin A (Rabbit polyclonal) | Phoenix Pharmaceuticals | Cat#H-003–30; RRID:AB_2315019 | 1:500 |
| Antibody | anti-5-HT (Rabbit polyclonal) | Immunostar | Cat#20080; RRID:AB_572263 | 1:500 |
| Antibody | anti-α-tubulin (Mouse monoclonal) | Sigma-Aldrich | Cat#T5168; RRID:AB_477579 | 1:40,000 |
| Antibody | anti-GFP (Rabbit polyclonal) | Thermo Fisher Scientific | Cat#A-11122; RRID:AB_221569 | 1:1000 |
| Antibody | anti-mCherry (Rabbit polyclonal) | Thermo Fisher Scientific | Cat#PA5-34974; RRID:AB_2552323 | 1:2000 for purified mCherry, 1:10,000 for the expressed mCherry |
| Antibody | anti-Human IgG (Rabbit monoclonal) | Abcam | Cat#ab181236; RRID:AB_3698401 | 0.33 nM |
| Antibody | anti-HBsAg (capture) (Goat monoclonal) | Beijing Wantai Biological | Cat#YTX2101 | 5 μg/mL |
| Antibody | anti-HBsAg (detection) (Mouse monoclonal) | Beijing Wantai Biological | Cat#HBs-2C1 | 0.33 nM |
| Antibody | anti-HBeAg (capture) (Mouse monoclonal) | Beijing Wantai Biological | Cat#13B12-1 | 5 μg/mL |
| Antibody | anti-HBeAg (detection) (Mouse monoclonal) | Beijing Wantai Biological | Cat#9A4-1 | 0.033 nM |
| Antibody | anti-phospho-p38α (T180/Y182) (capture) (Mouse monoclonal) | R&D Systems | Cat#DYC869B; RRID:AB_3698412 | The vendor recommended conc. |
| Antibody | anti-phospho-p38α (T180/Y182) (detection) (Rabbit monoclonal) | R&D Systems | Cat#DYC869B; RRID:AB_3698412 | 1/10 of the vendor recommended conc. |
| Antibody | anti-phospho-ERK1 (T202/Y204)/ERK2 (T185/Y187) (capture) (Mouse monoclonal) | R&D Systems | Cat#DYC1018B; RRID:AB_3698414 | The vendor recommended conc. |
| Antibody | anti-phospho-ERK1 (T202/Y204)/ERK2 (T185/Y187) (detection) (Rabbit monoclonal) | R&D Systems | Cat#DYC1018B; RRID:AB_3698414 | 1/10 of the vendor recommended conc. |
| Antibody | anti-phospho-JNK Pan Specific (capture) (Mouse monoclonal) | R&D Systems | Cat#DYC1387B; RRID:AB_3698415 | The vendor recommended conc. |
| Antibody | anti-phospho-JNK Pan Specific (detection) (Rabbit monoclonal) | R&D Systems | Cat#DYC1387B; RRID:AB_3698415 | 1/10 of the vendor recommended conc. |
| Antibody | anti-phospho-AMPKα1 (T183) (capture) (Goat monoclonal) | R&D Systems | Cat#DYC3528; RRID:AB_3698416 | The vendor recommended conc. |
| Antibody | anti-phospho-AMPKα1 (T183) (detection) (Rabbit monoclonal) | R&D Systems | Cat#DYC3528; RRID:AB_3698416 | 1/10 of the vendor recommended conc. |
| Antibody | anti-phospho-CREB (S133) (capture) (Goat monoclonal) | R&D Systems | Cat#DYC2510; RRID:AB_3698417 | The vendor recommended conc. |
| Antibody | anti-phospho-CREB (S133) (detection) (Rabbit monoclonal) | R&D Systems | Cat#DYC2510; RRID:AB_3698417 | 1/10 of the vendor recommended conc. |
| Antibody | anti-phospho-Src (Y419) (capture) (Goat monoclonal) | R&D Systems | Cat#DYC2685; RRID:AB_3698418 | The vendor recommended conc. |
| Antibody | anti-phospho-Src (Y419) (detection) (Rabbit monoclonal) | R&D Systems | Cat#DYC2685; RRID:AB_3698418 | 1/10 of the vendor recommended conc. |
| Antibody | anti-phospho-Akt (S473) (capture) (Rabbit monoclonal) | Abcam | Cat#ab285034; RRID:AB_3698403 | 6.0 μg/mL |
| Antibody | anti-phospho-Akt (S473) (detection) (Rabbit monoclonal) | Abcam | Cat#ab285140; RRID:AB_3698406 | 0.01 μg/mL |
| Recombinant DNA reagent | pET28a-His6-Ubiquitin-OaAEP1 (C247A) | https://doi.org/10.1038/ncomms10199 | N/A | See Supplementary file 4 |
| Recombinant DNA reagent | pET21a-TP897-NGL-His6 | This paper | N/A | See Supplementary file 4 |
| Recombinant DNA reagent | pET21a-TP1107-NGL-His6 | This paper | N/A | See Supplementary file 4 |
| Recombinant DNA reagent | pET28a-His6-EGFP | This paper | N/A | See Supplementary file 4 |
| Recombinant DNA reagent | pET28a-His6-mCherry | This paper | N/A | See Supplementary file 4 |
| Sequence-based reagent | HCR Initiators | https://doi.org/10.1021/nn405717p | HCR probes | See Supplementary file 3 |
| Sequence-based reagent | HCR Amplifiers | https://doi.org/10.1021/nn405717p | HCR probes | See Supplementary file 3 |
| Sequence-based reagent | DNA barcode oligos for qPCR | This paper | DNA barcodes | See Supplementary file 3 |
| Sequence-based reagent | DNA barcode oligos for sequencing | This paper | DNA barcodes | See Supplementary file 3 |
| Sequence-based reagent | Primers for qPCR-based BLISA | This paper | qPCR primers | See Supplementary file 5 |
| Peptide, recombinant protein | GVG-K(N3)-RG | Scilight-Peptide | N/A | |
| Peptide, recombinant protein | OaAEP1 (C247A) | This paper | N/A | See Materials and methods |
| Peptide, recombinant protein | TP897-NGL-His6 | This paper | N/A | See Materials and methods |
| Peptide, recombinant protein | TP1107-NGL-His6 | This paper | N/A | See Materials and methods |
| Peptide, recombinant protein | GFP | This paper | N/A | See Materials and methods |
| Peptide, recombinant protein | mCherry | This paper | N/A | See Materials and methods |
| Commercial assay or kit | BCA protein assay | Thermo Fisher Scientific | Cat#23225 | |
| Software, algorithm | MATLAB | MathWorks | vR2018a; RRID:SCR_001622 | |
| Software, algorithm | GraphPad Prism | GraphPad | v9.02; RRID:SCR_002798 | |
| Software, algorithm | Zen | Zeiss | v2.3; RRID:SCR_013672 | |
| Software, algorithm | LAS X | Leica | v5.1; RRID:SCR_013673 | |
| Software, algorithm | ImageJ | NIH | v 2.1.0; RRID:SCR_003070 | |
| Software, algorithm | Python | The Python Software Foundation | 3.8.10 | https://www.python.org/downloads/ |
| Software, algorithm | UMI-tools | Smith et al., 2017 | v1.1.2; RRID:SCR_017048 | https://github.com/CGATOxford/UMI-tools |
| Software, algorithm | Snakemake | Mölder et al., 2021 | v6.8.0; RRID:SCR_003475 | https://github.com/snakemake/snakemake |
| Software, algorithm | Biopython | Cock et al., 2009 | v1.79; RRID:SCR_007173 | https://github.com/biopython/biopython |
| Software, algorithm | R | R Core Team | v4.0.3 | https://cran.r-project.org |
| Software, algorithm | RStudio | Posit Software | v1.4.1103; RRID:SCR_000432 | https://posit.co/download/rstudio-desktop/ |
| Software, algorithm | BLISAcounts | This paper | N/A | https://github.com/RuiyuRayWang/BLISAcounts/ |
Additional files
-
Supplementary file 1
Detailed compound information in HTS-based barcode-linked immunosorbent assay (BLISA).
- https://cdn.elifesciences.org/articles/105225/elife-105225-supp1-v1.docx
-
Supplementary file 2
Antibodies and Nb-DNA oligos (or Nb-SS-DNA oligos).
- https://cdn.elifesciences.org/articles/105225/elife-105225-supp2-v1.docx
-
Supplementary file 3
Detailed sequences and modifications of DNA oligos.
- https://cdn.elifesciences.org/articles/105225/elife-105225-supp3-v1.docx
-
Supplementary file 4
Amino acid sequences of the constructs used in this study.
- https://cdn.elifesciences.org/articles/105225/elife-105225-supp4-v1.docx
-
Supplementary file 5
Primers for quantitative PCR (qPCR)-based barcode-linked immunosorbent assay (BLISA).
- https://cdn.elifesciences.org/articles/105225/elife-105225-supp5-v1.docx
-
Supplementary file 6
Primers for next-generation sequencing (NGS).
- https://cdn.elifesciences.org/articles/105225/elife-105225-supp6-v1.xlsx
-
MDAR checklist
- https://cdn.elifesciences.org/articles/105225/elife-105225-mdarchecklist1-v1.docx
-
Source data 1
Statistical source data, related to Figure 1—figure supplement 1, Figure 1—figure supplement 3, Figure 1—figure supplement 4, Figure 3, Figure 3—figure supplement 1, Figure 4, Figure 4—figure supplements 1 and 2, Figure 5, Figure 5—figure supplements 1 and 3, Figure 6, Figure 6—figure supplement 1.
- https://cdn.elifesciences.org/articles/105225/elife-105225-data1-v1.xlsx
-
Source data 2
Unique molecular identifier (UMI) counts of next-generation sequencing (NGS) data, related to Figure 4—figure supplement 2, Figure 5, Figure 5—figure supplements 1 and 3, Figure 6, Figure 6—figure supplements 1 and 2.
- https://cdn.elifesciences.org/articles/105225/elife-105225-data2-v1.xlsx
Download links
A two-part list of links to download the article, or parts of the article, in various formats.
Downloads (link to download the article as PDF)
Open citations (links to open the citations from this article in various online reference manager services)
Cite this article (links to download the citations from this article in formats compatible with various reference manager tools)
Modular DNA barcoding of nanobodies enables multiplexed in situ protein imaging and high-throughput biomolecule detection
eLife 14:RP105225.
https://doi.org/10.7554/eLife.105225.3


