PRMT1-mediated metabolic reprogramming promotes leukemogenesis
- Department of Biochemistry and Molecular Genetics, The University of Alabama at Birmingham, School of Medicine, United States
- Department of Pathology, The University of Alabama at Birmingham, School of Medicine, United States
- Department of Pathology and Laboratory Medicine, Oregon Health and Science University and Research Department, Portland Veterans Affairs Medical Center, United States
- Tri-Institutional PhD Program of Chemical Biology, Chemical Biology Program, Memorial Sloan Kettering Cancer Center, United States
- Program of Pharmacology, Weill Cornell Medical College of Cornell University, United States
- Department of Pathology & Laboratory Medicine, University of Kansas Medical Center, United States
- Department of Genetics, The University of Alabama at Birmingham, School of Medicine, United States
- Department of Medicine, University of Massachusetts, United States
- Center for Therapeutics Discovery, Mountain Sinai Hospital, United States
- Department of Pediatrics, Aflac Cancer and Blood Disorders Center, Children’s Healthcare of Atlanta, School of Medicine, Emory University, United States
- Department of Biological Sciences, SUNY at Buffalo, United States
- Department of Microbiology, The University of Alabama at Birmingham, School of Medicine, United States
- Department of Pharmaceutical and Biomedical Sciences, College of Pharmacy University of Georgia, United States
- Department of Pediatrics, The University of Alabama at Birmingham, School of Medicine, United States
Figures
Figure 1 with 1 supplement
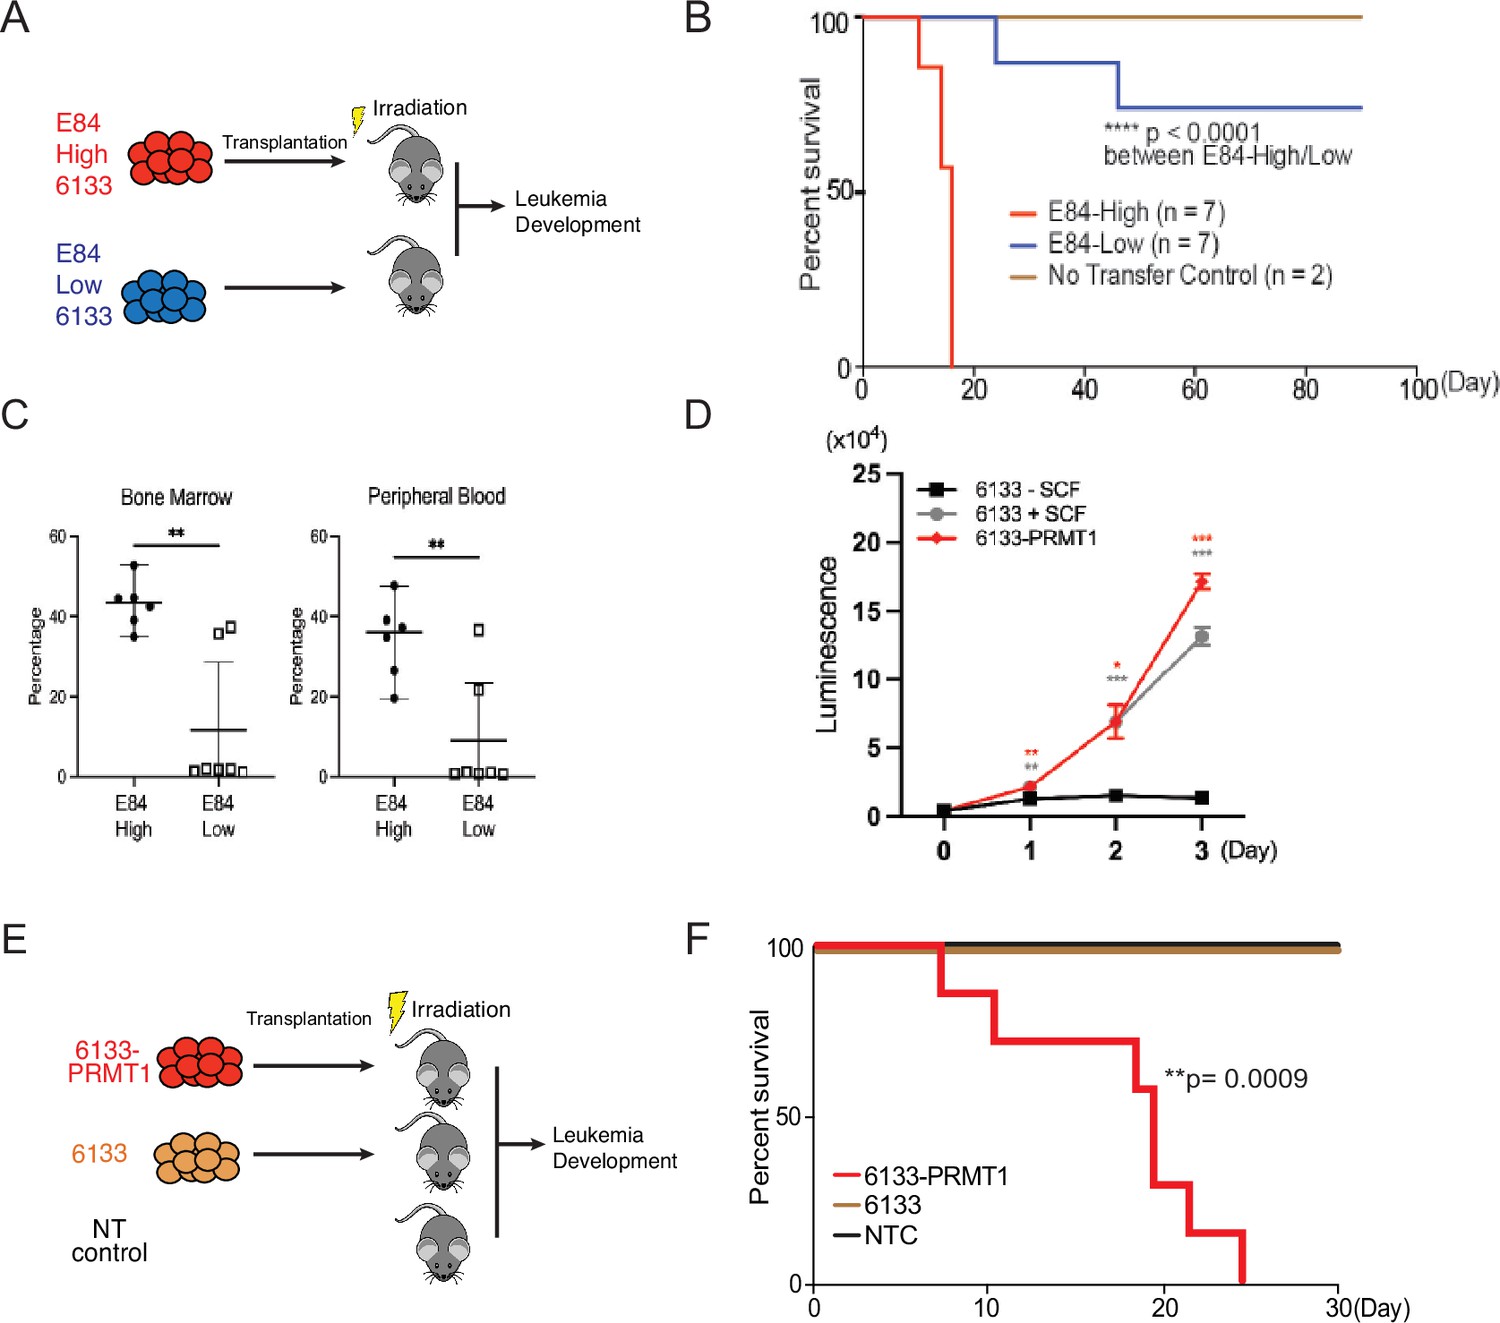
PRMT1 promotes leukemia cell transformation.
(A) 6133cells were stained with E84, then fluorescence-activated cell sorting (FACS) was sorted based on E84 intensity. 3 × 10⁵ sorted cells were intravenously transferred to sub-lethally irradiated mice. (B) Leukemia progression in recipient mice was shown on Kaplan–Meier curves. (C) The manifestation of leukemia cells in the bone marrow and peripheral blood of recipient mice was measured using flow cytometry. In the E84-low group, the bottom five dots represent five recipient mice that were sacrificed on day 90 post-transfer. Closed symbols indicate moribund mice, while open symbols denote non-terminally ill, inhibitor-treated mice sacrificed on day 88. (D) PRMT1 expression renders 6133cells’ cytokine-independent growth. 6133cells and 6133/PRMT1 cells were cultured with or without mouse stem cell factor (SCF). Cell viabilities were measured daily. (E) Schematic for inducing leukemia through the intravenous injection of 6133 or 6133/PRMT1 cells into sub-lethally irradiated recipient mice (n = 7). (F) Leukemia progression in recipient mice was documented on Kaplan–Meier curves. * p<0.05, ** p<0.01, *** p<0.001.
Figure 1—figure supplement 1

Expression of metabolic regulated genes in cells with differential PRMT1 expression levels.
(A) Two populations of 6133cells were fluorescence-activated cell sorting (FACS)-sorted based on E84 staining intensity, as in Figure 1. Sorted cells were harvested and subjected to western blot analysis. (B) RNA was extracted from sorted cells and used for quantitative real-time PCR.
Figure 2 with 1 supplement
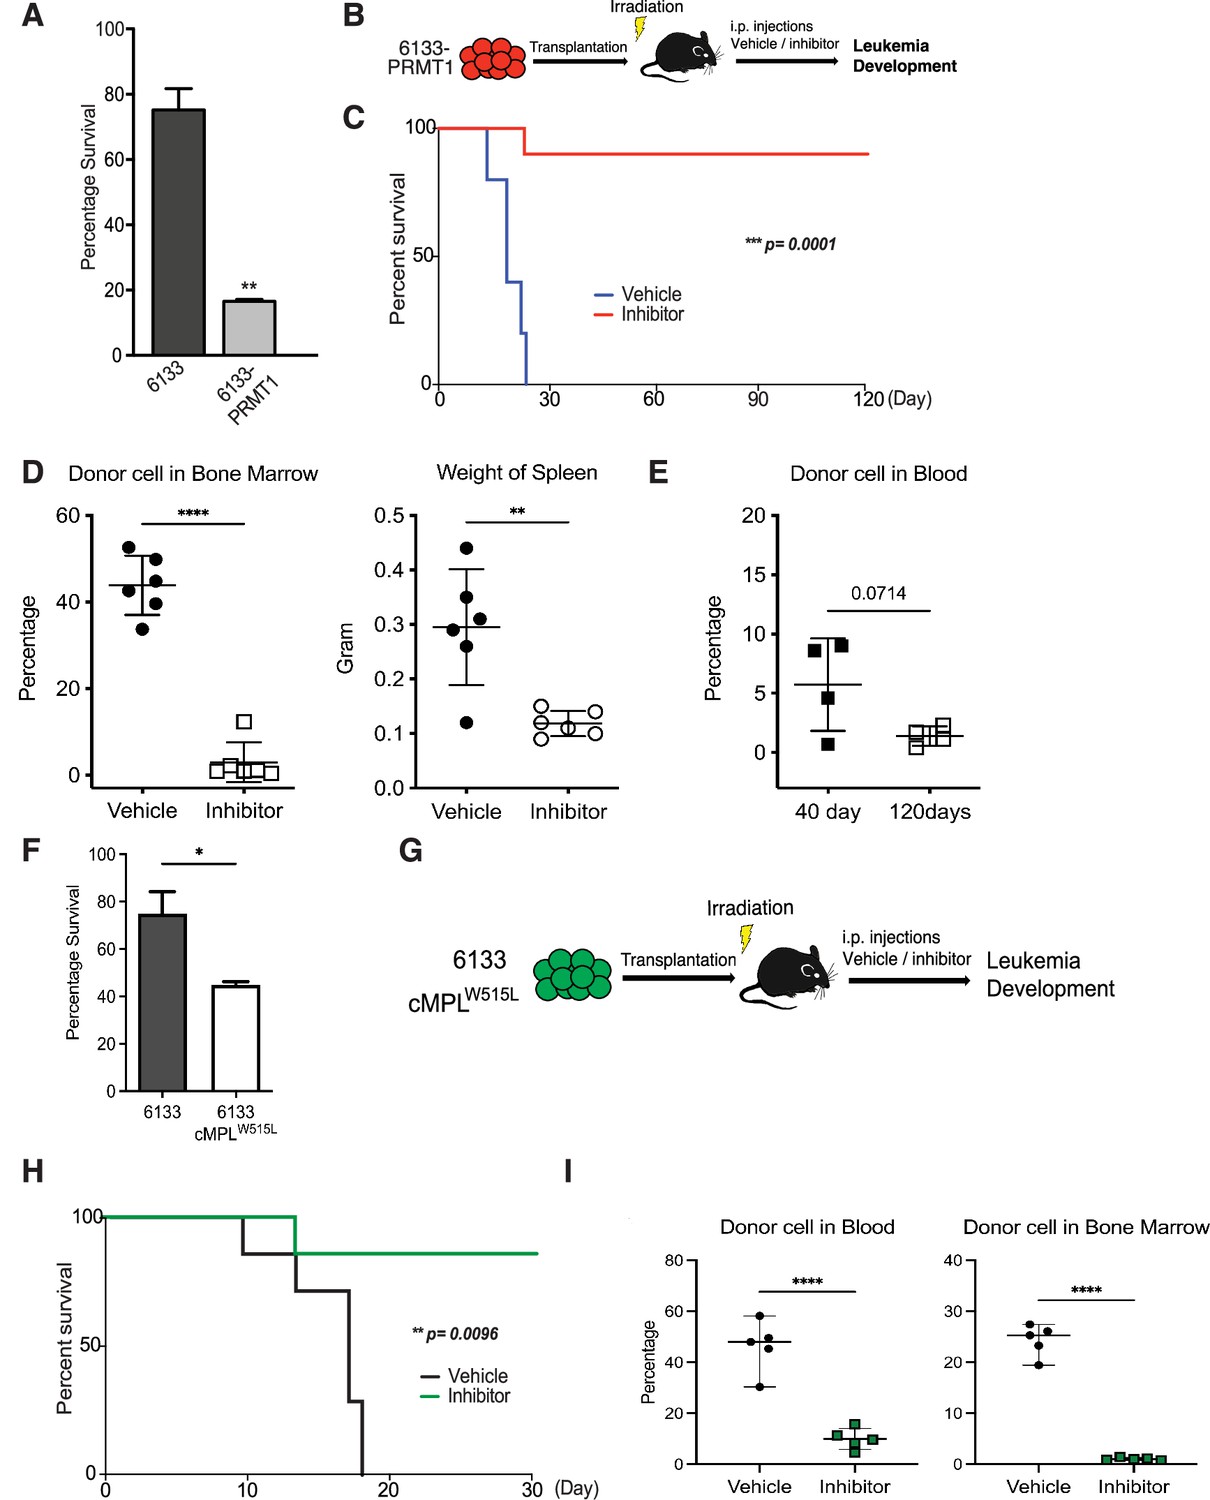
PRMT1 inhibitor MS023 blocks leukemia progression.
(A) The survival of 6133/PRMT1 cells is highly sensitive to treatment with MS023. Both 6133 and 6133/PRMT1 cells were treated with MS023 for 48hr, and cell viability was determined by counting. (B) 6133/PRMT1 cells were intravenously transferred into sub-lethally irradiated mice. Recipient mice received intraperitoneal injections of either a PRMT1 inhibitor or vehicle for 15 doses, given every other day. (C) The progression of leukemia was illustrated on Kaplan–Meier curves. n = 5. (D) Leukemia cells in recipient mice (n = 6) were quantified using flow cytometry. The right panel shows the weights of the spleens from recipient mice. Closed symbols represent moribund mice, and open symbols represent non-terminally ill, inhibitor-treated mice that were sacrificed on days 40 and 120. (E) Peripheral blood was collected from non-terminally ill, inhibitor-treated mice at 40 and 120days post-cell transfer. (F) MS203 treatment of in vitro cultured 6133 and 6133/cMPLW515L cells. n = 3. p < 0.05. (G) Schematic of leukemia induced by 6133 c-mplW515L transplantation. (H) Kaplan–Meier curves for MS023-treated leukemia mice induced by 6133 c-mplW515L cells. n = 7. (I) The percentage of GFP-positive leukemia cells in the peripheral blood and bone marrow of the vector and inhibitor-treated mice at the endpoints. * p<0.05, ** p<0.01, **** p<0.0001.
Figure 2—figure supplement 1
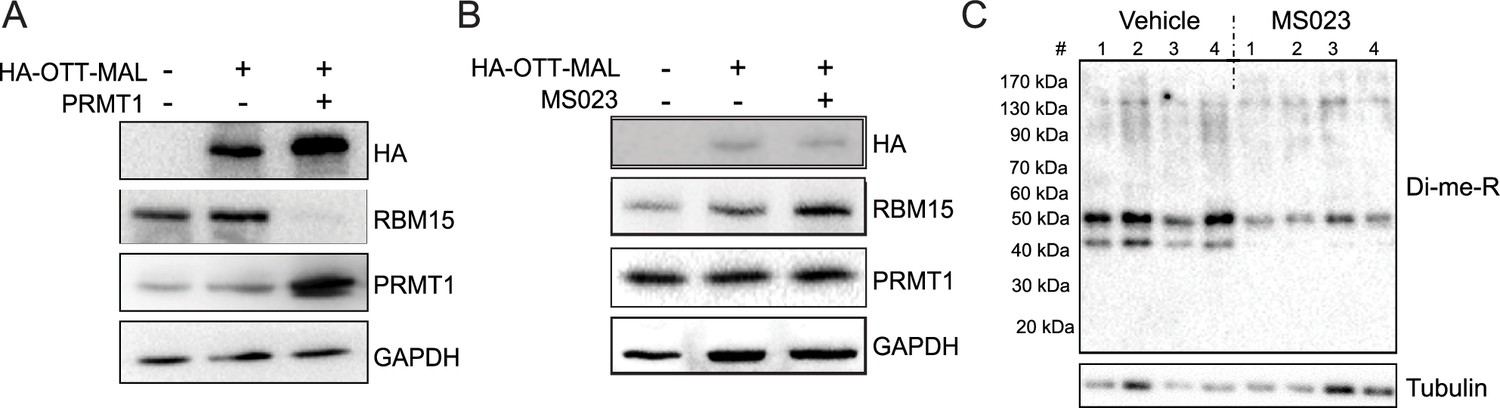
RBM15-MKL1 (OTT-MAL) protein stability is not affected by PRMT1 activity.
(A) HEK293T cells were transfected with constructs expressing HA-tagged RBM15-MKL1 with or without PRMT1. Extracts were harvested 24 hr post-transfection and then used for western blotting. Endogenous RBM15 is indicated. (B) NB4 cells were treated with PRMT1 inhibitor MS023 for 24 hr. Extracts were harvested for western blotting. (C) Global arginine di-methylation (Di-me-R) of bone marrow cells from mice injected with PRMT1 inhibitor MS023. Mice were injected with 80 mg/kg body weight of MS023 or vehicle every other day for 30 days. Bone marrow cells were collected, and extracts were prepared for western blot analysis.
-
Figure 2—figure supplement 1—source data 1
Labeled gel for the western blots in Figure 2—figure supplement 1.
- https://cdn.elifesciences.org/articles/105318/elife-105318-fig2-figsupp1-data1-v1.zip
-
Figure 2—figure supplement 1—source data 2
Western blots for the Figure 2—figure supplement 1.
- https://cdn.elifesciences.org/articles/105318/elife-105318-fig2-figsupp1-data2-v1.zip
-
Figure 2—figure supplement 1—source data 3
Western blots with labels for Figure 2—figure supplement 1B.
- https://cdn.elifesciences.org/articles/105318/elife-105318-fig2-figsupp1-data3-v1.zip
-
Figure 2—figure supplement 1—source data 4
Figure 2—figure supplement 1 western blot raw data.
- https://cdn.elifesciences.org/articles/105318/elife-105318-fig2-figsupp1-data4-v1.zip
Figure 3
PRMT1 promotes glycolysis.
(A) Extracellular acidification rates (ECARs) in 6133 and 6133/PRMT1 cells were measured using Seahorse assays. 150,000cells were seeded in special 24-well plates for the Seahorse Xf-24 analyzer. Oligomycin, FCCP, and antimycin were injected sequentially into the wells as indicated. (B) ECARs in PRMT1 inhibitor (MS023)-treated 6133cells. Cells were pretreated with MS023 overnight before Seahorse analysis. (C) The protein levels of lactate dehydrogenase A (LDHA) and p-Y10-LDHA in both 6133 and 6133/PRMT1 cells were assessed using western blotting. The cells were cultured at the same density, and extracts were harvested after an overnight incubation. (D) Intracellular and extracellular lactate levels were measured using an L-lactate kit. Cells were seeded at 1 × 10⁷cells/ml and cultured for 24hr, followed by centrifugation. Both the medium/supernatant (extracellular) and the cell pellet (intracellular) were collected for analysis. The results from the triplicates are plotted. *p < 0.05.
-
Figure 3—source data 1
Pdf files containing original western blots for Figure 3C, indicating the relevant bands and treatments.
- https://cdn.elifesciences.org/articles/105318/elife-105318-fig3-data1-v1.zip
-
Figure 3—source data 2
JPG files containing original western blots for Figure 3D.
- https://cdn.elifesciences.org/articles/105318/elife-105318-fig3-data2-v1.zip
Figure 4
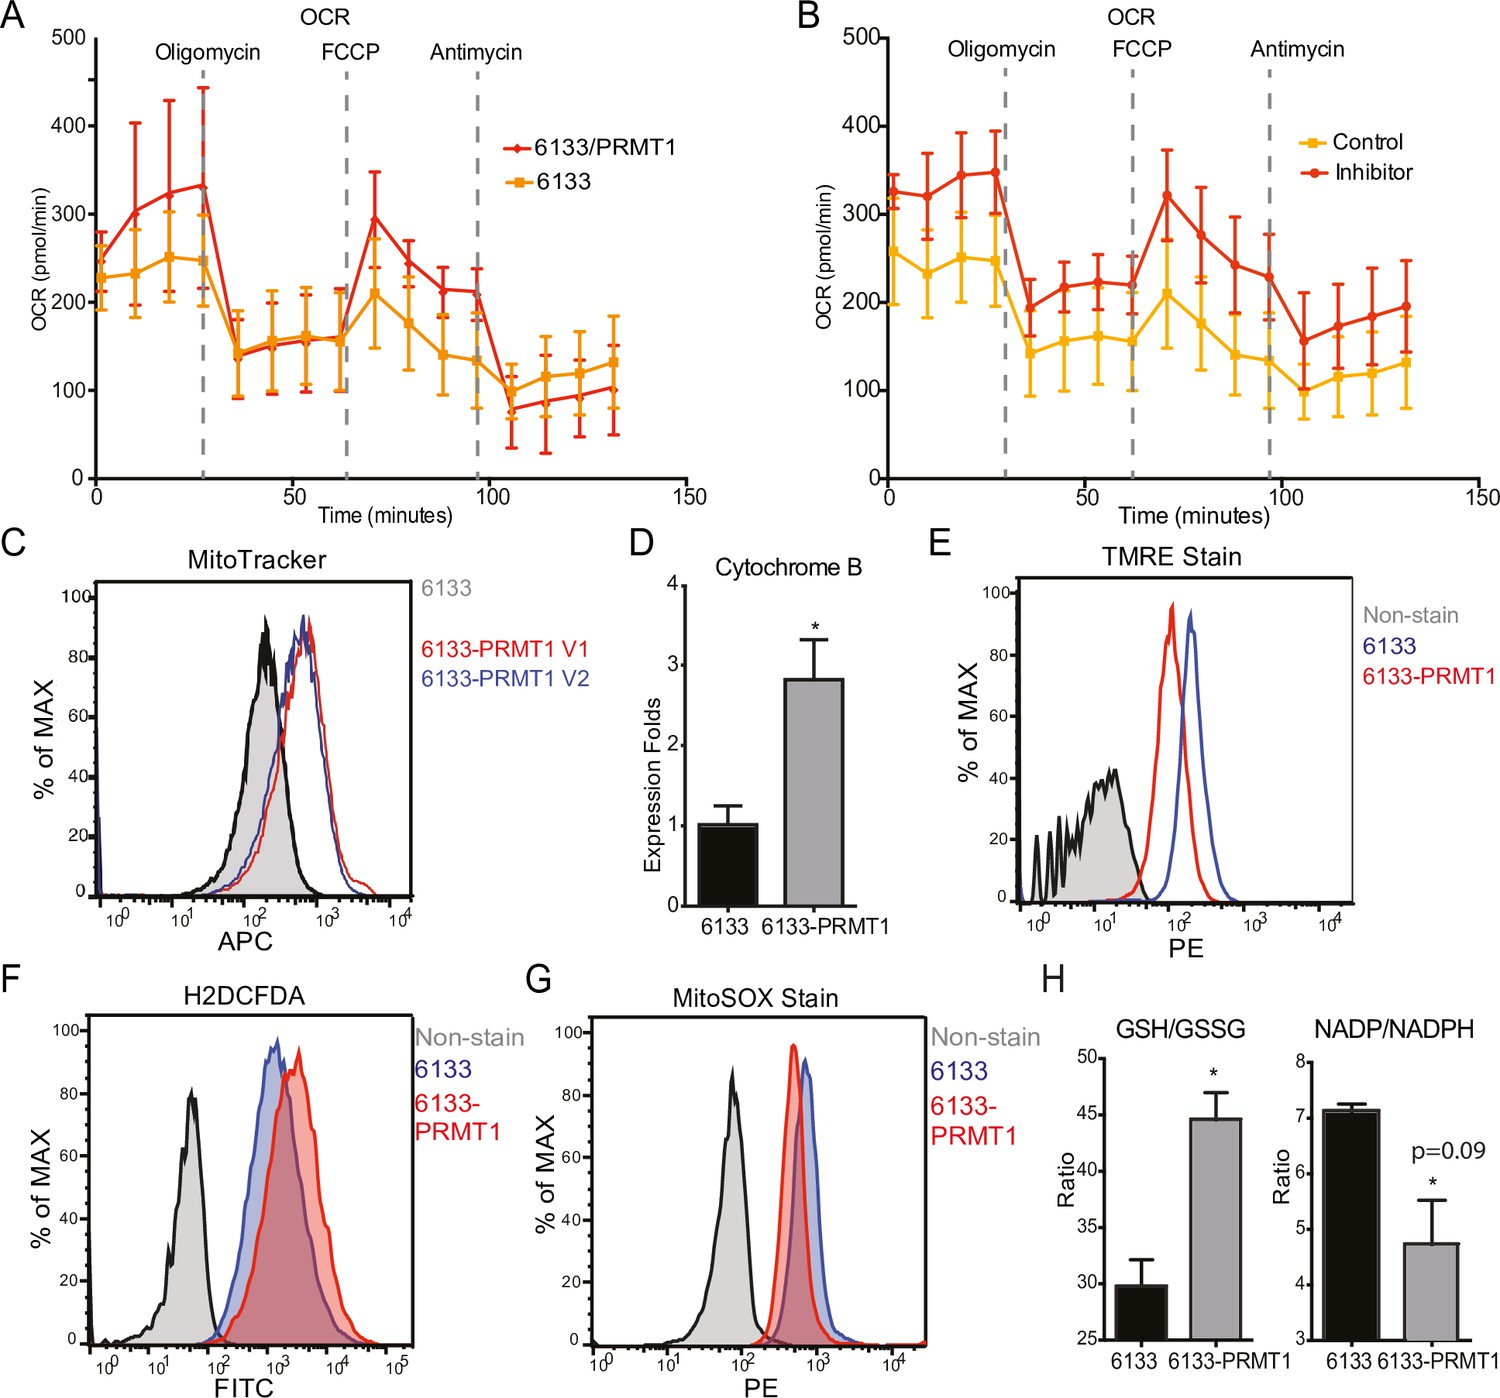
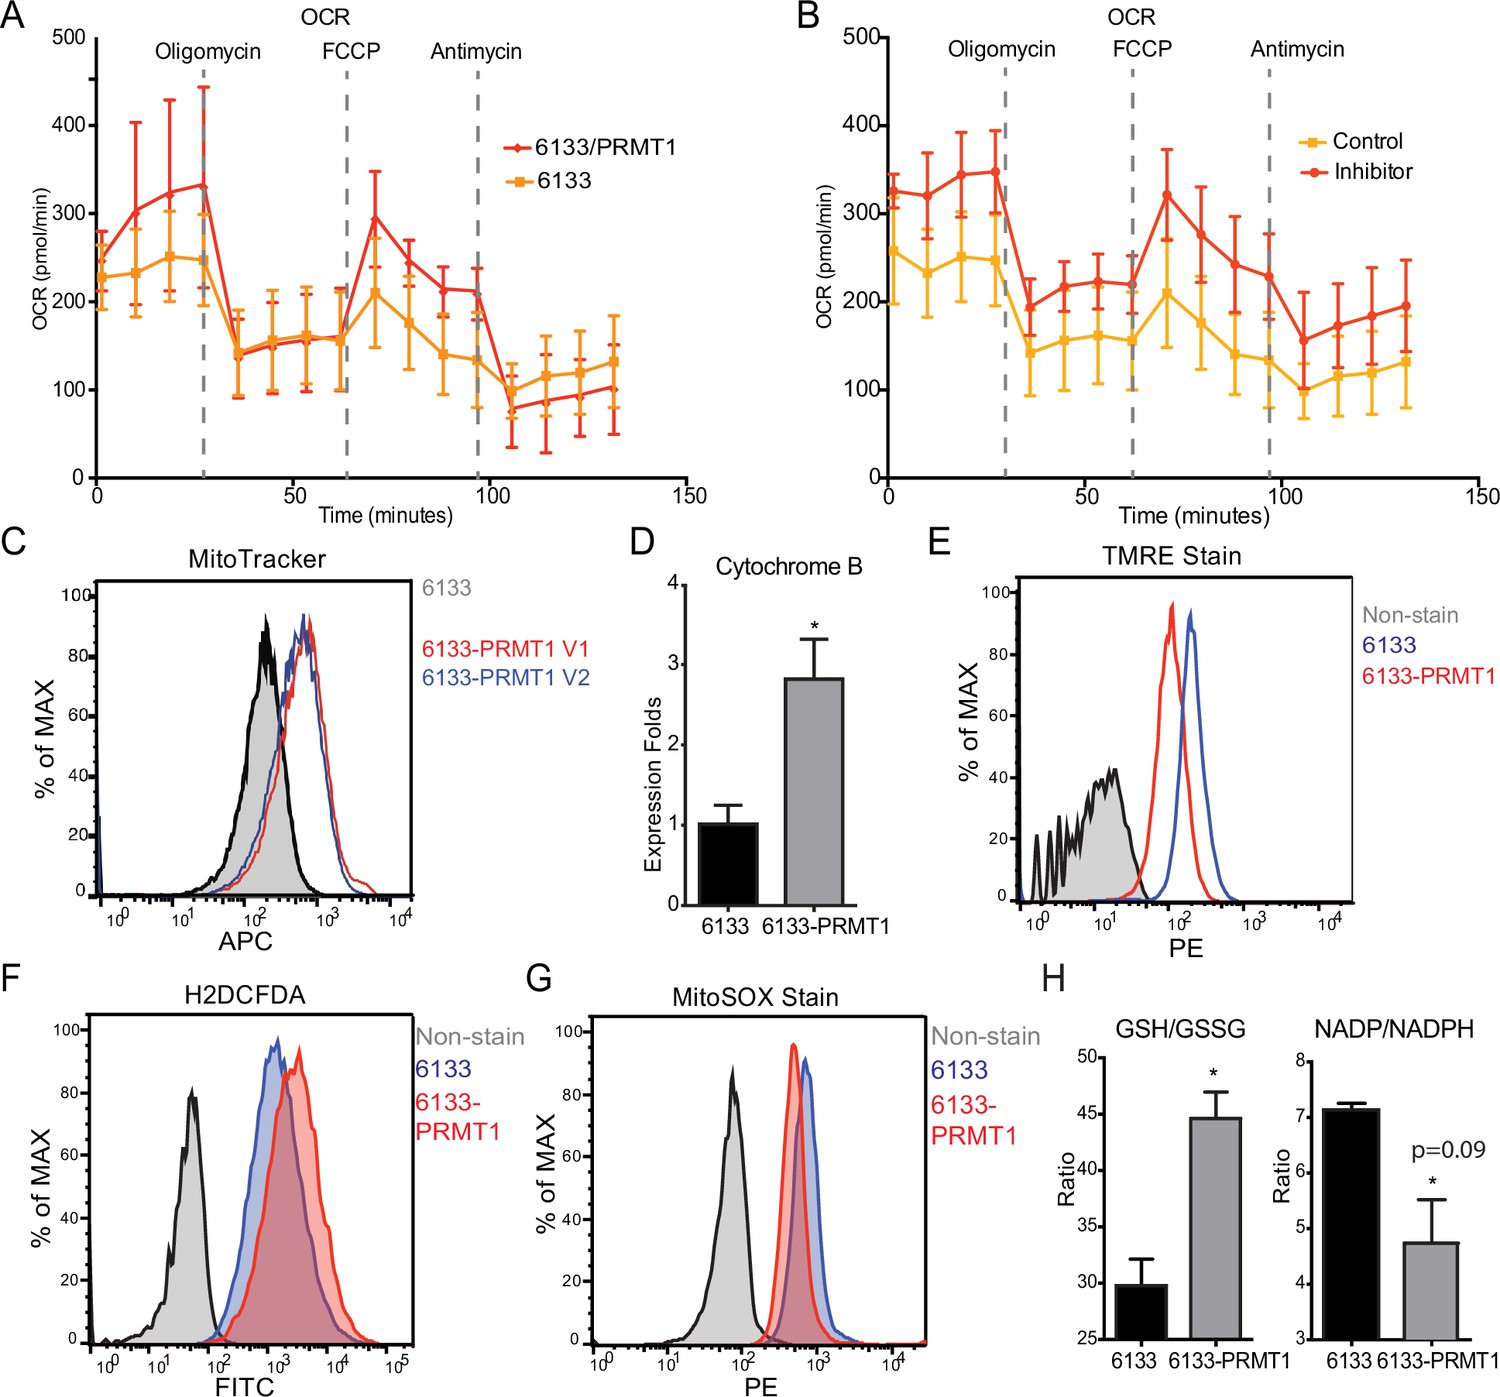
PRMT1 changes oxygen consumption and redox status.
(A) Oxygen consumption rates (OCRs) in 6133 and 6133/PRMT1 cells were measured using Seahorse assays. A total of 150,000cells were seeded in specialized 24-well plates designed for the Seahorse Xf-24 analyzer. Oligomycin, FCCP, and antimycin were injected into the wells sequentially as indicated. (B) OCRs in PRMT1 inhibitor-treated 6133/PRMT1 cells. Cells were pretreated with PRMT1 inhibitor MS023 overnight prior to Seahorse analysis. (C) Mitotracker Deep Red FM staining assessed the mitochondrial mass in 6133 and 6133/PRMT1 cells. (D) Quantitative PCR of mitochondria-specific gene cytochrome B measured the mitochondrial DNA amount. (E) TMRE staining was performed to measure mitochondrial membrane potential. Cells were seeded at 1.1 × 10⁵cells/ml, and 0.1volume of 5mM TMRE was added to the culture to reach a final concentration of 500nM. After 20min, cells were collected and used for fluorescence-activated cell sorting (FACS) analysis. (F) The intracellular ROS level was measured by H2-DCFDA staining. 1 × 10⁵cells were incubated in a warm staining solution containing 10µM of H2DCFDA for 30min, then washed and subjected to analysis. (G) Mitochondrial ROS was measured by MitoSOX staining. 5 × 10⁵cells were incubated with a warm staining solution containing 2.5µM of MitoSOX for 10min and then washed and subjected to analysis. (H) Intracellular levels of GSH/GSSG and NADP/NADPH ratio were measured. In each assay, 5 × 10⁵cells were used for extract preparation. * p<0.05.
Figure 5
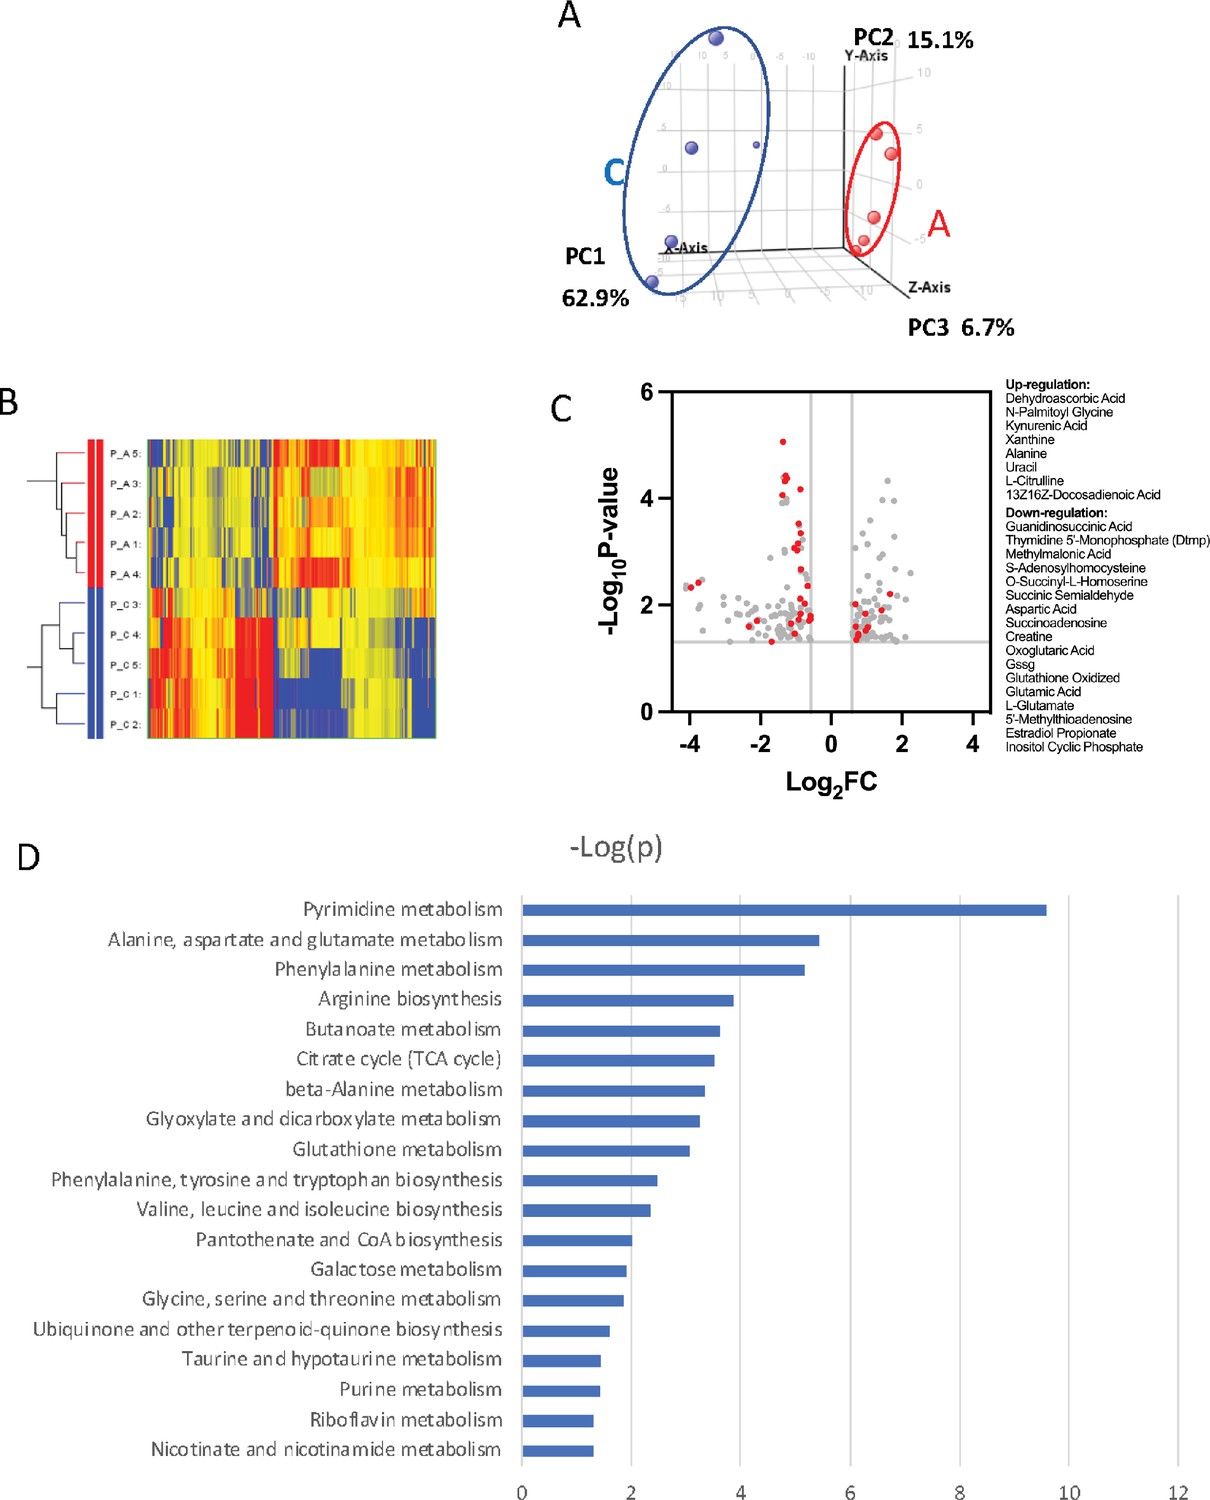
Metabolomic analysis of PRMT1-regulated metabolism in 6133cells.
6133cells expressing doxycycline-inducible PRMT1 were induced to express PRMT1. The activated group (labeled as A): metabolites collected after PRMT1 was induced. Control group (labeled as C): metabolites collected before PRMT1 was induced. (A) Principal component analysis (PCA) for the metabolites. The C and A groups were clustered at different positions in PCA analysis. (B) Heatmap of metabolites differentially expressed in these two groups. (C) Volcano plots for metabolites. 204 metabolites are changed more than twofolds with p < 0.5. (D) Metabolic pathways are primarily influenced by PRMT1 overexpression in 6133cells. The metabolite data were analyzed using a web-based program called MetaboAnalystR6.0.
-
Figure 5—source data 1
The metabolomic data for the PRMT1 mediated changes in metabolites.
- https://cdn.elifesciences.org/articles/105318/elife-105318-fig5-data1-v1.xlsx
Figure 6 with 2 supplements
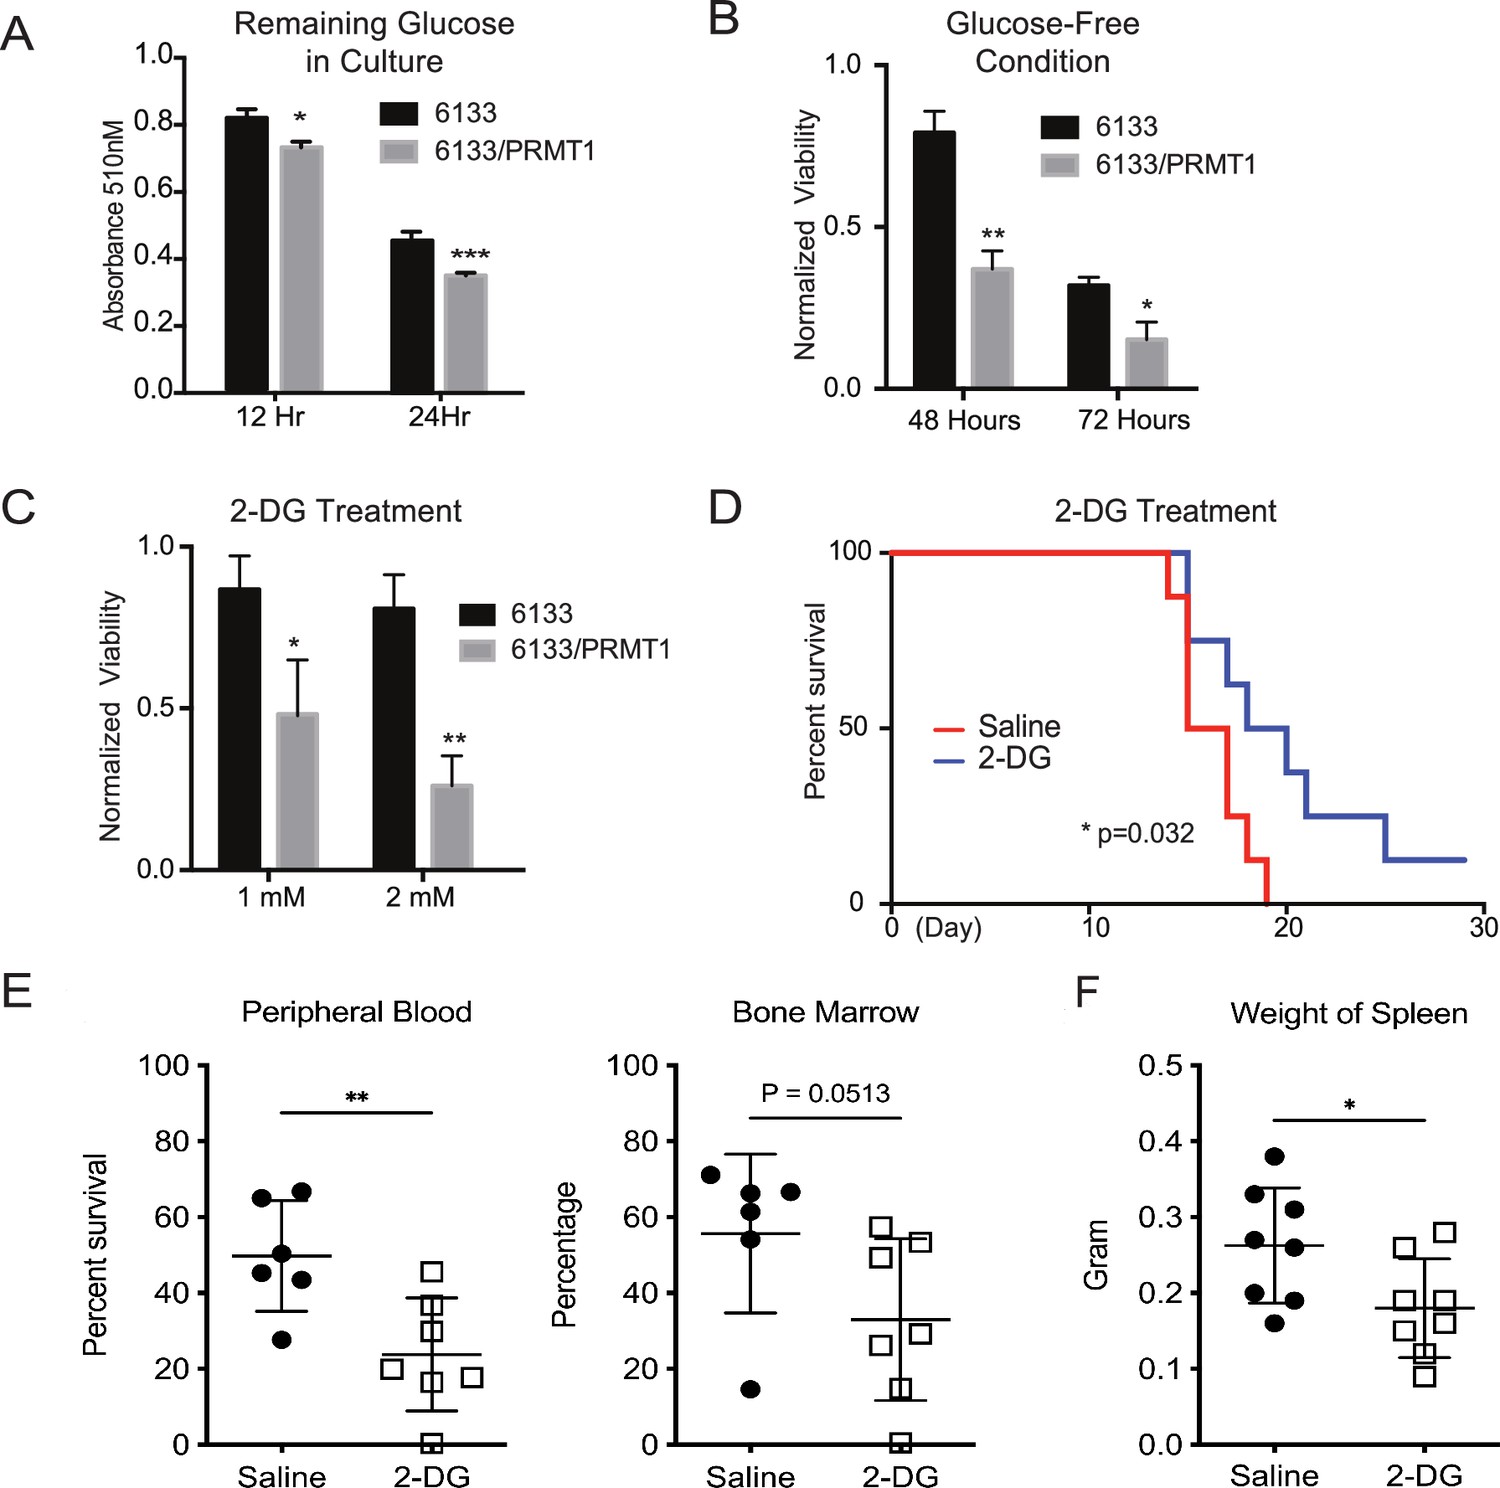
PRMT1 causes leukemia cells’ heavy dependency on glucose consumption.
(A) Colorimetric assay of glucose in 6133 and 6133/PRMT1 cells. 1.25 × 10⁵cells were seeded per well and cultured overnight. After centrifugation, the supernatant/medium was collected and used for the assay. (B) Cell viability of 6133 and 6133/PRMT1 cells under glucose-free conditions. Cells were seeded in a 96-well plate with fresh regular or glucose-minus RPMI 1640 medium. Cell viability was measured by CellTiter-Glo kit. Ratios were normalized to the wells with regular RPMI 1640 medium. (C) Cell viability of 6133 and 6133/PRMT1 cells following 2-deoxy-D-glucose (2-DG) treatment. Cells were plated in 96-well plates containing 2-DG. Cell viability was measured by CellTiter-Glo kit. The growth of cells without the addition of 2-DG served as a normalization reference. (D) 6133/PRMT1 cells were transferred intravenously into sub-lethally irradiated mice. Beginning on day 4 post-transfer, recipient mice received intraperitoneal injections of saline or 0.25g/kg body weight of 2-DG every other day. The survival of recipient mice is presented as Kaplan–Meier curves. (E) The percentages of leukemia cells in the bone marrow and peripheral blood of recipient mice were measured using flow cytometry. Closed symbols represent mice transplanted with 6133/PRMT1 cell-induced leukemia, while the open square indicates a control wild-type mouse without leukemia. * p<0.05, ** p<0.01, *** p<0.001.
Figure 6—figure supplement 1

Responsiveness to glucose restriction of cells with differential PRMT1 expression levels.
Fluorescence-activated cell sorting (FACS)-sorted E84-high and E84-low 6133cells were washed with fresh medium and then seeded in glucose-free RPMI 1640 medium for continuing culture. The viability of E84-high/low cells was measured by CellTiter-Glo assay. * p<0.05 ** p<0.01.
Figure 6—figure supplement 2
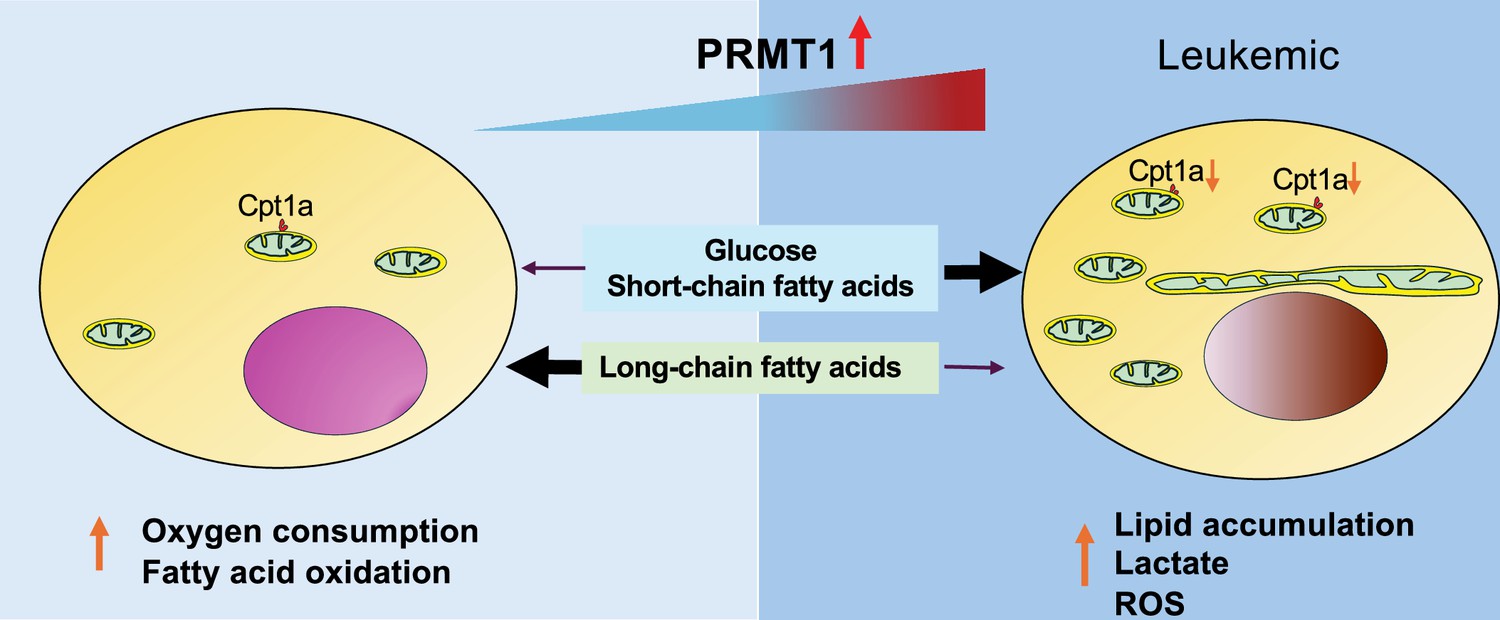
Graphic abstract to summarize the PRMT1-mediated metabolic reprogramming in leukemia cells.
As the PRMT1 expression level is elevated, leukemia cells become more dependent on glycolysis and less capable of utilizing long-chain fatty acids through oxidative phosphorylation.
Figure 7
PRMT1 alters fatty acid oxidation in leukemia cells.
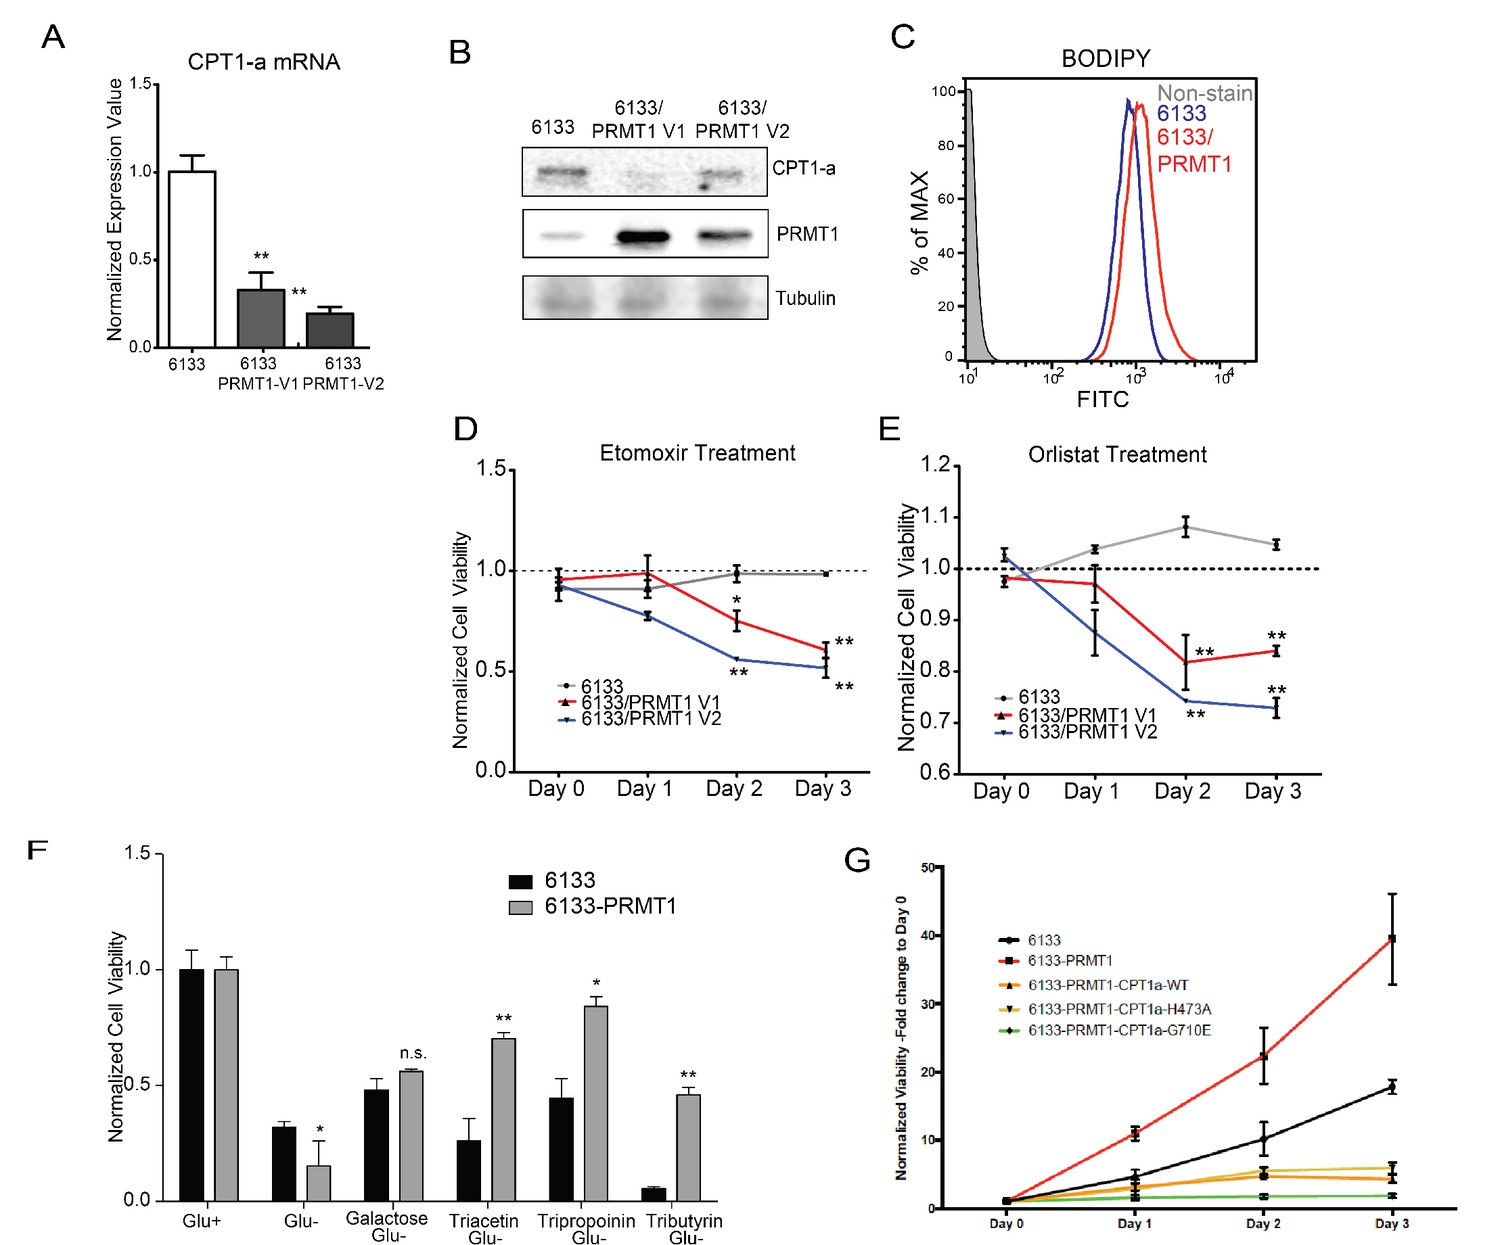
(A) The mRNA levels of CPT1a and PPARα in 6133 and 6133/PRMT1 cells were assessed. Cell pellets were harvested in Trizol prior to RNA extraction, followed by cDNA synthesis and qPCR analysis. (B) Western blotting of 6133 and 6133/PRMT1 cell lines. (C) BODIPY/lipid Staining of 6133cells. Cells were incubated with 200nM of BODIPY/lipid at 37°C for 15min, then washed with medium and prepared for fluorescence-activated cell sorting (FACS) analysis. (D) Cell viability of 6133 and 6133/PRMT1 cells with Etomoxir treatment. 6133 and 6133-PRMT1 cells were seeded in a 96-well plate, supplemented with Etomoxir. Cell viability was measured by CellTiter-Glo Kit. Ratios were normalized to day 0. (E) Cell viability of 6133 and 6133-PRMT1 cells with Orlistat treatment. (F) Viability of 6133 and 6133-PRMT1 cells with a supplement of short-chain fatty acid (triacetin/tripropionin/tributyrin) under glucose-free conditions. Cells were cultured with RPMI with or without glucose, supplemented with 100nM of triacetin/tripropionin/tributyrin, respectively. Cell viability was measured after 72hr. Fold change of viability is normalized to glucose+ cells. (G) Growth curves of 6133-PRMT1 cells transduced with CPT1A, CPT1A/H473A, and CPT1A/G710E. * p<0.05, ** p<0.01.
-
Figure 7—source data 1
Pdf files containing original western blots for Figure 7B, indicating the relevant bands and treatments.
- https://cdn.elifesciences.org/articles/105318/elife-105318-fig7-data1-v1.zip
-
Figure 7—source data 2
JPG files containing original western blots for Figure 7B.
- https://cdn.elifesciences.org/articles/105318/elife-105318-fig7-data2-v1.zip
Additional files
Download links
A two-part list of links to download the article, or parts of the article, in various formats.
Downloads (link to download the article as PDF)
Open citations (links to open the citations from this article in various online reference manager services)
Cite this article (links to download the citations from this article in formats compatible with various reference manager tools)
PRMT1-mediated metabolic reprogramming promotes leukemogenesis
eLife 14:RP105318.
https://doi.org/10.7554/eLife.105318.3


