Chronic RNA G-quadruplex accumulation in aging and Alzheimer’s disease
- Department of Chemistry & Biochemistry and the Knoebel Institute for Healthy Aging, University of Denver, United States
- Department of Pathology and Laboratory Medicine, Medical University of South Carolina, United States
- Department of Neurosurgery, University of Colorado Anschutz Medical Campus, United States
Figures
Figure 1 with 4 supplements
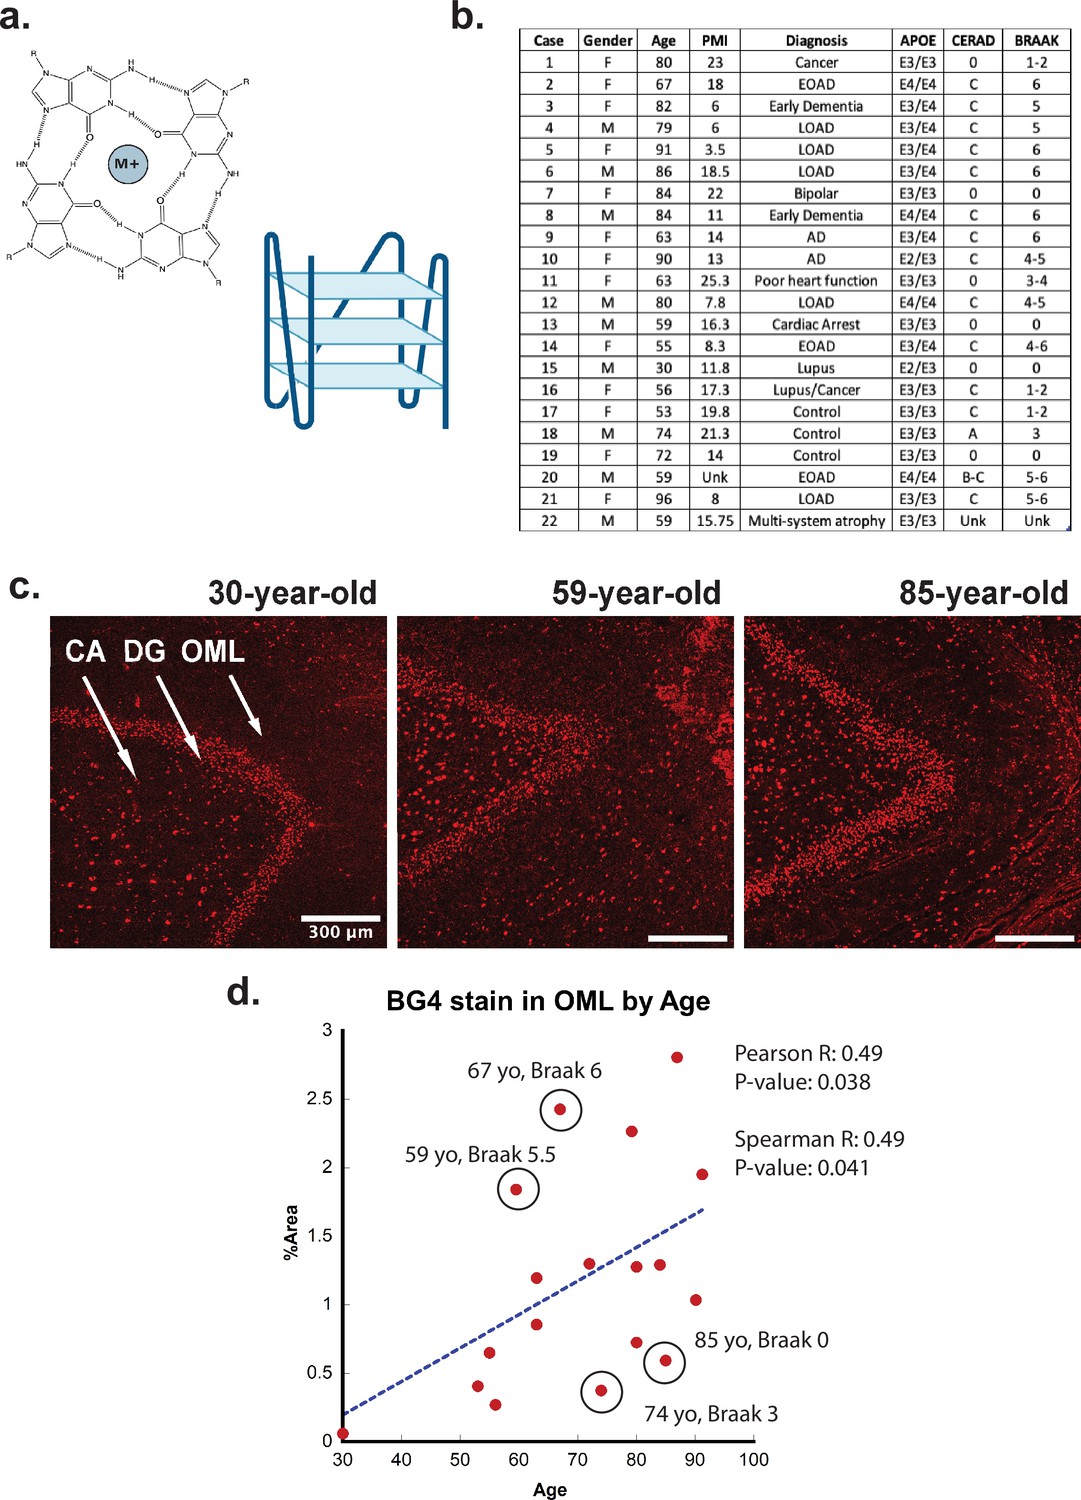
G-quadruplex correlation with age.
(a) (Left) Representative G-quadruplex tetrad structure with Hoogsteen base pairing stabilized by a cation at the center. (Right) G-quadruplex structure with stacked tetrads. (b) Demographics table for individuals included in this study. (c) Immunofluorescence showing BG4 staining (red) in brain sections of human hippocampus from four control individuals of increasing age ranging 30–91 years old (cases 15, 13, and 8, respectively) all with Braak stage 0. (d) Correlation of percent area covered by BG4 fluorescence in the outer-molecular layer versus age of individual.
Figure 1—figure supplement 1

Circular dichroism spectra showing G-quadruplex structure of RNA sequence able to most efficiently template tau fibrillation in Zwierzchowski-Zarate et al., 2022.
(see ‘Introduction’ for description) (5'-CGGGCGGCGGGGGGGCCCGGGCGGCGGGGGGGCCCGGGCG-3').
Figure 1—figure supplement 2
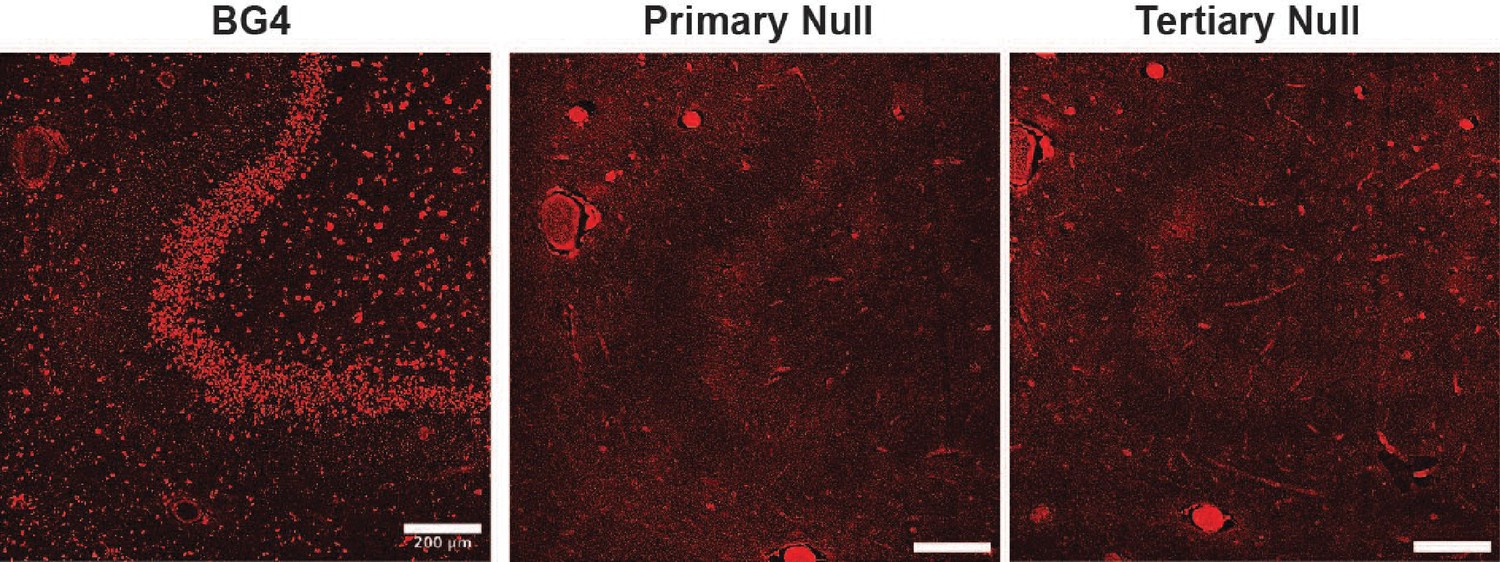
Antibody null controls.
(Left) Complete BG4 staining for comparison. (Center) BG4 primary null in incubated with intermediate and tertiary antibodies only. (Right) BG4 tertiary null is incubated with primary and intermediate antibodies only.
Figure 1—figure supplement 3

No significant correlation observed between BG4 stain and postmortem interval (PMI).
Figure 1—figure supplement 4
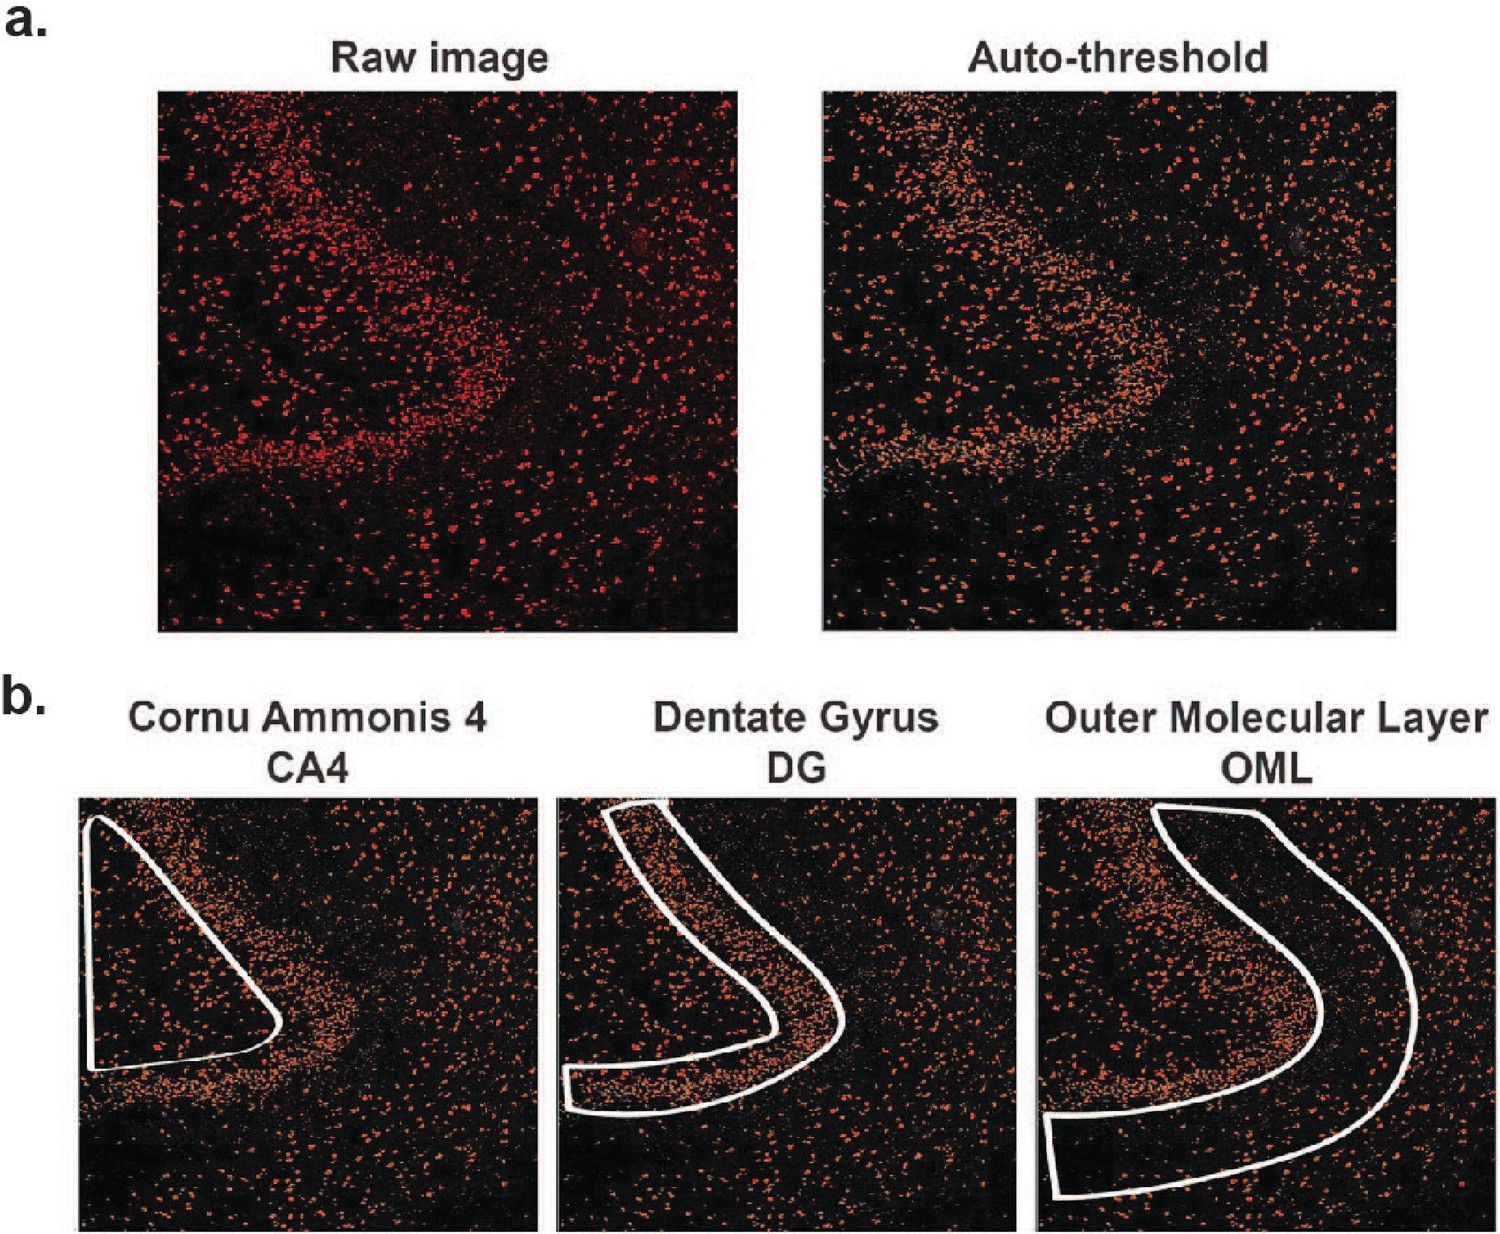
ImageJ quantification.
(a) Unedited confocal image on the left. Auto-threshold set by the program ImageJ applied in the BG4 channel on the right. (b) Representative regions of interest used in quantification for each region of the hippocampus.
Figure 2 with 2 supplements
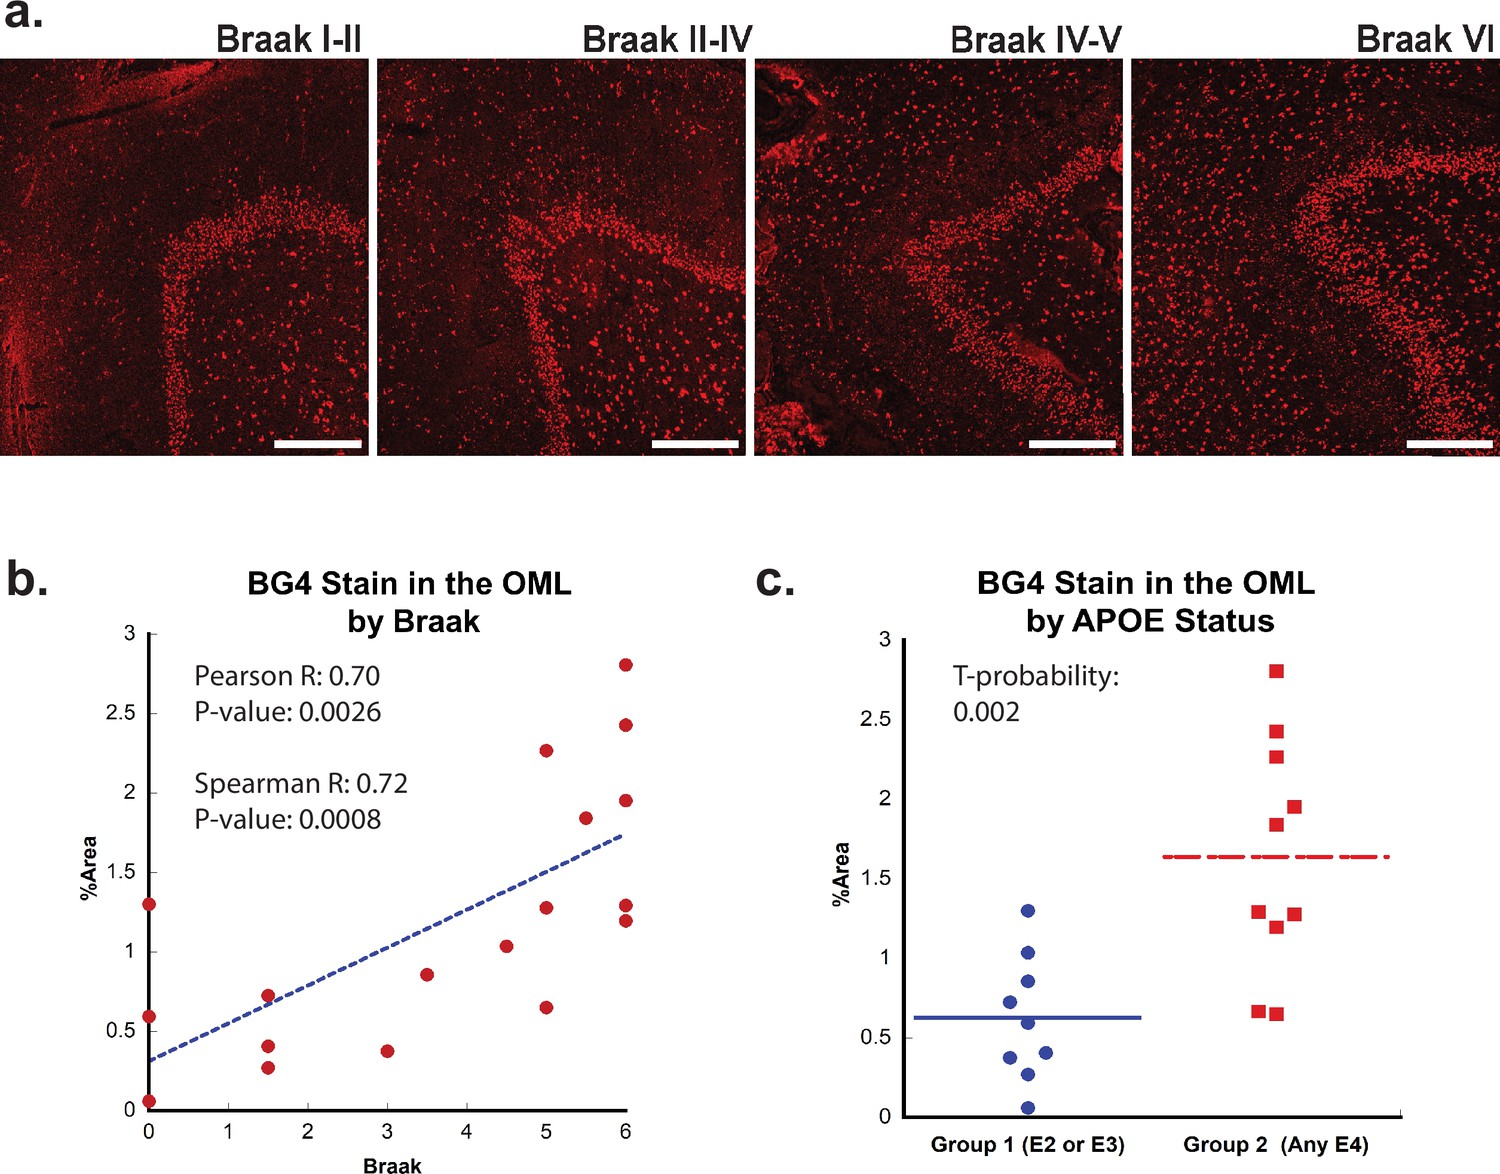
Effect of Braak stage or ApoE status on G-quadruplex level.
(a) Immunofluorescence showing BG4 staining (red) in brain sections of human hippocampus with increasing Braak stage (1–6) associated with Alzheimer’s disease (AD) severity cCases 16, 11, 10, and 8, respectively. All scale bars are 300 µm. (b) Correlation of percent area BG4 coverage in the outer molecular layer versus severity of Braak stage. (c) Quantification of percent area BG4 coverage by population with E2/E3 and E3/E3 versus E3/E4 and E4/E4 apolipoprotein E (APOE) alleles.
Figure 2—figure supplement 1

Very weak correlation was observed between age and Braak stage.
Figure 2—figure supplement 2
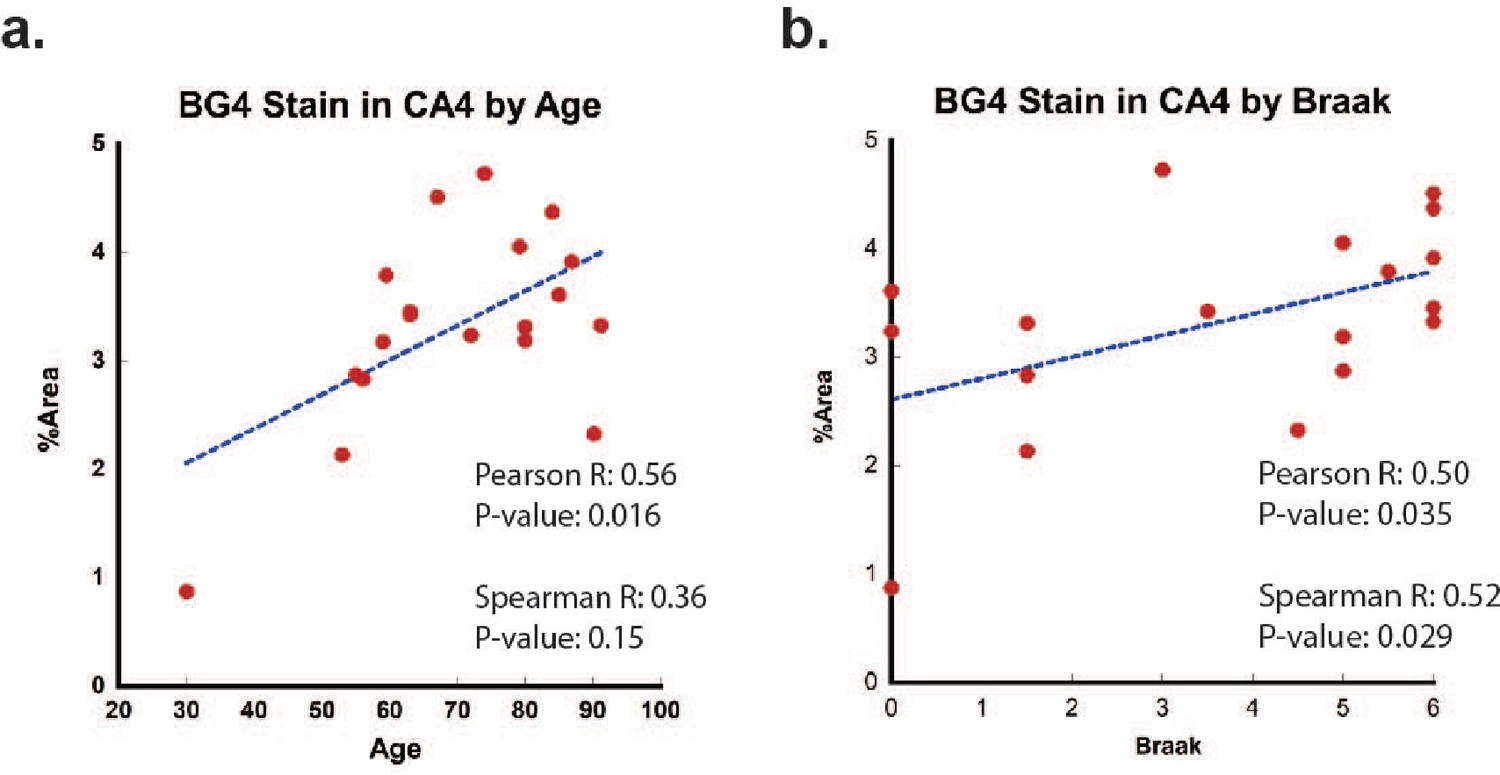
Regression of Age and Braak stage.
(a) BG4 stain in the CA4 region exhibits a positive Pearson correlation with age, but not Spearman correlation. (b) BG4 exhibits a significant positive correlation with Braak stage in CA4 region.
Figure 3 with 1 supplement
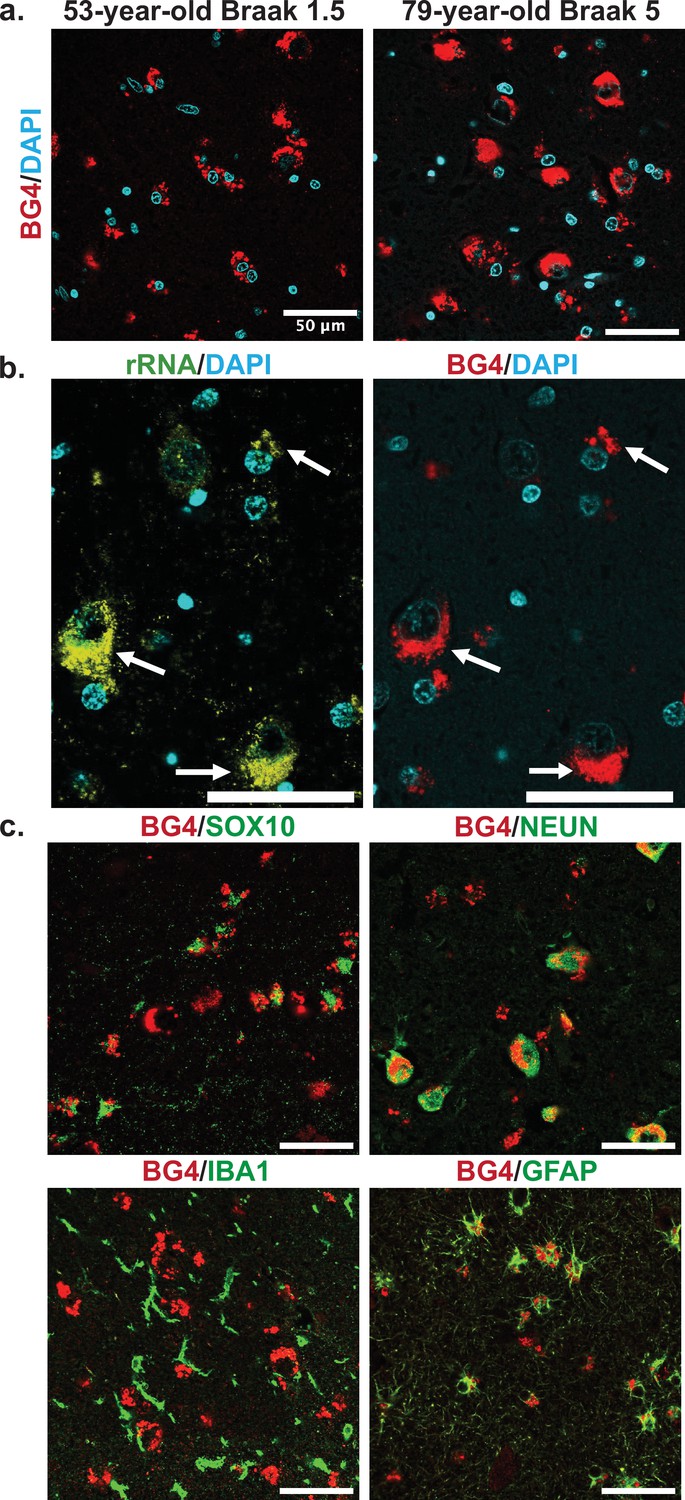
Cellular types and localization of rG4s, all scale bars are 50 µm.
(a) Immunofluorescence showing BG4 staining patterns (red) in human hippocampal tissue of case 17, a 53-year-old individual with Braak stage 1.5, and case 4, a 79-year-old individual with Braak stage 5 Alzheimer’s disease (AD) pathology (right). Cell nuclei stained with DAPI (blue). (b) Co-stain of rRNA (left, yellow green) and BG4 (right, red), in the hippocampal CA4 region, an 80-year-old individual with early-stage tauopathy, demonstrating significant but not complete overlap between BG4 and rRNA. (c) BG4 staining (red) with cell type markers (green) of oligodendrocytes (SOX10, case 8), neurons (NEUN, case 4), microglia (IBA1, case 18), and astrocytes (GFAP, case 18). BG4 is most prevalent in oligodendrocytes, neurons, and astrocytes. BG4 does not strongly colocalize with microglia (IBA1).
Figure 3—figure supplement 1
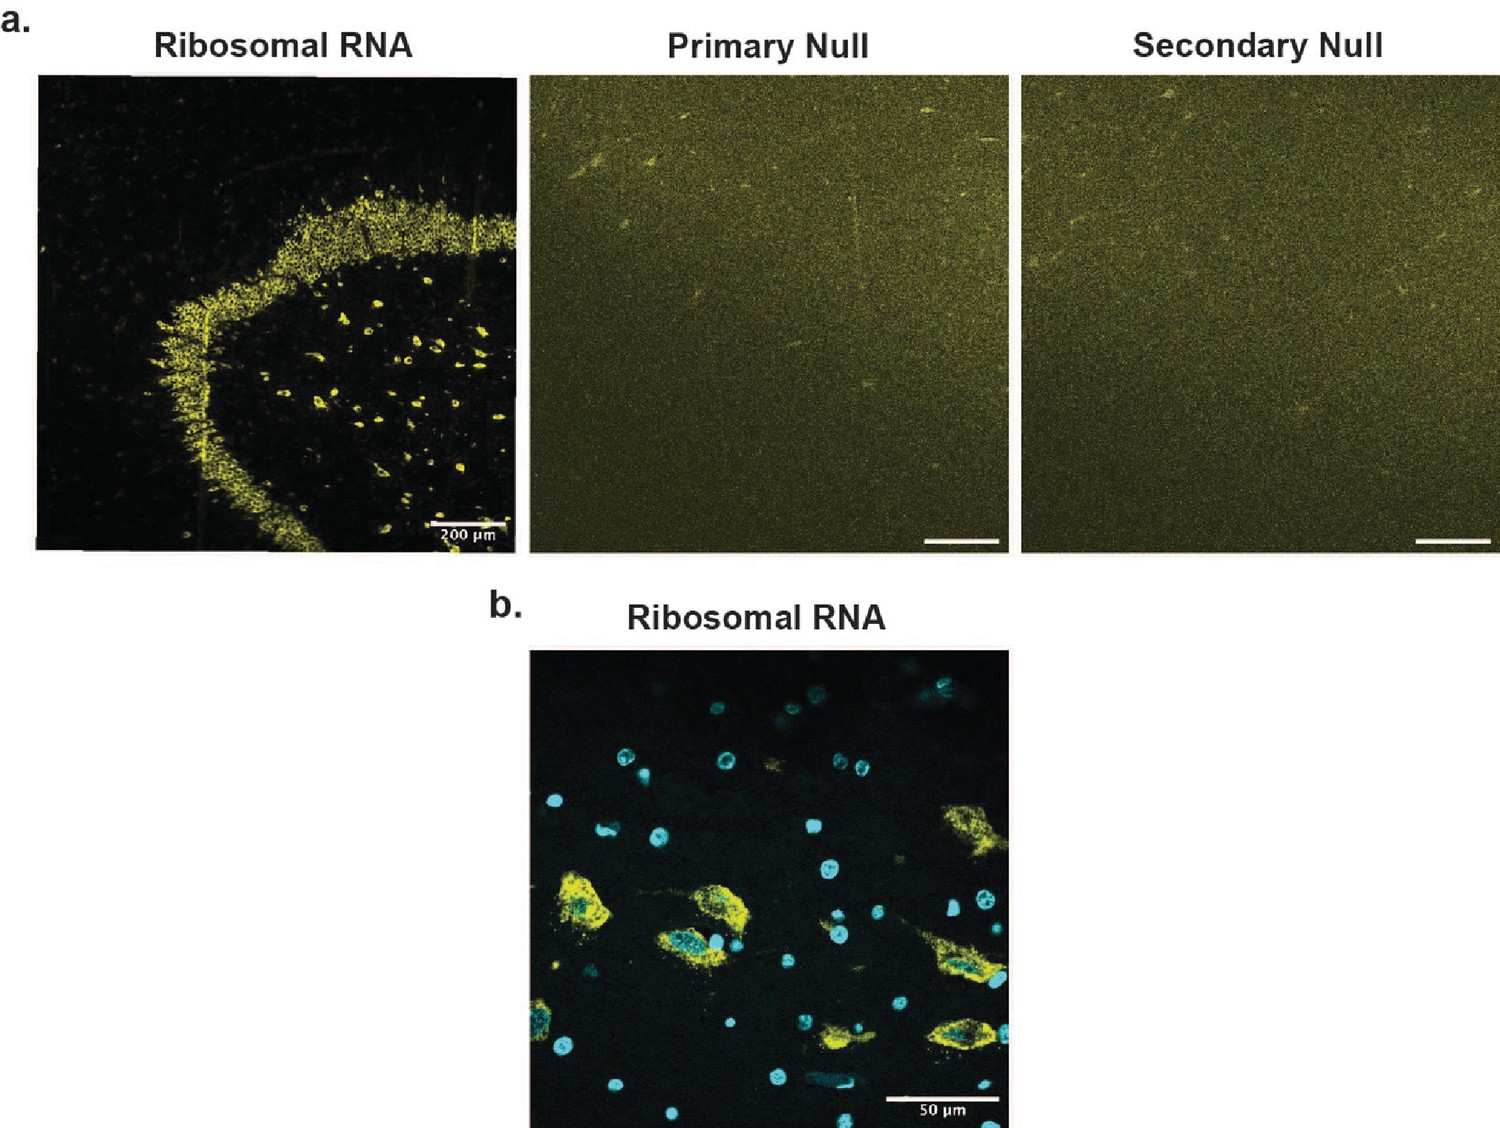
Ribosomal RNA antibody.
(a) (Left) Complete rRNA staining in hippocampal region of a young control individual, using the same staining protocol as for BG4. (Center) rRNA antibody primary null incubated with secondary only. (Right) rRNA antibody secondary null incubated with primary only. (b) ×60 magnification of rRNA antibody.
Figure 4
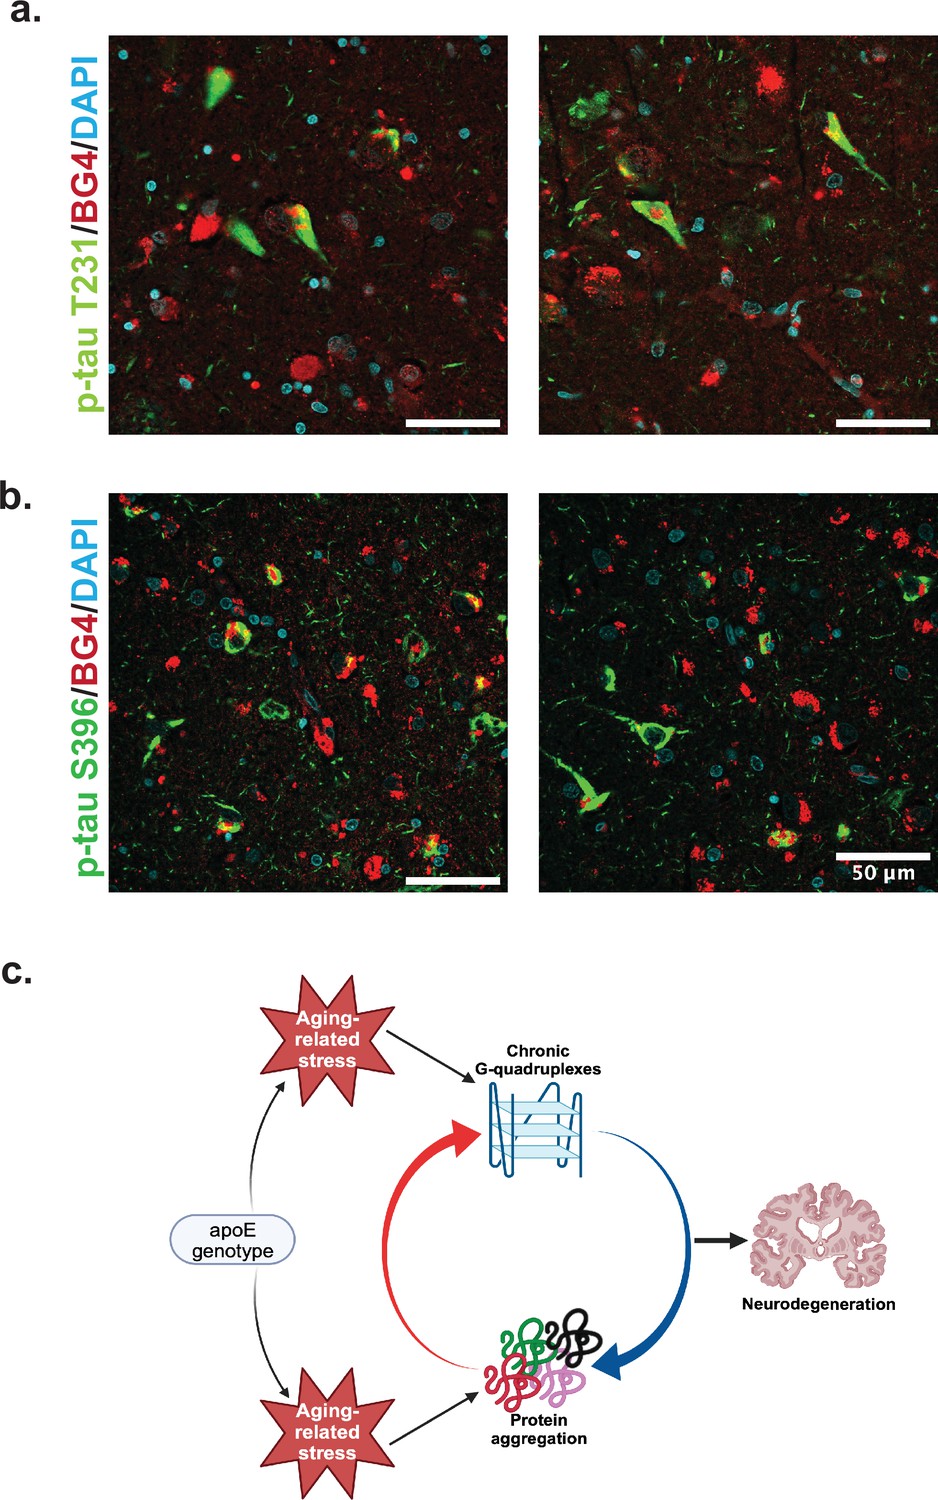
Colocalization of rG4s with p-tau and neurodegeneration model.
(a) Immunofluorescence of human hippocampus from two older Alzheimer’s disease (AD) individuals (cases 8 and 21) showing BG4 (red), DAPI (blue), and p-Tau (green). (b) Proposed model relating chronic rG4 formation and protein aggregation in aging and neurodegeneration.
Additional files
-
Supplementary file 1
Antibodies used in the study and their respective dilutions and sources.
- https://cdn.elifesciences.org/articles/105446/elife-105446-supp1-v1.docx
-
Supplementary file 2
Quantification of BG4 stain by % area in the OML performed by three different individuals, two of which were completely blind to the case information.
Highlighted column is the quantification included in the main text. All three R values are highly significant.
- https://cdn.elifesciences.org/articles/105446/elife-105446-supp2-v1.docx
-
MDAR checklist
- https://cdn.elifesciences.org/articles/105446/elife-105446-mdarchecklist1-v1.docx
Download links
A two-part list of links to download the article, or parts of the article, in various formats.
Downloads (link to download the article as PDF)
Open citations (links to open the citations from this article in various online reference manager services)
Cite this article (links to download the citations from this article in formats compatible with various reference manager tools)
Chronic RNA G-quadruplex accumulation in aging and Alzheimer’s disease
eLife 14:RP105446.
https://doi.org/10.7554/eLife.105446.3


