Pyruvate and related energetic metabolites modulate resilience against high genetic risk for glaucoma
- Department of Ophthalmology, Icahn School of Medicine at Mount Sinai, United States
- Department of Ophthalmology, Vagelos College of Physicians and Surgeons, Columbia University Irving Medical Center, United States
- Department of Ophthalmology, Massachusetts Eye and Ear, Harvard Medical School, United States
- Broad Institute of MIT and Harvard, United States
- NIHR Biomedical Research Centre, Moorfields Eye Hospital NHS Foundation Trust, and University College London Institute of Ophthalmology, United Kingdom
- Channing Division of Network Medicine, Department of Medicine, Harvard Medical School and Brigham and Women's Hospital, United States
- Department of Eye and Vision Science, Institute of Life Course and Medical Sciences, University of Liverpool, United Kingdom
- St. Paul’s Eye Unit, Liverpool University Hospital NHS Foundation Trust, United Kingdom
- Department of Ophthalmology, Keio University School of Medicine, Japan
- Epidemiology and Prevention Group, Center for Public Health Sciences, National Cancer Center, Japan
- Okinawa Kenritsu, Chubu Byoin, Uruma, Japan
- Department of Ophthalmology, St Thomas' Hospital, King's College London, United Kingdom
- Department of Twin Research & Genetic Epidemiology, St Thomas' Hospital, King's College London, United Kingdom
- Department of Genetics and Genomics Science, Icahn School of Medicine at Mount Sinai, United States
- Zuckerman Mind Brain Behavior Institute, Columbia University, United States
Figures
Figure 1
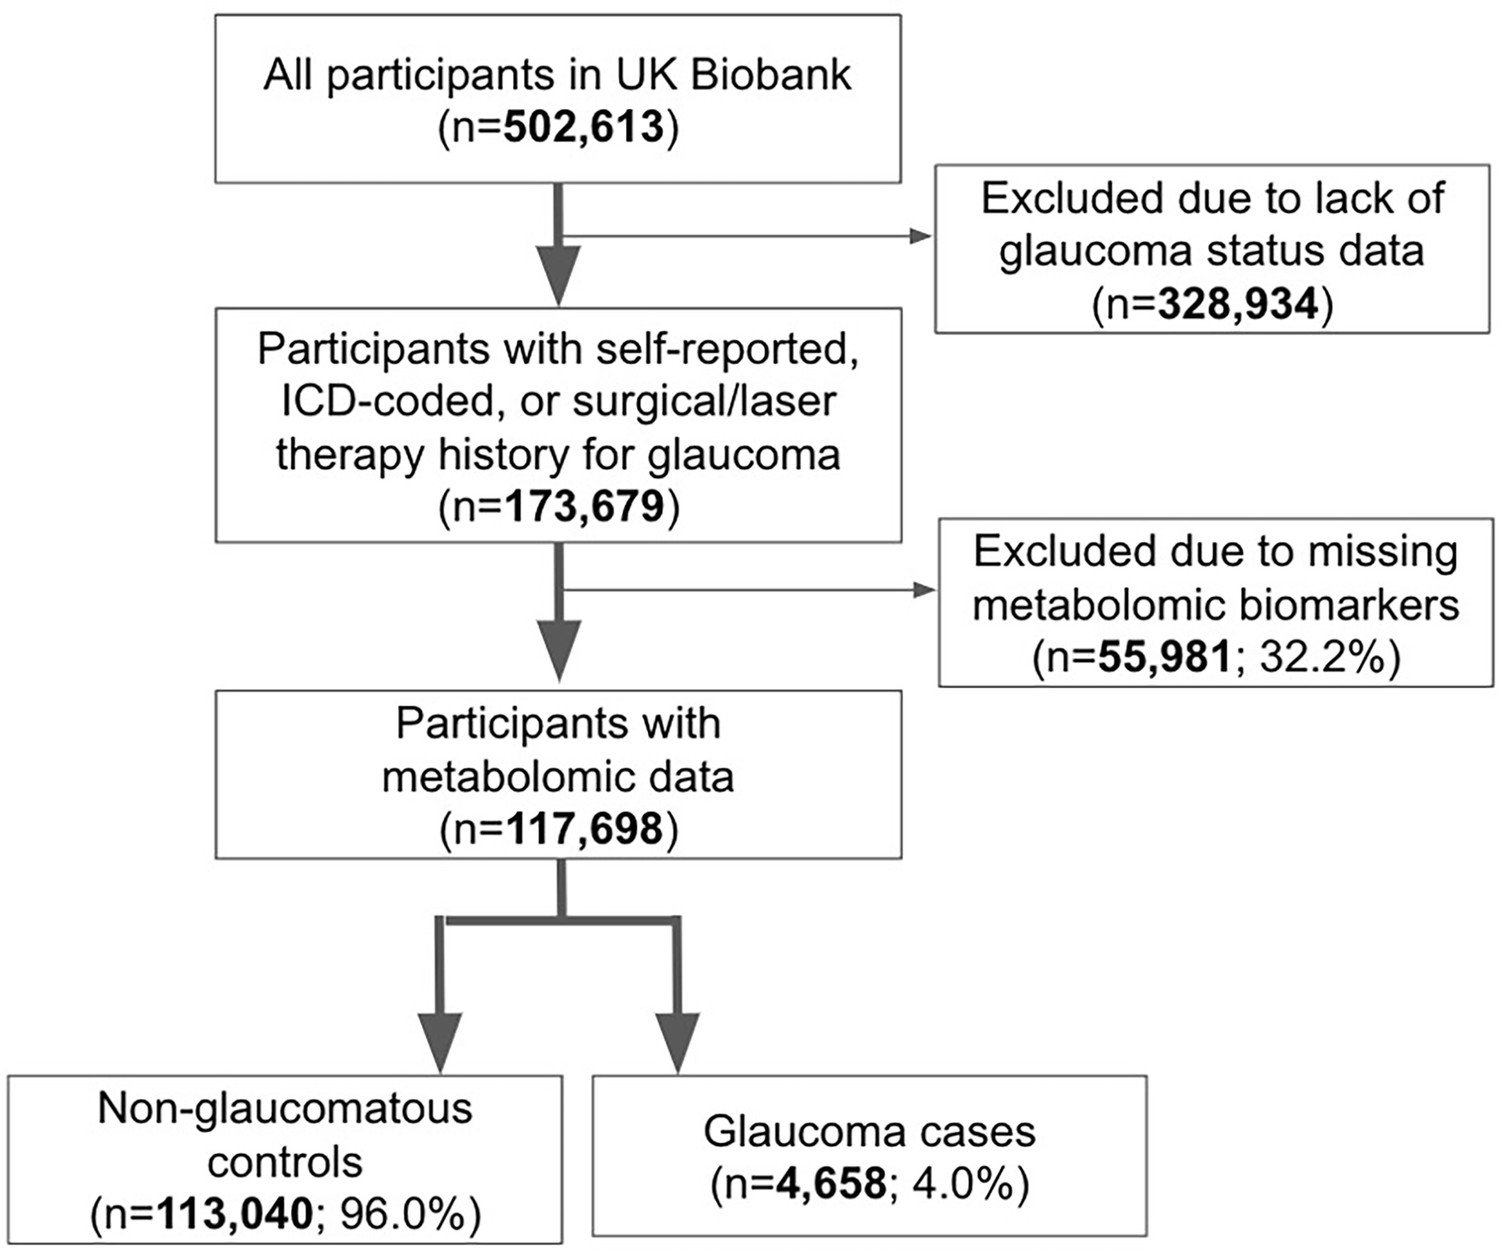
Participant flow chart describing inclusion and exclusion criteria from the UK Biobank.
Figure 2
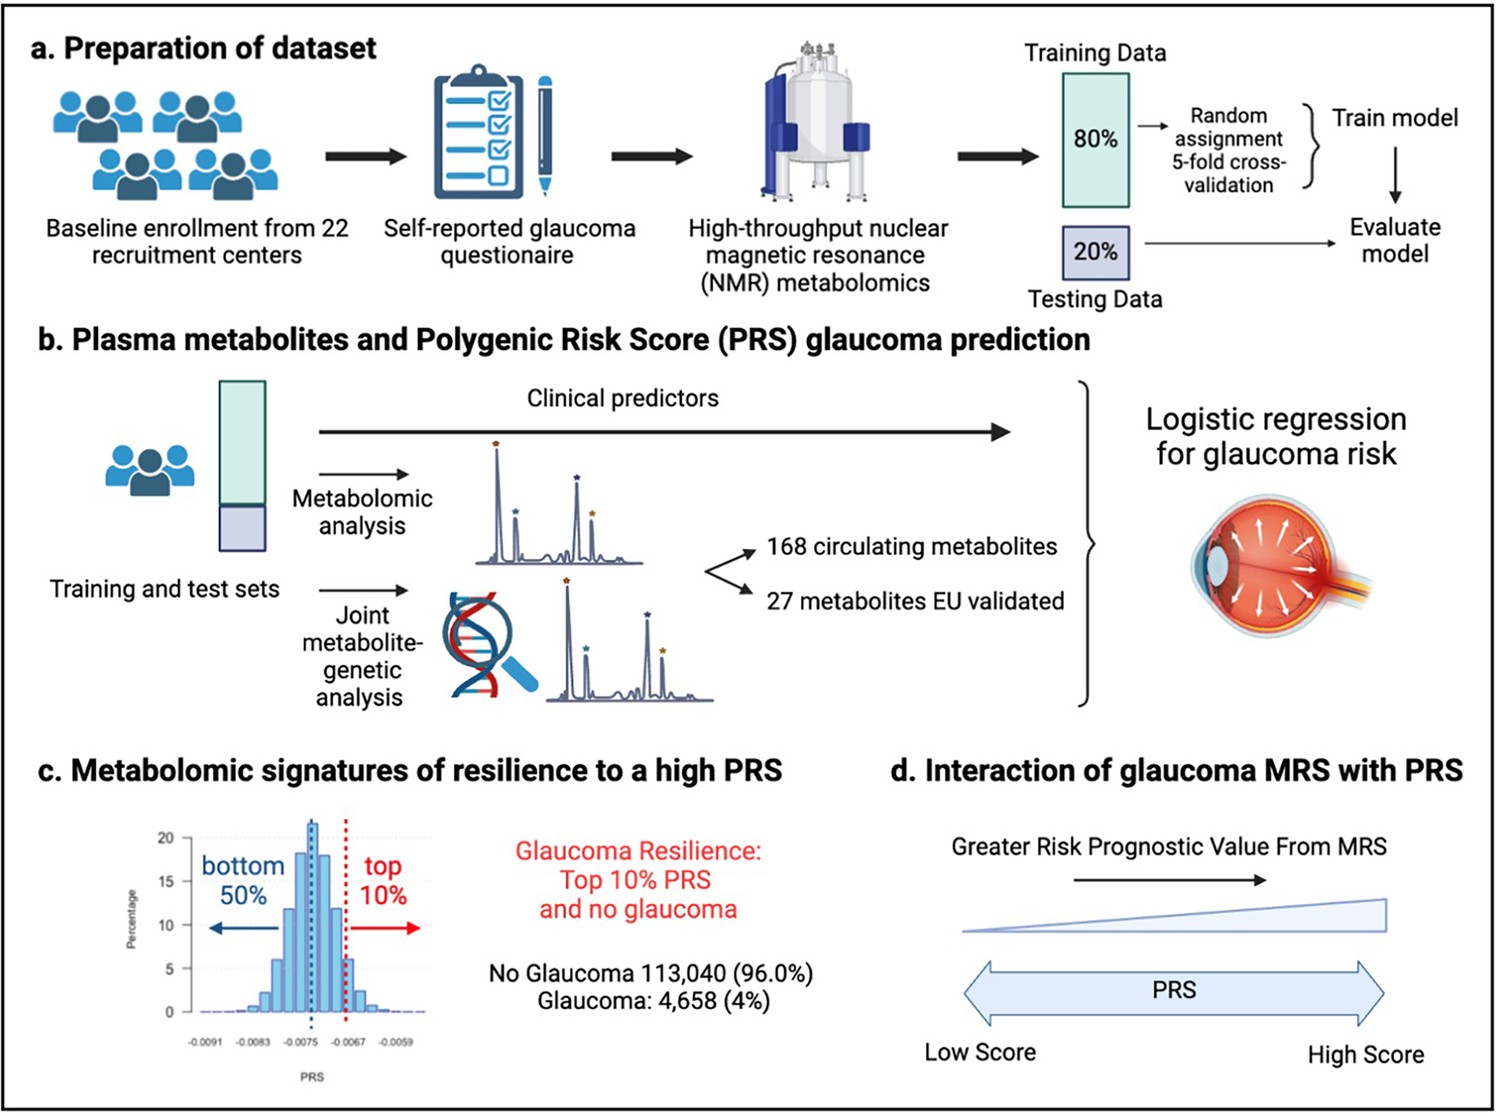
Study design from the UK Biobank.
(a) 117,698 individuals had metabolomics data available from the UK Biobank, which was divided into a training and test set to formulate a metabolic risk score (MRS) model. (b) The inclusion of metabolites (either 168 metabolites on the nuclear magnetic resonance (NMR) platform or a subset of 27 metabolites with European Union (EU) certification) in relation to prevalent glaucoma risk prediction was studied. (c) A histogram of the polygenic risk score (PRS) distribution is shown. Overall, 4,658 cases and 113,040 individuals without glaucoma are available for analysis. The metabolomic signature of resilience to the top 10% of glaucoma PRS was assessed among 1,693 cases (14.4%) and 10,077 individuals without glaucoma (85.6%). (d) Interactions of prevalent glaucoma with MRS and PRS quartiles were examined.
Figure 3
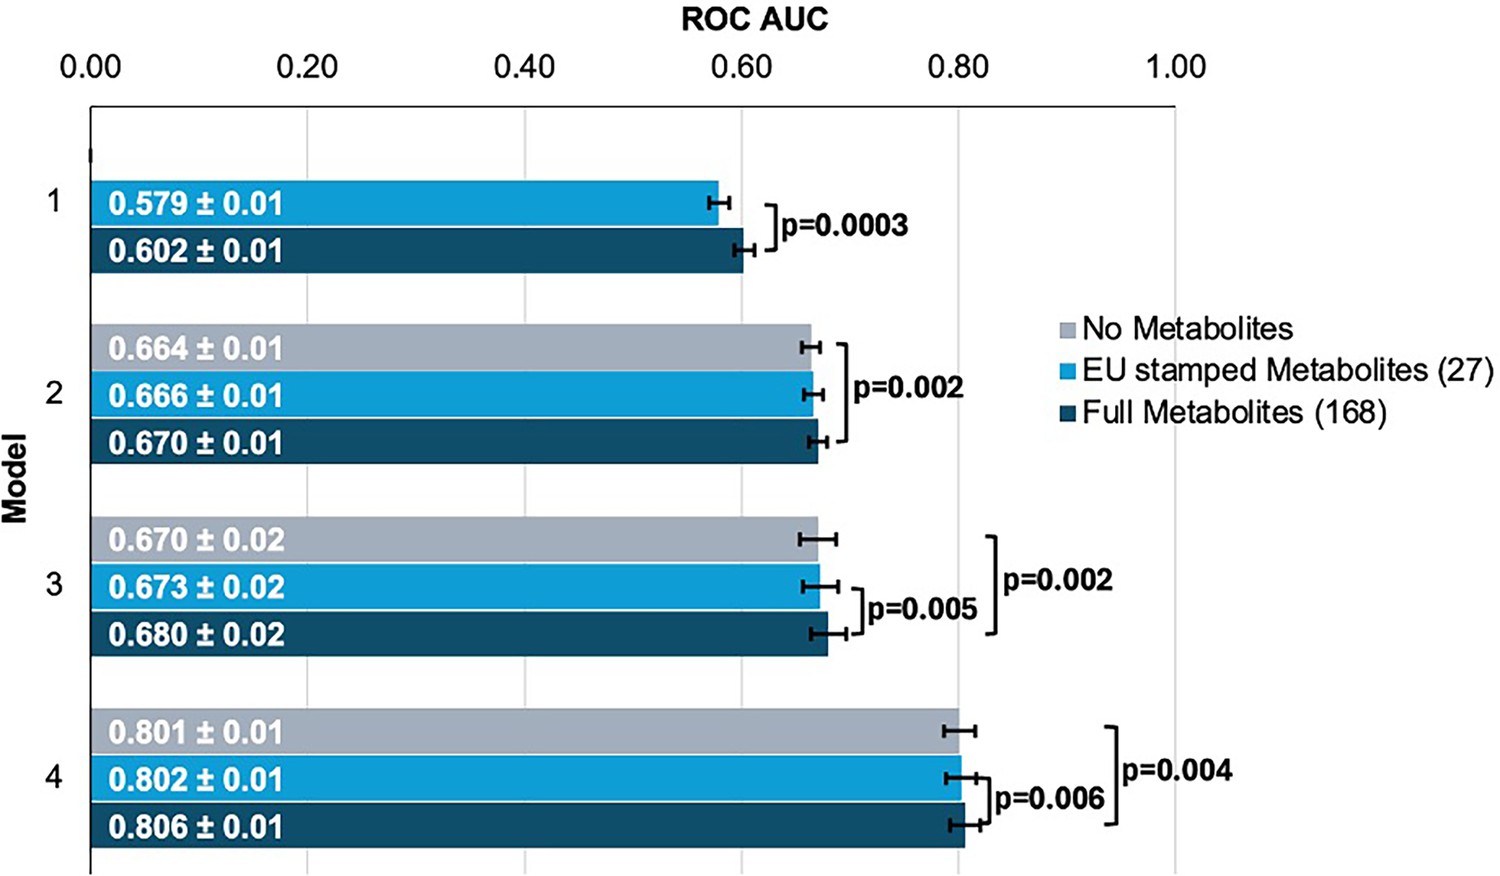
Inclusion of metabolite data into glaucoma prediction algorithms.
Model 1 includes metabolites only; Model 2 incorporates additional covariates including age (years), sex, genetic ancestry, season, time of day of specimen collection, and fasting time; Model 3 incorporates covariates in Model 2 and smoking status (never, past, and current smoker), alcohol intake (g/week), caffeine intake (mg/day), physical activity (metabolic equivalent of task [MET], hours/week), body mass index (kg/m2), average systolic blood pressure (mm Hg), history of diabetes, HbA1c (mmol/mol), history of coronary artery disease, systemic beta-blocker use, oral steroid use, and spherical equivalent refractive error (diopters); Model 4 incorporates covariates in model 3 and a glaucoma polygenic risk score (PRS). Each color represents a different panel of metabolites (gray = no metabolites; light blue = 27 metabolites; and dark blue = 168 metabolites). The white text represents the AUC ± 95% confidence interval. Abbreviations: ROC, receiver operator curve; AUC, area under the curve; EU, European Union.
-
Figure 3—source data 1
Metabolite data beta (effect size) values by model and metabolite groupings.
See the excel supplemental file. Model 1 includes metabolites only; Model 2 incorporates additional covariates including age (years), sex, genetic ancestry, season, time of day of specimen collection, and fasting time; Model 3 incorporates covariates in model 2 and smoking status (never, past, and current smoker), alcohol intake (g/week), caffeine intake (mg/day), physical activity (metabolic equivalent of task [MET], hours/week), body mass index (kg/m2), average systolic blood pressure (mm Hg), history of diabetes, HbA1c (mmol/mol), history of coronary artery disease, systemic beta-blocker use, oral steroid use, and spherical equivalent refractive error (diopters); Model 4 incorporates covariates in model 3 and a glaucoma polygenic risk score. Each color represents a different panel of metabolites (gray = no metabolites; light blue = 27 metabolites; and dark blue = 168 metabolites). The white text represents the AUC ± 95% confidence interval. Abbreviations: EU, European Union.
- https://cdn.elifesciences.org/articles/105576/elife-105576-fig3-data1-v1.xlsx
Figure 4

The distribution of glaucoma cases and no glaucoma stratified by polygenic risk score (PRS) deciles.
Participants were divided into the bottom 50% and top 10% based on their glaucoma PRS, where the prevalence of glaucoma cases from (A) the bottom 50% (n=58,358) was 1.3% and from the top 10% (n=11,770) was 14.4%. (B) Box plot illustrating the distribution of participants with glaucoma (top) and no glaucoma (bottom) as a function of PRS decile. The blue line denotes participants at the bottom 50% of glaucoma PRS, the red line highlights the participants at the top decile of glaucoma PRS, and the red box represents the participants resilient to glaucoma despite high PRS.
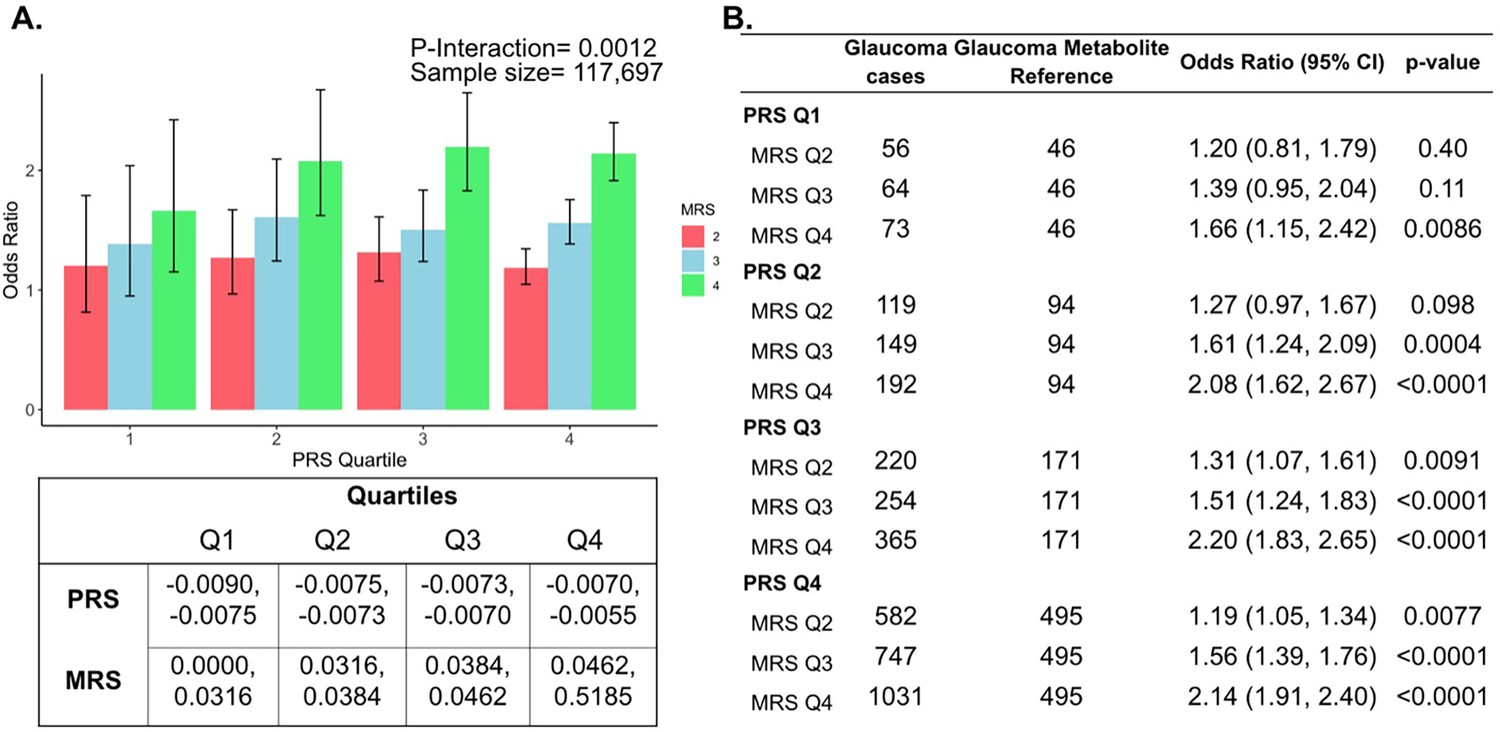
Figure 5
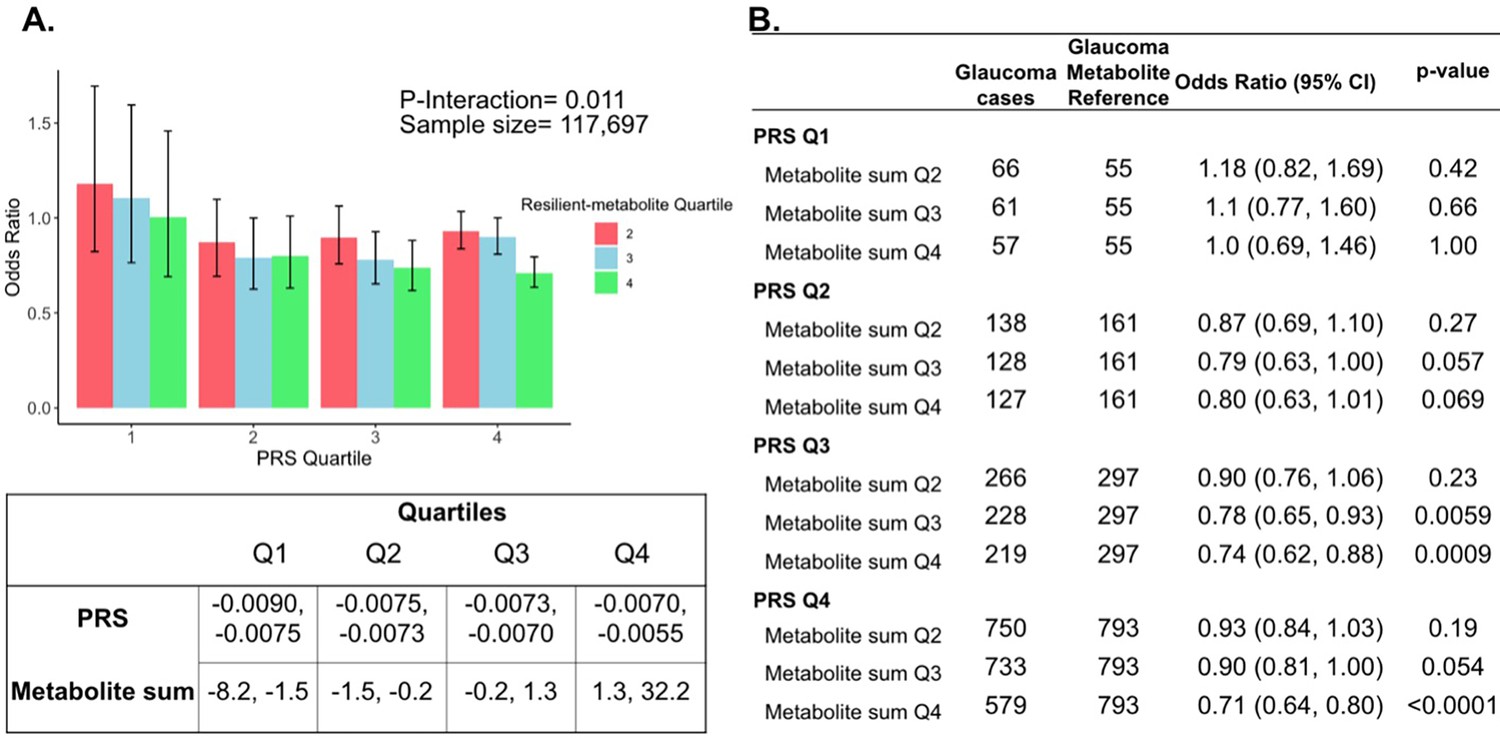
Interaction of three putative resilient metabolites (lactate, pyruvate, and citrate) and polygenic risk score (PRS) on glaucoma risk.
(A) The bar chart shows the interaction of resilient probit-transformed metabolite sum with glaucoma genetic predisposition in each PRS quartile. In each glaucoma PRS quartile, the lowest metabolic sum quartile (Q1) is the metabolite reference group used to calculate the odds ratios. Each color represents resilient-metabolite sum quartiles (red = second quartile; blue = third quartile; and green = fourth quartile). Error bars show 95% confidence interval (CI). The table under the bar chart shows the ranges for the PRS and metabolite sum value quartiles. (B) The table shows odds ratios for glaucoma by PRS, and putative resilient metabolite sum within various quartiles. The number of glaucoma cases within each resilient metabolite sum quartile and the number of glaucoma cases in the first quartile of resilient metabolite sum (Q1, labeled as glaucoma metabolite reference) are used to calculate the odd ratios. This analysis is adjusted for time since the last meal/drink (hours), age (years), age-squared (years-squared), sex, ethnicity (Asian, Black, White, and other), season, time of day of specimen collection (morning, afternoon, night), smoking status (never, past, and current smoker), alcohol intake, caffeine intake, physical activity (metabolic equivalent of task [MET] hours/week), body mass index (kg/m2), average systolic blood pressure (mm Hg), history of diabetes (yes or no), HbA1c (mmol/mol), history of coronary artery disease, systemic beta-blocker use, oral steroid use, and spherical equivalent refractive error (diopters).
Figure 6

Interaction of the holistic metabolite risk score (n=168 metabolites) and polygenic risk score (PRS) on glaucoma risk.
(A) The bar chart plots the odds ratio of glaucoma as a function of holistic probit-transformed MRS quartile with further stratification by glaucoma PRS in each MRS bin. The lowest quartile of glaucoma PRS and MRS is the reference group (see dotted red line) for the entire population. Each color represents the MRS quartiles (red = first quartile; blue = second quartile; green = third quartile; and purple = fourth quartile). Error bars show the 95% confidence interval (CI). The table under the bar chart shows the ranges for the PRS and MRS quartiles. (B) Table showing odds ratios for glaucoma by polygenic risk score (PRS) and MRS within various quartiles. The number of glaucoma cases within each MRS and the number of glaucoma cases in PRS Q1 and MRS Q1 are used to calculate the odds ratios. This analysis is adjusted for time since the last meal/drink (hours), age (years), age-squared (years-squared), sex, ethnicity (Asian, Black, White, and other), season, time of day of specimen collection (morning, afternoon, night), smoking status (never, past, and current smoker), alcohol intake, caffeine intake, physical activity (metabolic equivalent of task [MET] hours/week), body mass index (kg/m2), average systolic blood pressure (mm Hg), history of diabetes (yes or no), HbA1c (mmol/mol), history of coronary artery disease, systemic beta-blocker use, oral steroid use, and spherical equivalent refractive error (diopters).
Figure 7
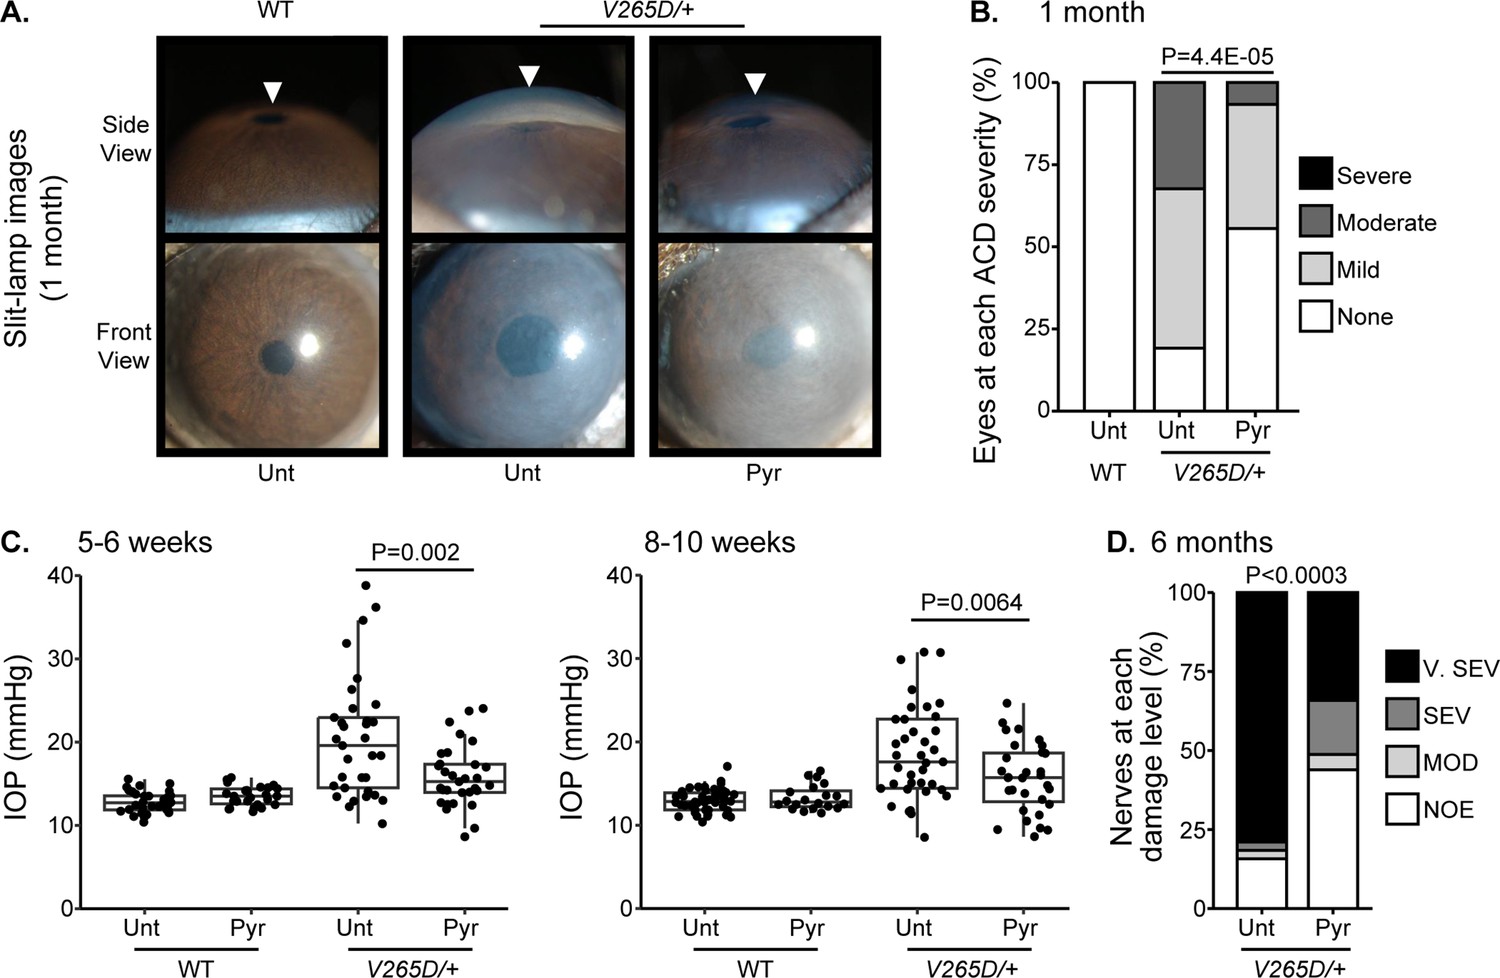
Pyruvate treatment protects from intraocular pressure (IOP) elevation and glaucoma.
(A) Representative photos of eyes from mice of the indicated genotypes and treatments (Unt = untreated, Pyr = pyruvate treated). Lmx1b is expressed in the iris and cornea, so Lmx1bV265D mutant eyes have primary abnormalities of the iris and cornea. This includes corneal haze, which is present before IOP elevation in many eyes and likely reflects a direct transcriptional role of LMX1B in collagen gene expression. Lmx1bV265D mutant eyes also develop anterior chamber deepening (ACD), a sensitive indicator of IOP elevation in mice. The WT and pyruvate-treated mutant eyes have shallow anterior chambers, while the untreated mutant eye has a deepened chamber (arrowheads). (B) Distributions of ACD are based on a previously defined scoring system.31 Groups are compared by Fisher’s exact test. n > 40 eyes were examined in each group. (C) Boxplots of IOP (interquartile range and median line) in WT and mutant eyes. Pyruvate treatment significantly lessens IOP elevation in mutants compared to untreated mutant controls. Groups were compared by ANOVA followed by Tukey’s honestly significant difference. n > 30 eyes were examined in each Lmx1bV265D mutant group, and n > 20 eyes were examined in WT groups. (D) Distributions of damage based on analysis of para-phenylenediamine (PPD)-stained optic nerve cross sections from 6-mo-old mice (Methods). Pyruvate treatment lessened the incidence of glaucoma (Fisher's exact test). No glaucoma was found in WT mice. Geno = genotype. n = 38-41 nerves examined per group. NOE = no glaucoma, MOD = moderate. SEV = severe, and V. SEV = very severe (see Methods).
Appendix 2—figure 1
Interaction of the holistic metabolite risk score (n=168 metabolites) and polygenic risk score (PRS) on glaucoma risk.
(A) The bar chart shows the interaction of holistic probit-transformed metabolite risk score (MRS) with glaucoma genetic predisposition in each PRS quartile. In each glaucoma PRS quartile, the lowest metabolic sum quartile (Q1) is the metabolite reference group used to calculate the odds ratios. Each color represents the MRS quartiles (red = second quartile; blue = third quartile; and green = fourth quartile). Error bars show 95% confidence interval (CI). The table under the bar chart shows the ranges for the PRS and MRS quartiles. (B) Table showing odds ratios for glaucoma by polygenic risk score (PRS) and MRS within various quartiles. The number of glaucoma cases within each MRS quartile and the number of glaucoma cases in the first quartile of MRS (Q1), labeled as glaucoma metabolite reference, are used to calculate the odds ratios. This analysis is adjusted for time since the last meal/drink (hours), age (years), age-squared (years-squared), sex, ethnicity (Asian, Black, White, and other), season, time of day of specimen collection (morning, afternoon, night), smoking status (never, past, and current smoker), alcohol intake, caffeine intake, physical activity (metabolic equivalent of task [MET] hours/week), body mass index (kg/m2), average systolic blood pressure (mm Hg), history of diabetes (yes or no), HbA1c (mmol/mol), history of coronary artery disease, systemic beta-blocker use, oral steroid use, and spherical equivalent refractive error (diopters).
Appendix 2—figure 2
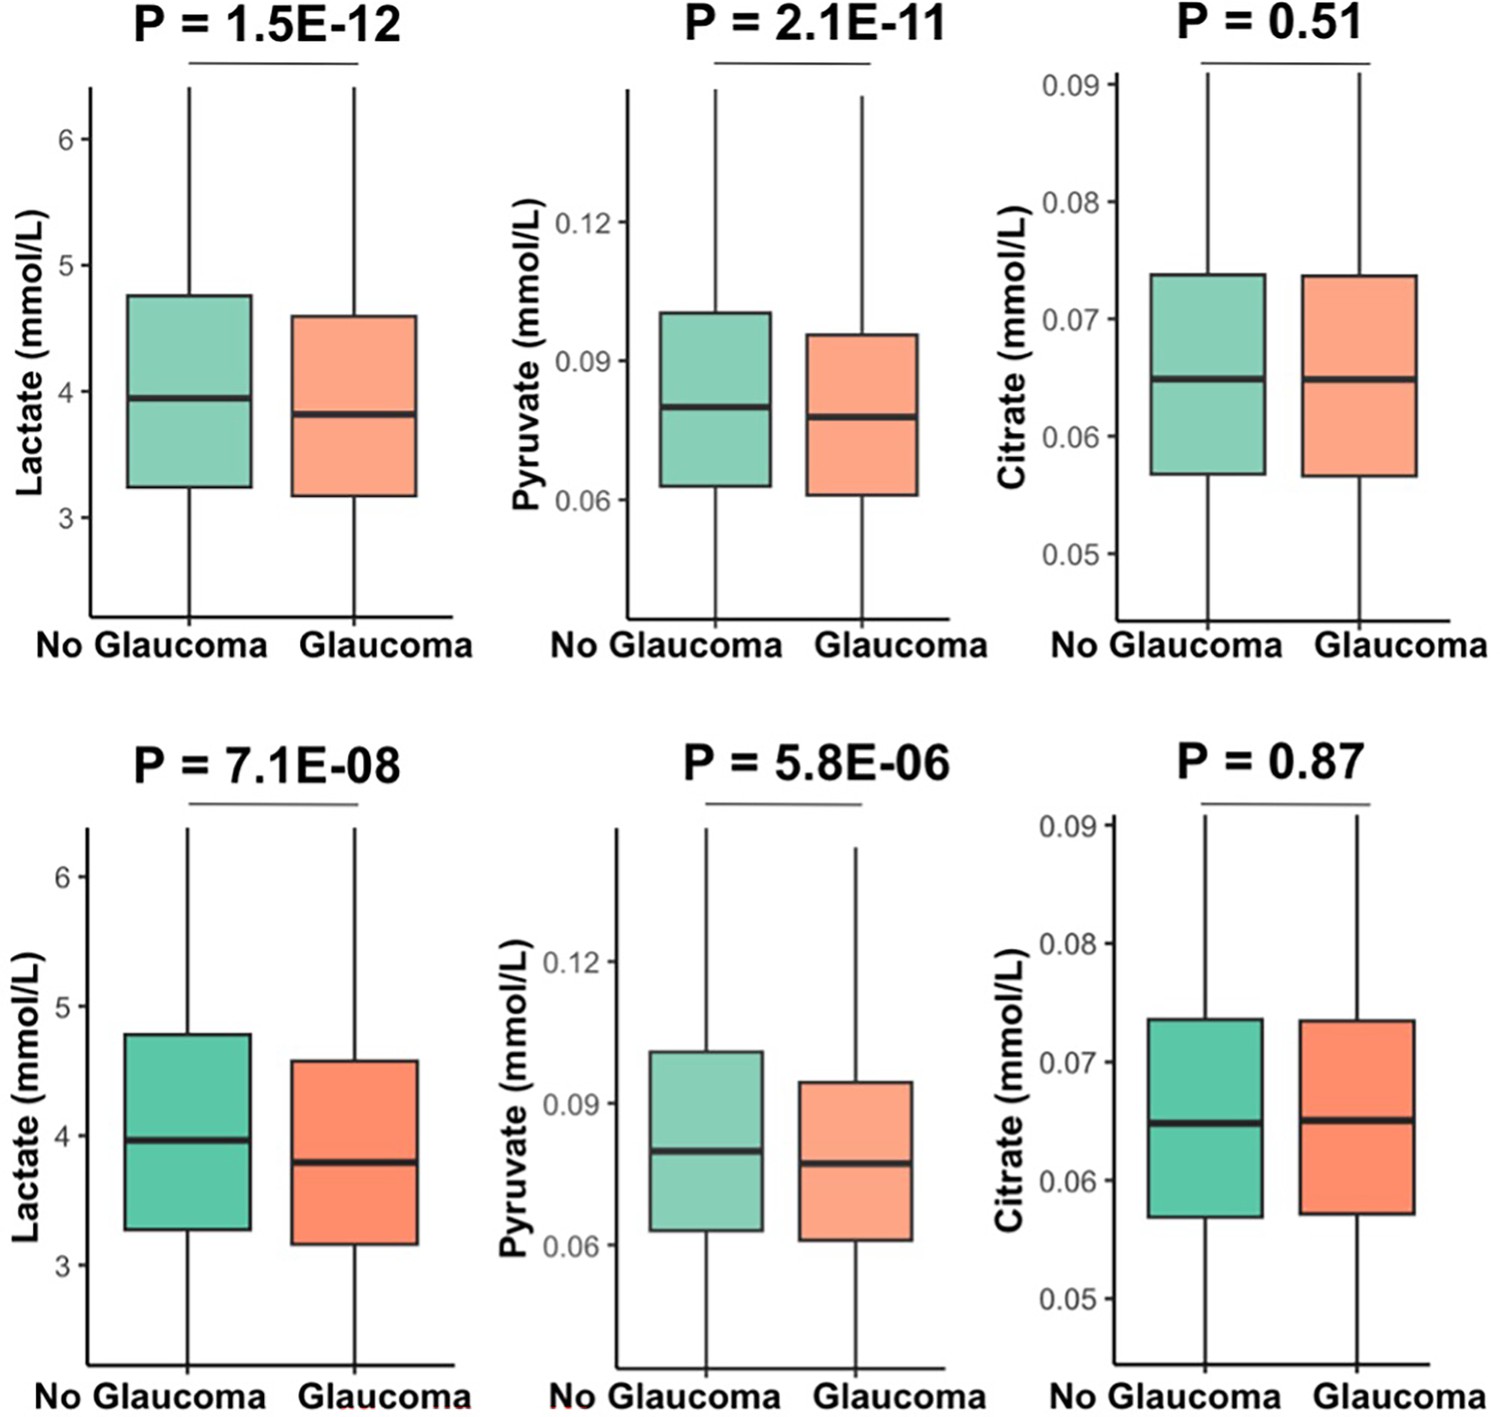
Unadjusted levels of plasma metabolites lactate, pyruvate, and citrate in all UK Biobank participants (top row) and among the top 10% of glaucoma polygenic risk score (bottom row).
Author response image 1

Tables
Table 1
Demographic and clinical characteristics of the UK Biobank study population assessed in 2006–2010.
| Characteristic | No Glaucoma | Glaucoma | p-value |
|---|---|---|---|
| Sample Size (%) | 113,040 (96) | 4,658 (4) | |
| Sex - Male (%) | 52,497 (46.4) | 2,493 (53.5) | <0.001 |
| Age at recruitment, years, (mean (SD)) | 56.7 (8.0) | 60.9 (6.6) | <0.001 |
| Ethnicity (%) | 0.0010 | ||
| White | 105,912 (94) | 4,331 (93) | |
| Asian | 2,977 (2.6) | 127 (2.7) | |
| Black | 2,228 (2.0) | 130 (2.8) | |
| Other | 1,923 (1.7) | 70 (1.5) | |
| Genetic Ancestry (%) | <0.001 | ||
| African | 1,911 (1.7) | 123 (2.7) | |
| AMR | 261 (0.2) | 2 (0.0) | |
| Asian | 3,125 (2.8) | 134 (2.9) | |
| European | 96,991 (86.6) | 4,001 (86.7) | |
| Smoking Status (%) | <0.001 | ||
| Never | 63,240 (56) | 2,339 (52) | |
| Prefer not to answer | 430 (0.4) | 16 (0.4) | |
| Previous | 38,926 (34) | 1,732 (39) | |
| Current | 10,605 (9.4) | 410 (9.1) | |
| Total Cholesterol, mmol/l (median [IQR]) | 4.6 [3.98, 5.22] | 4.5 [3.88, 5.18] | <0.001 |
| Physical Activity, MET-minutes per week (mean (SD)) | 2,465 (2,430) | 2,458 (2,438) | 0.84 |
| Body Mass Index, kg/m2 (mean (SD)) | 27.4 (4.8) | 27.7 (4.7) | <0.001 |
| HbA1c, mmol/mol (mean (SD)) | 36.0 (5.8) | 37.4 (6.8) | <0.001 |
| Spherical Equivalent, diopter (mean (SD)) | –0.1 (2.1) | –0.1 (1.9) | 0.67 |
| Intraocular pressure, mmHg (mean (SD)) | 15.9 (2.6) | 17.8 (4.5) | <0.001 |
| mRNFL thickness, μm (mean (SD)) | 28.7 (1.8) | 28.5 (1.3) | <0.001 |
| Beta blocker use (%) | 8398 (7.4) | 447 (9.6) | <0.001 |
| Caffeine intake, mg/day (mean (SD)) | 165 (67) | 168 (59) | 0.0020 |
| Alcohol intake, g/week (median [IQR]) | 84 [40.3, 146.9] | 84 [48.0, 154.6] | <0.001 |
| Diabetes (%) | 6,512 (5.8) | 463 (9.9) | <0.001 |
| Oral steroid use (%) | 3,043 (2.7) | 184 (4.0) | <0.001 |
| Coronary Artery Disease (%) | 5,153 (4.6) | 377 (8.1) | <0.001 |
-
SD, standard deviation; IQR, interquartile range; AMR, mixed American; MET metabolic equivalent of task; mRNFL, macular retinal nerve fiber layer.
Table 2
Stratification of glaucoma by ethnicity, age, and gender for predictive assessment with and without using metabolite data.
| Stratification | Sample size | Glaucoma cases | No Metabolites (AUC) | Metabolites (AUC) | p-value |
|---|---|---|---|---|---|
| Ethnicity | |||||
| White | 110,243 | 4,331 | 0.675 | 0.686 | <0.001 |
| Asian | 3,104 | 127 | 0.780 | 0.768 | 0.062 |
| Black | 2,358 | 130 | 0.704 | 0.706 | 0.52 |
| Age | |||||
| <55 years | 43,648 | 788 | 0.576 | 0.566 | 0.52 |
| ≥55 years | 74,050 | 3,870 | 0.569 | 0.596 | 0.002 |
| Gender | |||||
| Female | 62,708 | 2,165 | 0.689 | 0.696 | 0.25 |
| Male | 54,990 | 2,493 | 0.659 | 0.673 | 0.002 |
-
The area under the curve (AUC) of the receiver operating characteristic (ROC) curve was calculated for each demographic stratification to evaluate the predictive performance of models both with and without metabolite data. Differences in model AUC were tested using the DeLong test, and p-values were reported. For models excluding metabolite data, the predictors include as appropriate, age (years), sex, genetic ancestry, season, time of day of specimen collection, fasting time (hours), smoking status (never, past, and current smoker), alcohol intake (g/week), caffeine intake (mg/day), physical activity (metabolic equivalent of task [MET], hours/week), body mass index (kg/m2), average systolic blood pressure (mm Hg), history of diabetes, HbA1c (mmol/mol), history of coronary artery disease, systemic beta-blocker use, oral steroid use, and spherical equivalent refractive error (diopters). Models including metabolite data incorporated the same predictors with the addition of the 168 metabolite measurements.
Table 3
Demographic and clinical characteristics in 2006–2010 of UK Biboank participants among the top 10% of glaucoma polygenic risk score.
| Characteristic | No Glaucoma | Glaucoma | p-value |
|---|---|---|---|
| Sample size (%) | 10,077 (85.6) | 1,693 (14.4) | |
| Sex - Male (%) | 4,667 (46.3) | 893 (52.7) | <0.001 |
| Age at recruitment, years, (mean (SD)) | 56.3 (8.0) | 61.0 (6.3) | <0.001 |
| Ethnicity (%) | <0.001 | ||
| White | 9,256 (91.9) | 1,636 (96.6) | |
| Asian | 279 (2.8) | 24 (1.4) | |
| Black | 345 (3.4) | 20 (1.2) | |
| Other | 197 (2.0) | 13 (0.8) | |
| Smoking Status (%) | 0.0030 | ||
| Never | 5,806 (57.6) | 899 (53.1) | |
| Prefer not to answer | 48 (0.5) | 5 (0.3) | |
| Previous | 3402 (33.8) | 640 (37.8) | |
| Current | 821 (8.1) | 149 (8.8) | |
| Physical Activity, MET-minutes per week (mean (SD)) | 2,439 (2,352) | 2,514 (2,480) | 0.23 |
| Body mass index, kg/m2 (mean (SD)) | 27.4 (4.7) | 27.7 (4.8) | 0.0080 |
| HbA1c, mmol/mol (mean (SD)) | 36.00 (5.9) | 37.0 (6.1) | <0.001 |
| Spherical Equivalent, diopter (mean (SD)) | –0.3 (2.2) | –0.2 (1.9) | 0.0090 |
| Intraocular pressure, mmHg (mean (SD)) | 17.2 (3.0) | 18.3 (5.0) | <0.001 |
| mRNFL thickness, μm (mean (SD)) | 28.7 (1.8) | 28.5 (1.2) | <0.001 |
| Beta blocker use (%) | 719 (7.1) | 179 (10.6) | <0.001 |
| Caffeine intake, mg/day (mean (SD)) | 164 (65) | 170 (60) | 0.0010 |
| Alcohol intake, g/week (median [IQR]) | 84 [38.6, 145.3] | 84 [51.5, 155.3] | 0.002 |
| Diabetes mellitus (%) | 607 (6.0) | 151 (8.9) | <0.001 |
| Oral steroid use (%) | 292 (2.9) | 59 (3.5) | 0.22 |
| Coronary Artery Disease (%) | 443 (4.4) | 148 (8.7) | <0.001 |
| Total cholesterol, mmol/l (median [IQR]) | 4.61 [4.00, 5.25] | 4.54 [3.90, 5.21] | 0.006 |
| Lactate, mmol/l (median [IQR]) | 3.96 [3.27, 4.78] | 3.79 [3.16, 4.58] | <0.001 |
| Pyruvate, mmol/l (median [IQR]) | 0.080 [0.06, 0.10] | 0.077 [0.06, 0.09] | <0.001 |
| Citrate, mmol/l (median [IQR]) | 0.065 [0.06, 0.07] | 0.065 [0.06, 0.07] | 0.87 |
| Cholesteryl Esters in Small HDL, mmol/l (median [IQR]) | 0.33 [0.30, 0.36] | 0.33 [0.30, 0.36] | 0.005 |
| Triglycerides in Very Large VLDL, mmol/l (median [IQR]) | 0.091 [0.05, 0.15] | 0.10 [0.05, 0.17] | <0.001 |
| Alanine, mmol/l (median [IQR]) | 0.29 [0.24, 0.35] | 0.29 [0.24, 0.35] | 0.58 |
| Triglycerides in Chylomicrons and extremely Large VLDL, mmol/l (median [IQR]) | 0.088 [0.03, 0.18] | 0.10 [0.04, 0.21] | <0.001 |
| Acetoacetate, mmol/l (median [IQR]) | 0.010 [0.01, 0.02] | 0.011 [0.01, 0.02] | <0.001 |
| Cholesteryl Esters in Medium HDL, mmol/l (median [IQR]) | 0.41 [0.34, 0.48] | 0.40 [0.34, 0.47] | 0.003 |
| Triglycerides in Large VLDL, mmol/l (median [IQR]) | 0.15 [0.09, 0.22] | 0.16 [0.10, 0.23] | <0.001 |
| Cholesterol in Medium HDL, mmol/l (median [IQR]) | 0.49 [0.42, 0.58] | 0.48 [0.41, 0.57] | 0.005 |
-
SD, standard deviation; IQR, interquartile range; MET, metabolic equivalent of task; HbA1c, hemoglobin A1C; mRNFL, macular retinal nerve fiber layer; HDL, high-density lipoprotein; VLDL, very low-density lipoprotein.
Table 4
Demographic and clinical characteristics in 2006–2010 of UK Biobank participants among the bottom 50% of glaucoma polygenic risk score.
| Characteristic | No Glaucoma | Glaucoma | p-value | ||
|---|---|---|---|---|---|
| Sample size (%) | 57,578 (98.7) | 780 (1.3) | |||
| Sex - Male (%) | 26,887 (46.7) | 409 (52.4) | 0.002 | ||
| Age at recruitment, years, (mean (SD)) | 57 (8.0) | 60 (7.0) | <0.001 | ||
| Ethnicity (%) | <0.001 | ||||
| White | 55,034 (96) | 690 (89) | |||
| Asian | 1,129 (2.0) | 41 (5.3) | |||
| Black | 574 (1.0) | 27 (3.5) | |||
| Other | 841 (1.5) | 22 (2.8) | |||
| Smoking Status (%) | 0.67 | ||||
| Never | 200 (0.3) | 4 (0.5) | |||
| Prefer not to answer | 31,593 (54.9) | 418 (53.6) | |||
| Previous | 20,276 (35.2) | 287 (36.8) | |||
| Current | 5,509 (9.6) | 71 (9.1) | |||
| MET, minutes per week (mean (SD)) | 2,483 (2,450) | 2,612 (2,562) | 0.14 | ||
| Body mass index kg/m2 (mean (SD)) | 27.4 (4.8) | 27.8 (4.7) | 0.021 | ||
| HbA1c, mmol/mol (mean (SD)) | 35.9 (5.7) | 38.1 (7.8) | <0.001 | ||
| Spherical Equivalent, diopter (mean (SD)) | –0.03 (2.1) | 0.01 (1.9) | 0.63 | ||
| Intraocular pressure, mmHg (mean (SD)) | 15.4 (2.4) | 17.1 (3.9) | <0.001 | ||
| mRNFL thickness, μm (mean (SD)) | 28.7 (1.7) | 28.6 (1.3) | 0.02 | ||
| Beta blocker use (%) | 4,322 (7.5) | 71 (9.1) | 0.11 | ||
| Caffeine intake, mg/day (mean (SD)) | 1,66.3 (67.4) | 166.6 (61.5) | 0.90 | ||
| Alcohol intake, g/week (median [IQR]) | 84 [41.7, 149.3] | 84 [42.5, 145.9] | 0.91 | ||
| Diabetes (%) | 3,209 (5.6) | 104 (13.3) | <0.001 | ||
| Oral steroid use (%) | 1,538 (2.7) | 39 (5.0) | <0.001 | ||
| Coronary Artery Disease (%) | 2,656 (4.6) | 64 (8.2) | <0.001 | ||
| Total cholesterol, mmol/l (median [IQR]) | 4.59 [3.98, 5.22] | 4.49 [3.76, 5.13] | 0.001 | ||
| Lactate, mmol/l (median [IQR]) | 3.95 [3.24, 4.75] | 3.84 [3.21, 4.69] | 0.16 | ||
| Concentration of Small HDL Particles, mmol/l (median [IQR]) | 0.0097 [0.0089, 0.011] | 0.0095 [0.0088, 0.010] | 0.002 | ||
| Cholesteryl esters in small HDL, mmol/l (median [IQR]) | 0.33 [0.30, 0.36] | 0.32 [0.30, 0.36] | 0.001 | ||
| Albumin, mmol/l (median [IQR]) | 39.4 [37.3, 41.45] | 38.9 [36.7, 40.8] | <0.001 | ||
| Total lipids in small HDL, mmol/l (median [IQR]) | 1.16 [1.06, 1.26] | 1.15 [1.05, 1.25] | 0.018 | ||
| Citrate, mmol/l (median [IQR]) | 0.065 [0.057, 0.074] | 0.065 [0.057, 0.073] | 0.52 | ||
| Pyruvate, mmol/l (median [IQR]) | 0.080 [0.06, 0.10] | 0.079 [0.061, 0.098] | 0.14 | ||
| Alanine, mmol/l (median [IQR]) | 0.29 [0.24, 0.35] | 0.29 [0.24, 0.35] | 0.95 | ||
| Phospholipids in Small HDL, mmol/l (median [IQR]) | 0.66 [0.60, 0.72] | 0.66 [0.60, 0.71] | 0.033 | ||
-
SD, standard deviation; MET, metabolic equivalents; HbA1c, hemoglobin A1C; mRNFL, macula region retinal nerve fiber layer; HDL, high density lipoprotein; VLDL, very low density lipoprotein.
Table 5
Metabolites associated with glaucoma among UK Biobank participants in the top decile and the bottom half of glaucoma polygenic risk score.
| Top 10% of glaucoma polygenic risk scorpe | |||
|---|---|---|---|
| Metabolites (Probit score) | Glaucoma | No Glaucoma | Adjusted p-value (NEF) |
| Lactate | –0.146 | 0.0239 | 8.8E-12 |
| Pyruvate | –0.137 | 0.0117 | 2.9E-10 |
| Citrate | –0.0693 | 0.0079 | 0.018 |
| Triglycerides in Very Large VLDL | 0.0606 | –0.0043 | 0.10 |
| Triglycerides in Chylomicrons and Extremely Large VLDL | 0.0572 | –0.0076 | 0.11 |
| Acetoacetate | 0.0744 | 0.0011 | 0.11 |
| Cholesteryl Esters in Small HDL | –0.0239 | 0.0376 | 0.12 |
| Cholesteryl Esters in Medium HDL | –0.0261 | 0.0276 | 0.13 |
| Alanine | –0.0612 | –0.0006 | 0.14 |
| Triglycerides in Large VLDL | 0.0629 | 0.0005 | 0.15 |
-
Potential confounders adjusted by regression include time since the last meal/drink (hours), age (years), age-squared (years-squared), sex, ethnicity (Asian, Black, White, and other), season, time of day of specimen collection (morning, afternoon, night), smoking status (never, past, and current smoker), alcohol intake, caffeine intake, physical activity (metabolic equivalent of task [MET] hours/week), body mass index (kg/m2), average systolic blood pressure (mm Hg), history of diabetes (yes or no), HbA1c (mmol/mol), history of coronary artery disease, systemic beta- blocker use, oral steroid use, and spherical equivalent refractive error (diopters).
Appendix 2—table 1
Metabolic risk score beta (effect size) values for all UK Biobank participants (N=117,698).
| Metabolites | Beta-values |
|---|---|
| (Intercept) | –3.23 |
| Total Cholesterol | 548.50 |
| Cholesterol in Large HDL | 520.19 |
| Total Lipids in VLDL | 408.18 |
| Triglycerides in Chylomicrons and Extremely Large VLDL | 385.93 |
| Cholesterol in Chylomicrons and Extremely Large VLDL | 376.00 |
| Cholesteryl Esters in Very Large VLDL | 373.35 |
| Triglycerides in Very Large VLDL | 354.40 |
| Omega-6 Fatty Acids | 350.81 |
| Free Cholesterol in Large LDL | 343.95 |
| Phospholipids in VLDL | 326.74 |
| Free Cholesterol in Very Large VLDL | 319.33 |
| Total Lipids in HDL | 313.29 |
| Concentration of LDL Particles | 312.20 |
| Cholesterol in Large VLDL | 279.70 |
| Cholesteryl Esters in IDL | 258.77 |
| Cholesterol in Small LDL | 253.52 |
| Apolipoprotein B | 234.57 |
| Cholesteryl Esters in Very Small VLDL | 230.70 |
| Total Triglycerides | 225.33 |
| Total Cholesterol Minus HDL-C | 217.90 |
| Valine | 206.11 |
| Cholesterol in Very Large HDL | 197.87 |
| Triglycerides in HDL | 191.35 |
| Phospholipids in Small LDL | 191.15 |
| Cholesterol in Medium HDL | 185.32 |
| Phospholipids in Large LDL | 178.33 |
| Phospholipids in HDL | 177.36 |
| Cholesteryl Esters in Small VLDL | 175.91 |
| LDL Cholesterol | 162.05 |
| Total Lipids in Medium HDL | 145.96 |
| Free Cholesterol in Medium LDL | 142.98 |
| Total Fatty Acids | 140.65 |
| Leucine | 135.88 |
| Triglycerides in Large VLDL | 132.48 |
| Cholesteryl Esters in Large LDL | 131.14 |
| Remnant Cholesterol (Non-HDL, Non-LDL -Cholesterol) | 125.15 |
| Cholesteryl Esters in Medium VLDL | 123.31 |
| Phospholipids in Large HDL | 118.13 |
| Omega-3 Fatty Acids | 113.37 |
| Cholesteryl Esters in Small LDL | 102.21 |
| Phospholipids in Very Large VLDL | 97.43 |
| Free Cholesterol in HDL | 96.54 |
| Triglycerides in VLDL | 95.51 |
| Free Cholesterol in IDL | 91.57 |
| Phospholipids in Very Large HDL | 91.28 |
| Free Cholesterol in Small LDL | 87.41 |
| Isoleucine | 85.64 |
| Phospholipids in Chylomicrons and Extremely Large VLDL | 72.54 |
| Phospholipids in Medium LDL | 67.41 |
| Triglycerides in Very Small VLDL | 66.01 |
| VLDL Cholesterol | 63.40 |
| Phospholipids in Very Small VLDL | 62.51 |
| Triglycerides in Small LDL | 61.15 |
| Triglycerides in Large LDL | 59.97 |
| Free Cholesterol in VLDL | 54.83 |
| Free Cholesterol in Very Small VLDL | 53.44 |
| Cholesteryl Esters in Medium LDL | 50.65 |
| Phospholipids in IDL | 48.84 |
| Cholesterol in Large LDL | 44.57 |
| Free Cholesterol in Small VLDL | 43.22 |
| Concentration of Very Small VLDL Particles | 38.34 |
| Concentration of Small VLDL Particles | 36.53 |
| Cholesteryl Esters in HDL | 33.26 |
| Concentration of Medium VLDL Particles | 33.22 |
| Phospholipids in Large VLDL | 32.50 |
| Concentration of Small HDL Particles | 29.93 |
| Cholesteryl Esters in Small HDL | 28.19 |
| Total Lipids in Small HDL | 25.46 |
| Cholesteryl Esters in LDL | 21.34 |
| Concentration of Large HDL Particles | 18.15 |
| Triglycerides in Medium LDL | 18.09 |
| Concentration of Medium HDL Particles | 17.63 |
| Concentration of Large VLDL Particles | 15.77 |
| Free Cholesterol in Medium VLDL | 7.93 |
| Concentration of Very Large VLDL Particles | 6.13 |
| Concentration of Chylomicrons and Extremely Large VLDL Particles | 5.75 |
| Total Lipids in Medium LDL | 3.27 |
| Phosphoglycerides | 2.76 |
| Triglycerides in Small VLDL | 2.13 |
| Apolipoprotein A1 | 0.91 |
| Concentration of Very Large HDL Particles | 0.49 |
| Sphingomyelins | 0.15 |
| Linoleic Acid | 0.10 |
| Glutamine | 0.087 |
| Glycoprotein Acetyls | 0.085 |
| Average Diameter for VLDL Particles | 0.082 |
| Acetoacetate | 0.047 |
| Average Diameter for HDL Particles | 0.039 |
| Acetone | 0.036 |
| Tyrosine | 0.033 |
| Glycine | 0.030 |
| Degree of Unsaturation | 0.022 |
| Docosahexaenoic Acid | 0.012 |
| Glucose | 0.009 |
| 3-Hydroxybutyrate | –0.004 |
| Albumin | –0.006 |
| Phenylalanine | –0.008 |
| Creatinine | –0.016 |
| Histidine | –0.029 |
| Pyruvate | –0.057 |
| Citrate | –0.073 |
| Alanine | –0.083 |
| Lactate | –0.10 |
| Average Diameter for LDL Particles | –0.15 |
| Acetate | –0.21 |
| Phosphatidylcholines | –0.81 |
| Clinical LDL Cholesterol | –0.90 |
| Total Cholines | –2.18 |
| Concentration of HDL Particles | –6.05 |
| Triglycerides in IDL | –6.10 |
| Triglycerides in Very Large HDL | –8.37 |
| Free Cholesterol in Small HDL | –10.78 |
| HDL Cholesterol | –13.62 |
| Phospholipids in Small VLDL | –19.05 |
| Triglycerides in Medium VLDL | –19.15 |
| Total Lipids in IDL | –25.11 |
| Cholesterol in Very Small VLDL | –30.03 |
| Free Cholesterol in Very Large HDL | –30.42 |
| Cholesterol in Medium VLDL | –32.45 |
| Phospholipids in Medium VLDL | –34.88 |
| Cholesteryl Esters in Large VLDL | –37.16 |
| Cholesterol in Small HDL | –38.44 |
| Cholesterol in Medium LDL | –39.45 |
| Concentration of IDL Particles | –42.85 |
| Triglycerides in Large HDL | –43.16 |
| Monounsaturated Fatty Acids | –48.49 |
| Phospholipids in Small HDL | –48.88 |
| Total Concentration of Lipoprotein Particles | –53.11 |
| Saturated Fatty Acids | –56.20 |
| Concentration of Small LDL Particles | –62.36 |
| Cholesteryl Esters in Chylomicrons and Extremely Large VLDL | –71.85 |
| Triglycerides in LDL | –78.07 |
| Free Cholesterol in Medium HDL | –78.70 |
| Cholesteryl Esters in Very Large HDL | –86.11 |
| Total Lipids in Lipoprotein Particles | –88.30 |
| Triglycerides in Small HDL | –89.86 |
| Phospholipids in LDL | –97.47 |
| Phospholipids in Medium HDL | –103.39 |
| Triglycerides in Medium HDL | –103.93 |
| Free Cholesterol in Large HDL | –110.51 |
| Free Cholesterol in Chylomicrons and Extremely Large VLDL | –114.90 |
| Free Cholesterol in Large VLDL | –115.30 |
| Cholesterol in Small VLDL | –119.66 |
| Concentration of Medium LDL Particles | –126.33 |
| Total Lipids in Small VLDL | –139.47 |
| Concentration of VLDL Particles | –148.00 |
| Total Lipids in LDL | –155.83 |
| Total Lipids in Medium VLDL | –175.12 |
| Total Lipids in Very Large HDL | –195.68 |
| Total Lipids in Large LDL | –197.23 |
| Cholesteryl Esters in Medium HDL | –198.31 |
| Cholesteryl Esters in Large HDL | –234.91 |
| Total Phospholipids in Lipoprotein Particles | –286.84 |
| Concentration of Large LDL Particles | –294.73 |
| Cholesterol in IDL | –300.70 |
| Total Free Cholesterol | –331.88 |
| Cholesteryl Esters in VLDL | –359.42 |
| Total Lipids in Very Small VLDL | –360.23 |
| Total Lipids in Large HDL | –375.09 |
| Total Concentration of Branched-Chain Amino Acids (Leucine + Isoleucine + Valine) | –411.21 |
| Total Lipids in Large VLDL | –432.35 |
| Free Cholesterol in LDL | –454.32 |
| Polyunsaturated Fatty Acids | –460.67 |
| Cholesterol in Very Large VLDL | –518.35 |
| Total Lipids in Small LDL | –561.42 |
| Total Lipids in Very Large VLDL | –716.90 |
| Total Lipids in Chylomicrons and Extremely Large VLDL | –799.17 |
| Total Esterified Cholesterol | –838.60 |
Appendix 2—table 2
Unadjusted levels of plasma metabolites lactate, pyruvate, and citrate in UK Biobank participants and among the top 10% of glaucoma polygenic risk score (PRS).
| Total population | Top 10% PRS | |||||||
|---|---|---|---|---|---|---|---|---|
| Characteristic | Overall | No Glaucoma | Glaucoma | p-value | Overall | No Glaucoma | Glaucoma | p-value |
| Sample size | 117,698 | 113,040 | 4,658 | 11,770 | 10,077 | 1,693 | ||
| Lactate, mmol/l (median [IQR]) | 3.94 [3.24, 4.75] | 3.95 [3.24, 4.76] | 3.82 [3.17, 4.60] | <0.001 | 3.94 [3.25, 4.75] | 3.96 [3.27, 4.78] | 3.79 [3.16, 4.58] | <0.001 |
| Pyruvate, mmol/l (median [IQR]) | 0.080 [0.063, 0.10] | 0.080 [0.06, 0.10] | 0.0780 [0.06, 0.10] | <0.001 | 0.080 [0.06, 0.10] | 0.080 [0.06, 0.10] | 0.077 [0.06, 0.09] | <0.001 |
| Citrate, mmol/l (median [IQR]) | 0.065 [0.057, 0.074] | 0.065 [0.06, 0.07] | 0.065 [0.06, 0.07] | 0.51 | 0.065 [0.06, 0.07] | 0.06 [0.06, 0.07] | 0.07 [0.06, 0.07] | 0.87 |
-
Abbreviations IQR, interquartile range.
Author response table 1
Performance of the mtGPRS Across Ancestral Groups in the UK Biobank.
| Ancestry | N, glaucoma cases | N, controls | N, total | OR [95% CI] |
|---|---|---|---|---|
| African | 184 | 2,448 | 2,632 | 1.25[0.97-1.60] |
| Asian | 199 | 4,475 | 4,674 | 1.63[1.34-1.98] |
| UK European | 7,973 | 162,190 | 170,163 | 2.84[2.73-2.92] |
| Other European | 220 | 5,837 | 6,057 | 1.67[1.43-1.96] |
-
Abbreviations: mtGPRS, multitrait analysis of GWAS polygenic risk score; OR, odds ratio; CI, confidence interval.
Additional files
Download links
A two-part list of links to download the article, or parts of the article, in various formats.
Downloads (link to download the article as PDF)
Open citations (links to open the citations from this article in various online reference manager services)
Cite this article (links to download the citations from this article in formats compatible with various reference manager tools)
Pyruvate and related energetic metabolites modulate resilience against high genetic risk for glaucoma
eLife 14:RP105576.
https://doi.org/10.7554/eLife.105576.3


