Genomic DNA transposition induced by human PGBD5
- Memorial Sloan Kettering Cancer Center, United States
- Weill Cornell Medical College, United States
- Harvard Medical School, United States
- University of Utah School of Medicine, United States
- Cornell University, United States
Figures
Figure 1
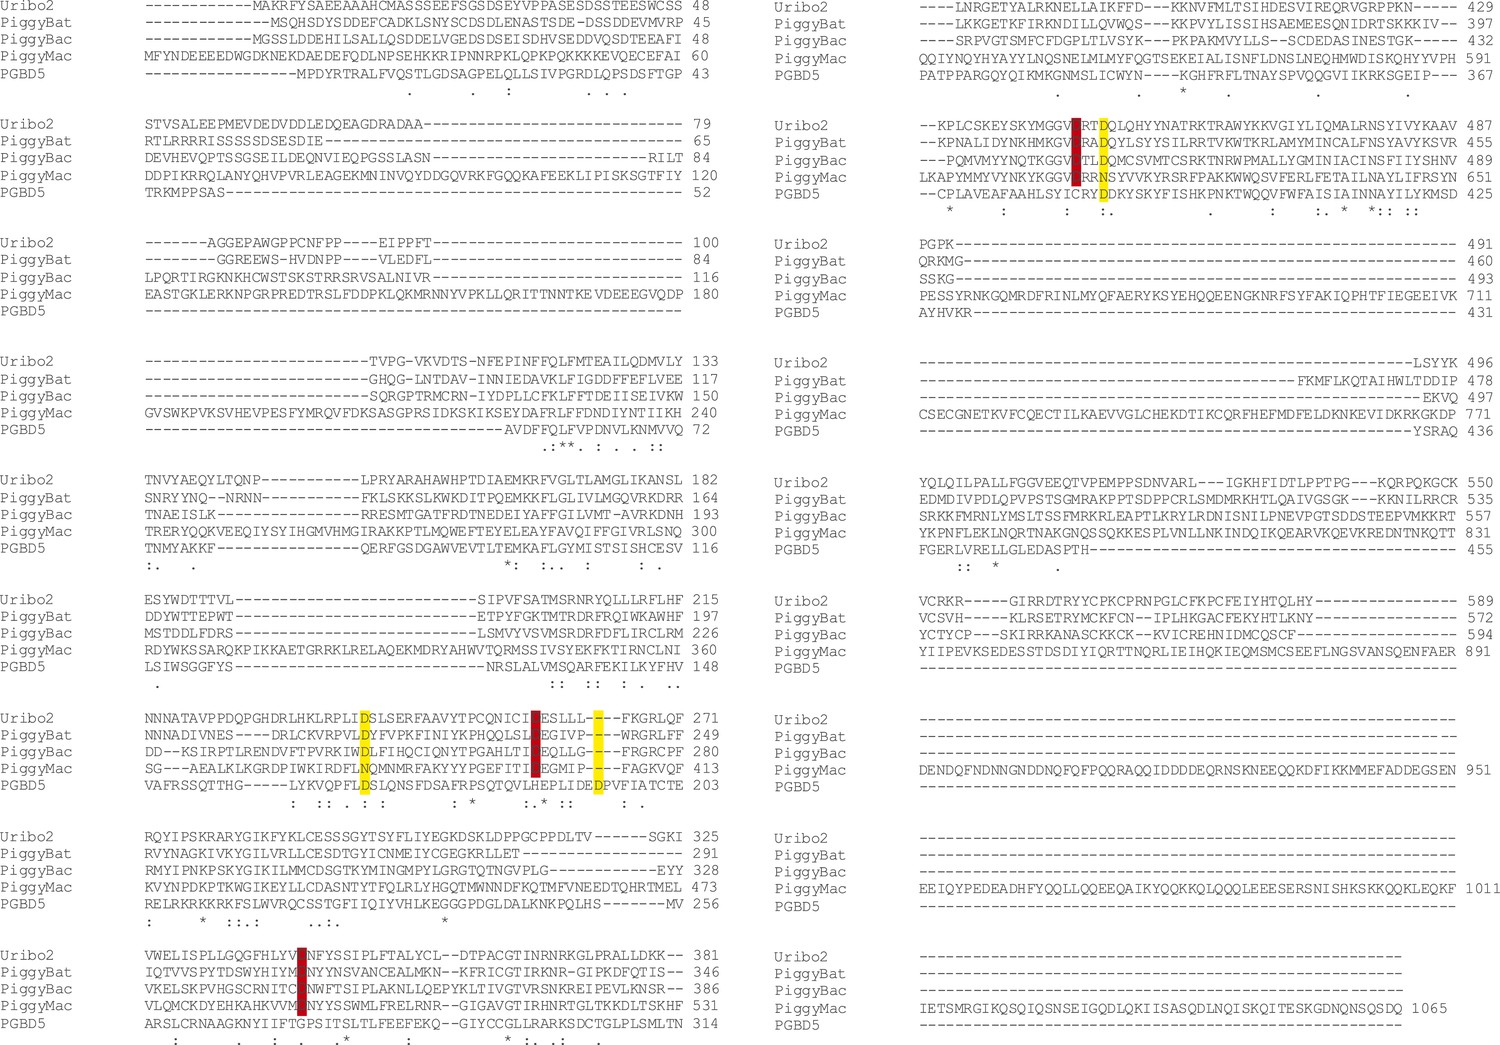
Human PGBD5 is a distinct piggyBac-like transposase.
Sequence alignment of piggyBac-like transposases frog Uribo 2, bat piggyBat, lepidopteran piggyBac, and human PGBD5. Catalytic residues conserved among piggyBac transposases are highlighted in red. Human PGBD5 D168, D194, and D386 residues, identified in our study (Figure 7), are marked in yellow.
Figure 2
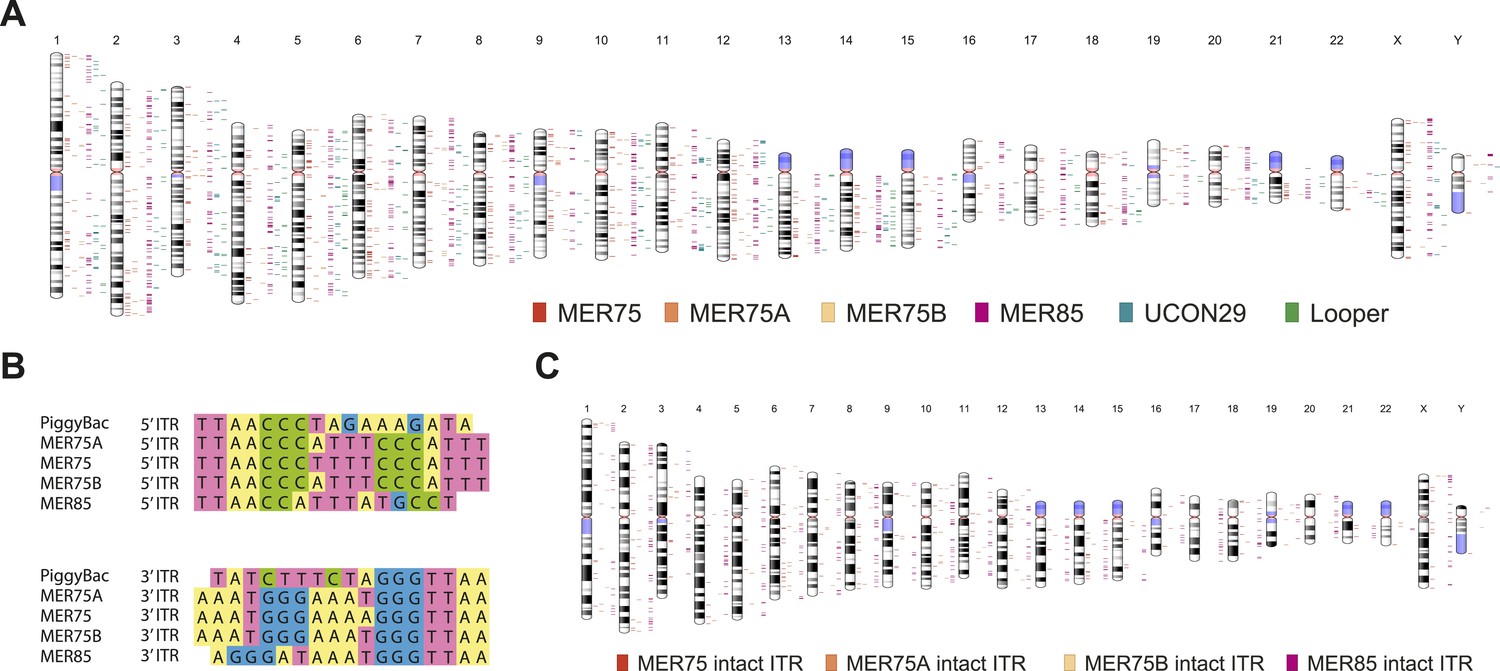
Human piggyBac-like transposable elements have intact inverted terminal repeat sequences similar to the T. ni piggyBac transposon.
(A) Chromosome ideogram representing the distribution of annotated piggyBac-like elements in the human genome (version hg19). (B) Multiple sequence alignment of the piggybac inverted terminal repeat (ITR) sequence with the consensus ITR sequences of the MER75 and MER85 families of piggyBac-like elements. (C) Chromosome ideogram representing the distribution of piggyBac-like elements annotated in the human genome (version hg19) with TTAA target site duplication as well as ITR sequences aligning with the consensus (intact ITRs).
Figure 3 with 5 supplements
PGBD5 induces genomic integration of synthetic piggyBac transposons in human cells.
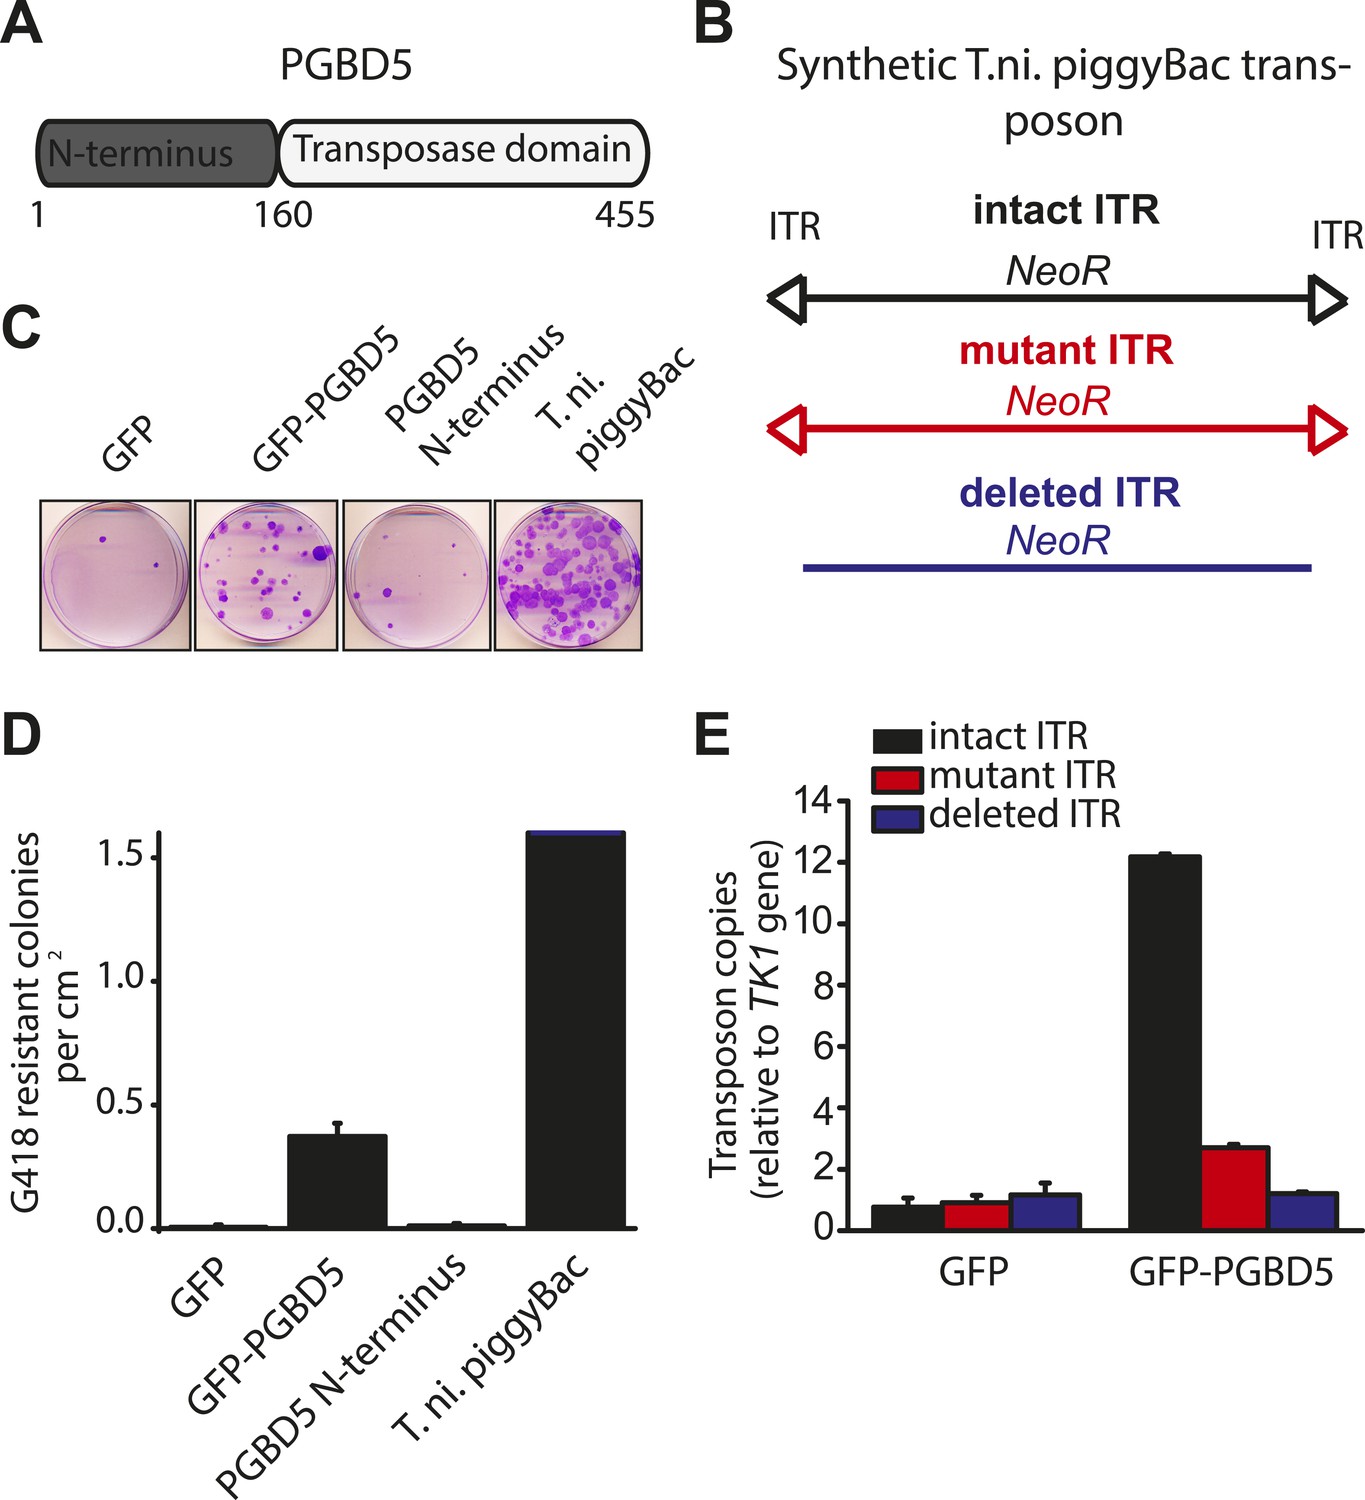
(A) Schematic of the human PGBD5 protein with its C-terminal transposase homology domain, as indicated. (B) Schematic of synthetic transposon substrates used for DNA transposition assays, including transposons with mutant ITR marked by triangles in red, and transposons lacking ITRs marked in blue. (C) Representative photographs of crystal violet-stained colonies obtained after G418 selection of HEK293 cells co-transfected with the transposon reporter plasmid along with transposase cDNA expression vectors. (D) Quantification of G418-selection clonogenic assays, demonstrating the integration activities of GFP-PGBD5, PGBD5 N-terminus, T. ni. piggyBac, and green fluorescent protein (GFP) control (GFP-PGBD5 vs GFP; p = 0.00031). (E) Quantification of genomic transposon integration using quantitative PCR of GFP-PGBD5 and GFP expressing cells using intact (black), mutant (red), and deleted (blue) ITR-containing transposon reporters (intact vs mutant ITR; p = 0.00011). Error bars represent standard errors of the mean of 3 biologic replicates.
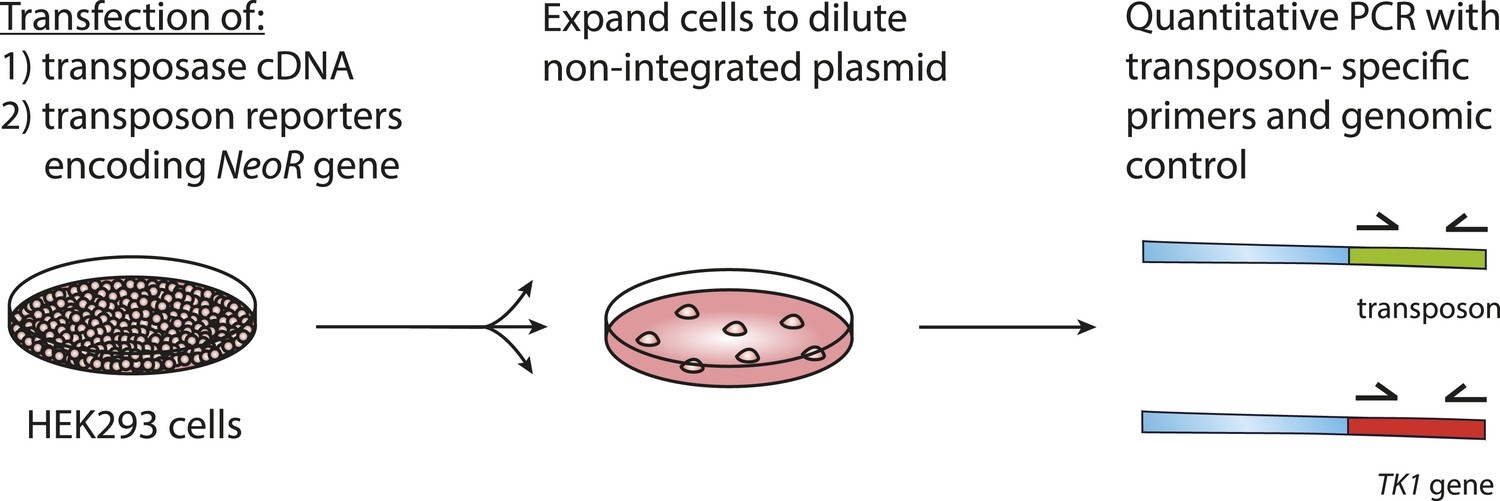
Figure 3—figure supplement 1

Assay for genomic integration of transposon reporters.
Schematic showing the procedure to assay for genomic integration of transposon reporters using G418 selection to clone genomically integrated neomycin resistant cells.
Figure 3—figure supplement 2

GFP-PGBD5, PGBD5 N-terminus, and T. ni. piggyBac are equally expressed upon transfection in HEK293 cells.
Quantitative RT-PCR specific to GFP-PGBD5, PGBD5 N-terminus, and T. ni. piggyBac shows equal mRNA expression of all three transposases (PGBD5 N-terminus p = 0.17, T. ni. piggyBac p = 0.092).
Figure 3—figure supplement 3
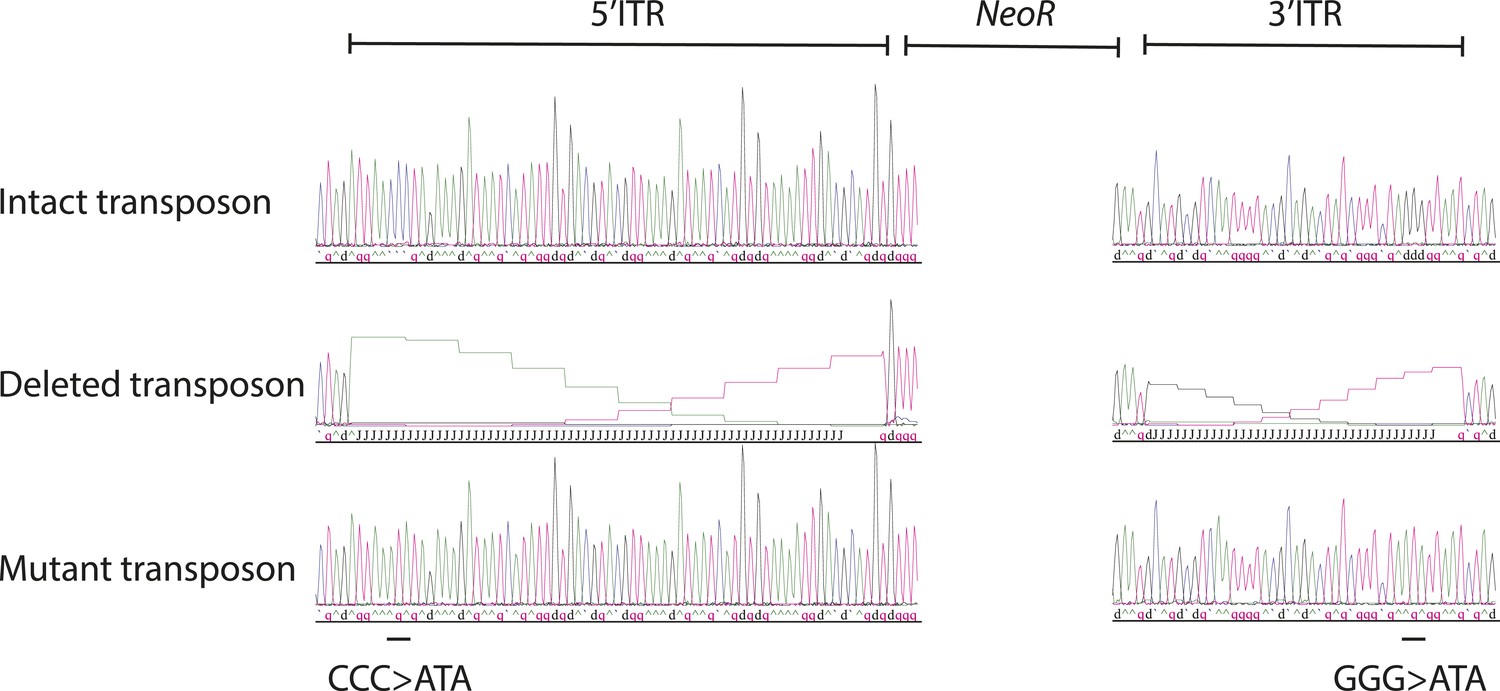
Sanger sequencing traces of the ITR of the synthetic transposon reporter plasmids.
Top to bottom: intact transposon, deleted transposon, and mutant transposon. Black line indicates location of GGG to ATA mutations in mutant transposon ITR.
Figure 3—figure supplement 4
Quantitative assay of genomic integration of transposon reporters.
Cells were transfected as described in ‘Materials and methods’. Next, cells were expanded and genomic DNA was isolated. Quantitative real-time PCR was performed with primers specific to the transposon sequence as well as to the TK1 reference gene.
Figure 3—figure supplement 5
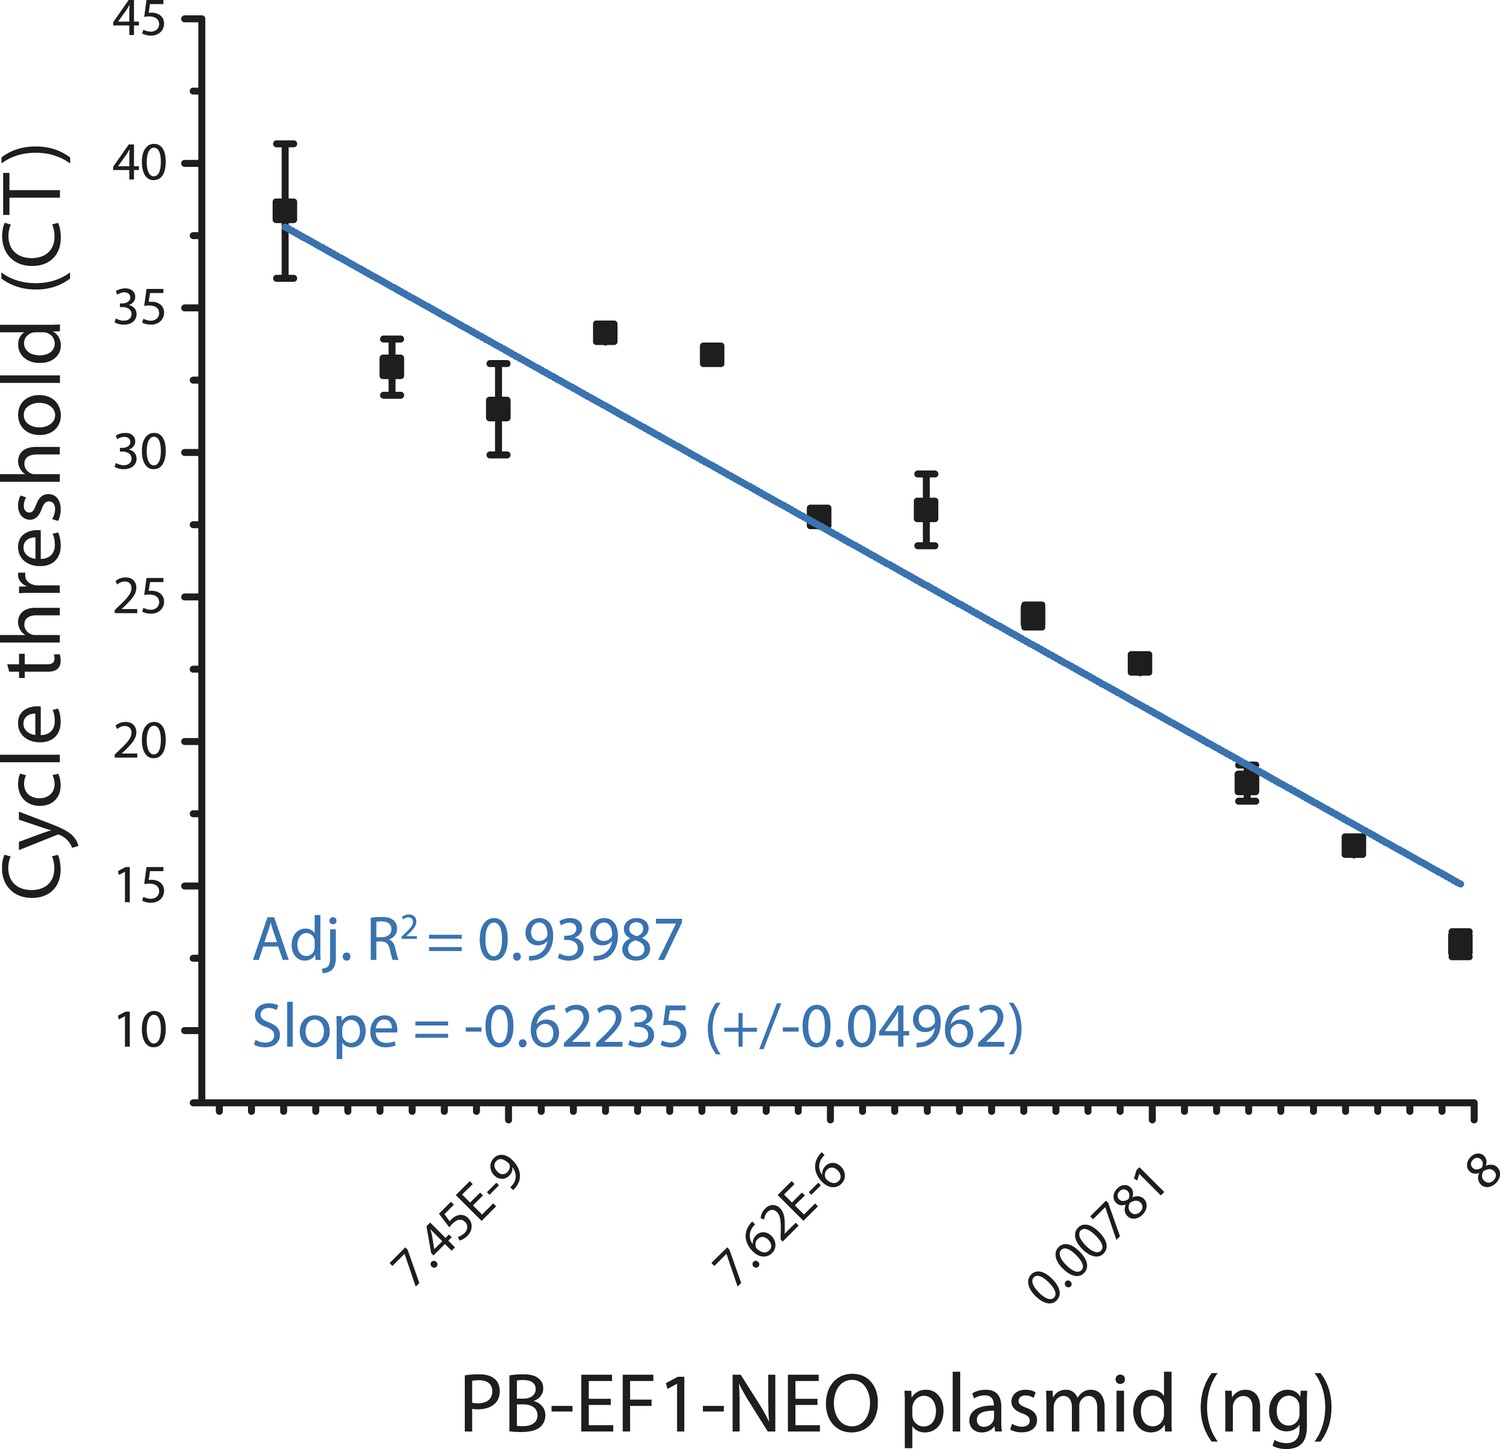
Quantitative genomic PCR standard curve for transposon specific primers.
https://doi.org/10.7554/eLife.10565.012
Figure 4 with 1 supplement
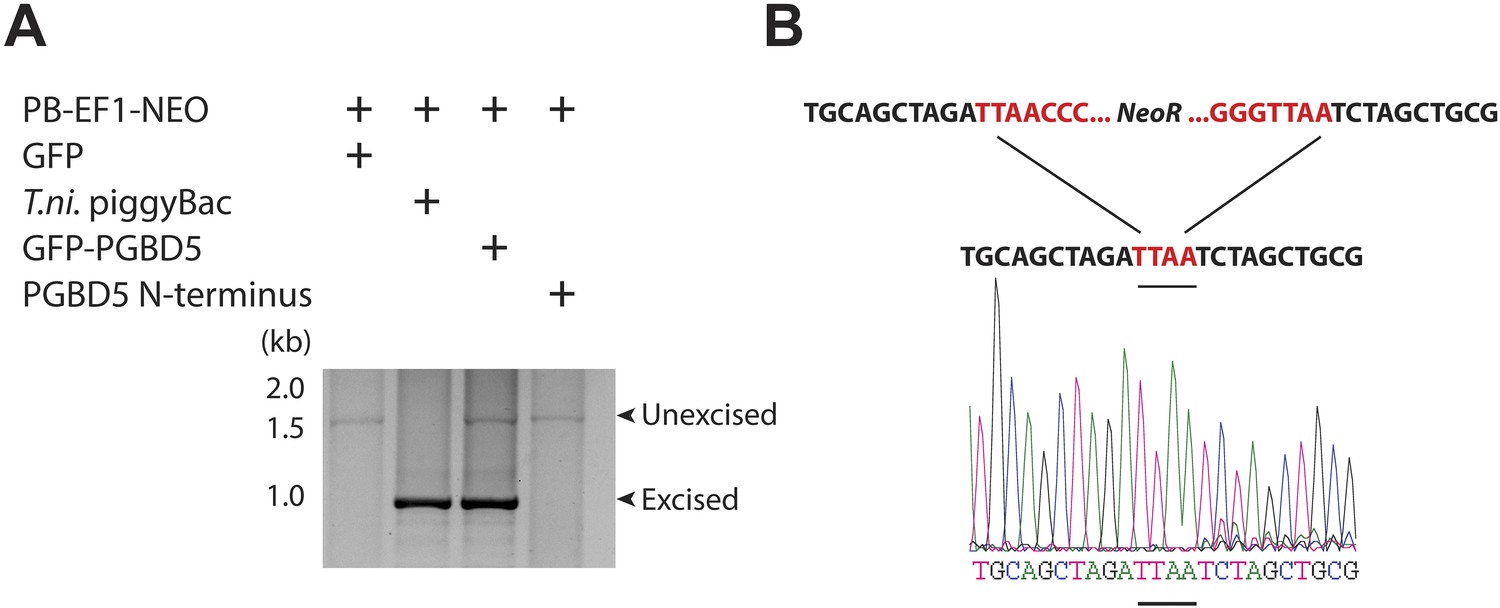
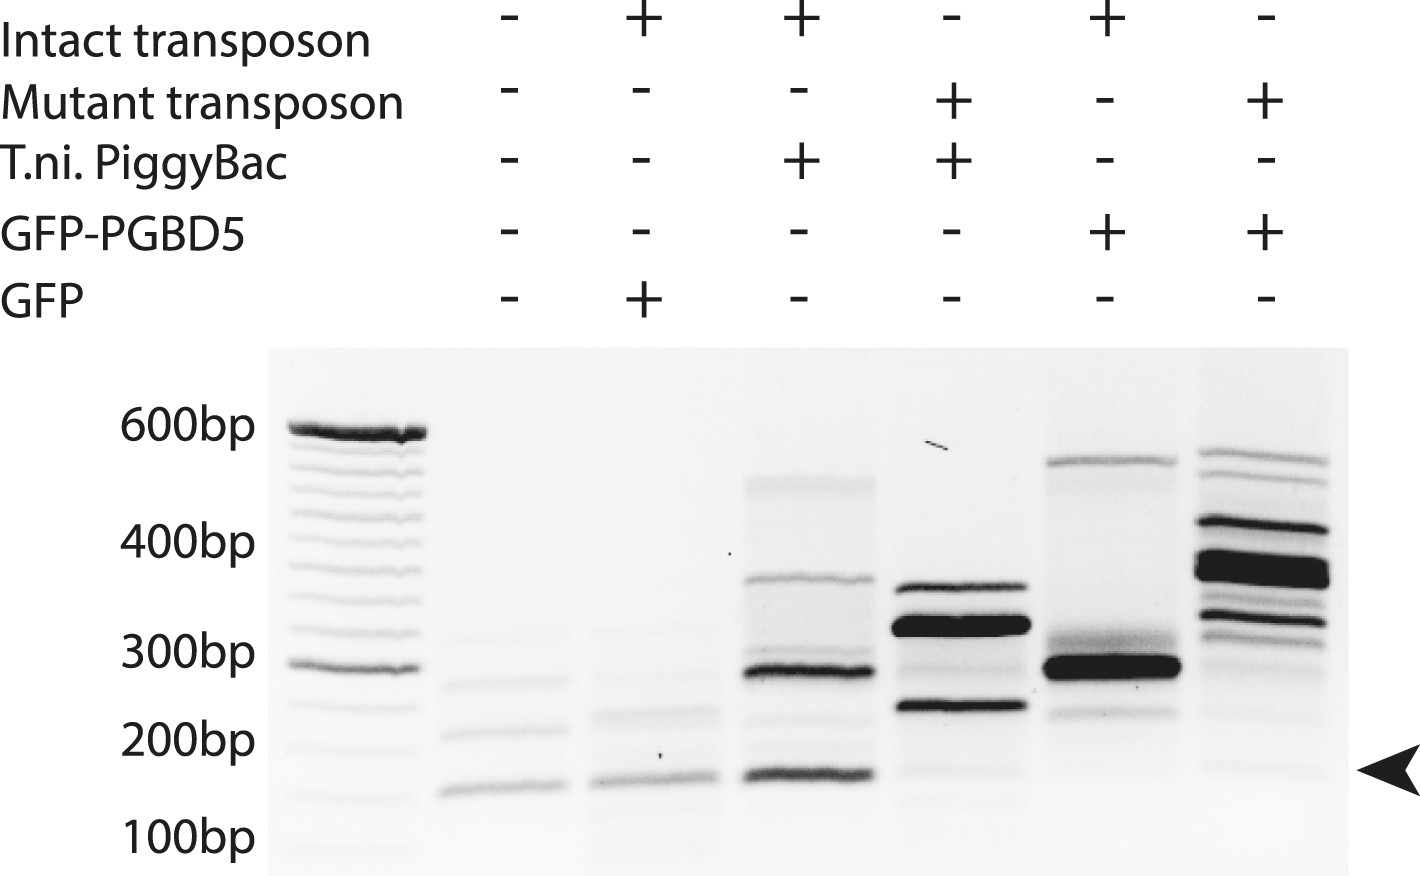
PGBD5 precisely excises piggyBac transposons.
(A) Representative agarose electrophoresis analysis of PCR-amplified PB-EF1-NEO transposon reporter plasmid from transposase-expressing cells, demonstrating efficient excision of the ITR-containing transposon by PGBD5, but not GFP or PGBD5 N-terminus mutant lacking the transposase domain. T. ni piggyBac serves as positive control. (B) Representative Sanger sequencing fluorogram of the excised transposon, demonstrating precise excision of the ITR and associated duplicated TTAA sequence, marked in red, demonstrating integrations of transposons (green) into human genome (blue) with TTAA insertion sites and genomic coordinates, as marked.
Figure 4—figure supplement 1
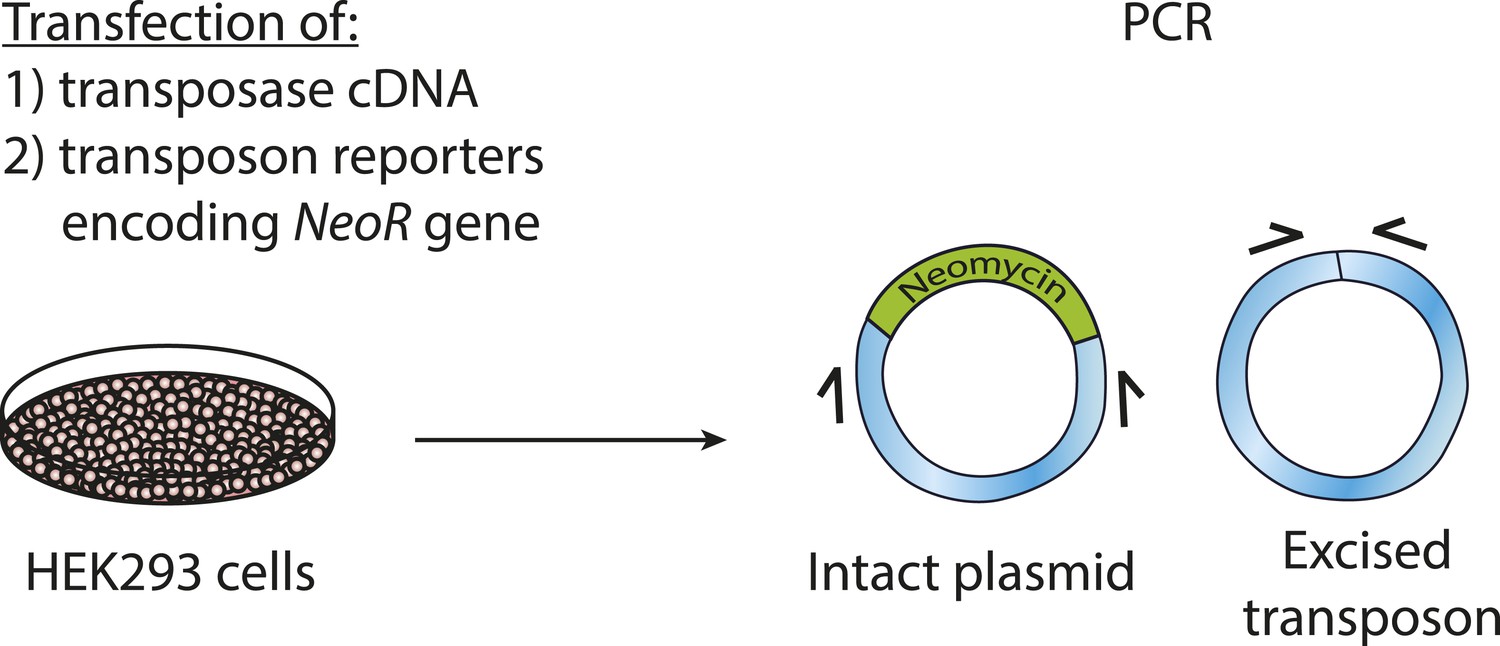
Schematic of transposon excision assay.
Cells were transfected as described in ‘Materials and methods’. Next, DNA was isolated. PCR was performed with primers specific to sequences flanking the transposon.
Figure 5

Schematic of transposon-specific flanking sequence exponential anchored–polymerase chain reaction amplification (FLEA-PCR) and massively parallel single molecule sequencing assay for mapping and sequencing transposon insertions.
https://doi.org/10.7554/eLife.10565.015
Figure 6 with 1 supplement
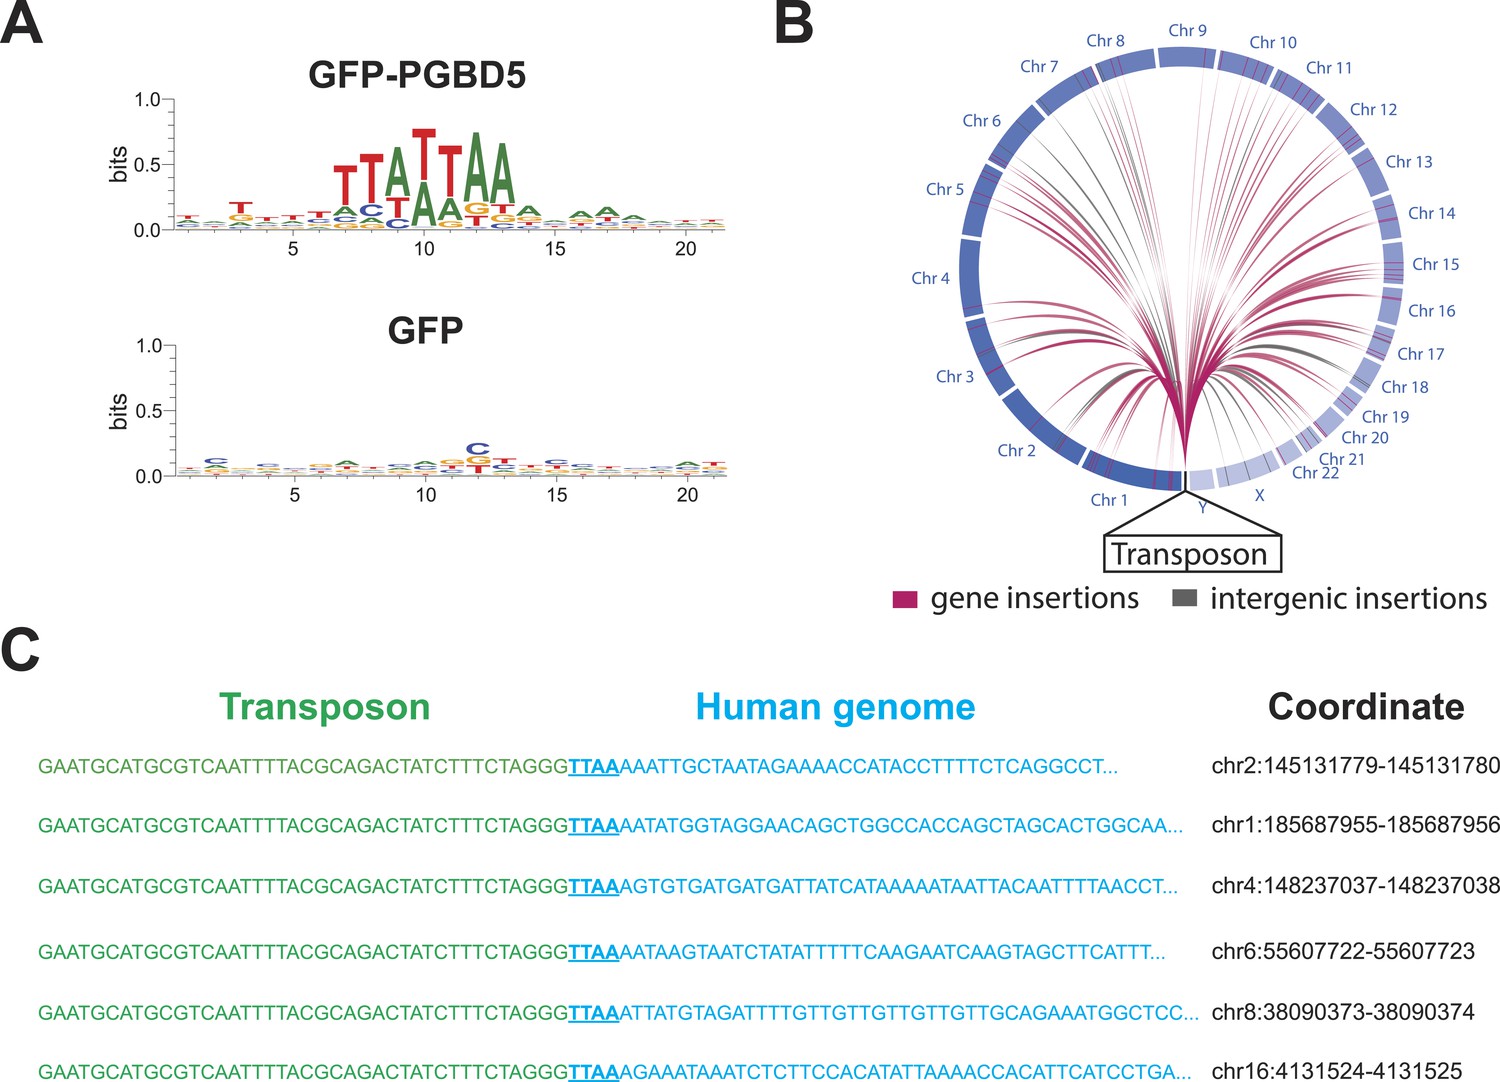
PGBD5 induces DNA transposition in human cells.
(A) Analysis of the transposon integration sequences, demonstrating TTAA preferences in integrations in cells expressing GFP-PGBD5, but not GFP control. X-axis denotes nucleotide sequence logo position, and y-axis denotes information content in bits. (B) Circos plot of the genomic locations PGBD5-mobilized transposons plotted as a function of chromosome number and transposition into genes (red) and intergenic regions (gray). (C) Alignment of representative DNA sequences of identified genomic integration sites.
Figure 6—figure supplement 1
Representative agarose gel image of amplicons from flanking sequence exponential anchored–polymerase chain reaction amplification (FLEA-PCR).
Arrow indicated expected size of degenerate anchor primer amplicons.
Figure 7 with 3 supplements
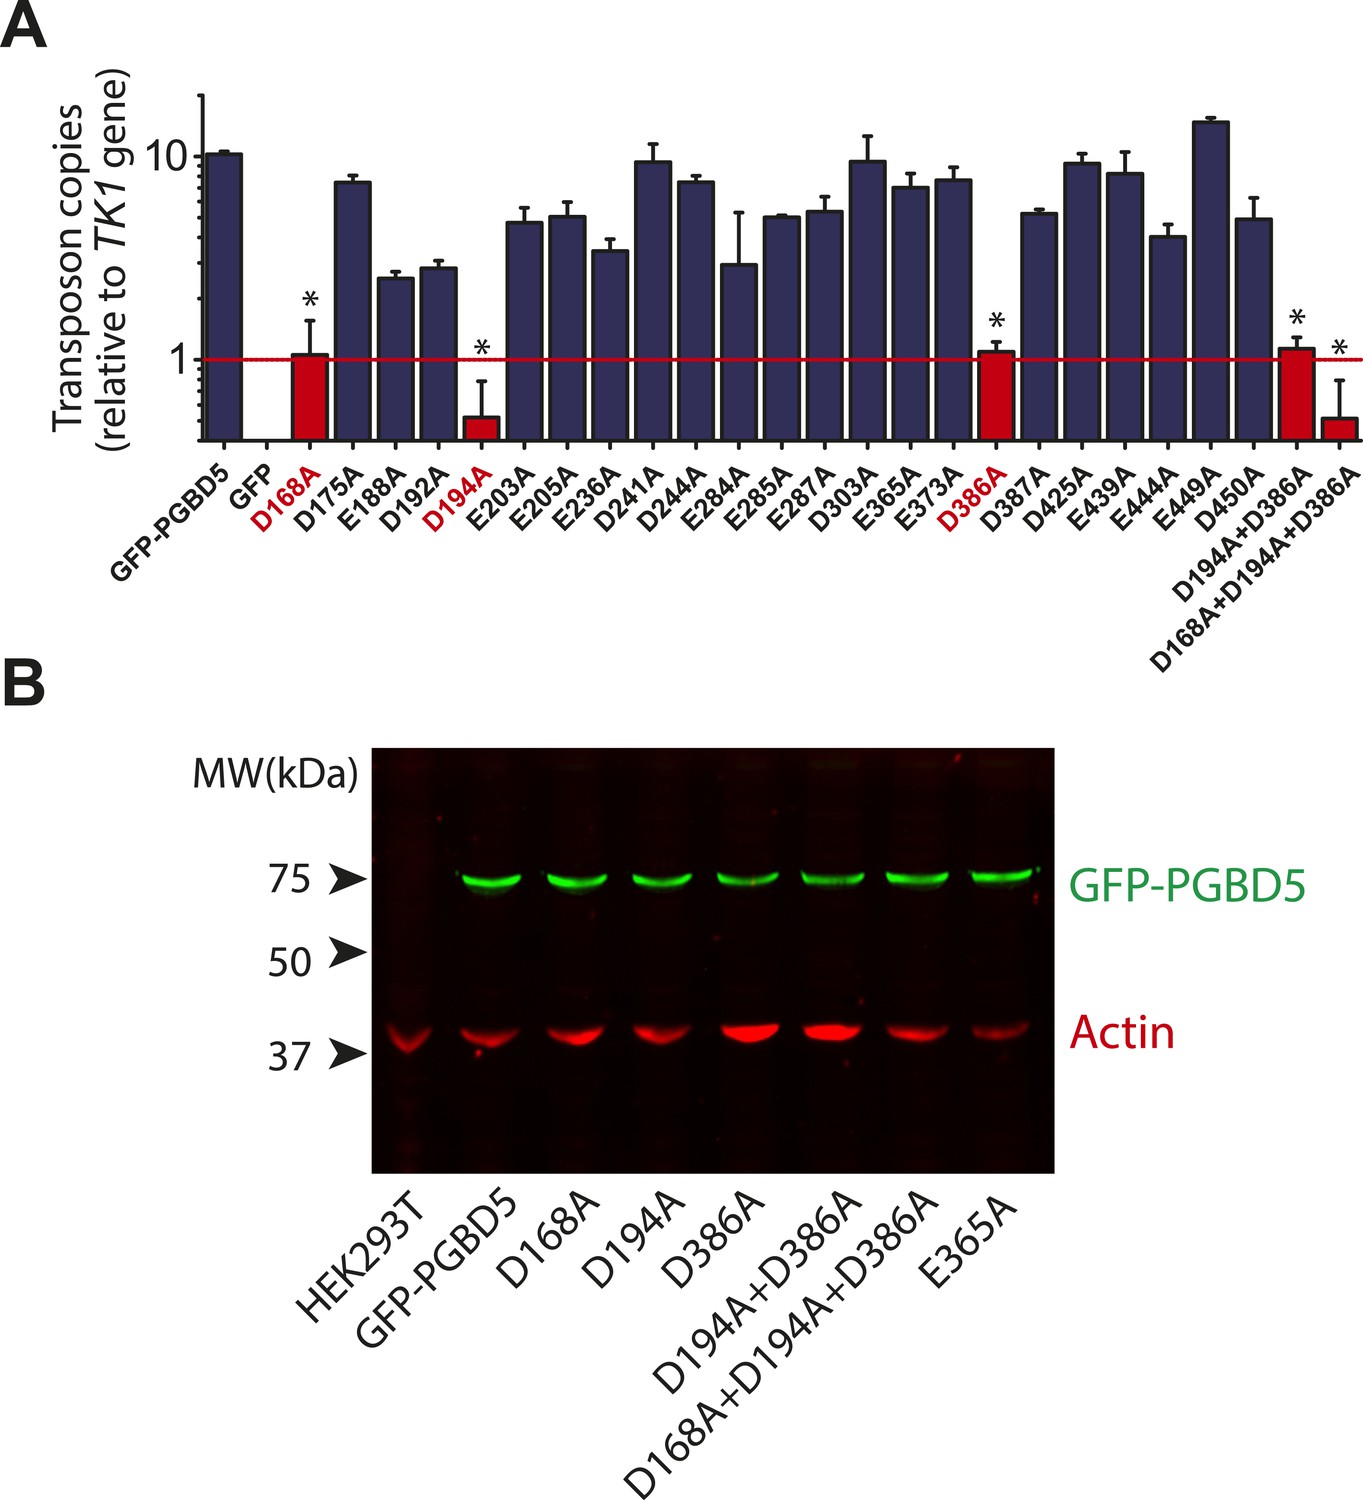
Structure-function analysis of PGBD5-induced DNA transposition using alanine scanning mutagenesis.
(A) Quantitative PCR analysis of genomic integration activity of alanine point mutants of GFP-PGBD5, as compared to wild-type and GFP control-expressing cells. D168A, D194A, and D386A mutants (red) exhibit significant reduction in apparent activity (Asterisks denote statistical significance: p = 0.00011, p = 0.000021, p = 0.000013 vs GFP-PGBD5, respectively). Dotted line marks threshold at which less than 1 transposon copy was detected per haploid human genome. Error bars represent standard errors of the mean of 3 biological replicates. (B) Western immunoblot showing equal expression of GFP-PGBD5 mutants, as compared to wild-type GFP-PGBD5 (green). β-actin (red) serves as loading control.
Figure 7—figure supplement 1
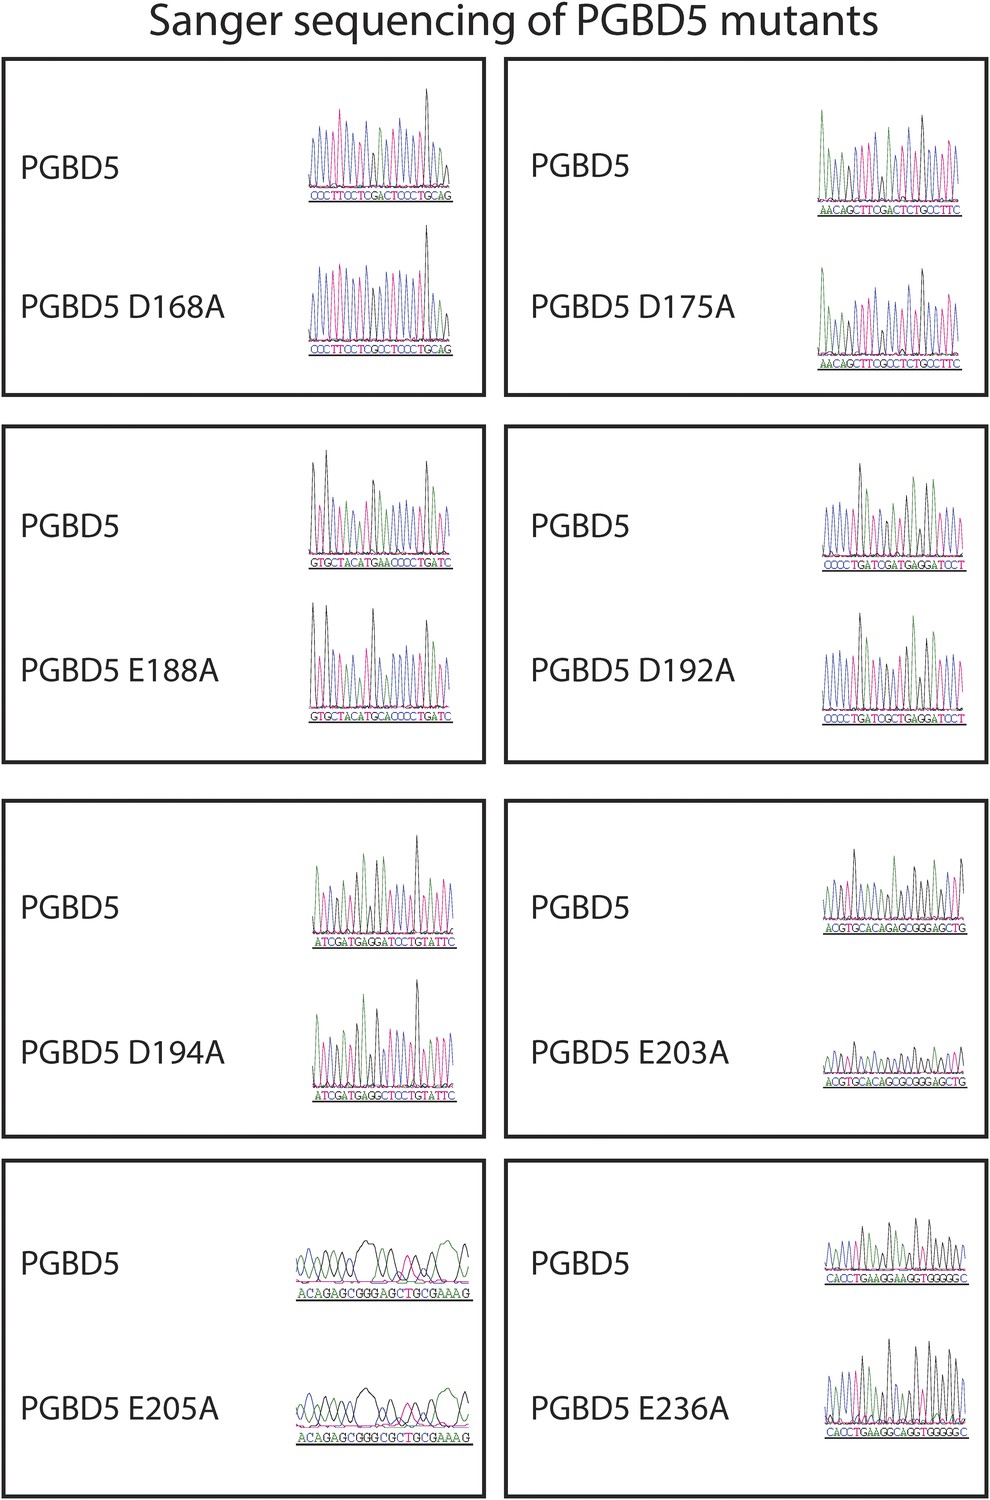
Sanger sequencing trances of pRecLV103-GFP-PGBD5 D>A and E>A mutants (D168A, D175A, E188A, D192A, D194A, E203A, E205A, E236A).
https://doi.org/10.7554/eLife.10565.020
Figure 7—figure supplement 2
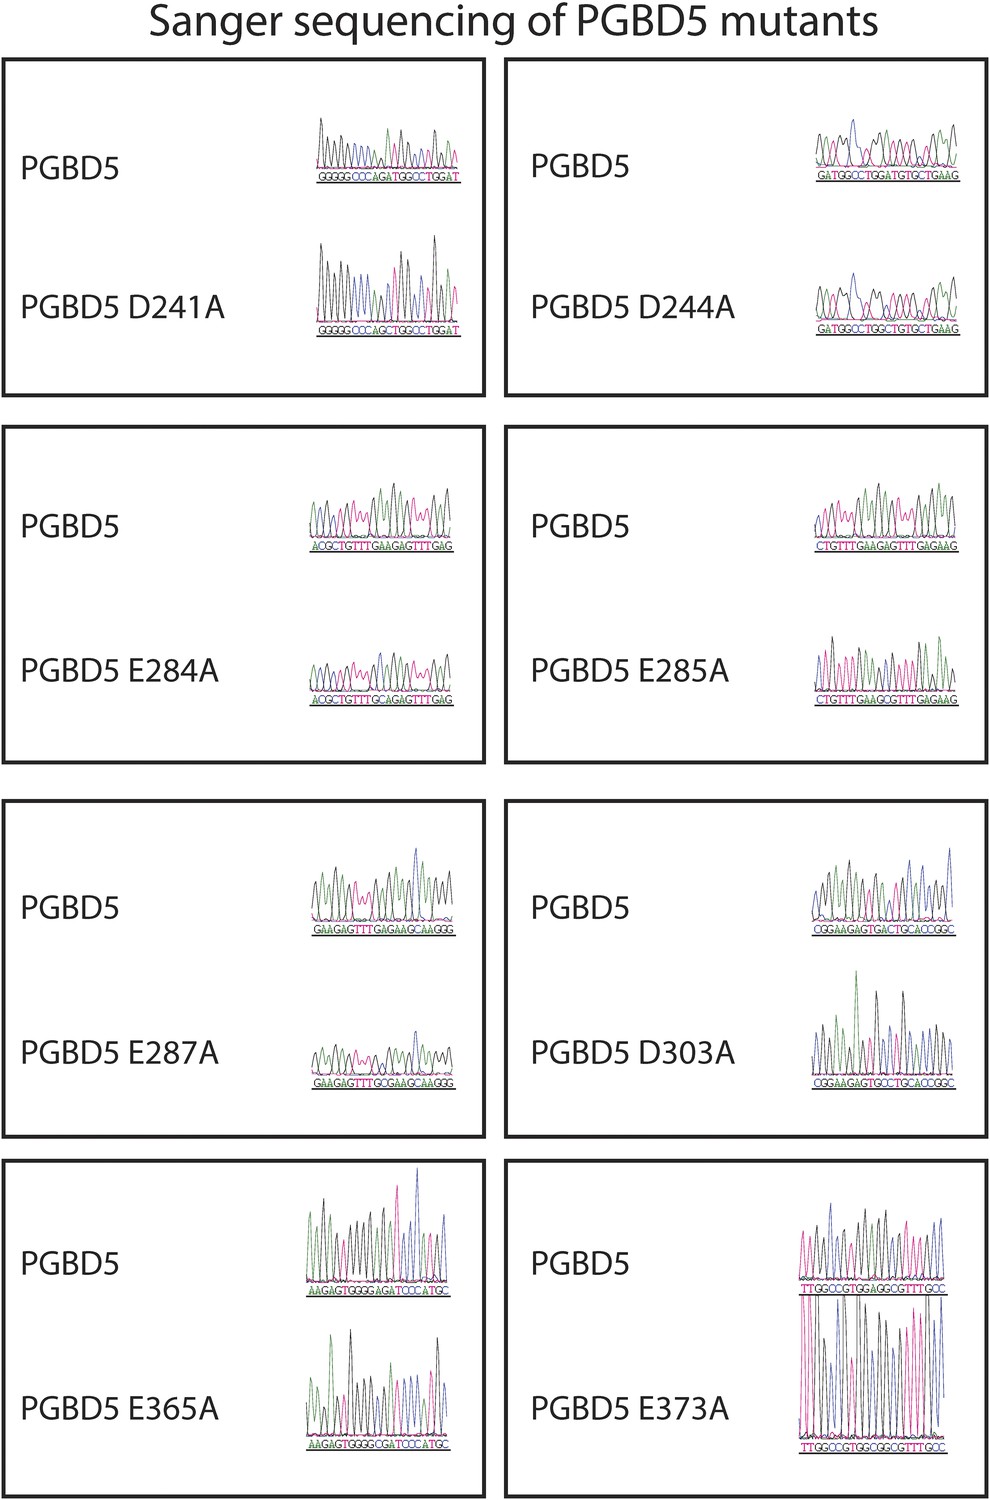
Sanger sequencing trances of pRecLV103-GFP-PGBD5 D>A and E>A mutants (D241A, D244A, E284A, E285A, E287A, D303A, E365A, E373A).
https://doi.org/10.7554/eLife.10565.021
Figure 7—figure supplement 3

Sanger sequencing trances of pRecLV103-GFP-PGBD5 D>A and E>A mutants (D386A, D387A, D425A, E439A, E444A, E449A, D450A).
https://doi.org/10.7554/eLife.10565.022
Figure 8 with 1 supplement

PGBD5 homologs are divergent from other piggyBac genes in vertebrates.
Phylogenetic reconstruction of the evolutionary relationships among piggyBac transposase-derived genes in vertebrates, demonstrating the PGBD5 homologs represent a distinct subfamily of piggyBac-like derived genes. Scale bar represents Grishin distance.
Figure 8—figure supplement 1
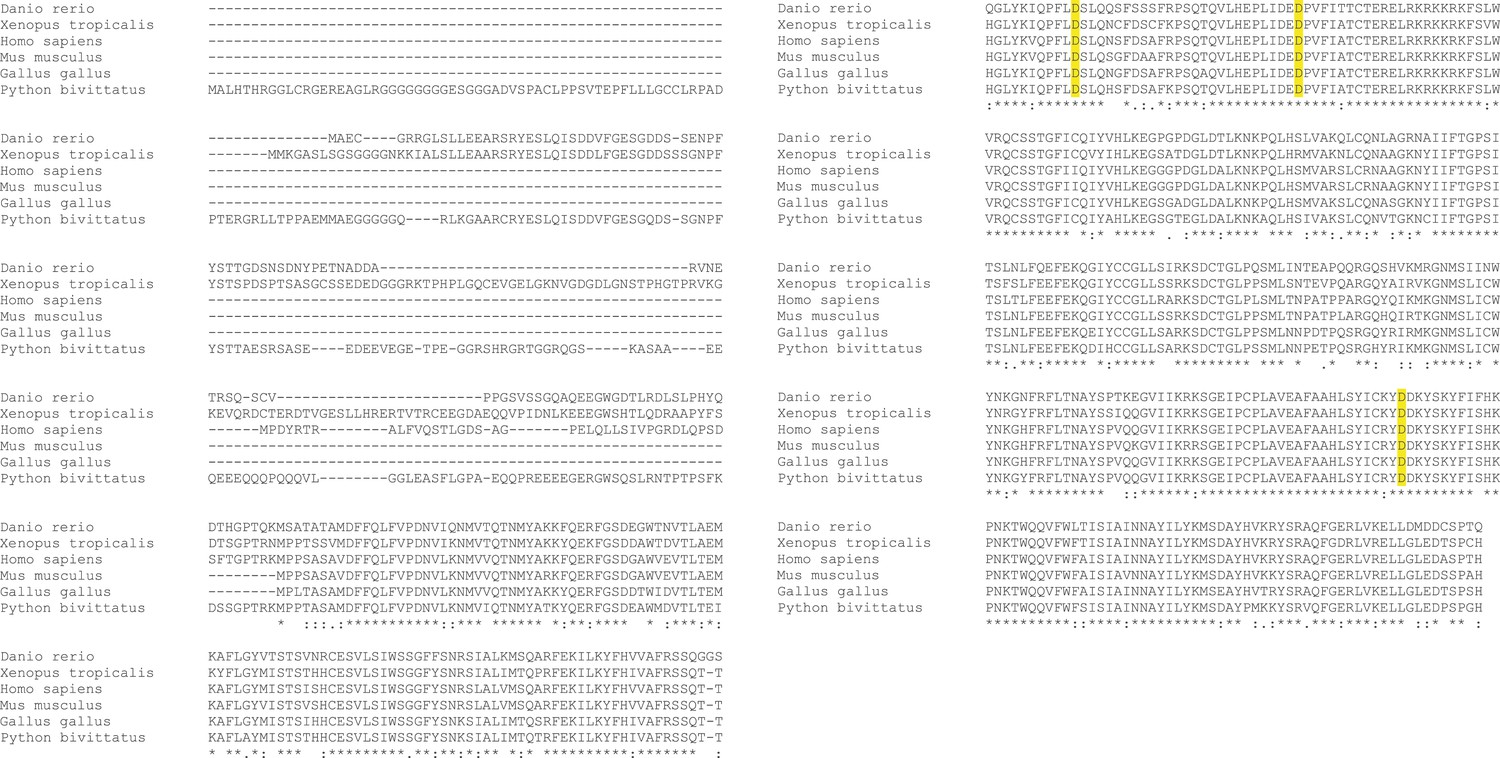
PGBD5 glutamic acid resitues D168, D194, and D386 are conserved across species.
Clustal O alignment of PGBD5 proteins across species (Danio rerio, Xenopus tropicalis, Homo sapiens, Mus musculus, Gallus gallus, Python bivittatus). D168, D194, and D386 residues are highlighted in yellow.
Tables
Table 1
Summary of annotated human piggyBac-like elements
| Total piggyBac-like elements | Intact elements* | ||
|---|---|---|---|
| MER75 | 475 | 144 | |
| MER75A | 93 | 62 | |
| MER75B | 114 | 27 | |
| MER85 | 905 | 95 | |
| UCON29 | 240 | 0 | |
| Looper | 531 | 0 |
-
*
Denotes elements with intact ITR sequences that align with the consensus without gaps and contain a TTAA target site duplication.
-
ITR, inverted terminal repeat.
Table 2
Sequence identity matrix of the piggyBac inverted terminal repeat sequences and consensus sequences of the MER75 and MER85 human piggyBac-like elements
| piggyBac | MER75 | MER85 | |
|---|---|---|---|
| piggyBac | 100% | – | – |
| MER75 | 53% | 100% | – |
| MER85 | 56% | 63% | 100% |
Table 3
Analysis of transposon integration sequences in human genomes induced by PGBD5
| Intact transposon | Mutant transposon | |||
|---|---|---|---|---|
| TTAA ITR | Non-ITR | TTAA ITR | Non-ITR | |
| Transposase | ||||
| GFP-PGBD5 | 82% (65)† | 18% (14) | 11% (4)‡ | 89% (33) |
| GFP Control | 17% (2) | 83% (10) | 40% (27) | 60% (40) |
-
Cells expressing GFP-PGBD5 and intact transposons exhibit significantly higher frequency of genomic integration as compared to either GFP control, or GFP-PGBD5 with mutant transposons, with 82% (65 out of 79) of sequences demonstrating DNA transposition of ITR transposons into TTAA sites (†p = 1.8 × 10⁻⁵). Mutation of the transposon ITR significantly reduces ITR-mediated integration, with only 11% (4 out of 37) of sequences (‡p = 0.0016). Numbers in parentheses denote absolute numbers of identified insertion sites.
-
GFP, green fluorescent protein; ITR, inverted terminal repeat.
Additional files
-
Supplementary file 1
Sequences of PCR primers.
- https://doi.org/10.7554/eLife.10565.025
Download links
A two-part list of links to download the article, or parts of the article, in various formats.
Downloads (link to download the article as PDF)
Open citations (links to open the citations from this article in various online reference manager services)
Cite this article (links to download the citations from this article in formats compatible with various reference manager tools)
Genomic DNA transposition induced by human PGBD5
eLife 4:e10565.
https://doi.org/10.7554/eLife.10565


