Differential roles of NaV1.2 and NaV1.6 in neocortical pyramidal cell excitability
- Weill Institute for Neurosciences, University of California, San Francisco, United States
- Department of Neurology, University of California, San Francisco, United States
- Department of Neuroscience, Genentech, Inc., United States
- Department of Neurology, MIND Institute, University of California Davis School of Medicine, United States
- Department of Pharmacology, Northwestern University Feinberg School of Medicine, United States
Figures
Figure 1 with 1 supplement
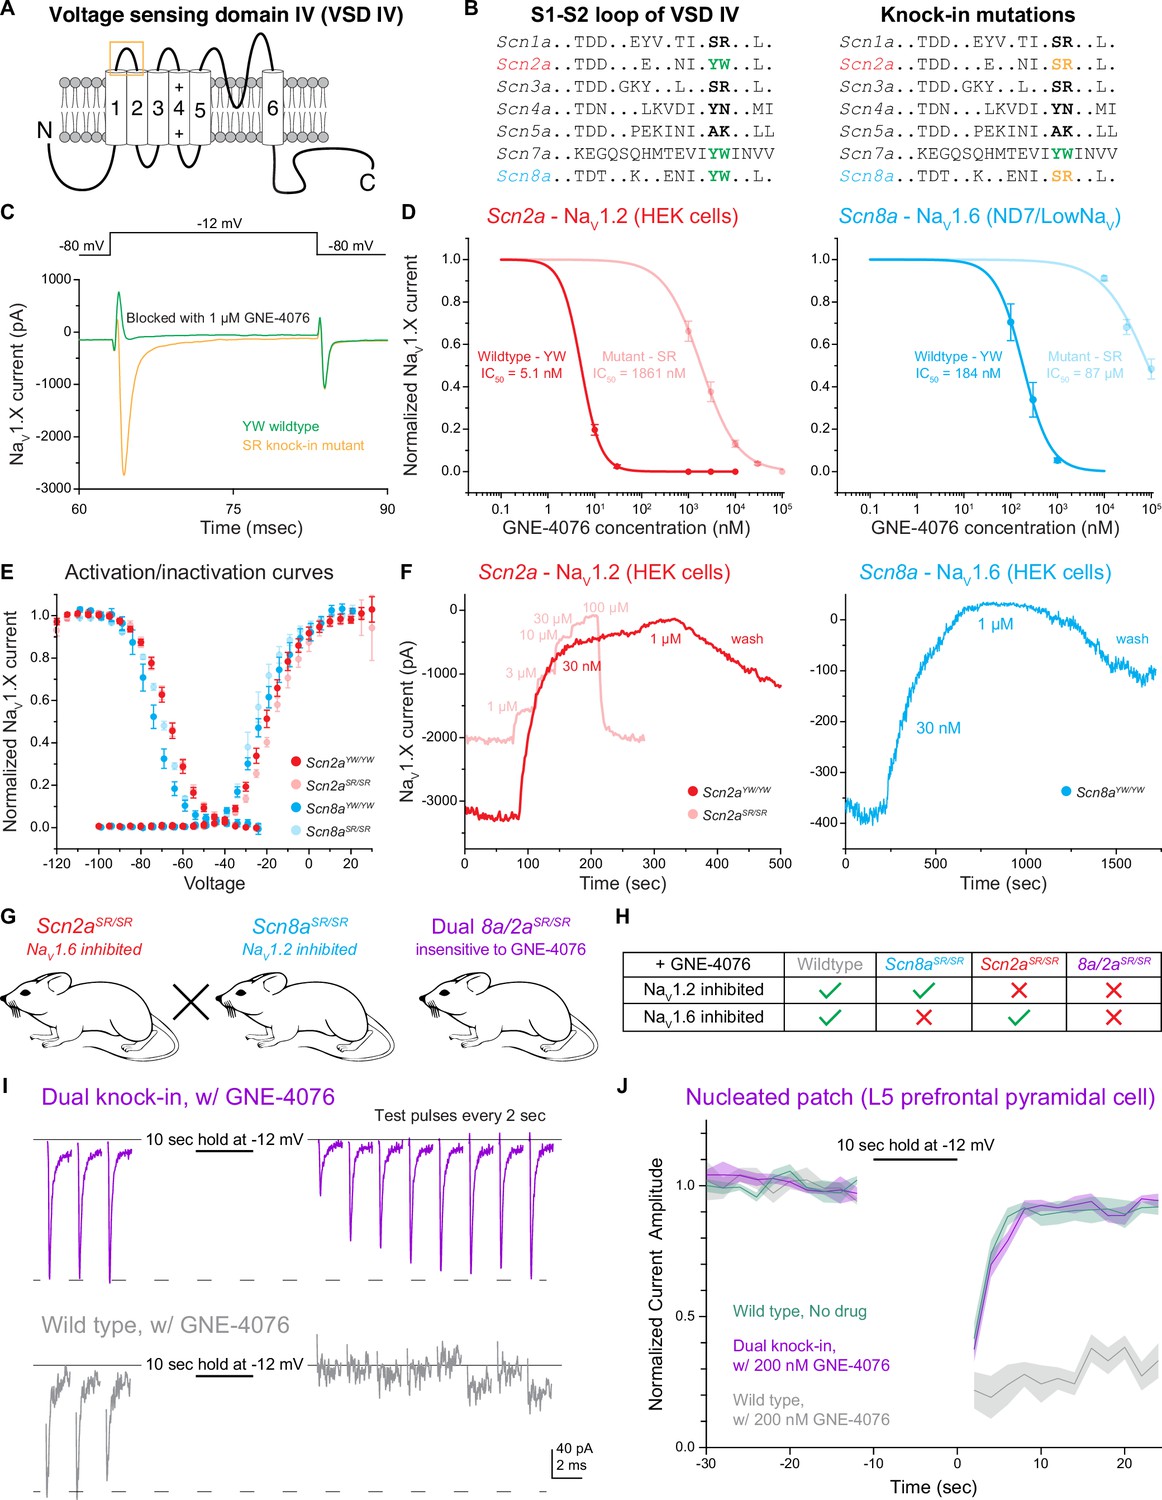
The YW motif on NaV1.2 and NaV1.6 increases activity-dependent GNE-4076 potency and subsequent channel inhibition.
(A) Schematic depicting the fourth voltage sensing domain (VSD-IV) of NaV isoforms. The six transmembrane spanning regions have high sequence homology among different NaV isoforms, while linker regions display more sequence divergence. Orange box highlights extracellular S1–S2 loop where aryl sulfonamide compounds (ASCs) are stabilized by a tyrosine–tryptophan (YW) motif. (B) Amino acid sequence within the S1–S2 loop of various NaV isoforms. Scn2a (NaV1.2) and Scn8a (NaV1.6) are the predominant channels expressed in mature, prefrontal pyramidal cells. Both isoforms share a conserved YW sequence that increases ASC potency. Knock-in mutations of Scn2a and Scn8a were generated by substituting the YW motif with a serine–arginine (SR) sequence present in Scn1a and Scn3a. (C) Example NaV current traces (pA) of cells expressing either YW wildtype channels or SR knock-in mutant chimeras in the presence of 1 μM GNE-4076. To activate exogenously expressed NaV channels, cells were held at –80 mV and stepped to –12 mV for 20 ms. GNE-4076 onboarding was performed by holding cells at –12 mV for 10 s. (D) Dose–response curves for exogenously expressed Scn2a (HEK cells) or Scn8a (ND7/LoNaV) in immortalized cell lines. IC50 was measured for both YW wildtype channels and SR knock-in mutant chimeras (Scn2aYW/YW, n = 6; Scn2aSR/SR, n = 7; Scn8aYW/YW, n = 8; Scn8aSR/SR, n = 6). YW→SR knock-in mutations reduced GNE-4076 potency by about 400- to 500-fold relative to wildtype channels. Circles represent normalized mean NaV current amplitude ± SEM. (E) Activation and steady-state inactivation curves for both YW wildtype channels and SR knock-in mutant chimeras. Scn2a or Scn8a YW→SR mutations alter the efficacy of GNE-4076 while having minor effects on biophysical properties of either isoform. Circles represent mean normalized NaV current amplitude ± SEM. Unpaired t-test with Welch’s correction. No significance detected between wildtype and mutant channels for both V1/2 of activation or inactivation. (F) Example current amplitude response graphs for NaV1.2 (red) and NaV1.6 (blue) expressed in HEK cells. Cells were perfused with increasing concentrations of GNE-4076 throughout the recording. Individual current response recordings from HEK cells expressing Scn2a were robust (3.2 nA), and recordings were reproducible for both YW wildtype channels (red) and SR knock-in mutant chimeras (transparent red). Current responses from cells expressing Scn8a were variable, with only a few cells exhibiting channel conductance (400 pA). In select cells expressing Scn8a, current amplitude (blue) also decreases substantially with 30 nM GNE-4076 and completely with 1 μM. (G) Transgenic mouse lines generated with the YW→SR knock-in mutation present on both ScnXa alleles. Scn2aSR/SR mice were crossed with Scn8aSR/SR mice to generate a dual Scn8a/2aSR/SR knock-in mouse. (H) Overview of the various transgenic (or wildtype) mouse lines used throughout this study. Application of 200 nM GNE-4076 selectively inhibits NaV isoforms only containing the YW motif. (I) Nucleated patch experiments from prefrontal pyramidal cells performed in wildtype or dual Scn8a/2aSR/SR knock-in cells in the presence of 200 nM GNE-4076. Baseline conductance was measured by depolarizing cells from –80 to –12 mV every 2 s for 10 pulses. NaV channels were inactivated by holding the nucleated patch at –12 mV for 10 s. Test pulses were again acquired during recovery similar to baseline pulses. (J) Summary graph of normalized current amplitude from nucleated patch experiments in (I). Baseline and recovery test pulses were acquired for at least 20 s before and 25 s after the channel inactivation step. Solid line represents normalized mean NaV current amplitude ± SEM. Graph also includes wildtype, no drug control nucleated patch experiments (wildtype no drug, n = 4; wildtype + GNE-4076, n = 4; Scn8a/2aSR/SR + GNE-4076, n = 4).
-
Figure 1—source data 1
Data values for each experiment described in Figure 1.
- https://cdn.elifesciences.org/articles/105696/elife-105696-fig1-data1-v2.xlsx
Figure 1—figure supplement 1

Dual knock-in mutants (Scn8a/2aSR/SR) hyperpolarize action potential (AP) threshold without impairing peak dV/dt.
(A) Summary data for threshold (mV) with or without bath application of GNE-4076. Data was collected from age-matched groups (without GNE-4076) or analyzed from baseline data presented in Figure 3. Box plots show median and 90% tails. Circles represent individual cells (wildtype no drug at p25, n = 6; Scn8a/2aSR/SR no drug at p25, n = 8; wildtype no drug from Figure 3, n = 12; Scn8a/2aSR/SR + GNE-4076 from Figure 3, n = 11; wildtype + GNE-4076 from Figure 3, n = 11). One-way ANOVA, Holm–Šídák multiple comparisons test. *p < 0.05, **p < 0.01. (B) Summary data for peak dV/dt (V/s) with or without bath application of GNE-4076. Data was collected from age-matched groups (without GNE-4076) or analyzed from baseline data presented in Figure 3. Box plots show median and 90% tails. Circles represent individual cells. One-way ANOVA, Holm–Šídák multiple comparisons test. n.s.:not significant.
-
Figure 1—figure supplement 1—source data 1
Data values for each experiment described in Figure 1-figure supplement 1.
- https://cdn.elifesciences.org/articles/105696/elife-105696-fig1-figsupp1-data1-v2.xlsx
Figure 2 with 1 supplement
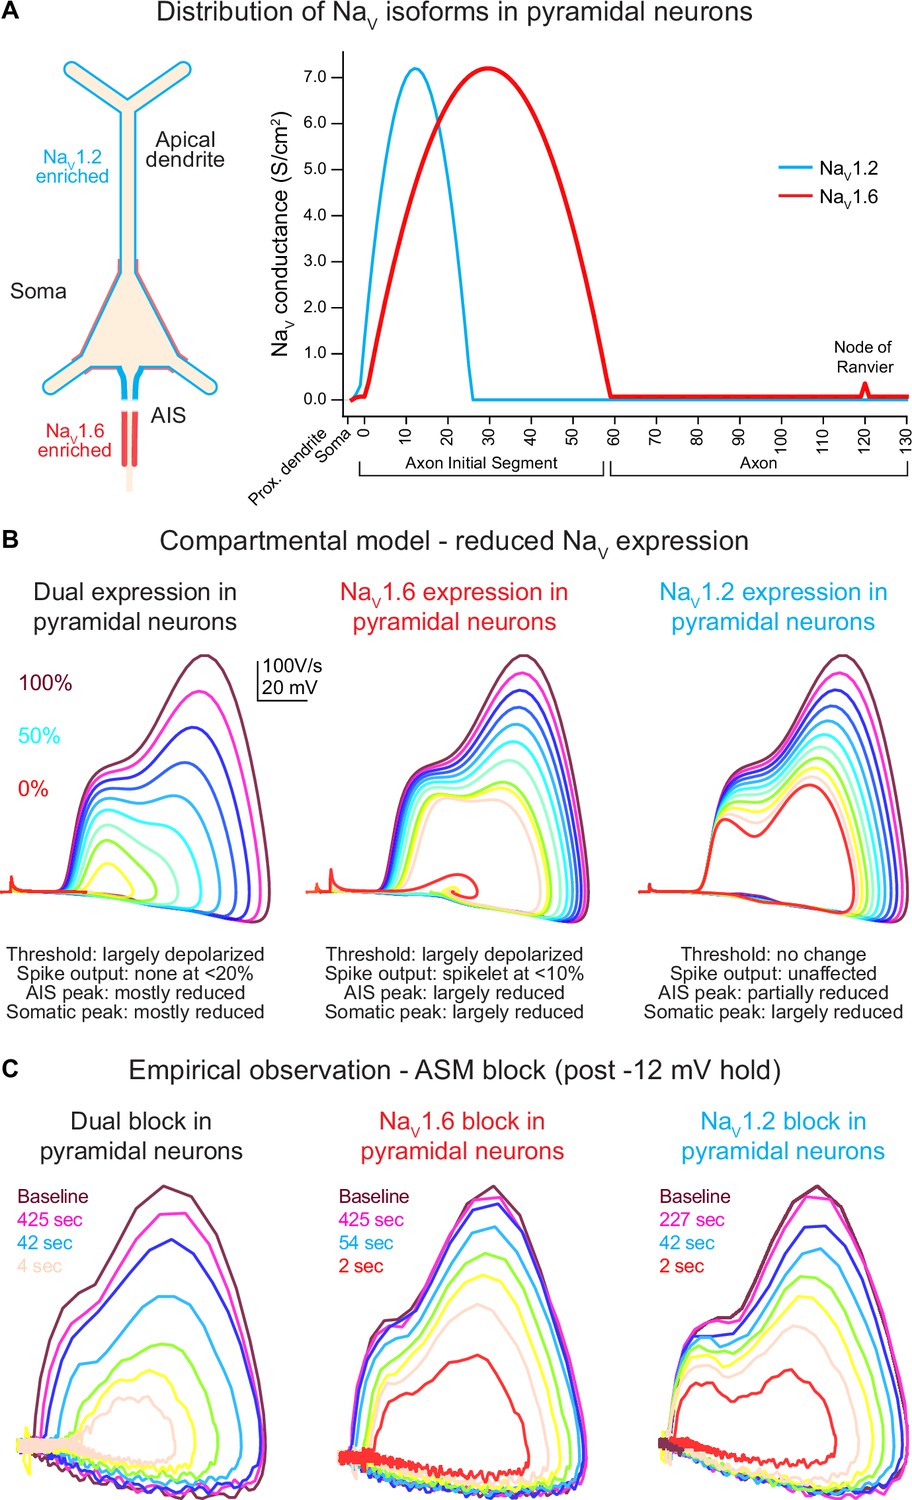
Global Scn2a, Scn8a, or dual loss in compartmental models distinctly impacts key action potential (AP) properties.
(A) NaV1.6 and NaV1.2 are equally expressed in soma and proximal dendrites. Expression pattern is more distinct in other regions with NaV1.6 enriched in the distal axon initial segment (AIS), axon, and nodes of Ranvier, whereas NaV1.2 is found exclusively in the proximal AIS and distal dendrites. (B) Compartmental model representing changes to phase plots when NaV isoform expression is reduced from 100% (warmer colors) to 0% (in 10% increments) based on known localization across distinct neuronal localities. Lower NaV1.6 expression depolarized spike threshold and decreased both AIS and somatic AP velocity (dV/dt). Reduced NaV1.2 expression largely impacts backpropagation and somatic AP velocity. (C) Empirical observations of phase plot following near-complete channel block with ASCs. Darker trace represents phase plot taken at baseline prior to –12 mV hold for 30 s (see Figure 3A). Colored traces represent recovery phase plots at different times post –12 mV hold for 30 s with warmer colors depicting more time lapsed and increased channel recovery.
Figure 2—figure supplement 1
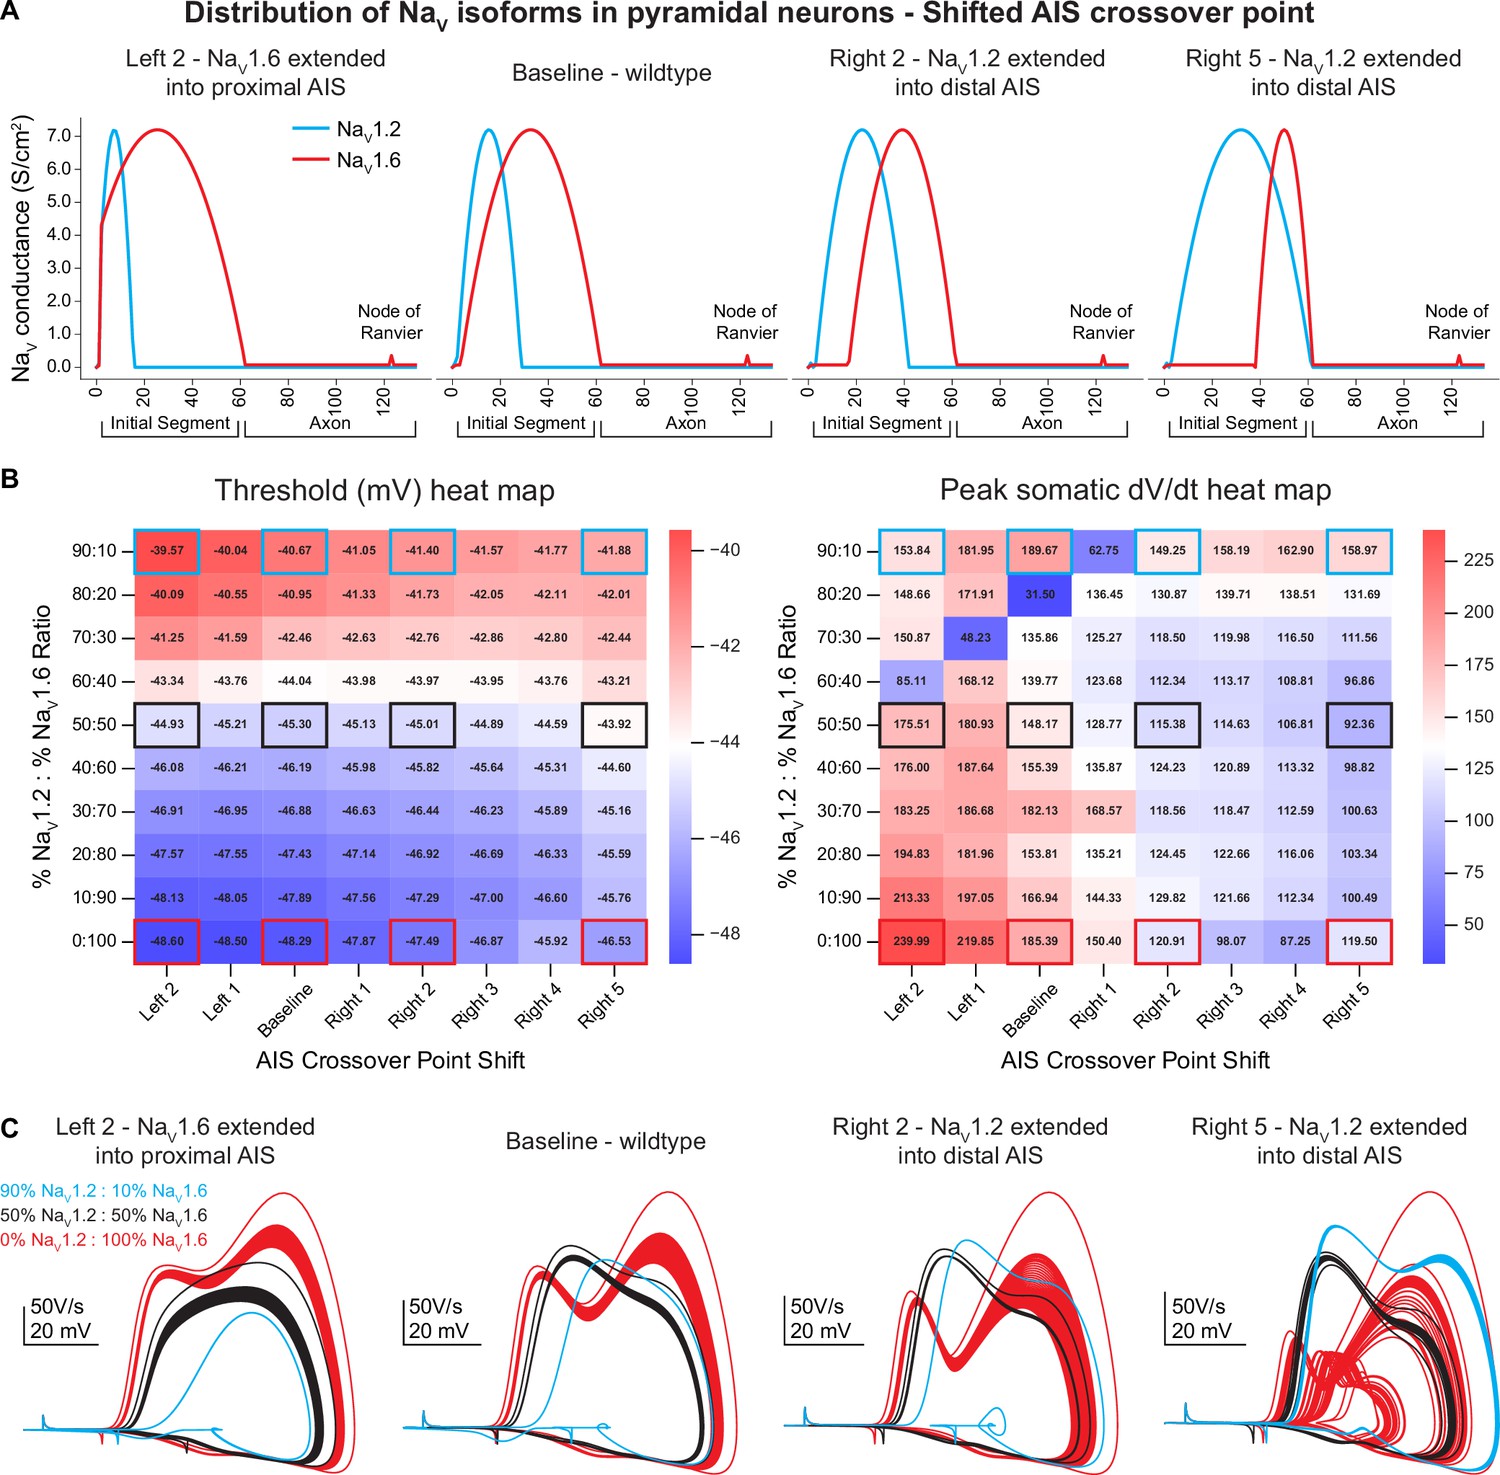
Compartmental model sensitivity analysis.
(A) To assess model sensitivity, NaV1.6 and NaV1.2 distribution is shifted throughout the axon initial segment (AIS). The AIS crossover point is adjusted from baseline with NaV1.6 extended into the proximal AIS (left 2) or NaV1.2 extended into the distal AIS (right 2 and 5). (B) Heat maps for action potential (AP) threshold and peak somatic dV/dt at different AIS crossover points. NaV1.2 and NaV1.6 ratios are also varied along the y-axis. (C) Example phase plane traces at different AIS crossover positions. Each AIS crossover position shows individual plots based on the different NaV ratios. Increased NaV1.2 density consistently depolarized AP threshold, while dV/dt peaks are randomly altered at the different density ratios. Scale bars are unique to each AIS crossover position.
Figure 3 with 2 supplements
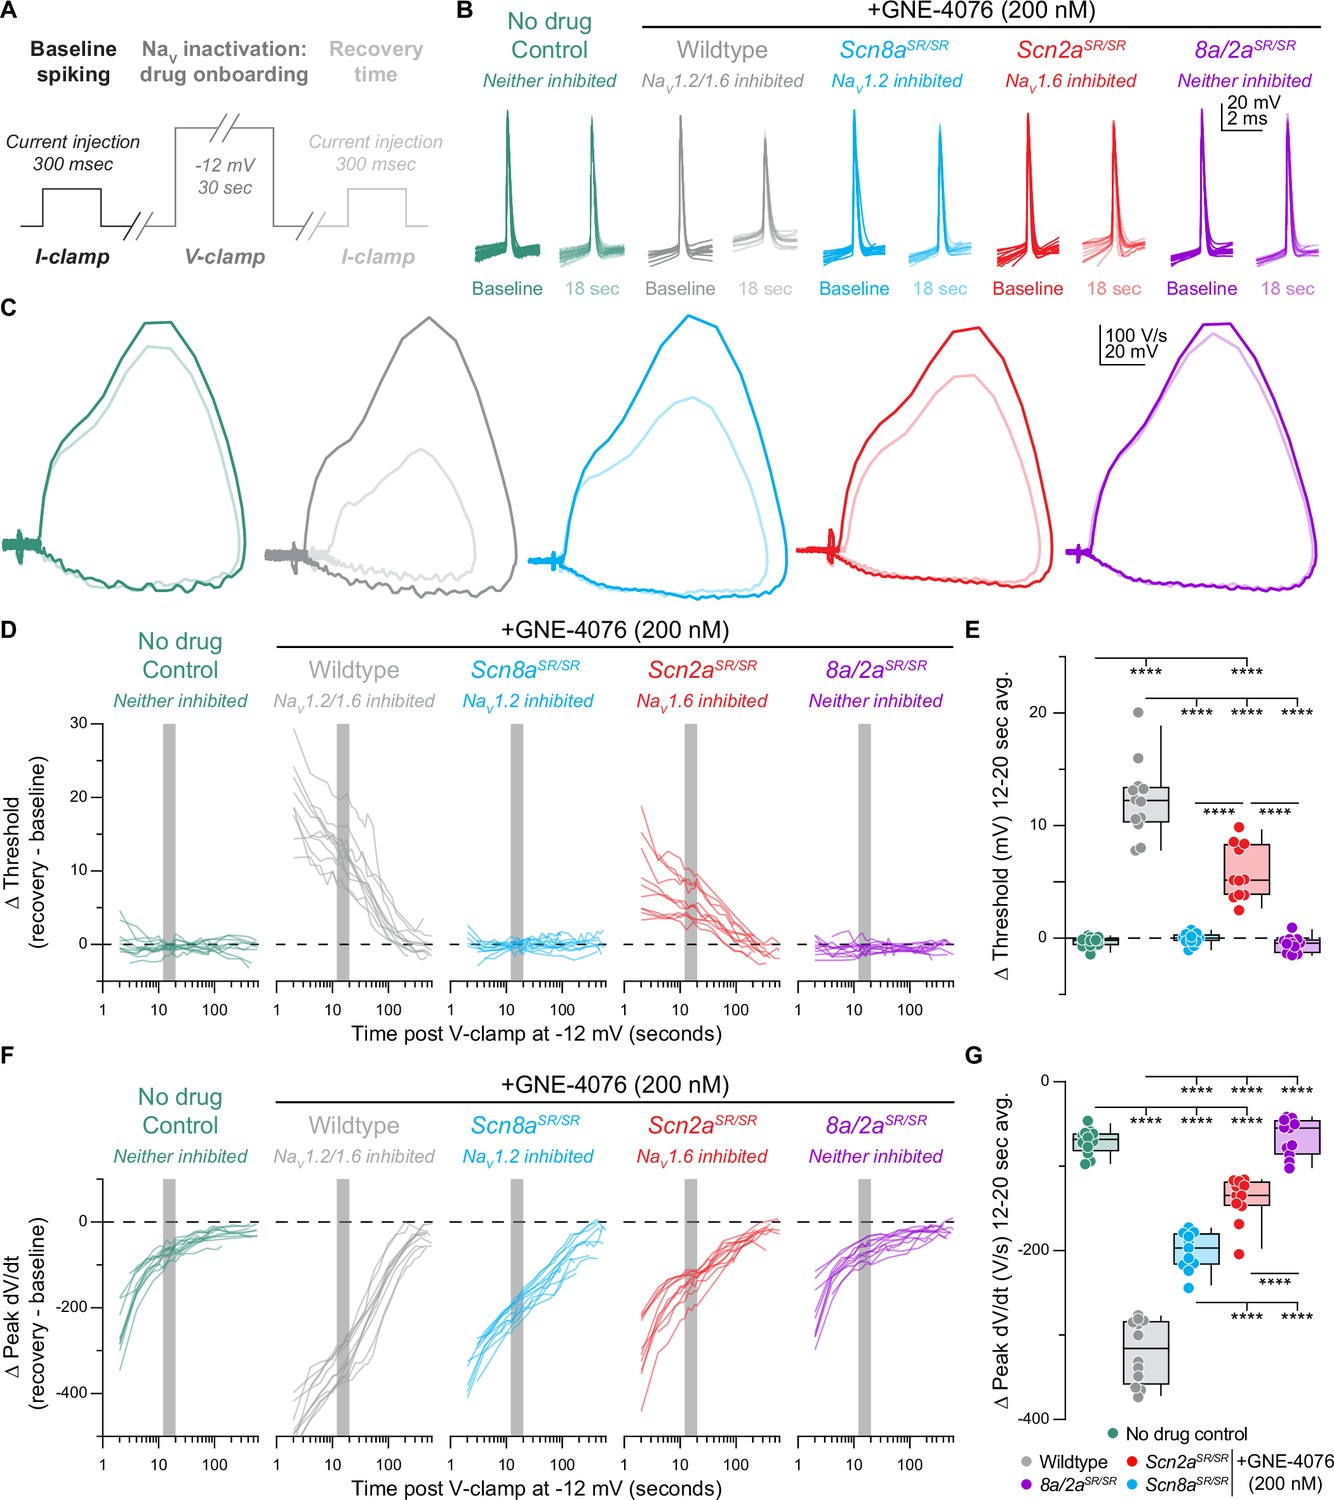
Recovery of action potential (AP) firing properties is greatly diminished following dual NaV1.6 and NaV1.2 inhibition compared to selective block of individual channels.
(A) Protocol used to characterize recovery of AP firing properties. Baseline spiking is determined by injecting current for 300 ms to elicit five to six APs. To promote NaV inactivation and maximal GNE-4076 onboarding, neurons are held at –12 mV in voltage-clamp for 30 s. Recovery of AP firing is evaluated by injecting the same current stimulus defined during baseline spiking with an inter-stimulus interval starting at 2 s, followed by 5, 15, 30, and 60 s. (B) Overlaid waveform of first AP at baseline or 18 s post GNE-4076 onboarding for all conditions (wildtype no drug, n = 12; wildtype + GNE-4076, n = 11; Scn8a/2aSR/SR + GNE-4076, n = 10; Scn2aSR/SR + GNE-4076, n = 11; Scn8aSR/SR. + GNE-4076, n = 11). (C) Overlaid phase plane of AP traces at baseline (100% transparency) or 18 s post GNE-4076 onboarding (20% transparency) for each condition in (B). Plots represent the AP velocity by taking the first derivative (dV/dt, y-axis) versus the membrane potential (mV, x-axis). Colors are matched to conditions represented in (B). (D) Recovery of AP threshold (Vm) represented as a delta value for individual cells plotted against time post GNE-4076 onboarding (log-scale). For Δ Vm, the baseline value is subtracted from individual timepoints throughout the recovery phase (Δ mV = recovery timepoint – baseline). Colors are matched to conditions represented in (B). Gray shaded bar represents recovery between 12 and 20 s. (E) Summary data for Δ Vm at 12–20 s post GNE-4076 onboarding (time period represented as gray bar in (D)). Box plots show median and 90% tails. Circles represent individual cells. One-way ANOVA, Holm–Šídák multiple comparisons test. ****p < 0.0001. (F) Recovery of AP peak velocity (dV/dt) represented as a delta value for individual cells plotted against time post GNE-4076 onboarding (log-scale). For Δ dV/dt, the baseline value is subtracted from individual time points throughout the recovery phase (Δ V/s = recovery timepoint – baseline). Colors are matched to conditions represented in (B). Gray shaded bar represents recovery between 12 and 20 s. (G) Summary data for Δ dV/dt at 12–20 s post GNE-4076 onboarding (time period represented as gray bar in (F)). Box plots show median and 90% tails. Circles represent individual cells. One-way ANOVA, Holm–Šídák multiple comparisons test. ****p < 0.0001.
-
Figure 3—source data 1
Data values for each experiment described in Figure 3.
- https://cdn.elifesciences.org/articles/105696/elife-105696-fig3-data1-v2.xlsx
Figure 3—figure supplement 1
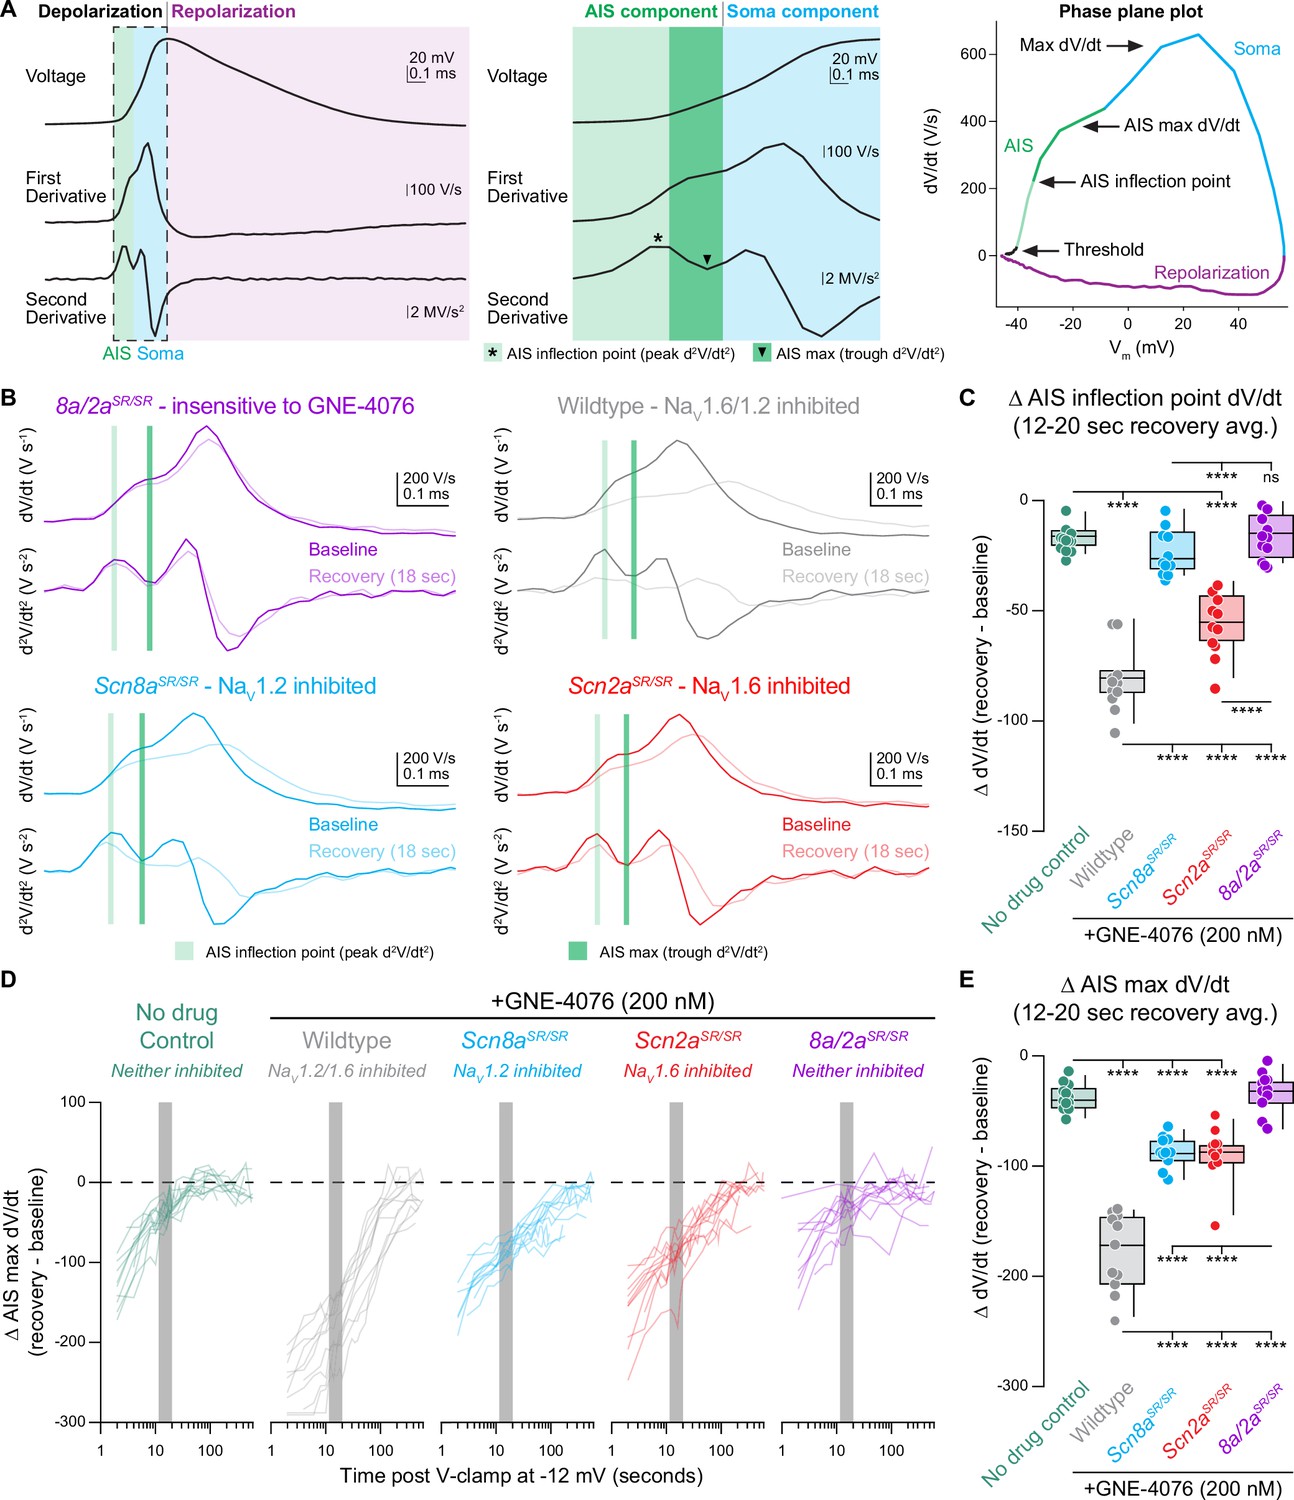
Depolarization across the axon initial segment (AIS) compartment is mediated by distinct NaV isoforms.
(A) Schematic depicting different phases of an action potential (AP), including AP velocity (first derivative; dV/dt or V/s) and acceleration (second derivative; d2V/dt2 or V/s2). APs can be divided based on depolarization or repolarization phases, which largely depends on the opening of various voltage-gated ion channels. During cellular depolarization, two components exist that largely account for voltage change detected at either the AIS or soma, which are easily discerned by two humps present on a phase plane plot. The AIS component can further be separated into the AIS max or inflection point defined as the trough or peak of the second derivative and likely represents voltage change at distinct AIS regions like the proximal or distal AIS, respectively. (B) Example traces of first and second derivatives for all genotypes at baseline or 18 s post recovery. AIS inflection point (light green) is defined as corresponding dV/dt when acceleration (d2V/dt2) peaks during the AIS component. AIS max point (dark green) is defined as corresponding dV/dt when acceleration plateaus (visualized as a trough of d2V/dt2) during AIS component. (C) Summary data for Δ AIS inflection point (dV/dt) at 12–20 s post GNE-4076 onboarding (represented as light green bar in (B)). Box plots show median and 90% tails. Circles represent individual cells (wildtype no drug, n = 12; wildtype + GNE-4076, n = 11; Scn2aSR/SR + GNE-4076, n = 11; Scn8aSR/SR + GNE-4076, n = 11; Scn8a/2aSR/SR + GNE-4076, n = 11). One-way ANOVA, Holm–Šídák multiple comparisons test. ****p < 0.0001. (D) Recovery of AIS max velocity (dV/dt) represented as a delta value for individual cells plotted against time post GNE-4076 onboarding (log-scale). For Δ dV/dt, the baseline value is subtracted from individual time points throughout the recovery phase (Δ V/s = recovery timepoint − baseline). Gray shaded bar represents recovery between 12 and 20 s. (E) Summary data for Δ AIS max velocity (dV/dt) at 12–20 s post GNE-4076 onboarding (represented as gray bar in (D) or dark green bar in (B)). Box plots show median and 90% tails. Circles represent individual cells. One-way ANOVA, Holm–Šídák multiple comparisons test. ****p < 0.0001.
-
Figure 3—figure supplement 1—source data 1
Data values for each experiment described in Figure 3- figure supplement 1.
- https://cdn.elifesciences.org/articles/105696/elife-105696-fig3-figsupp1-data1-v2.xlsx
Figure 3—figure supplement 2
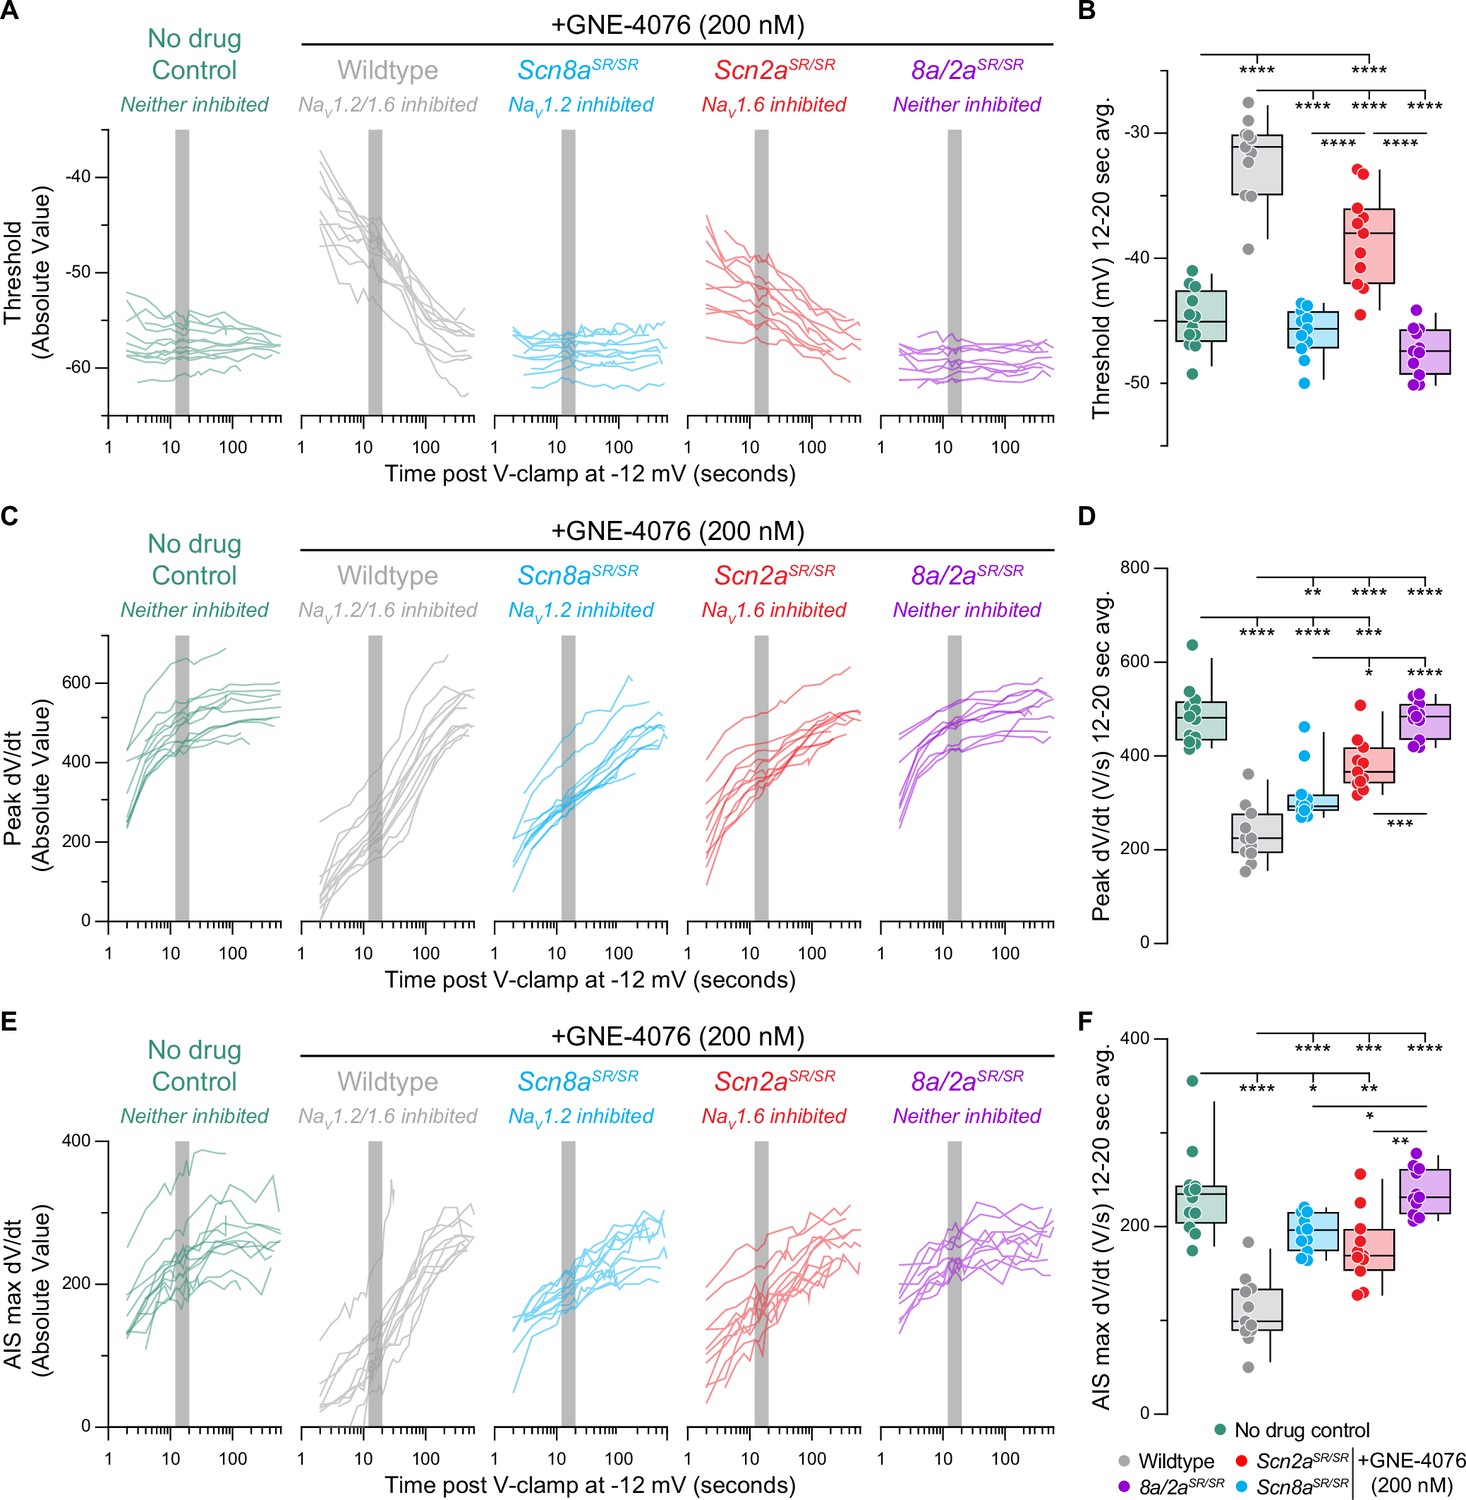
Recovery of action potential (AP) firing properties represented as absolute values.
(A) Recovery of AP threshold (Vm) represented as absolute values for individual cells (wildtype no drug, n = 12; wildtype + GNE-4076, n = 11; Scn2aSR/SR + GNE-4076, n = 11; Scn8aSR/SR + GNE-4076, n = 11; Scn8a/2aSR/SR + GNE-4076, n = 11) plotted against time post GNE-4076 onboarding (log-scale). Colors are matched to conditions represented in Figure 3B. Gray shaded bar represents recovery between 12 and 20 s. (B) Summary data for Vm at 12–20 s post GNE-4076 onboarding (time period represented as gray bar in (A)). Box plots show median and 90% tails. Circles represent individual cells. One-way ANOVA, Holm–Šídák multiple comparisons test. *p < 0.05, **p < 0.01, ***p < 0.001, ****p < 0.0001. (C) Recovery of AP peak velocity (dV/dt) represented as absolute values for individual cells plotted against time post GNE-4076 onboarding (log-scale). Colors are matched to conditions represented in Figure 3B. Gray shaded bar represents recovery between 12 and 20 s. (D) Summary data for peak dV/dt at 12–20 s post GNE-4076 onboarding (time period represented as gray bar in (C)). Box plots show median and 90% tails. Circles represent individual cells. One-way ANOVA, Holm–Šídák multiple comparisons test. *p < 0.05, **p < 0.01, ***p < 0.001, ****p < 0.0001. (E) Recovery of axon initial segment (AIS) max velocity (dV/dt) represented as absolute values for individual cells plotted against time post GNE-4076 onboarding (log-scale). Colors are matched to conditions represented in Figure 3B. Gray shaded bar represents recovery between 12 and 20 s. (F) Summary data for AIS max velocity (dV/dt) at 12–20 s post GNE-4076 onboarding (time period represented as gray bar in (E)). Box plots show median and 90% tails. Circles represent individual cells. One-way ANOVA, Holm–Šídák multiple comparisons test. *p < 0.05, **p < 0.01, ***p < 0.001, ****p < 0.0001.
-
Figure 3—figure supplement 2—source data 1
Data values for each experiment described in Figure 3-figure supplement 2.
- https://cdn.elifesciences.org/articles/105696/elife-105696-fig3-figsupp2-data1-v2.xlsx
Figure 4

Acute inhibition of NaV1.2 increases action potential (AP) excitability.
(A) AP train over 300 ms at baseline (black) or 18 s post GNE-4076 onboarding (color) for all conditions (wildtype no drug, n = 12; wildtype + GNE-4076, n = 10; Scn8a/2aSR/SR + GNE-4076, n = 11; Scn2aSR/SR + GNE-4076, n = 11; Scn8aSR/SR. + GNE-4076, n = 11). Dashed line represents Vm of last afterhyperpolarization (AHP). (B) Summary data for Δ spike number at 12–20 s post GNE-4076 onboarding. Violin plots show median. Circles represent individual cells. One-way ANOVA, Holm–Šídák multiple comparisons test. *p < 0.05, **p < 0.01, ****p < 0.0001. (C) Summary data for Δ last AHP at 12–20 s post GNE-4076 onboarding. Box plots show median and 90% tails. Circles represent individual cells. One-way ANOVA, Holm–Šídák multiple comparisons test. *p < 0.05, **p < 0.01.
-
Figure 4—source data 1
Data values for each experiment described in Figure 4.
- https://cdn.elifesciences.org/articles/105696/elife-105696-fig4-data1-v2.xlsx
Figure 5
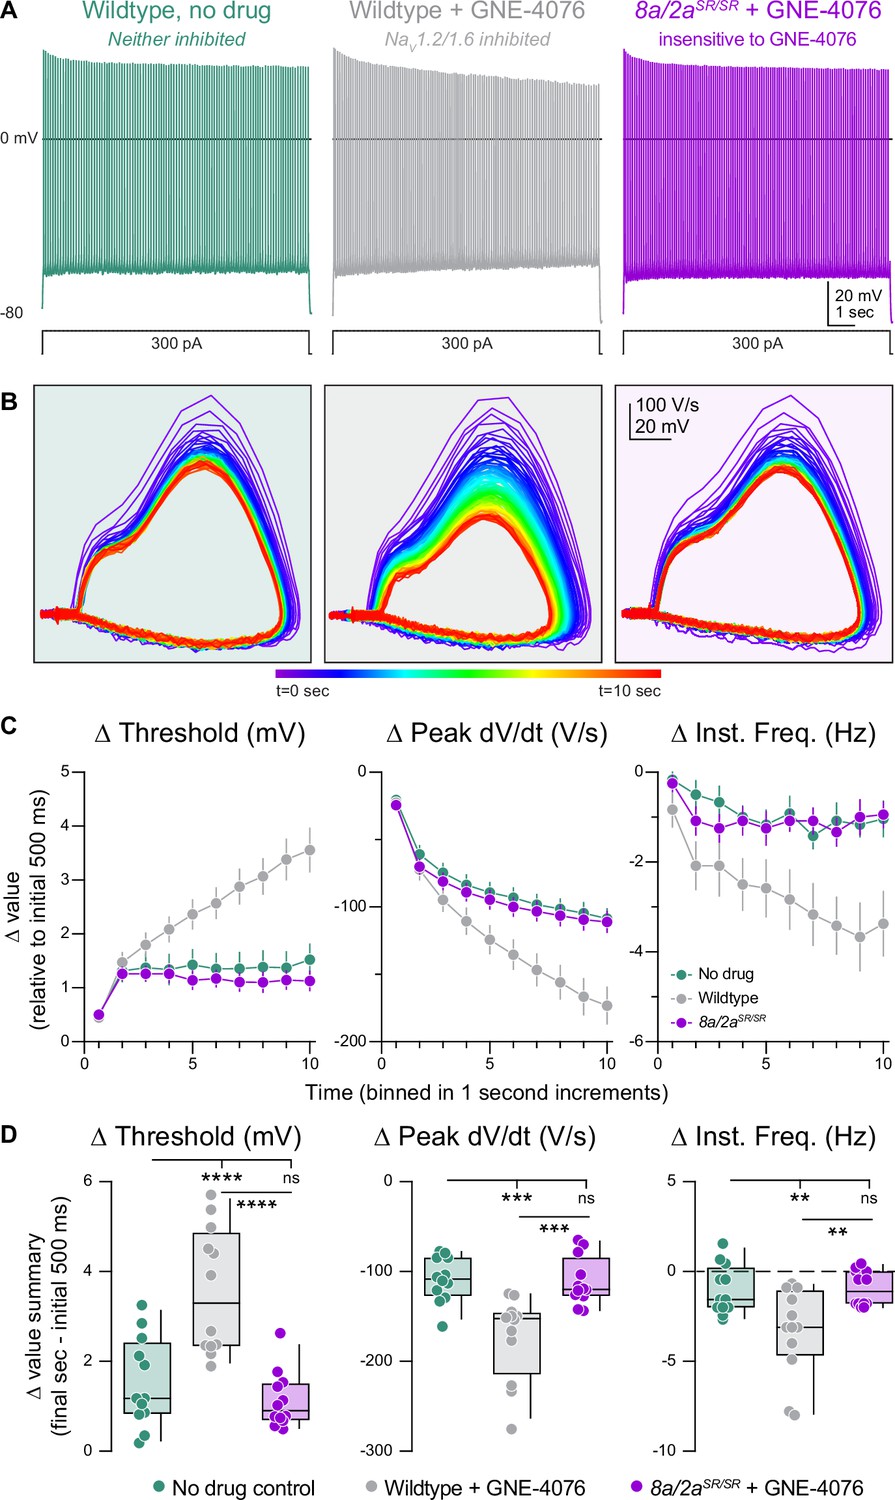
Activity-dependent onboarding of GNE-4076 to NaV channels alters action potential (AP) firing properties in layer 5b, thick-tufted excitatory neurons.
(A) Representative AP firing response to 300 pA current injection for 10 s in wildtype or Scn8a/2aSR/SR cells with or without 200 nM GNE-4076. (B) Phase plane of AP traces shown in (A). Plots represent AP velocity by taking the first derivative (dV/dt, y-axis) versus the membrane potential (mV, x-axis). To represent changes with phase plane relative to time, a rainbow color spectrum is used with warmer colors representing more time lapsed. (C) Delta threshold (Δ mV), delta peak dV/dt (Δ V/s), and delta instantaneous firing frequency (Δ Hz) binned in 1-s increments normalized to the initial 500 ms of current injection (binned time – initial 500 ms). Circles represent mean Δ value ± SEM. Two-way ANOVA, Holm–Šídák multiple comparisons test. (D) Summary data for the final sec in (C). Delta values are normalized to the initial 500 ms of the stimulus (binned time – initial 500 ms). Box plots show median and 90% tails. Circles represent individual cells (wildtype no drug, n = 12; wildtype + GNE-4076, n = 12; Scn8a/2aSR/SR + GNE-4076, n = 12). One-way ANOVA, Holm–Šídák multiple comparisons test. **p < 0.01, ***p < 0.001, ****p < 0.0001.
-
Figure 5—source data 1
Data values for each experiment described in Figure 5.
- https://cdn.elifesciences.org/articles/105696/elife-105696-fig5-data1-v2.xlsx
Figure 6 with 1 supplement
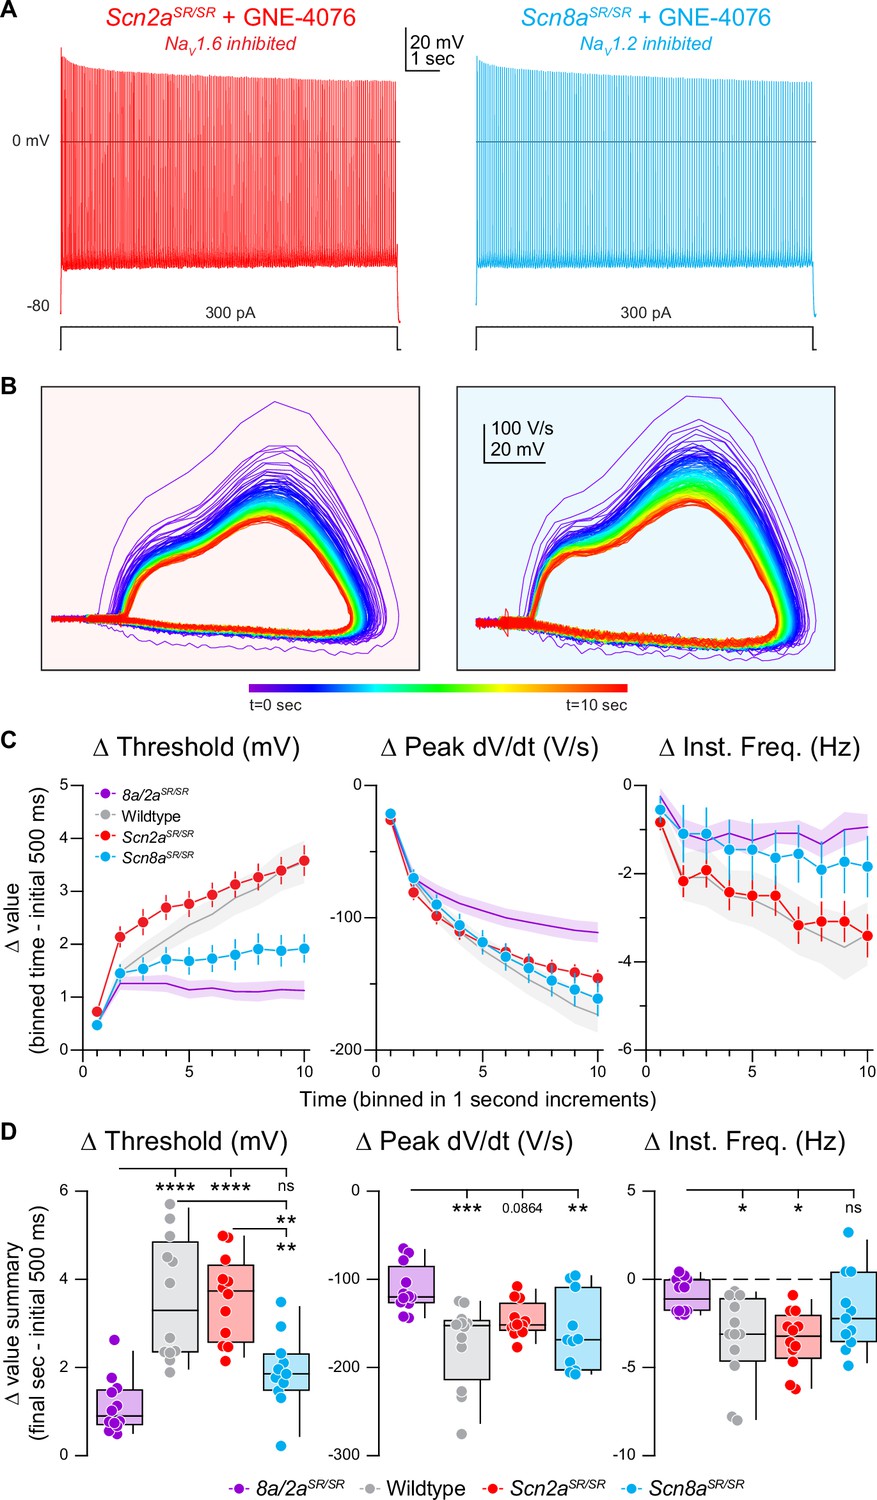
Selective inhibition of NaV1.6 depolarizes action potential (AP) threshold markedly, while blocking both NaV1.6 and NaV1.2 reduces AP velocity.
(A) Representative AP firing response to 300 pA current injection for 10 s in Scn2aSR/SR or Scn8aSR/SR cells with 200 nM GNE-4076 to selectively inhibit NaV1.6 or NaV1.2, respectively. (B) Phase plane of AP traces shown in (A). Plots represent AP velocity by taking the first derivative (dV/dt, y-axis) versus the membrane potential (mV, x-axis). To represent changes with phase plane relative to time, a rainbow color spectrum is used with warmer colors representing more time lapsed. (C) Delta threshold (Δ mV), delta peak dV/dt (Δ V/s), and delta instantaneous firing frequency (Δ Hz) binned in 1-s increments normalized to the initial 500ms of current injection (binned time – initial 500 ms). Circles represent mean Δ value ± SEM. Average Δ value ± SEM for Scn8a/2aSR/SR + GNE-4076 and wildtype + GNE-4076 from Figure 5C are represented. (D) Summary data for the final sec in (C). Delta values are normalized to the initial 500 ms of the stimulus (binned time – initial 500 ms). Box plots show median and 90% tails. Circles represent individual cells (Scn8a/2aSR/SR + GNE-4076, n = 12; wildtype + GNE-4076, n = 12; Scn2aSR/SR + GNE-4076, n = 12; Scn8aSR/SR + GNE-4076, n = 11). One-way ANOVA, Holm–Šídák multiple comparisons test. *p < 0.05, **p < 0.01, ***p < 0.001, ****p < 0.0001.
-
Figure 6—source data 1
Data values for each experiment described in Figure 6.
- https://cdn.elifesciences.org/articles/105696/elife-105696-fig6-data1-v2.xlsx
Figure 6—figure supplement 1
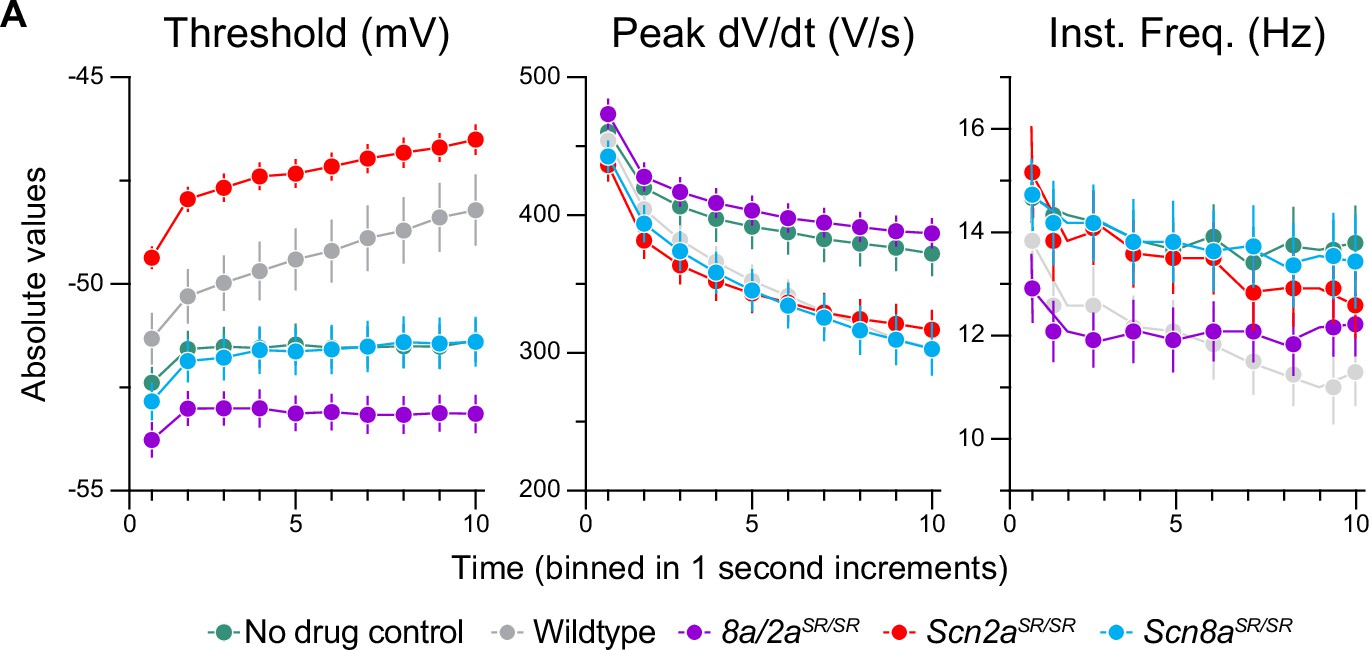
Absolute values for activity-dependent onboarding of GNE-4076.
(A) Absolute values for threshold (mV), peak dV/dt (V/s), and instantaneous firing frequency (Hz) binned in 1-s increments. Circles represent mean absolute value ± SEM (wildtype no drug, n = 12; wildtype + GNE-4076, n = 12; Scn8a/2aSR/SR + GNE-4076, n = 12; Scn2aSR/SR + GNE-4076, n = 12; Scn8aSR/SR + GNE-4076, n = 11). Two-way ANOVA, Holm–Šídák multiple comparisons test.
-
Figure 6—figure supplement 1—source data 1
Data values for each experiment described in Figure 6-figure supplement 1.
- https://cdn.elifesciences.org/articles/105696/elife-105696-fig6-figsupp1-data1-v2.xlsx
Figure 7 with 1 supplement
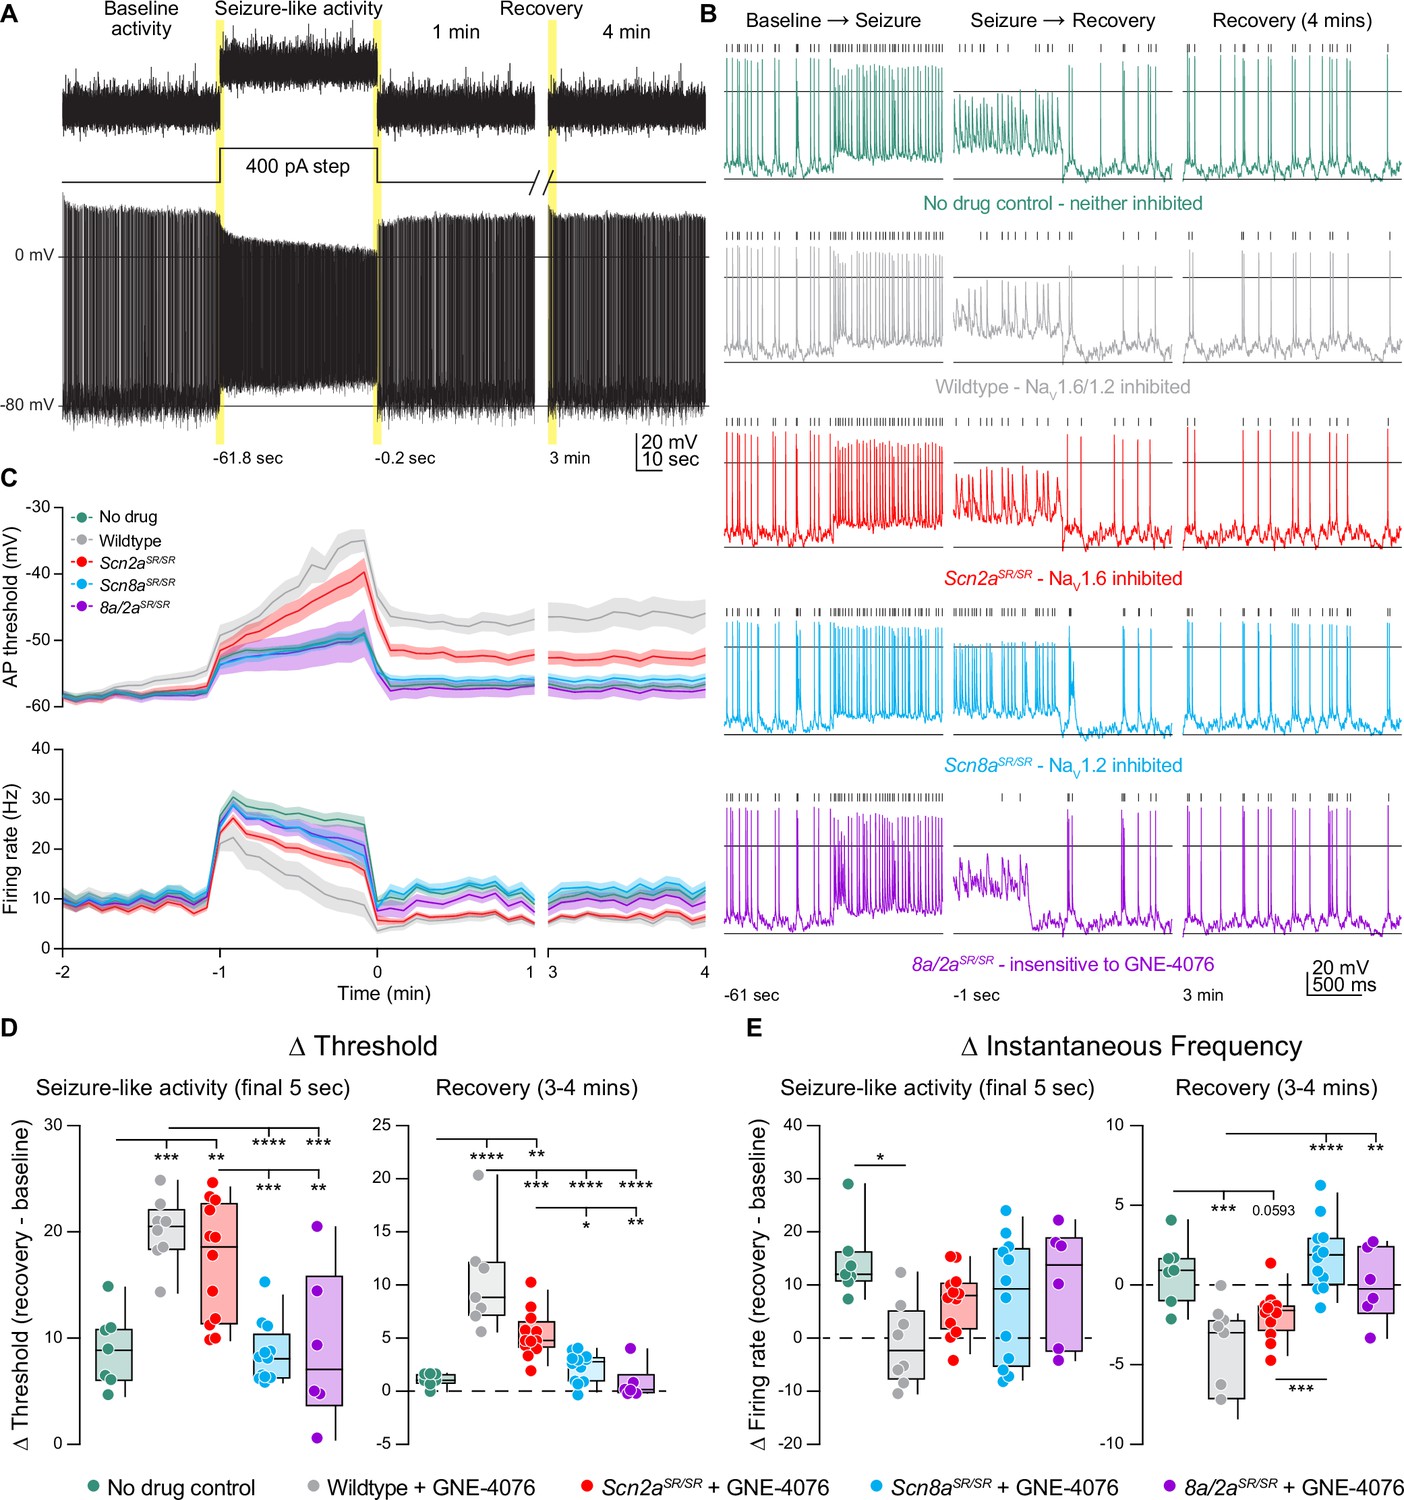
GNE-4076 onboarding following seizure-like activity continually impacts neuronal firing into recovery.
(A) Stimulation protocol and example firing trace of cell injected with fluctuating post-synaptic potentials (PSPs) randomly generated using a Poisson probability distribution function for 60 s. PSPs were continuously applied to acquire baseline activity, seizure-like activity, and recovery activity. During seizure-like activity, a 400-pA step was applied in addition to the PSP. Recovery was continuously recorded for up to 4 min post seizure-like activity. (B) Zoomed-in example traces for all genotypes at the Baseline → Seizure transition, Seizure → Recovery transition, and start of 3–4 min recovery period (highlighted in (A)). Solid horizontal black bar represents membrane potential (Vm) of –12 mV. Tick marks above traces represent detected spikes defined as a change in Vm of 15 V/s or greater. (C) Threshold (mV) or instantaneous firing frequency (Hz) binned in 5-s increments for all genotypes in (B). Solid lines represent mean value ± SEM. Timescale on x-axis mirrors activity presented in (A). (D) Summary of threshold data for the final 5 s of seizure-like activity or entire 3–4 min recovery time point in (C). Delta values are normalized to baseline activity (either at final 5 s or entire period). Box plots show median and 90% tails. Circles represent individual cells (wildtype no drug, n = 7; wildtype + GNE-4076, n = 7–8; Scn2aSR/SR + GNE-4076, n = 12; Scn8aSR/SR + GNE-4076, n = 12; Scn8a/2aSR/SR + GNE-4076, n = 6). One-way ANOVA, Holm–Šídák multiple comparisons test. *p < 0.05, **p < 0.01, ***p < 0.001, ****p < 0.0001. (E) Summary of instantaneous frequency data for the final 5 s of seizure-like activity or entire 3–4 min recovery time point in (C). Delta values are normalized to baseline activity (either at final 5 s or entire period). Box plots show median and 90% tails. Circles represent individual cells. One-way ANOVA, Holm–Šídák multiple comparisons test. *p < 0.05, **p < 0.01, ***p < 0.001, ****p < 0.0001.
-
Figure 7—source data 1
Data values for each experiment described in Figure 7.
- https://cdn.elifesciences.org/articles/105696/elife-105696-fig7-data1-v2.xlsx
Figure 7—figure supplement 1
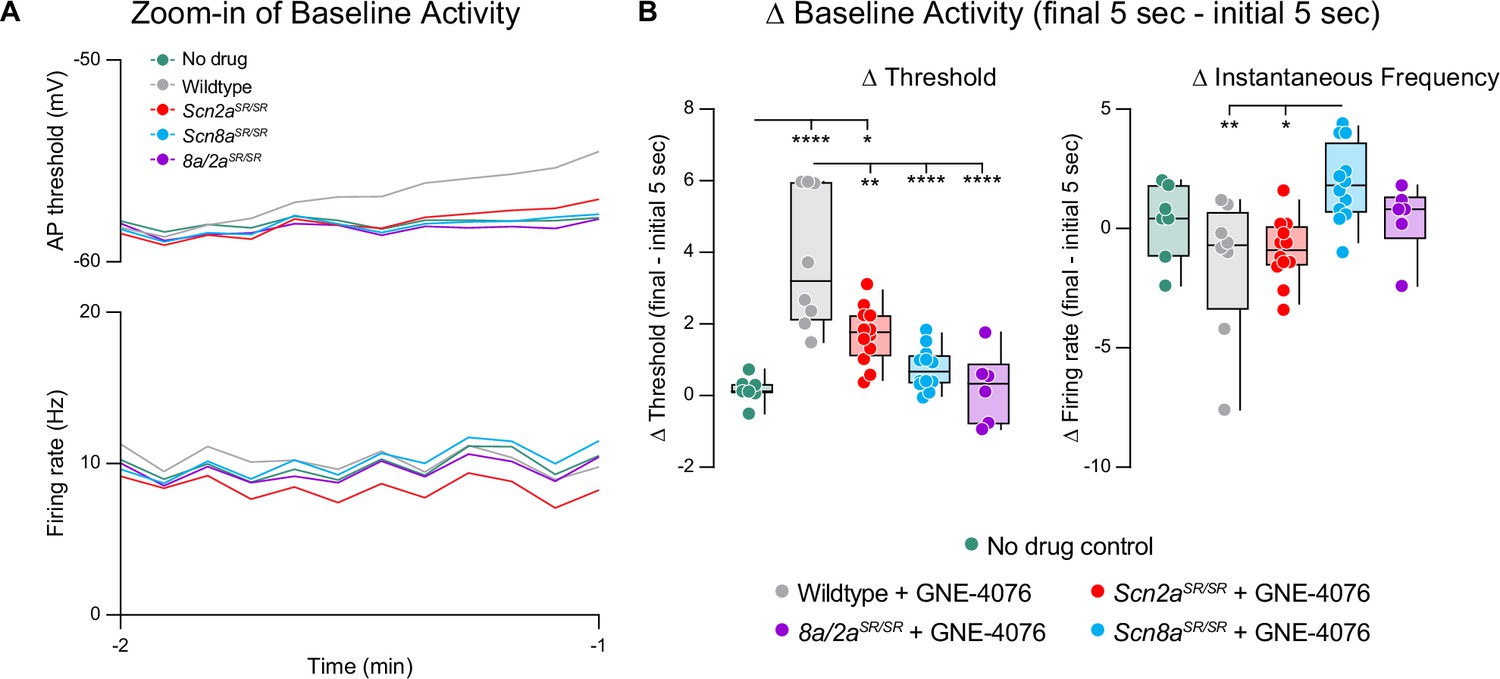
GNE-4076 onboarding during baseline post-synaptic potential (PSP) activity.
(A) Changes to baseline activity prior to seizure-like activity (Zoom-in of Figure 7C). Absolute values for both threshold (mV) and instantaneous firing frequency (Hz) are binned in 5-s increments for all genotypes in Figure 7B. (B) Summary of threshold or instantaneous frequency data for the final 5 s of baseline activity in (A). Delta values are normalized to the initial 5 s of baseline activity (final − initial 5 s). Box plots show median and 90% tails. Circles represent individual cells (wildtype no drug, n = 7; wildtype + GNE-4076, n = 8; Scn2aSR/SR + GNE-4076, n = 12; Scn8aSR/SR + GNE-4076, n = 12; Scn8a/2aSR/SR + GNE-4076, n = 6). One-way ANOVA, Holm–Šídák multiple comparisons test. *p < 0.05, **p < 0.01, ****p < 0.0001.
-
Figure 7—figure supplement 1—source data 1
Data values for each experiment described in Figure 7-figure supplement 1.
- https://cdn.elifesciences.org/articles/105696/elife-105696-fig7-figsupp1-data1-v2.xlsx
Author response image 1
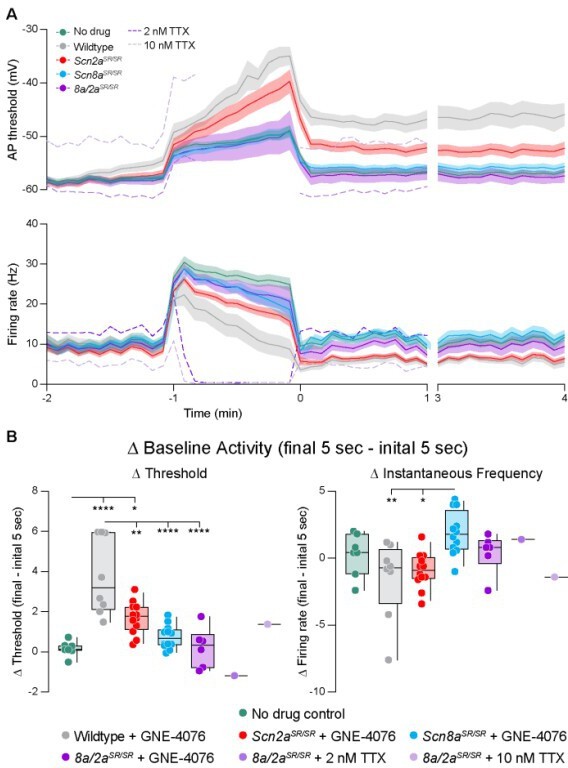
Data from Figure 6B, D, E are replicated here with individual lines of 2 nM and 10 nM TTX shown in dashed lines.
Note marked changes in threshold not observed with GNE-4076. TTX sourced from Alomone Labs.
Tables
Key resources table
| Reagent type (species) or resource | Designation | Source or reference | Identifiers | Additional information |
|---|---|---|---|---|
| Gene (Homo sapiens) | Scn2a Human tagged ORF clone | Origene | NM_021007 | NaV1.2 |
| Gene (Homo sapiens) | Scn8a Human tagged ORF clone | Origene | NM_014191 | NaV1.6 |
| Strain, strain background (Mus musculus, both sexes) | C57BL/6J | Jackson Laboratory | RRID:IMSR_JAX:000664 | Wildtype mice |
| Strain, strain background (Mus musculus, both sexes) | C57BL/6N | Janvier Labs | RRID:IMSR_RJ:C57BL-6NRJ | Mating with founders |
| Strain, strain background (Mus musculus, both sexes) | Scn8a YW→SR KI | Genentech; Deng et al., 2023; PMID:37352856 | N/A | NaV1.6 GNE-4076 insensitive mice |
| Strain, strain background (Mus musculus, both sexes) | Scn2a YW→SR KI | Genentech; this manuscript | N/A | NaV1.2 GNE-4076 insensitive mice |
| Strain, strain background (Mus musculus, both sexes) | Dual Scn8a/2a YW→SR KI | Genentech; this manuscript | N/A | Both GNE-4076 insensitive |
| Cell line (Homo sapiens) | HEK293T | ATCC CRL-3216 | RRID:CVCL_0063 | IC50 curves; biophysics |
| Cell line (Mus musculus) | ND7/23 (low NaV) | Al George Lab; Vanoye et al., 2024 | PMID:38771640 | IC50 curves; biophysics |
| Recombinant DNA reagent | pIR-CMV-SCN2A-Variant-1-IRES-mScarlet | Addgene | RRID:Addgene_162279 | NaV1.2 Plasmid #162279 |
| Recombinant DNA reagent | pcDNA4TO-SCN8A-Variant-3-IRES-mScarlet | Addgene | RRID:Addgene_209411 | NaV1.6 Plasmid #209411 |
| Sequence-based reagent | 2A_Y1564S_W1565R F | This paper | PCR primers | ATTCTGTCC CGGATTAAT CTGGTGTTT ATTGTTCT |
| Sequence-based reagent | 2A_Y1564S_W1565R R | This paper | PCR primers | AGATTAATC CGGGACAG AATGTTTGT CATTTCTTGA |
| Sequence-based reagent | 8A_Y1555S_W1556R F | This paper | PCR primers | CATCCTCTC CCGGATTAA CCTGGTGTT TGTT |
| Sequence-based reagent | 8A_Y1555S_W1556R R | This paper | PCR primers | GGTTAATCC GGGAGAGG ATGTTCTCC ATCTG |
| Chemical compound, drug | GNE-4076 or Compound 5 | Merck & Co, Inc; Roecker et al., 2017 | PMID:28389149 | Used at 200 nM |
| Software, algorithm | IGOR Pro v6.3 & v9 | Wavemetrics | RRID:SCR_000325 | N/A |
| Software, algorithm | Prism 10 | GraphPad | RRID:SCR_002798 | N/A |
| Software, algorithm | NEURON Compartmental Models | modelDB | RRID:SCR_007271 and SCR_003105 | https://modeldb.science/2019342 |
| Software, algorithm | Python | https://www.python.org/ | RRID:SCR_008394 | N/A |
| Software, algorithm | Benchling | https://www.benchling.com/ | RRID:SCR_013955 | N/A |
Table 1
Mutagenic primer sequences for NaV1.2 and NaV1.6.
| Primer name | Sequence (5′ to 3′) |
|---|---|
| 2A_Y1564S_W1565R_F | attctgtCcCggattaatctggtgtttattgttct |
| 2A_Y1564S_W1565R_R | agattaatccGgGacagaatgtttgtcatttcttga |
| 8A_Y1555S_W1556R_F | catcctctCcCggattaacctggtgtttgtt |
| 8A_Y1555S_W1556R_R | ggttaatccGgGagaggatgttctccatctg |
Table 2
Voltage dependence of activation and inactivation for wildtype and mutant NaV isoforms, related to Figure 1.
| NaV channel | V ½ of activation (mV) | Slope factor | V ½ of inactivation (mV) | Slope factor |
|---|---|---|---|---|
| Scn2aYW/YW or wildtype NaV1.2 (n = 6) | –20.1 ± 2.6 | 6.6 ± 0.5 | –68.3 ± 1.8 | 6.9 ± 0.3 |
| Scn2aSR/SR or mutant NaV1.2 (n = 7) | –18.7 ± 2.1 | 6.4 ± 0.6 | –68.1 ± 0.8 | 7.1 ± 0.5 |
| Scn8aYW/YW or wildtype NaV1.6 (n = 8) | –23.9 ± 2.3 | 6.7 ± 0.4 | –74.6 ± 3.3 | 6.9 ± 0.5 |
| Scn8aSR/SR or mutant NaV1.6 (n = 6) | –26.1 ± 3.2 | 6.5 ± 0.4 | –71.9 ± 1.2 | 7.0 ± 0.3 |
Table 3
Neuronal action potential (AP) firing properties at baseline, related to Figures 3 and 4.
| NaV channel | Threshold (mV) | Peak dV/dt (V/s) | Spike # | Last AHP |
|---|---|---|---|---|
| No drug control (n = 12) | –42.53 ± 0.61 | 555.82 ± 17.57 | 5.83 ± 0.41 | –49.47 ± 0.43 |
| Wildtype (n = 11) | –42.41 ± 0.83 | 554.42 ± 14.5 | 5.36 ± 0.36 | –50.04 ± 0.71 |
| Scn8a/2aSR/SR (n = 10) | –44.87 ± 0.47 | 545.11 ± 12.89 | 5.09 ± 0.16 | –51.39 ± 0.5 |
| Scn2aSR/SR (n = 11) | –42.3 ± 0.76 | 520.05 ± 13.51 | 6.09 ± 0.32 | –49.31 ± 0.84 |
| Scn8aSR/SR (n = 11) | –43.87 ± 0.65 | 517.36 ± 21.83 | 5.18 ± 0.55 | –50.46 ± 0.74 |
Table 4
Action potential (AP) firing properties of first spike in 10 s AP train, related to Figures 5 and 6.
| NaV channel | Threshold (mV) | Peak dV/dt (V/s) |
|---|---|---|
| Wildtype, no drug (n = 12) | –43.1 ± 0.4 | 549.1 ± 8.8 |
| Wildtype + GNE-4076 (n = 12) | –41.7 ± 0.7 | 541.0 ± 12.5 |
| Scn8a/2aSR/SR + GNE-4076 (n = 12) | –43.7 ± 0.4 | 561.3 ± 14.5 |
| Scn2aSR/SR + GNE-4076 (n = 12) | –40.7 ± 0.4 | 500.7 ± 12.5 |
| Scn8aSR/SR + GNE-4076 (n = 11) | –43.3 ± 0.5 | 542.9 ± 11.6 |
Additional files
Download links
A two-part list of links to download the article, or parts of the article, in various formats.
Downloads (link to download the article as PDF)
Open citations (links to open the citations from this article in various online reference manager services)
Cite this article (links to download the citations from this article in formats compatible with various reference manager tools)
Differential roles of NaV1.2 and NaV1.6 in neocortical pyramidal cell excitability
eLife 14:RP105696.
https://doi.org/10.7554/eLife.105696.3


