Differential roles of NaV1.2 and NaV1.6 in neocortical pyramidal cell excitability
- Weill Institute for Neurosciences, University of California, San Francisco, United States
- Department of Neurology, University of California, San Francisco, United States
- Department of Neuroscience, Genentech, Inc., United States
- Department of Neurology, MIND Institute, University of California Davis School of Medicine, United States
- Department of Pharmacology, Northwestern University Feinberg School of Medicine, United States
eLife Assessment
This manuscript presents a clever and powerful approach to examining differential roles of Nav1.2 and Nav1.6 channels in excitability of neocortical pyramidal neurons, by engineering mice in which a sulfonamide inhibitor of both channels has reduced affinity for one or the other channels. Overall, the results in the manuscript are compelling and give important information about differential roles of Nav1.6 and Nav1.2 channels. Activity-dependent inactivation of NaV1.6 was also found to attenuate seizure-like activity in cells, demonstrating the promise of activity-dependent NaV1.6-specific pharmacotherapy for epilepsy.
https://doi.org/10.7554/eLife.105696.3.sa0Significance of the findings:
Important: Findings that have theoretical or practical implications beyond a single subfield
- Landmark
- Fundamental
- Important
- Valuable
- Useful
Strength of evidence:
Compelling: Evidence that features methods, data and analyses more rigorous than the current state-of-the-art
- Exceptional
- Compelling
- Convincing
- Solid
- Incomplete
- Inadequate
During the peer-review process the editor and reviewers write an eLife Assessment that summarises the significance of the findings reported in the article (on a scale ranging from landmark to useful) and the strength of the evidence (on a scale ranging from exceptional to inadequate). Learn more about eLife Assessments
Abstract
Mature neocortical pyramidal cells functionally express two sodium channel (NaV) isoforms: NaV1.2 and NaV1.6. These isoforms are differentially localized to pyramidal cell compartments, and as such are thought to contribute to different aspects of neuronal excitability. But determining their precise roles in pyramidal cell excitability has been hampered by a lack of tools that allow for selective, acute block of each isoform individually. Here, we leveraged aryl sulfonamide-based molecule (ASC) inhibitors of NaV channels that exhibit state-dependent block of both NaV1.2 and NaV1.6, along with knock-in mice with changes in NaV1.2 or NaV1.6 structure that prevents ASC binding. This allowed for acute, potent, and reversible block of individual isoforms that permitted dissection of the unique contributions of NaV1.2 and NaV1.6 in pyramidal cell excitability. Remarkably, block of each isoform had contrasting—and in some situations, opposing—effects on neuronal action potential output, with NaV1.6 block decreasing and NaV1.2 block increasing output. Thus, NaV isoforms have unique roles in regulating different aspects of pyramidal cell excitability, and our work may help guide the development of therapeutics designed to temper hyperexcitability through selective NaV isoform blockade.
Introduction
Voltage-gated sodium channels (NaV) are critical for all aspects of neuronal excitability, from action potential (AP) initiation to axonal propagation, transmitter release, and dendritic excitability (Meeks and Mennerick, 2007; Shu et al., 2007; Palmer and Stuart, 2006; Spratt et al., 2021; Spratt et al., 2019; Nelson et al., 2024). In mature neocortical pyramidal cells, electrogenesis and subsequent propagation of APs is systematically regulated with NaV recruitment first initiated in the axon initial segment (AIS), with forward propagation along the axon and backpropagation into soma and dendrites (Shu et al., 2007; Palmer and Stuart, 2006; Baranauskas et al., 2013). This coordinated process is supported by membrane expression of the NaV isoforms NaV1.6 and NaV1.2. Current models, based on immunostaining of channels and empirical measurements of excitability, suggest that NaV1.2 and NaV1.6 are differentially expressed across neurites. In the AIS, NaV1.6 predominates, with the highest membrane density in the AP initiation region of the AIS most distal to the soma. NaV1.2, by contrast, has higher relative membrane density in the proximal AIS (Shu et al., 2007; Hu et al., 2009; Tian et al., 2014; Ye et al., 2018; Yu et al., 2008; Jenkins and Bender, 2025). Along the axon, NaV1.6 appears enriched at nodes of Ranvier and terminals (Caldwell et al., 2000; Kaplan et al., 2001). Somatodendritic densities are far lower, and current models suggest that the somatic and perisomatic membrane expresses equal levels of NaV1.6 and NaV1.2, whereas dendritic regions more distal to the soma are enriched exclusively with NaV1.2 (Spratt et al., 2021; Spratt et al., 2019; Nelson et al., 2024; Fleidervish et al., 2010). Thus, each channel isoform likely has a unique role in AP initiation and propagation simply based on their differential distribution in neuronal compartments.
To date, efforts to understand the unique contributions of different NaV isoforms have relied largely on experiments in which channel genetic expression has been manipulated, either through constitutive or conditional knockout approaches. While these approaches have strong merit, interpretation is complicated by compensatory changes in other NaV isoforms or other ion channel classes (Spratt et al., 2021; Spratt et al., 2019; Katz et al., 2018; Zhang et al., 2021). Pharmacological approaches, which are both acute and reversible, would be preferred, but identifying highly selective compounds that target particular NaV isoforms is difficult, as ScnXa gene family isoforms have high degrees of amino acid sequence homology. Some compounds exhibit high potency, but differences in the half-maximal inhibitory concentration (IC50) for individual isoforms can be limited (Ragsdale and Avoli, 1998; Denomme et al., 2020; Bosmans et al., 2006; Filipis et al., 2023). This is especially true for the separation of NaV1.2 from NaV1.6, as these two channels have especially high sequence similarity (Catterall et al., 2005; de Lera Ruiz and Kraus, 2015).
Aryl sulfonamide compounds (ASCs) constitute a unique class of NaV inhibitors that potently bind activated NaV isoforms, resulting in a stabilization of the inactivated state (Ahuja et al., 2015; Goodchild et al., 2024; Johnson et al., 2024; Johnson et al., 2022; Roecker et al., 2017). The binding pocket is shielded from ASCs when channels are closed due to the positioning of the S4 voltage sensing domain, but is bound rapidly by ASMs when exposed. Unbinding is promoted by strong hyperpolarization, but occurs much more slowly at physiological voltages (e.g., tau of 102–103 s at –80 and –40 mV, respectively) (Ahuja et al., 2015). In spiking neurons, this essentially imparts use dependence to ASC block (Ahuja et al., 2015), as the probability of channel block will increase in proportion with AP rates.
ASCs exhibit high potency for a subset of NaV isoforms: NaV1.2, NaV1.6, and NaV1.7 (Ahuja et al., 2015; Goodchild et al., 2024; Johnson et al., 2024; Johnson et al., 2022). These isoforms share sequence homology at the binding pocket, each containing a tyrosine–tryptophan (YW) motif that helps stabilize ASC binding. By contrast, NaV1.1 and NaV1.3 harbor a serine–arginine (SR) sequence at the same site. Mutagenesis of NaV1.7 from YW to SR results in a 145-fold decrease in ASC binding without affecting channel biophysical properties (Ahuja et al., 2015). Here, we engaged a similar strategy for NaV1.2 and NaV1.6, using knock-in mice with YW→SR substitutions in either or both channels. This allows for selective, potent ASC-mediated block of YW-containing channels while preserving the function of SR-containing channels. With these tools, we dissected the individual roles of NaV1.2 and NaV1.6 in neocortical pyramidal cell excitability. We found that NaV1.2 and NaV1.6 have unique—and at times conflicting—effects on overall AP excitability. Moreover, results suggest that ASCs can function as ‘on-demand’ pharmacological inhibitors that help normalize cellular excitability in seizure-like conditions. Together, this work highlights the importance of distinct NaV isoforms localized to specific cellular domains and their respective contribution to AP properties to help facilitate activity across pyramidal neurons.
Methods
Key resources table
| Reagent type (species) or resource | Designation | Source or reference | Identifiers | Additional information |
|---|---|---|---|---|
| Gene (Homo sapiens) | Scn2a Human tagged ORF clone | Origene | NM_021007 | NaV1.2 |
| Gene (Homo sapiens) | Scn8a Human tagged ORF clone | Origene | NM_014191 | NaV1.6 |
| Strain, strain background (Mus musculus, both sexes) | C57BL/6J | Jackson Laboratory | RRID:IMSR_JAX:000664 | Wildtype mice |
| Strain, strain background (Mus musculus, both sexes) | C57BL/6N | Janvier Labs | RRID:IMSR_RJ:C57BL-6NRJ | Mating with founders |
| Strain, strain background (Mus musculus, both sexes) | Scn8a YW→SR KI | Genentech; Deng et al., 2023; PMID:37352856 | N/A | NaV1.6 GNE-4076 insensitive mice |
| Strain, strain background (Mus musculus, both sexes) | Scn2a YW→SR KI | Genentech; this manuscript | N/A | NaV1.2 GNE-4076 insensitive mice |
| Strain, strain background (Mus musculus, both sexes) | Dual Scn8a/2a YW→SR KI | Genentech; this manuscript | N/A | Both GNE-4076 insensitive |
| Cell line (Homo sapiens) | HEK293T | ATCC CRL-3216 | RRID:CVCL_0063 | IC50 curves; biophysics |
| Cell line (Mus musculus) | ND7/23 (low NaV) | Al George Lab; Vanoye et al., 2024 | PMID:38771640 | IC50 curves; biophysics |
| Recombinant DNA reagent | pIR-CMV-SCN2A-Variant-1-IRES-mScarlet | Addgene | RRID:Addgene_162279 | NaV1.2 Plasmid #162279 |
| Recombinant DNA reagent | pcDNA4TO-SCN8A-Variant-3-IRES-mScarlet | Addgene | RRID:Addgene_209411 | NaV1.6 Plasmid #209411 |
| Sequence-based reagent | 2A_Y1564S_W1565R F | This paper | PCR primers | ATTCTGTCC CGGATTAAT CTGGTGTTT ATTGTTCT |
| Sequence-based reagent | 2A_Y1564S_W1565R R | This paper | PCR primers | AGATTAATC CGGGACAG AATGTTTGT CATTTCTTGA |
| Sequence-based reagent | 8A_Y1555S_W1556R F | This paper | PCR primers | CATCCTCTC CCGGATTAA CCTGGTGTT TGTT |
| Sequence-based reagent | 8A_Y1555S_W1556R R | This paper | PCR primers | GGTTAATCC GGGAGAGG ATGTTCTCC ATCTG |
| Chemical compound, drug | GNE-4076 or Compound 5 | Merck & Co, Inc; Roecker et al., 2017 | PMID:28389149 | Used at 200 nM |
| Software, algorithm | IGOR Pro v6.3 & v9 | Wavemetrics | RRID:SCR_000325 | N/A |
| Software, algorithm | Prism 10 | GraphPad | RRID:SCR_002798 | N/A |
| Software, algorithm | NEURON Compartmental Models | modelDB | RRID:SCR_007271 and SCR_003105 | https://modeldb.science/2019342 |
| Software, algorithm | Python | https://www.python.org/ | RRID:SCR_008394 | N/A |
| Software, algorithm | Benchling | https://www.benchling.com/ | RRID:SCR_013955 | N/A |
Experimental models and subjects details
Mouse strains
All animal procedures are in accordance with the Institutional Animal Care and Use Committee (IACUC) guidelines in accordance with the University of California, San Francisco (UCSF). The following mouse strains were used in this study: C57BL/6J, YW→SR NaV1.2 KI (Scn2aSR/SR), YW→SR NaV1.6 KI (Scn8aSR/SR), and YW→SR dual KI (Scn8a/2aSR/SR). All experimental procedures were performed on mice maintained in-house on a 12:12 hr light–dark cycle under standard conditions with ad libitum access to food and water. For genotyping, genomic DNA was isolated from tail clip biopsies for PCR. Both male and female mice aged postnatal day (P)18–59 were used across all genotypes. C57BL/6J mice were obtained from Jackson Laboratories, and YW→SR KI mice were developed by the Hackos Lab (Genentech).
Generation of SCN8A or SCN2A YW→SR KI mouse
As described previously (Deng et al., 2023), CRISPR/Cas9 technology (Cong et al., 2013; Mali et al., 2013) was used to generate a genetically modified mouse strain with either an Scn8a or Scn2a YW→SR knock-in mutation. A single-guide RNA (sgRNA) target and protospacer adjacent motifs (PAM) were identified for Scn8a ENSMUSG00000023033 or Scn2a ENSMUSG00000075318 genomic regions of interest using the CRISPR design tool (Benchling) that uses the algorithm described by Hsu et al., 2013 to provide ‘MIT’ specificity scores for each sgRNA, as well as the top 15 predicted off-target loci and corresponding MIT off-target scores. The same guide target and PAM were used for both genes. Guide target: 5′ CATTCTCTACTGGATTAATC 3′; PAM: TGG with an algorithm score of 42.3.
For the YW→SR mutation on the Scn8a gene, predicted cut sites are between 100,933,463–100,933,464 genome coordinates. The following oligonucleotide donor sequence was used: 5′ ATGCTTATCTGCCTTAACATGGTGACCATGATGGTGGAGACAGACACACAGAGCAAGCAGATGGAGAACATTCTCTCTCGGATTAATCTGGTCTTCGTCATCTTCTTCACCTGCGAGTGTGTGCTCAAAATGTTTGCCTTGAGACACTACTATTTC 3′. The first point mutation of Y1553S (TAC→TCT) is located at 100,933,454–100,933,456 genome coordinates, and a second point mutation of W1554R (TGG→CGG) is located at 100,933,457–100,933,459 genome coordinates.
For the YW→SR mutation on the Scn2a gene, predicted cut sites are between 166,900 and 166,901 genome coordinates. The following oligonucleotide donor sequence was used: 5′ GAAATAGTAGTGTCTCAAGGCAAACATTTTGAGCACACACTCGCAGGTGAAGAAGATGACGAAGACCAGGTTGATCCGAGAGAGAATGTTCTCCATCTGCTTGCTCTGTGTGTCTGTCTCCACCATCATGGTCACCATGTTAAGGCAGATAAGCAT 3′. The first point mutation of Y1553S (TAC→TCT) is located at 101,035,573–101,035,575 genome coordinates, and a second point mutation of W1554R (TGG→CGG) is located at 101,035,576–101,035,578 genome coordinates. Additionally, two silent mutations were created in the beginning of the gRNA to prevent Cas9 from cutting the donor oligo. The first silent mutation (ATT→ATC) is located at 101,035,579–101,035,581 genome coordinates, and the second silent mutation (AAT→AAC) 101,035,582–101,035,584 genome coordinates.
After homology-directed repair of Cas9-induced chromosome breaks with the oligonucleotide donor, the YW→SR protein will be expressed. Once an sgRNA decision was finalized, the off-target list was used to identify the top 15, and next-generation sequencing (NGS) amplicon primers were designed for the on-target locus, and each of the off-target synthetic guide RNAs was obtained from Synthego. CAS9 protein was obtained from PROTEIN SOURCE and complexed with sgRNA before microinjection. Reagent concentrations for microinjection were as follows: 25 ng/µl Cas9 mRNA (Thermo Fisher; A29378) + 13 ng/µl sgRNA (Synthego), Oligonucleotide donor (50 ng/µl) (IDT).
After zygote microinjection and embryo transfer, genomic DNA was prepared from tail tip biopsies of potential G0 founders, and G0 animals were first analyzed by droplet digital PCR (Hindson et al., 2011) (Bio-Rad). Primers were used to amplify the HDR event (ON Target) and the 15 most likely off-target sites. Only G0 mosaic founders positive for the intended mutation were screened by targeted amplicon NGS. Amplicons were submitted for NGS analysis.
Founders were selected for mating with wildtype C57BL/6N mice for germline transmission of the gene-edited chromosome. Subsequent analysis of genomic DNA from G1 pups was used to confirm germline transmission of the targeted gene and the absence of off-target hits elsewhere in the genome.
To generate the dual Scn8a/2aSR/SR line, Scn2aSR/SR, and Scn8aSR/SR mice were crossed, and analysis of genomic DNA was used to confirm germline transmission of the targeted gene.
Method details
Synthesis of GNE4076
GNE-4076 was synthesized as previously described in Roecker et al., 2017, and is Compound 5 in the original manuscript. We use GNE-4076 throughout this manuscript.
Generation of SCN2A YW→SR and SCN8A YW→SR constructs
The double mutation Y1564S/W1565R was introduced into the adult splice isoform of recombinant human NaV1.2 (NCBI accession number NM_021007; AddGene #162279) using site-directed mutagenesis as previously described (Thompson et al., 2023). The corresponding mutations (Y1555S/W15556R) were engineered in recombinant human NaV1.6 (adult isoform) as previously described (Vanoye et al., 2024). Mutagenic primer sequences are presented in Table 1. All plasmids were nanopore sequenced (Primoridium Labs, Arcadia, CA) to confirm the variants and exclude unwanted mutations.
Table 1
Mutagenic primer sequences for NaV1.2 and NaV1.6.
| Primer name | Sequence (5′ to 3′) |
|---|---|
| 2A_Y1564S_W1565R_F | attctgtCcCggattaatctggtgtttattgttct |
| 2A_Y1564S_W1565R_R | agattaatccGgGacagaatgtttgtcatttcttga |
| 8A_Y1555S_W1556R_F | catcctctCcCggattaacctggtgtttgtt |
| 8A_Y1555S_W1556R_R | ggttaatccGgGagaggatgttctccatctg |
Electrophysiology in immortalized cell lines
HEK293T cells were transiently transfected with WT or mutant NaV1.2 using the Invitrogen Lipofectamine LTX kit, whereas NaV1.6 plasmids were electroporated into the LoNaV derivative of ND7/23 cells using Maxcyte technology as previously described (Vanoye et al., 2024). HEK293T cells were acquired from ATCC (CRL-3216) where mycoplasma testing shows no detection of contamination. LoNaV derivative of ND7/23 cells is a mix of rat dorsal root ganglion neurons and mouse neuroblastomas that have been modified and previously validated by Al George’s Lab as described in Vanoye et al., 2024. These cells were not generated from the original source of the parental line ND7/23; therefore, we are unable to authenticate with ATCC. LoNaV ND7/23 cells have been tested for mycoplasma and show no detection of contamination.
NaV channel currents were recorded from HEK293 or ND7/23 cells via whole-cell patch clamp using a Molecular Devices Axopatch 200B amplifier. The recording pipet intracellular solution contained (in mM): 120 CsF, 10 NaCl, 2 MgCl2, 10 HEPES, adjusted to pH 7.2 with CsOH. The extracellular recording solution contained (in mM): 155 NaCl, 3 KCl, 1 MgCl2, 1.5 CaCl2, 10 HEPES, adjusted to pH 7.4 with NaOH. Currents were recorded at a 20-kHz sampling frequency and filtered at 5 kHz. Series resistance compensation was applied at 80%. Solutions containing GNE-4076 were applied using a Fluicell Dynaflow perfusion system.
We characterized dose–response curves in both WT and mutant NaV1.2 and NaV1.6 channels by pulsing cells from –80 to –12 mV for 20 ms at a rate of 0.5 Hz to establish a baseline current. Cells were then perfused with GNE-4076 starting at 30 nM and increased up to 100 μM. To allow adequate GNE-4076 onboarding to NaV isoforms/mutants at each successive dose, cells were depolarized to –12 mV for 10 s followed by similar test pulses used to acquire baseline current. Between dose increases, cells were held at –80 mV to allow adequate unbinding of GNE-4076.
We also characterized the activation and steady-state inactivation properties of both WT and mutant NaV1.2 and NaV1.6 channels. To measure activation, we used a holding voltage of –80 mV, a short 20ms pre-pulse to –120 mV, and a 30-ms pulse to voltages ranging from –100 to –20 mV in steps of 5 mV at a rate of once per 3 s. P/4 leak subtraction was used to reduce leak currents. The peaks of the resulting NaV currents were measured. Conductance was calculated using the equation: G = I/(V – VNa), normalized, and plotted as a function of voltage. To measure inactivation, we started at a holding voltage of –120 mV to bring the channels fully into the closed state (about 1 min). We then pulsed to –12 mV while reducing the holding voltage from –120 to +30 mV in steps of 5 mV at a rate of once per 5 s. The peaks of the resulting NaV currents were measured, normalized, and plotted as a function of voltage. To quantify these biophysical properties, we fit the activation and inactivation curves to the following Boltzmann equations:
V1/2 is the voltage where half-maximal peak conductance (or current) was observed, and sf is the slope factor.
Ex vivo electrophysiology
Mice aged P18–P59 were anesthetized with isoflurane prior to harvesting the brain. Dissected brains were immediately placed in cutting solution (4°C) containing 87 mM NaCl, 25 mM NaHCO3, 25 mM glucose, 75 mM sucrose, 2.5 mM KCl, 1.25 mM NaH2PO4, 0.5 mM CaCl2, and 7 mM MgCl2 that is bubbled with 5% CO2/95% O2. Coronal slices were prepared from the medial prefrontal cortex (PFC) at a thickness of 250 µm and placed in a holding chamber warmed to 33°C for 30 min. Slices were then allowed to recover at room temperature until recording. Recordings were performed at 31–33°C in a solution containing 125 mM NaCl, 2.5 mM KCl, 2 mM CaCl2, 1 mM MgCl2, 25 mM NaHCO3, 1.25 mM NaH2PO4, and 25 mM glucose that is bubbled with 5% CO2/95% O2. Osmolarity of the recording solution was adjusted to approximately 309 mOsm.
Neurons were identified using differential interference contrast optics for conventional visually guided whole-cell recordings. For current-clamp experiments, pipettes were pulled from Schott 8250 glass, with a tip resistance of 3–4 MΩ, and filled with a K-gluconate-based internal solution containing 113 mM K-gluconate, 9 mM HEPES, 4.5 mM MgCl2, 0.1 mM EGTA, 14 mM Tris2-phosphocreatine, 4 mM Na2-ATP, 0.3 mM Tris-GTP; 290 mOsm; pH 7.2–7.25. All data were corrected for measured junction potentials of 12 mV.
All electrophysiology data were acquired through custom protocols generated in IgorPro (Wavemetrics) via Multiclamp 700A or 700B amplifiers (Molecular Devices). AP waveform measurements were acquired at 50 kHz and low-pass Bessel filtered at 20 kHz for all experiments except for data presented in Figure 6 (acquired at 10 kHz and filtered at 3 kHz). Pipette capacitance was compensated in all current-clamp recordings to 50% of the fast capacitance measured after membrane seals were established in voltage clamp. The bridge was balanced, and series resistance was kept <18 MΩ in all recordings. Any cells with input resistance changes exceeding ±15% were omitted from the dataset. A quartz electrode holder (Sutter Instrument) was used to collect all recordings to minimize physical drift of recording electrodes.
All recordings were made from medial PFC layer 5b, thick-tufted pyramidal tract (PT) neurons. Pyramidal neuron identity was confirmed by assessing membrane responses to hyperpolarizing current (–400 pA, 120 ms), with PT neurons defined as those that exhibit membrane depolarization overshoot that peaks within 90 ms of current step offset (Clarkson et al., 2017). AP threshold, AIS dV/dt and peak dV/dt measurements were determined from either the first AP or all APs within a spike train evoked by a stimulus. AP threshold was defined as the membrane potential (Vm) when the AP velocity (dV/dt) exceeds 15 V/s. Somatic peak (V/s) was defined as the max value in the first derivative (dV/dt) of an AP. AIS max (V/s) was defined as the trough or saddle point in the second derivative (d2V/dt2) that occurs during the depolarizing phase of an AP before the somatic peak (Favero et al., 2018). AIS inflection point was defined as the peak of the second derivative (d2V/dt2) that occurs prior to the AIS max or somatic peak. Frequency was defined as the spike number in a train elicited per second (spikes/s or Hz). Afterhyperpolarization was defined as the minimum voltage between two spikes in a train.
Spike trains were evoked by injecting current (250–350 pA, 10 s or 300 ms duration) in the presence or absence of 200 nM GNE-4076. In recovery experiments, neurons were held at –12 mV for 30 s (voltage clamp) to depolarize cells, activate NaV channels, and expose the ASC binding pocket to maximize GNE-4076 onboarding and NaV inhibition. The interstimulus interval given during the recovery period was as follows: 2 s, ~20–30 s duration; 5 s, ~30–45 s duration; 15 s, ~60–90 s duration; 30 s, ~120–180 s duration; and 60 s, ~60–240 s duration. In experiments mimicking cellular activity, a post-synaptic potential train was randomly generated using a Poisson probability distribution function for 60 s with a frequency of 50 Hz and amplitude standard deviation of 200 pA.
For nucleated patch voltage-clamp experiments, recordings were made at 31–33°C in a solution containing 125 mM NaCl, 2.5 mM KCl, 2 mM CaCl2, 1 mM MgCl2, 25 mM NaHCO3, 1.25 mM NaH2PO4, 15 mM glucose, 4 mM TEA, 1 mM 4-AP, and 10 µM nifedipine, with or without 200 nM GNE-4076, (bubbled with 5% CO2/95% O2). A Cs-methanesulfonate-based recording solution was used: 110 mM CsMeSO3, 40 mM HEPES, 1 mM KCl, 4 mM NaCl, 4 mM Mg-ATP, 10 mM Na-phosphocreatine, 0.4 mM Na2-GTP, and 0.1 mM EGTA; 290 mOsm; pH 7.2–7.25. Whole-cell recordings were established before withdrawing pipettes from the slice, pulling a region of the somatic membrane with the pipette. Neurons were held to –80 mV and stepped to –12 mV every 2 s, 5–10 times. Then neurons were held to –12 mV for 10 s to onboard GNE-4076, then returned to –80 mV and probed for NaV recovery with steps to –12 mV every 2 s. Leak currents were subtracted with a P/8 protocol using steps from –80 to –90 mV. All data were corrected for measured junction potentials of 12 mV.
Compartmental modeling
A compartmental model was constructed within the NEURON environment to simulate a layer 5 pyramidal neuron as described before (Spratt et al., 2021; Hallermann et al., 2012; Quinn et al., 2024). This model is available at ModelDB (2019342, https://modeldb.science/2019342). A multi-compartmental model, originally developed by the Blue Brain Project, was implemented to reflect the morphology detailed by Ramaswamy and Markram, 2015 and electrophysiological features were adjusted to reflect empirically obtained data (Spratt et al., 2021; Hallermann et al., 2012). We modified the model by replacing the aggregated sodium conductances (NaT and NaP) with distinct NaV1.2 and NaV1.6 channels to match empirically observed distributions (Hu et al., 2009). NaV1.2 and NaV1.6 channels were distributed throughout the cell with equal levels in the soma and 20 µm of the proximal dendrites. NaV1.2 was solely expressed in dendrites more distal to the soma, inferred based on AP-evoked sodium imaging observations in Scn2a+/− conditions (Nelson et al., 2024). The two axonal compartments were subdivided into an AIS and distal axon. Within the AIS, NaV1.2 and NaV1.6 were distributed with increased NaV1.2 in the proximal AIS and increased NaV1.6 in the distal AIS to recapitulate the channel distribution as previously observed empirically (Hu et al., 2009). NaV1.2 was not included in the distal AIS or axon where only NaV1.6 is present, including an enriched region to model a node of Ranvier. To simulate blocking of NaV1.2 and NaV1.6, each channel’s density was globally reduced in 10% increments from 100% to 0%. Both NaV1.2 and NaV1.6 channels were represented using the Hodgkin-Huxley formalism (Hodgkin and Huxley, 1952). Parameter optimization for both channels was conducted using an evolutionary algorithm from BluePyOpt (Van Geit et al., 2016) and adapted for use with the computational resources at the National Energy Research Computing Center similar to Ladd et al., 2022.
To validate parameter sensitivity, we constructed multiple variations of our model with different distributions of NaV1.2 and NaV1.6 in the AIS. The crossover point at which the NaV1.2 and NaV1.6 distribution curves intersect was shifted distally in increments of 3.75 µm to make five variations of the AIS with increasing density of NaV1.2. With the wildtype crossover point located 15 µm distal to the soma, the five right-shifted variations have crossover points at 18.75, 22.5, 26.25, 30, and 33.75 µm, respectively. Two variations of the AIS with increased NaV1.6 density were created by shifting the crossover point proximally in 3.75 µm increments to 11.25 and 7.5 µm. To see how our model would behave with different AIS sodium channel distributions, we varied the ratio of NaV1.2: NaV1.6 density in the whole cell to test different conditions at each AIS crossover point and measured the resulting threshold, AIS peak, and somatic peak of the phase plane plot. NaV1.2 percentage was decreased from 90% to 0% in 10% increments as NaV1.6 percentage was concurrently increased from 10% to 100% in 10% increments. The NaV1.2: NaV1.6 ratio of 100%:0% did not produce any APs and was therefore not included in the analysis. In instances where the somatic portion of the phase plane was not a true peak that consisted of adjacent values less than a local maxima, the prominence was estimated by taking the index of the second derivative value closest to zero and calculating the dV/dt value at that index.
Quantification and statistical analysis
Data are reported as absolute values or the absolute difference from baseline (delta, Δ). For Δ values, data were normalized either to the initial 500 ms of the stimulus (Figures 2 and 3) or baseline spiking (Figures 4 and 5). Time course graphs are represented as a mean ± standard error. Summary graphs are represented with box plots showing the median, quartiles, and 90% tails or with violin plots. All summary graphs overlay individual datapoints and represent recordings from single cells (reported n) for all electrophysiology experiments. Data were obtained from 5 to 9 animals (both sexes) per condition, which are standard group sample sizes used in the field. Group sizes were determined based on sample sizes previously used for similar studies. Power analysis was not required for this study. No attrition applies to our study, and all data collected is included. Analysis was performed blind to genotype ± drug. Statistical analysis was performed using Prism 10 (GraphPad Software). Quantified mean ± standard error and statistical test used is noted in figure legends. Significance was set at an alpha value of 0.05, and ‘ns’ indicates no significance.
Results
Aryl sulfonamides selectively bind and inhibit NaV isoforms containing the YW motif
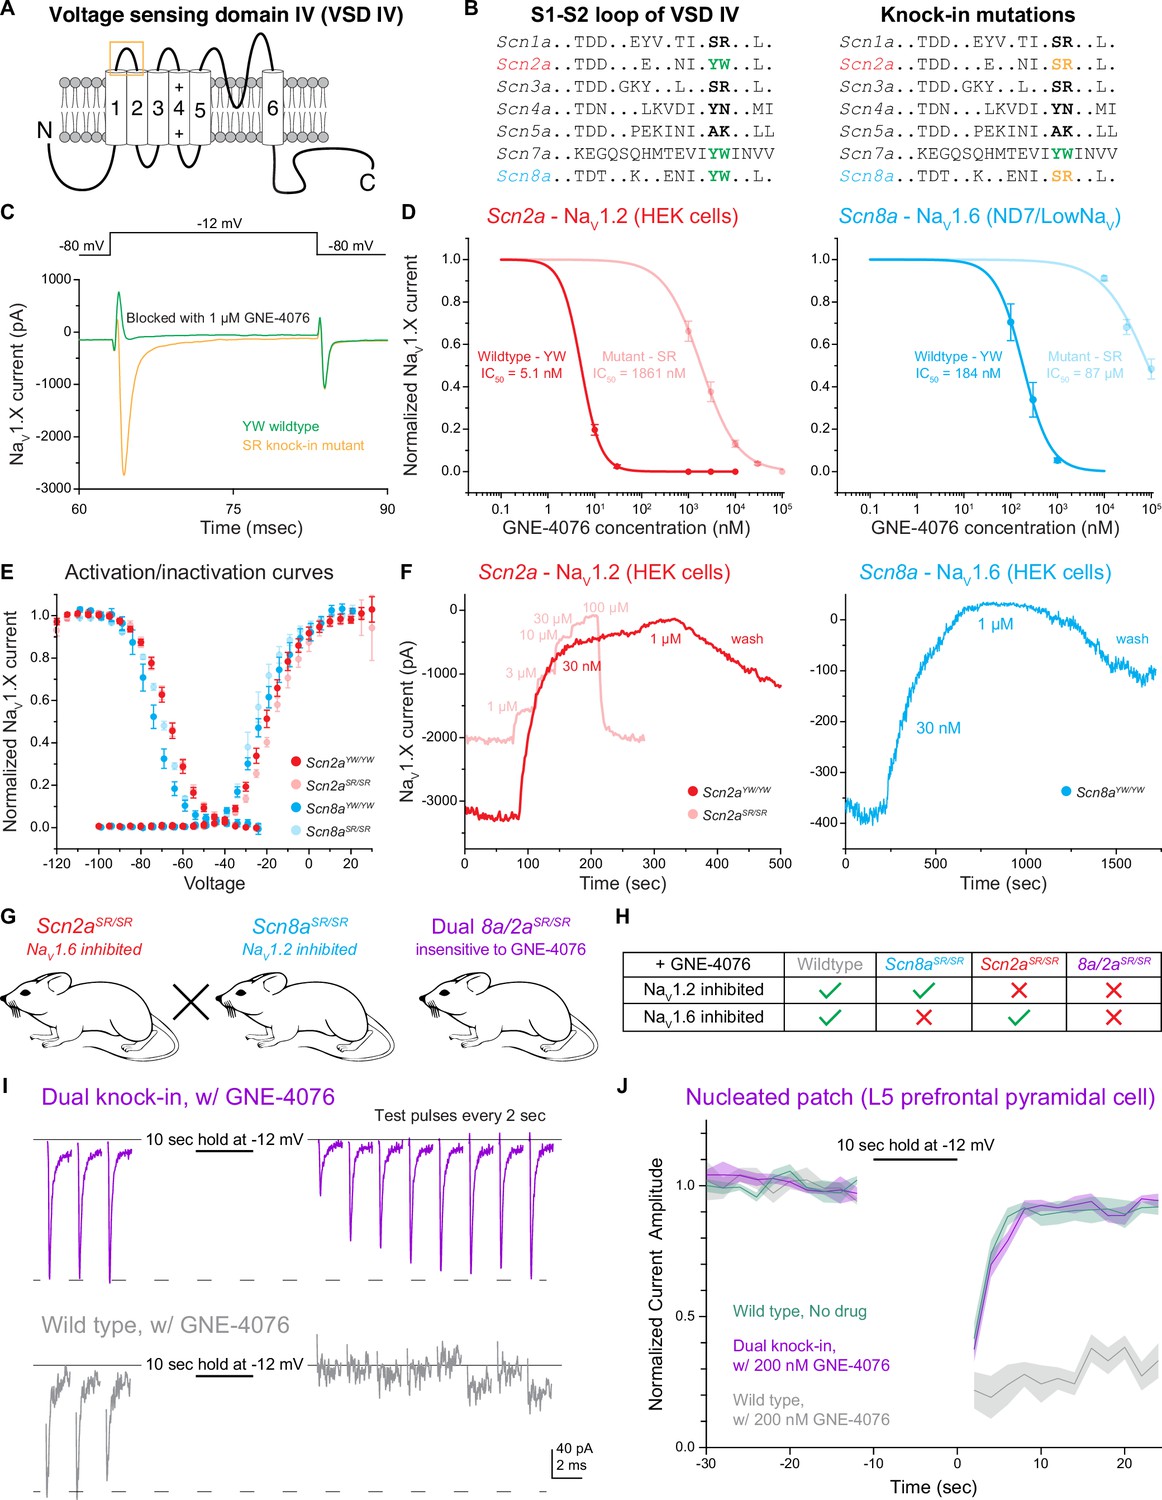
ASCs exhibit high affinity for an extracellular region within voltage sensing domain IV (VSD IV) of select NaV channels with a conserved tyrosine–tryptophan (YW) motif (Ahuja et al., 2015; Figure 1A and B). This YW motif found on NaV1.2, NaV1.6, and NaV1.7 allows for ASC stabilization following channel inactivation (Figure 1B). By contrast, an SR motif present in NaV1.1 and NaV1.3 limits binding appreciably (Ahuja et al., 2015). Thus, we hypothesized that converting either NaV1.2 or NaV1.6 channels from those that contain the YW motif to those that contain an SR motif would alter ASC binding to those channels significantly.
Figure 1 with 1 supplement see all
The YW motif on NaV1.2 and NaV1.6 increases activity-dependent GNE-4076 potency and subsequent channel inhibition.
(A) Schematic depicting the fourth voltage sensing domain (VSD-IV) of NaV isoforms. The six transmembrane spanning regions have high sequence homology among different NaV isoforms, while linker regions display more sequence divergence. Orange box highlights extracellular S1–S2 loop where aryl sulfonamide compounds (ASCs) are stabilized by a tyrosine–tryptophan (YW) motif. (B) Amino acid sequence within the S1–S2 loop of various NaV isoforms. Scn2a (NaV1.2) and Scn8a (NaV1.6) are the predominant channels expressed in mature, prefrontal pyramidal cells. Both isoforms share a conserved YW sequence that increases ASC potency. Knock-in mutations of Scn2a and Scn8a were generated by substituting the YW motif with a serine–arginine (SR) sequence present in Scn1a and Scn3a. (C) Example NaV current traces (pA) of cells expressing either YW wildtype channels or SR knock-in mutant chimeras in the presence of 1 μM GNE-4076. To activate exogenously expressed NaV channels, cells were held at –80 mV and stepped to –12 mV for 20 ms. GNE-4076 onboarding was performed by holding cells at –12 mV for 10 s. (D) Dose–response curves for exogenously expressed Scn2a (HEK cells) or Scn8a (ND7/LoNaV) in immortalized cell lines. IC50 was measured for both YW wildtype channels and SR knock-in mutant chimeras (Scn2aYW/YW, n = 6; Scn2aSR/SR, n = 7; Scn8aYW/YW, n = 8; Scn8aSR/SR, n = 6). YW→SR knock-in mutations reduced GNE-4076 potency by about 400- to 500-fold relative to wildtype channels. Circles represent normalized mean NaV current amplitude ± SEM. (E) Activation and steady-state inactivation curves for both YW wildtype channels and SR knock-in mutant chimeras. Scn2a or Scn8a YW→SR mutations alter the efficacy of GNE-4076 while having minor effects on biophysical properties of either isoform. Circles represent mean normalized NaV current amplitude ± SEM. Unpaired t-test with Welch’s correction. No significance detected between wildtype and mutant channels for both V1/2 of activation or inactivation. (F) Example current amplitude response graphs for NaV1.2 (red) and NaV1.6 (blue) expressed in HEK cells. Cells were perfused with increasing concentrations of GNE-4076 throughout the recording. Individual current response recordings from HEK cells expressing Scn2a were robust (3.2 nA), and recordings were reproducible for both YW wildtype channels (red) and SR knock-in mutant chimeras (transparent red). Current responses from cells expressing Scn8a were variable, with only a few cells exhibiting channel conductance (400 pA). In select cells expressing Scn8a, current amplitude (blue) also decreases substantially with 30 nM GNE-4076 and completely with 1 μM. (G) Transgenic mouse lines generated with the YW→SR knock-in mutation present on both ScnXa alleles. Scn2aSR/SR mice were crossed with Scn8aSR/SR mice to generate a dual Scn8a/2aSR/SR knock-in mouse. (H) Overview of the various transgenic (or wildtype) mouse lines used throughout this study. Application of 200 nM GNE-4076 selectively inhibits NaV isoforms only containing the YW motif. (I) Nucleated patch experiments from prefrontal pyramidal cells performed in wildtype or dual Scn8a/2aSR/SR knock-in cells in the presence of 200 nM GNE-4076. Baseline conductance was measured by depolarizing cells from –80 to –12 mV every 2 s for 10 pulses. NaV channels were inactivated by holding the nucleated patch at –12 mV for 10 s. Test pulses were again acquired during recovery similar to baseline pulses. (J) Summary graph of normalized current amplitude from nucleated patch experiments in (I). Baseline and recovery test pulses were acquired for at least 20 s before and 25 s after the channel inactivation step. Solid line represents normalized mean NaV current amplitude ± SEM. Graph also includes wildtype, no drug control nucleated patch experiments (wildtype no drug, n = 4; wildtype + GNE-4076, n = 4; Scn8a/2aSR/SR + GNE-4076, n = 4).
-
Figure 1—source data 1
Data values for each experiment described in Figure 1.
- https://cdn.elifesciences.org/articles/105696/elife-105696-fig1-data1-v2.xlsx
To test for the effects of this motif substitution, we first examined currents generated by wildtype and YW→SR mutated channels expressed in immortalized cell lines (Figure 1C). HEK cells were primarily used for most experiments. But due to the known low transfection efficiency of NaV1.6 in HEK cells, a subset of experiments was performed using an ND7/23 cell line engineered to lack most native NaV conductance (ND7/LoNaV) (Vanoye et al., 2024). Both NaV1.2 and NaV1.6 wildtype channels expressed in cell lines were inhibited markedly by 1 μM GNE-4076 (Figure 1C). By contrast, SR knock-in mutants continued to flux sodium in the presence of 1 μM GNE-4076. Dose–response curves revealed an IC50 of 5.1 nM for wildtype NaV1.2 that increases 365-fold to 1861 nM for mutant SR channels (Figure 1D). For NaV1.6 channels, GNE-4076 IC50 increased 475-fold from 184 nM to 87 μM with the SR mutant (Figure 1D). To assess whether SR mutations affect channel gating properties in the absence of GNE-4076 binding, steady-state activation and inactivation curves were assessed for wildtype or mutant channels (Figure 1E). Consistent with prior work studying a similar mutation in NaV1.7 (Ahuja et al., 2015), the YW to SR mutation had no effect on slope factor for both voltage-dependent activation or inactivation for either NaV1.2 or NaV1.6 (Table 2); however, both voltage-dependent activation and inactivation hyperpolarized by approximately 2 mV for NaV1.6, but not NaV1.2.
Table 2
Voltage dependence of activation and inactivation for wildtype and mutant NaV isoforms, related to Figure 1.
| NaV channel | V ½ of activation (mV) | Slope factor | V ½ of inactivation (mV) | Slope factor |
|---|---|---|---|---|
| Scn2aYW/YW or wildtype NaV1.2 (n = 6) | –20.1 ± 2.6 | 6.6 ± 0.5 | –68.3 ± 1.8 | 6.9 ± 0.3 |
| Scn2aSR/SR or mutant NaV1.2 (n = 7) | –18.7 ± 2.1 | 6.4 ± 0.6 | –68.1 ± 0.8 | 7.1 ± 0.5 |
| Scn8aYW/YW or wildtype NaV1.6 (n = 8) | –23.9 ± 2.3 | 6.7 ± 0.4 | –74.6 ± 3.3 | 6.9 ± 0.5 |
| Scn8aSR/SR or mutant NaV1.6 (n = 6) | –26.1 ± 3.2 | 6.5 ± 0.4 | –71.9 ± 1.2 | 7.0 ± 0.3 |
While GNE-4076 binds potently to either NaV1.2 (Figure 1D, F) or NaV1.7 expressed in HEK cells (Roecker et al., 2017), its affinity was lower for NaV1.6 expressed in ND7/LoNaV cells. To test if this was due to reductions in affinity imposed by the ND7/23 cell line, we examined current in the few HEK cells in which NaV1.6 current could be measured (Figure 1F). While peak currents were small (400 pA vs. 3.2 nA for NaV1.2 transfected using identical protocols), we found that 30 nM GNE-4076 exhibited strong block of NaV1.6 (Figure 1F), but due to limitations in expression efficiency in HEK cells, we were unable to collect full dose–response curves to determine IC50.
Results in heterologous expression systems indicate that YW→SR substitution reduces GNE-4076-binding affinity markedly. Given these results, we constructed transgenic mice containing the YW→SR mutation. Two distinct lines, termed Scn8aSR/SR and Scn2aSR/SR, were generated by mutating both alleles of each sodium channel gene (Figure 1G). SR/SR mutations were validated by PCR (see Methods), and mice were bred to be homozygous for the mutations. Comparisons were then made between wildtype mice, mice with YW→SR mutations into NaV1.2 or NaV1.6 alone (2aSR/SR or 8aSR/SR, respectively), or YW→SR mutations in both NaV1.6 and NaV1.2 (dual Scn8a/2aSR/SR). In principle, one could determine a concentration of GNE-4076 in which native channels are blocked potently, sparing SR variant channels (Figure 1H). Thus, these mice should enable selective, acute manipulations of NaV1.2- and NaV1.6-dependent aspects of neuronal excitability using a chemical genetics approach.
Given the disparate binding results in heterologous cell lines, we first tested the effects of a dose that should potently block WT channels but not affect SR variant channels to verify that native channels behave similarly to those expressed in HEK cells. Neocortical pyramidal cell somata are thought to express similar levels of NaV1.2 and NaV1.6 on their membranes (Spratt et al., 2021; Spratt et al., 2019; Hu et al., 2009). Thus, excised patches from this region can provide insight into the block of both isoforms. Acute coronal slices containing mPFC were prepared from WT or Scn8a/2aSR/SR mice, and nucleated patches were excised from layer 5 pyramidal cells. After establishing a stable baseline of NaV-mediated current evoked from a holding voltage of –80 mV, a value comparable to the resting membrane potential studied in later current-clamp experiments, cells were pulsed to –12 mV for 10 s to achieve near-complete block of NaV isoforms, then returned to –80 mV (Figure 1I). In untreated WT conditions, currents recovered to near-baseline levels within 5 s (Figure 1J). A similar quick recovery was observed in cells from Scn8a/2aSR/SR mice in the presence of 200 nM GNE-4076. By contrast, WT neurons exposed to the same dosing were inhibited markedly, with no appreciable recovery within 25 s (Figure 1I, J). Taken together, these results show that the YW to SR mutation reduces ASC binding and inhibition of NaV chimeras both in immortalized cell lines and pyramidal neurons.
We also asked whether neuronal AP properties were affected by these mutations in Scn8a/2aSR/SR mice by assessing both threshold and peak dV/dt in the absence of GNE-4076 (Figure 1—figure supplement 1). Compared to wildtype cells, there were no detectable changes to peak dV/dt in Scn8a/2aSR/SR neurons (Figure 1—figure supplement 1B). However, the AP threshold was hyperpolarized in Scn8a/2aSR/SR neurons, likely due to small changes in the voltage dependence of activation observed for heterologously expressed NaV1.6 (Figure 1—figure supplement 1A, Table 2). Application with GNE-4076 in either wildtype or Scn8a/2aSR/SR neurons had no further effect on threshold or peak dV/dt compared to controls recording in the absence of GNE-4076, suggesting minimal drug binding occurs without marked depolarization or spiking activity (Figure 1—figure supplement 1, Table 3).
Table 3
Neuronal action potential (AP) firing properties at baseline, related to Figures 3 and 4.
| NaV channel | Threshold (mV) | Peak dV/dt (V/s) | Spike # | Last AHP |
|---|---|---|---|---|
| No drug control (n = 12) | –42.53 ± 0.61 | 555.82 ± 17.57 | 5.83 ± 0.41 | –49.47 ± 0.43 |
| Wildtype (n = 11) | –42.41 ± 0.83 | 554.42 ± 14.5 | 5.36 ± 0.36 | –50.04 ± 0.71 |
| Scn8a/2aSR/SR (n = 10) | –44.87 ± 0.47 | 545.11 ± 12.89 | 5.09 ± 0.16 | –51.39 ± 0.5 |
| Scn2aSR/SR (n = 11) | –42.3 ± 0.76 | 520.05 ± 13.51 | 6.09 ± 0.32 | –49.31 ± 0.84 |
| Scn8aSR/SR (n = 11) | –43.87 ± 0.65 | 517.36 ± 21.83 | 5.18 ± 0.55 | –50.46 ± 0.74 |
Differential roles for NaV1.6 and NaV1.2 in AP initiation and somatic excitability
NaV1.2 and NaV1.6 are differentially distributed in neuronal arbors and are thought to contribute to different aspects of AP initiation and propagation. In mature neocortical pyramidal cells, NaV1.6 is enriched in the distal AIS, the site where APs initiate (Spratt et al., 2021; Hu et al., 2009; Katz et al., 2018; Royeck et al., 2008). Following initiation, APs forward propagate along the axon via NaV1.6-enriched nodes of Ranvier, but also backpropagate into the soma through a region enriched with a mix of NaV1.2 and NaV1.6 (Hu et al., 2009). Several studies have sought to identify specific roles for each isoform by conditional deletion of either isoform (Spratt et al., 2021; Katz et al., 2018). Unfortunately, in such conditions, the residual isoform compensates for loss to some degree, making interpretation of individual isoform roles difficult. We therefore leveraged ASC-based blocks to study acute, differential inhibition of NaV isoforms to better understand the individual roles of NaV1.2 and NaV1.6 in AP excitability.
Changes to the AP waveform were visualized with phase plane plots, which plot membrane voltage versus membrane voltage velocity (Figure 2B, Figure 3—figure supplement 1A). Within phase plots, spike threshold appears as a sudden deviation from rest and is defined as the voltage at which voltage velocity (dV/dt) first exceeds 15 V/s (Figure 3—figure supplement 1A, right). Following spike threshold, a neuron’s voltage transits through two components of NaV recruitment, first in the AIS and then in the soma (Baranauskas et al., 2013; Kole and Stuart, 2008). These result in characteristic ‘humps’ in the depolarizing aspect of the phase plot (Shu et al., 2007; Yu et al., 2008). Thus, these different components of the phase plot can aid one’s understanding of effects on specific components of NaV-mediated excitability.
Figure 2 with 1 supplement see all
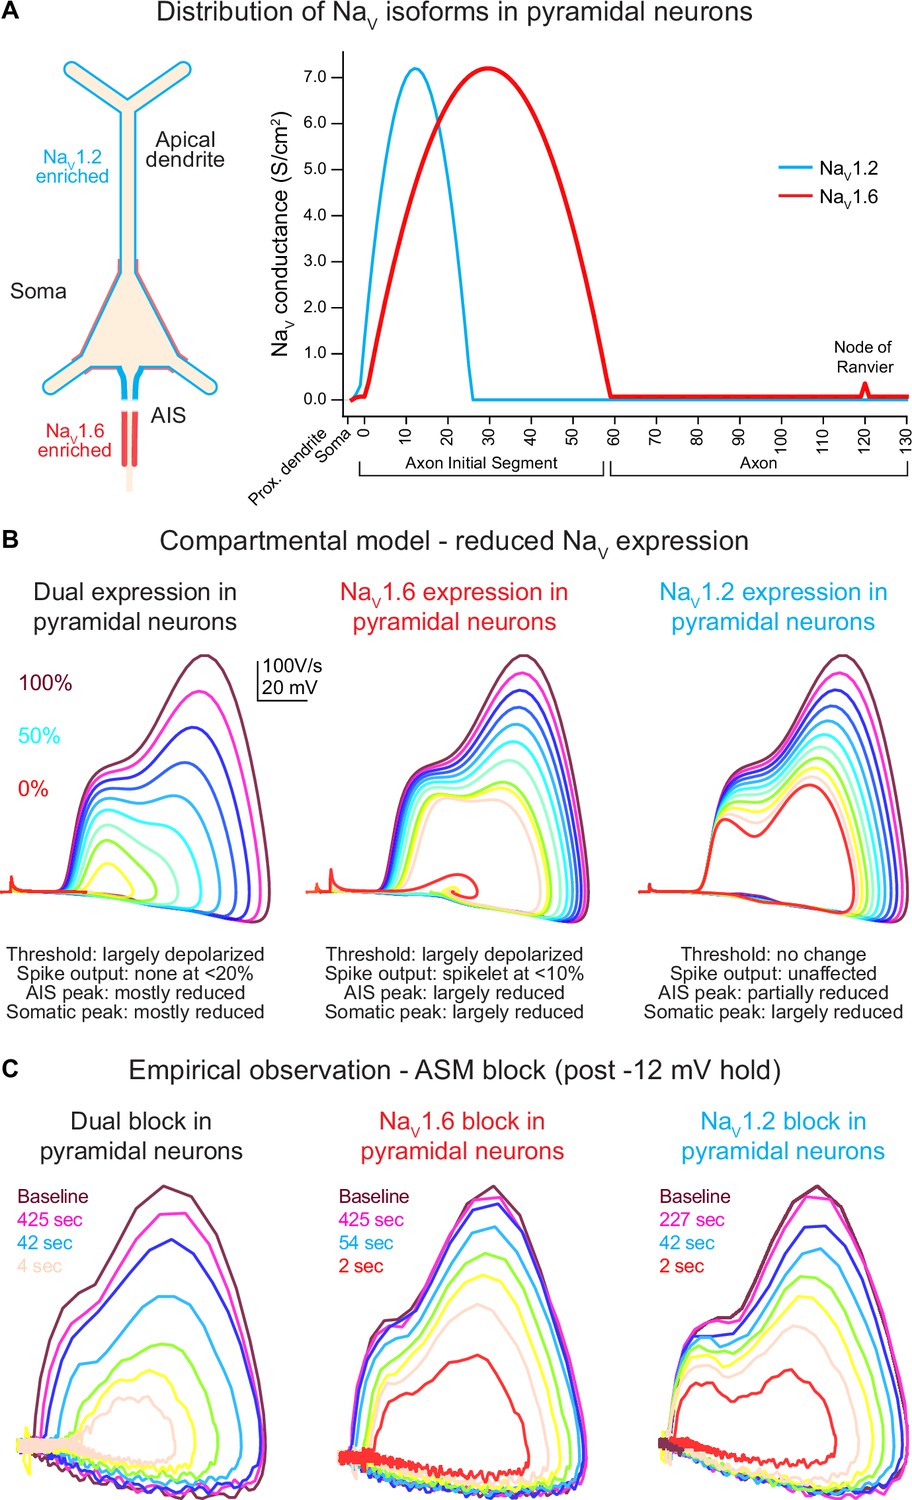
Global Scn2a, Scn8a, or dual loss in compartmental models distinctly impacts key action potential (AP) properties.
(A) NaV1.6 and NaV1.2 are equally expressed in soma and proximal dendrites. Expression pattern is more distinct in other regions with NaV1.6 enriched in the distal axon initial segment (AIS), axon, and nodes of Ranvier, whereas NaV1.2 is found exclusively in the proximal AIS and distal dendrites. (B) Compartmental model representing changes to phase plots when NaV isoform expression is reduced from 100% (warmer colors) to 0% (in 10% increments) based on known localization across distinct neuronal localities. Lower NaV1.6 expression depolarized spike threshold and decreased both AIS and somatic AP velocity (dV/dt). Reduced NaV1.2 expression largely impacts backpropagation and somatic AP velocity. (C) Empirical observations of phase plot following near-complete channel block with ASCs. Darker trace represents phase plot taken at baseline prior to –12 mV hold for 30 s (see Figure 3A). Colored traces represent recovery phase plots at different times post –12 mV hold for 30 s with warmer colors depicting more time lapsed and increased channel recovery.
To provide a priori predictions of potential ASC-based effects on excitability, we constructed a compartmental model in which each channel’s density could be modulated. Channels were distributed based on predictions from empirical anatomical and physiological studies (Spratt et al., 2021; Nelson et al., 2024; Hu et al., 2009; Katz et al., 2018; Kole et al., 2008). NaV1.6 was enriched in the distal AIS, NaV1.2 was enriched in the proximal AIS, both channels were expressed at equal levels in the soma and the first 20 µm of dendrite closest to the soma, and NaV1.2 was expressed exclusively in all other dendrites (Figure 2A). Within this model, each channel’s density was modulated in 10% increments, from 100 to 0% (Figure 2B).
In WT conditions (100% density of both channels), models generated APs with a threshold and AP kinetics comparable to empirical baseline observations (Figure 2B, C). Within this model, reducing NaV1.2 or NaV1.6 density had clear, dissociable effects. Progressive reduction of NaV1.6 produced a progressive depolarization of AP threshold and a corresponding decrement in dV/dt throughout the entire rising phase of the AP. NaV1.2 reduction, by contrast, had no effect on AP threshold or the initial velocity of the AP initiated in the distal AIS. Instead, components of the AP related to backpropagation and recruitment of somatic NaV channels were impaired only, with a decrement in peak dV/dt and peak AP membrane potential. To validate the accuracy of the parameters used in our model, we also performed sensitivity analysis (Figure 2—figure supplement 1). Here, we adjusted the crossover point of NaV1.2 and NaV1.6 within the AIS as well as varied the density ratio of both channels (Figure 2—figure supplement 1A, B). Increasing the NaV1.6 ratio to 100% consistently hyperpolarized AP threshold across all AIS crossover positions (Figure 2—figure supplement 1B, C). However, dV/dt was highly variable and random when either the AIS crossover point is shifted or NaV ratios are altered.
While these models provide clues to the differential roles of NaV1.2 and NaV1.6, we needed to design an experimental strategy that increased the overall degree of NaV blockade using ASCs in mice where either NaV1.6 or NaV1.2 was mutated to be insensitive to 200 nM GNE-4076 binding (Figures 1G and 3A). Since it is nearly impossible to achieve full block with ASCs under physiological firing, we developed a hybrid current- and voltage-clamp experiment to study the effects of more complete isoform blockade (Figure 3B). In this protocol, neurons were held to –80 mV in current clamp with constant bias current (if necessary), and baseline APs were elicited with brief somatic current injection (300 ms, amplitude adjusted to evoke ~4–5 APs). We then promoted NaV activation and inactivation by voltage-clamping neurons to –12 mV for 30 s (Figure 3A). Following voltage-clamp, neurons were returned to current-clamp with the same bias current as used in baseline conditions. We then evoked APs, first at an interstimulus interval of 2 s, then at successively increasing intervals of 5–60 s, allowing for somewhat consistent sampling on a log-base timescale that aligns well with both channel recovery from inactivation and recovery from GNE-4076 block (Figure 3D, F). For clarity and simplicity, we will describe studies based on which channel is inhibited rather than which channel was rendered insensitive to GNE-4076. For example, a study in the Scn2aSR/SR/Scn8a+/+ animal is a case where NaV1.6 can be blocked.
Figure 3 with 2 supplements see all
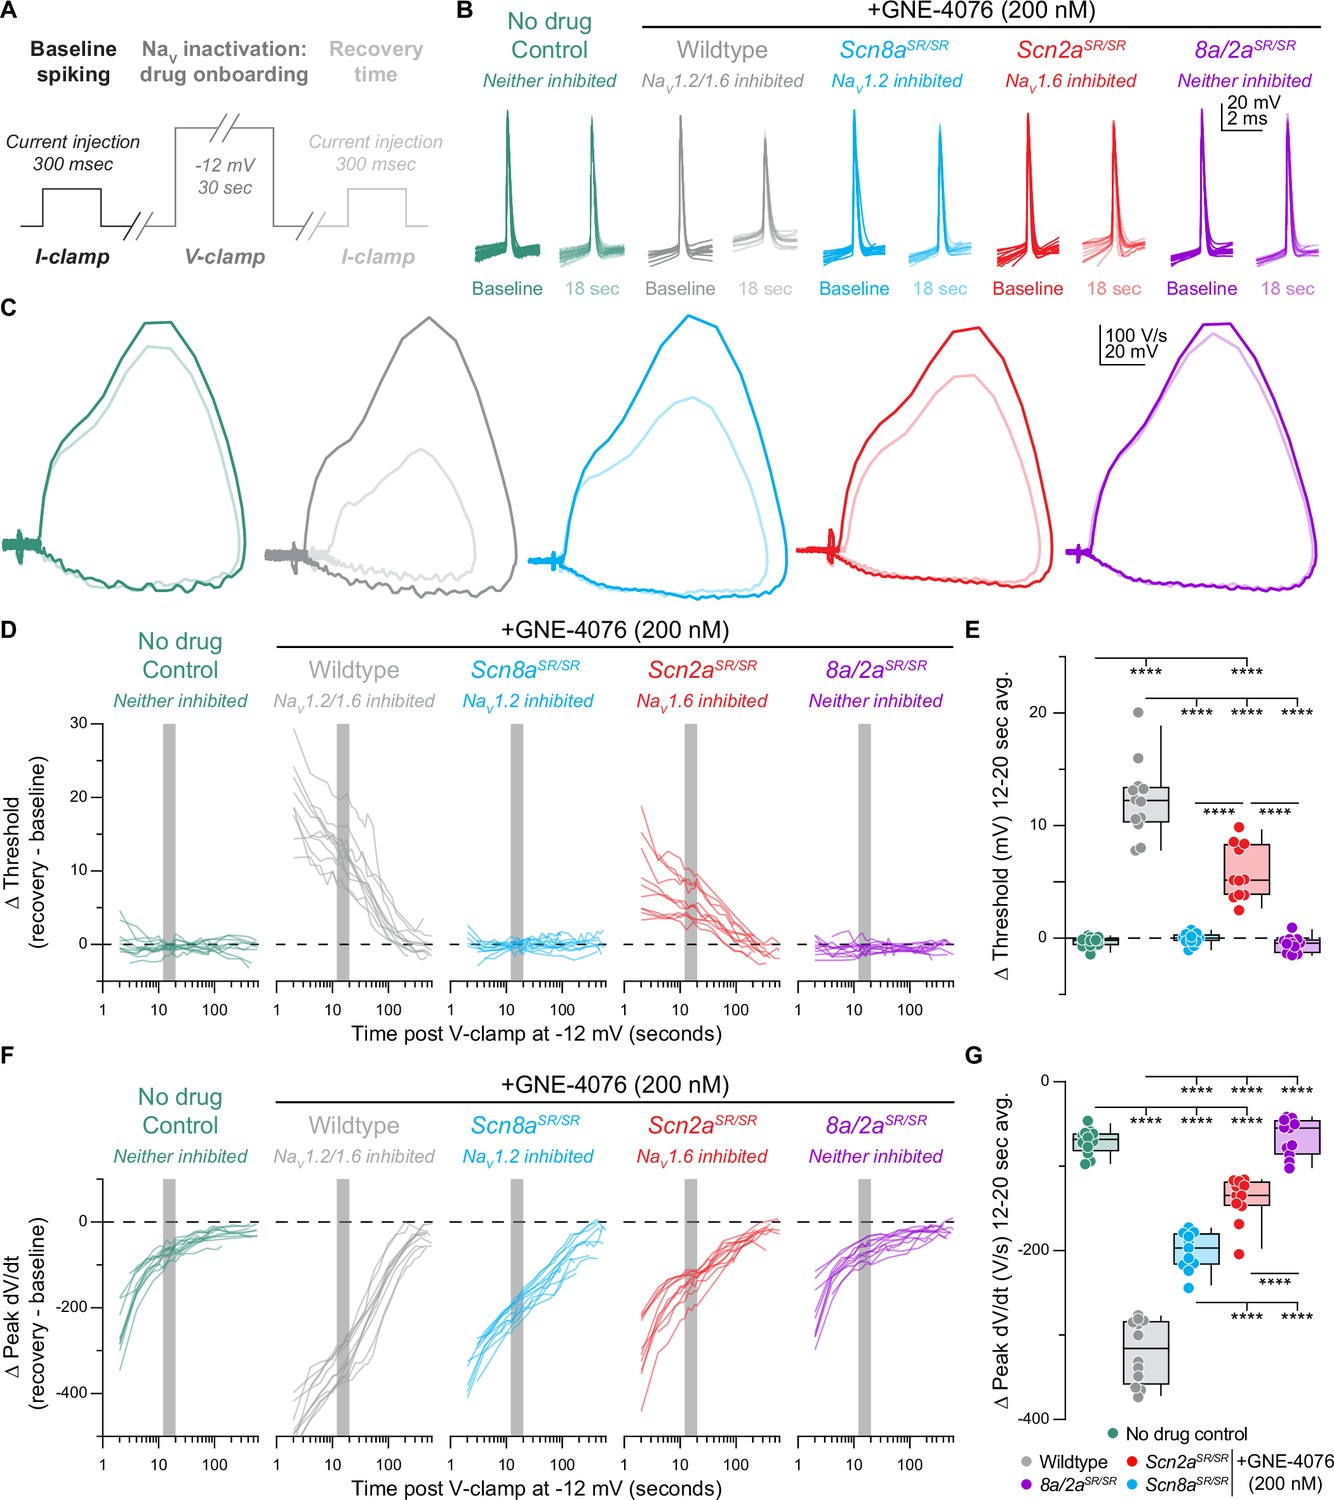
Recovery of action potential (AP) firing properties is greatly diminished following dual NaV1.6 and NaV1.2 inhibition compared to selective block of individual channels.
(A) Protocol used to characterize recovery of AP firing properties. Baseline spiking is determined by injecting current for 300 ms to elicit five to six APs. To promote NaV inactivation and maximal GNE-4076 onboarding, neurons are held at –12 mV in voltage-clamp for 30 s. Recovery of AP firing is evaluated by injecting the same current stimulus defined during baseline spiking with an inter-stimulus interval starting at 2 s, followed by 5, 15, 30, and 60 s. (B) Overlaid waveform of first AP at baseline or 18 s post GNE-4076 onboarding for all conditions (wildtype no drug, n = 12; wildtype + GNE-4076, n = 11; Scn8a/2aSR/SR + GNE-4076, n = 10; Scn2aSR/SR + GNE-4076, n = 11; Scn8aSR/SR. + GNE-4076, n = 11). (C) Overlaid phase plane of AP traces at baseline (100% transparency) or 18 s post GNE-4076 onboarding (20% transparency) for each condition in (B). Plots represent the AP velocity by taking the first derivative (dV/dt, y-axis) versus the membrane potential (mV, x-axis). Colors are matched to conditions represented in (B). (D) Recovery of AP threshold (Vm) represented as a delta value for individual cells plotted against time post GNE-4076 onboarding (log-scale). For Δ Vm, the baseline value is subtracted from individual timepoints throughout the recovery phase (Δ mV = recovery timepoint – baseline). Colors are matched to conditions represented in (B). Gray shaded bar represents recovery between 12 and 20 s. (E) Summary data for Δ Vm at 12–20 s post GNE-4076 onboarding (time period represented as gray bar in (D)). Box plots show median and 90% tails. Circles represent individual cells. One-way ANOVA, Holm–Šídák multiple comparisons test. ****p < 0.0001. (F) Recovery of AP peak velocity (dV/dt) represented as a delta value for individual cells plotted against time post GNE-4076 onboarding (log-scale). For Δ dV/dt, the baseline value is subtracted from individual time points throughout the recovery phase (Δ V/s = recovery timepoint – baseline). Colors are matched to conditions represented in (B). Gray shaded bar represents recovery between 12 and 20 s. (G) Summary data for Δ dV/dt at 12–20 s post GNE-4076 onboarding (time period represented as gray bar in (F)). Box plots show median and 90% tails. Circles represent individual cells. One-way ANOVA, Holm–Šídák multiple comparisons test. ****p < 0.0001.
-
Figure 3—source data 1
Data values for each experiment described in Figure 3.
- https://cdn.elifesciences.org/articles/105696/elife-105696-fig3-data1-v2.xlsx
Empirical data at various time points post –12 mV hold reveals that recovery from ASC-dependent block increases channel availability from approximately 0–10% to about 90–95% of the baseline spike when more time has elapsed (Figures 2C and 3B, C). This recovery in available channels mimics changes observed to phase plots in compartmental models based on overall channel expression (Figure 2B).
We then focused our analysis on the recovery of threshed or peak dV/dt across all genotypes (Figure 3). In untreated WT cells, AP threshold following voltage-clamp recovered to baseline values immediately (Figure 3C, D). By contrast, peak somatic dV/dt recovered more slowly (Figure 3C, F), likely reflecting recovery from slow inactivation of channels in the perisomatic region (Colbert et al., 1997; Park et al., 2013; Toib et al., 1998). Peak dV/dt recovered to within 87.12 ± 0.86% by 12–20 s of voltage-clamp offset (Figure 3F, G). Subsequent recovery of the residual peak dV/dt was slower, taking another 15–30 s to recover the next 5% of peak dV/dt (Figure 3F). Identical results were observed in Scn8a/2aSR/SR cells treated with 200 nM GNE-4076, suggesting that any effect observed in single knock-in recordings will be due to block of GNE-4076 sensitive channels (Figure 3B–G). We therefore focused on the 12–20 s after voltage-clamp offset for subsequent analysis, as it is a period in which most channel-intrinsic recovery has occurred, but also a period in which we would still expect significant block from GNE-4076.
When individual channel isoforms were blocked more completely with voltage steps to –12 mV, dramatic changes in AP threshold and peak dV/dt were observed. When NaV1.6 was blocked, threshold depolarized by 5.8 ± 0.7 mV (Figure 3E). When NaV1.2 was blocked instead, threshold was unaffected (∆ Vm: –0.1 ± 0.2). Thus, AP threshold and AP initiation appear to be initiated in an NaV1.6-rich region in control conditions; but when NaV1.6 is inhibited, APs can occur at more depolarized potentials, likely mediated predominately by NaV1.2.
To examine these relative contributions further, we analyzed the rising phase of APs more closely (Figure 3—figure supplement 1A). As described above, the first component of the rising phase of the AP reflects recruitment of NaV channels localized to the AIS (Figure 3—figure supplement 1A, middle). Based on changes in voltage acceleration (second derivative) within this period, the AIS component can be further divided into initiation and AIS backpropagation components (Hu et al., 2009; Favero et al., 2018; Figure 3—figure supplement 1A, right). These periods were divided based on a time point during the AIS phase where voltage acceleration first peaked (AIS inflection point) or afterwards decreased, creating a trough in an acceleration versus time graph (AIS max; Figure 3—figure supplement 1B). The dV/dt at the AIS inflection point was affected only by NaV1.6 block (Figure 3—figure supplement 1C), whereas the dV/dt at the trough was affected by block of either isoform (Figure 3—figure supplement 1D, E). This reinforces the model where APs are initiated via the NaV1.6-enriched distal AIS, and where the depolarization produced by these distally localized channels recruits NaV1.2 in the more proximal AIS. Absolute values are also reported for threshold, peak dV/dt, and AIS max for all recorded cells in recovery experiments (Figure 3—figure supplement 2A–F).
Acute block of NaV1.2 increases pyramidal cell AP output
Previously, we showed that conditional knockout of Scn2a increased AP output (Spratt et al., 2021). We hypothesized that this was due to the lack of NaV1.2 in dendrites. When they are absent from this compartment, the dendrite does not depolarize as effectively, leading to a corresponding decrease in the recruitment of dendrite-localized potassium channels (KV). Consequently, neurons repolarize less between APs, making it easier to evoke the next AP in the NaV1.6-enriched AIS.
Though this hypothesis was supported by compartmental modeling demonstrating that acute block of NaV1.2 mirrored empirical observations, we could not eliminate the possibility that some form of cellular compensation occurred in the weeks between conditional knockout induction and acute slice experiments (Miralles and Patel, 2022). Therefore, we leveraged GNE-4076 to test the effects of acute NaV1.2 block (Figure 4A), eliminating the possibility of genetic or post-translational compensation. We further compared this manipulation to block of NaV1.6 or both isoforms by examining overall AP output from protocols described in Figure 3A.
Figure 4

Acute inhibition of NaV1.2 increases action potential (AP) excitability.
(A) AP train over 300 ms at baseline (black) or 18 s post GNE-4076 onboarding (color) for all conditions (wildtype no drug, n = 12; wildtype + GNE-4076, n = 10; Scn8a/2aSR/SR + GNE-4076, n = 11; Scn2aSR/SR + GNE-4076, n = 11; Scn8aSR/SR. + GNE-4076, n = 11). Dashed line represents Vm of last afterhyperpolarization (AHP). (B) Summary data for Δ spike number at 12–20 s post GNE-4076 onboarding. Violin plots show median. Circles represent individual cells. One-way ANOVA, Holm–Šídák multiple comparisons test. *p < 0.05, **p < 0.01, ****p < 0.0001. (C) Summary data for Δ last AHP at 12–20 s post GNE-4076 onboarding. Box plots show median and 90% tails. Circles represent individual cells. One-way ANOVA, Holm–Šídák multiple comparisons test. *p < 0.05, **p < 0.01.
-
Figure 4—source data 1
Data values for each experiment described in Figure 4.
- https://cdn.elifesciences.org/articles/105696/elife-105696-fig4-data1-v2.xlsx
Remarkably, acute NaV1.2 block mirrored conditional knockout and was the only condition in which AP output increased (Figure 4B) and was associated with a depolarization in afterhyperpolarization voltage (Figure 4C). In contrast, NaV1.6 block decreased AP output, as did block of both channels (Figure 4B). This indicates that blocking NaV1.2 alone can increase AP output, independent of compensatory changes to other channels that may occur with genetic manipulations.
Activity-dependent effects of ASCs on NaV channels and subsequent inhibition alter AP properties and firing rate
During physiological activity, non-selective pharmacological inhibition of NaV channels in neurons greatly reduces cellular excitability and AP firing (Tukker et al., 2023; Thouta et al., 2022). ASCs are unique in that they require prolonged bursts of activity or even neuronal hyperexcitability to stabilize more channels in the inactivated state (Ahuja et al., 2015; Goodchild et al., 2024; Johnson et al., 2024; Johnson et al., 2022). In contrast to the data presented above, where we observe near-complete block immediately following prolonged depolarization (Figure 3—figure supplement 2C, absolute values), neurons experiencing physiological levels of activity likely never reach high percentages of channel blockade. Thus, in normal spiking neurons, ASCs would therefore be predicted to exhibit use dependence, progressively blocking channels in proportion to a neuron’s activity rate.
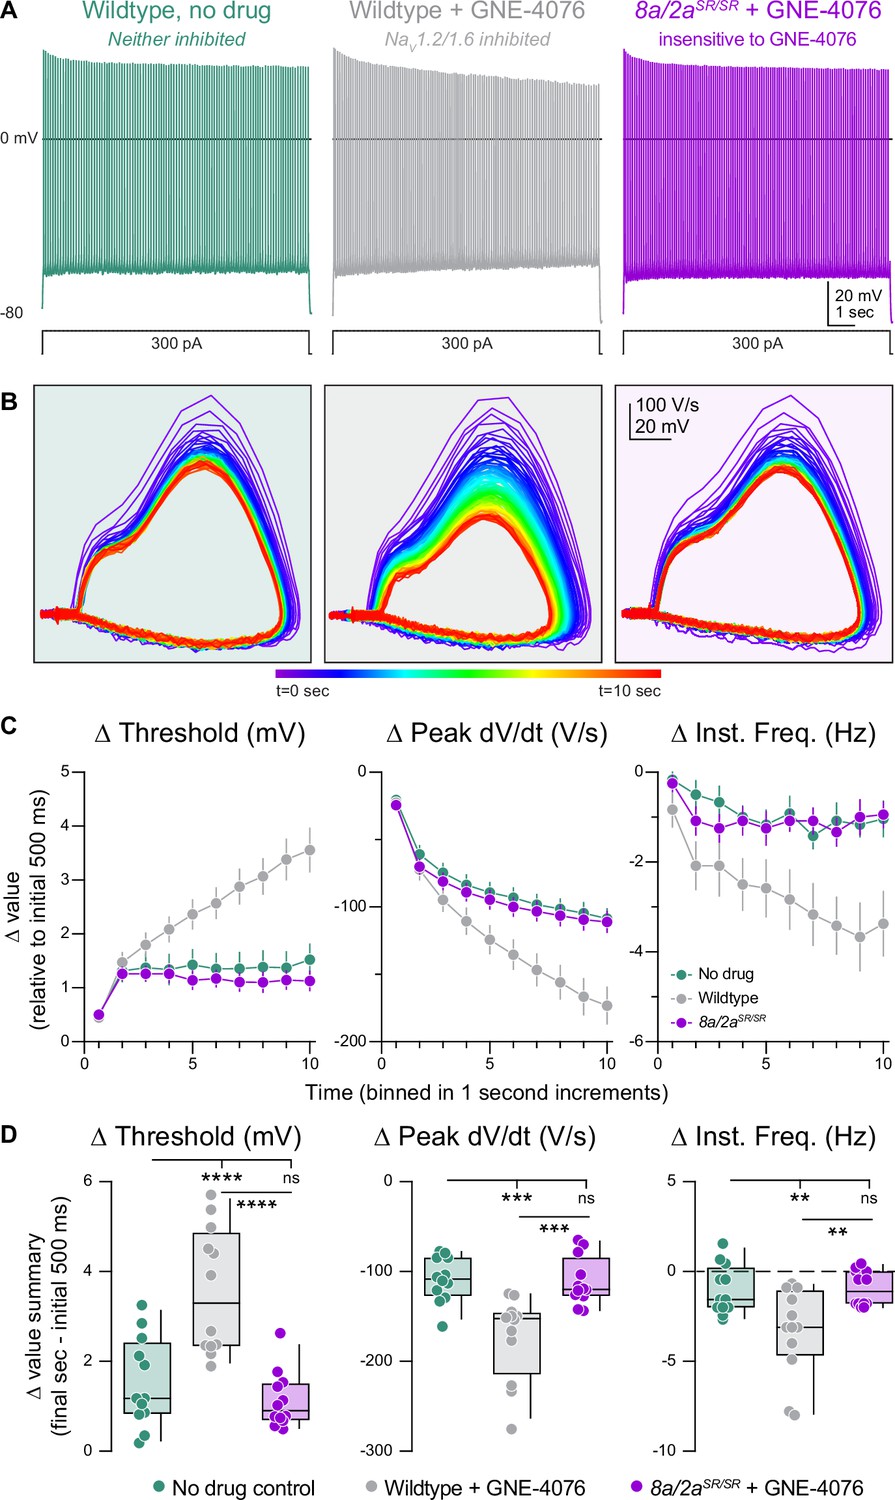
To test this concept, we generated prolonged periods of activity in current-clamp by injecting 300 pA into the somatic pipette for 10 s (Figure 5A and B). Drug-naive WT neurons responded to somatic current injection with repetitive spiking at a rate of 14.7 ± 0.5 Hz. Neurons fired at a steady state after the first second, with stable AP threshold and instantaneous AP frequency (Figure 5C). Spiking characteristics were identical in Scn8a/2aSR/SR cells treated with GNE-4076, indicating that, at 200 nM, neurons are insensitive to GNE-4076 when the YW→SR motif substitution is present (Figure 5C, D). However, in WT neurons treated with GNE-4076, threshold continued to depolarize after the first second, with corresponding decrements in instantaneous frequency and peak AP dV/dt throughout the stimulus (Figure 5C, D). This demonstrates that GNE-4076 suppresses firing of neurons with a baseline firing rate of ~15 Hz (Table 4).
Figure 5
Activity-dependent onboarding of GNE-4076 to NaV channels alters action potential (AP) firing properties in layer 5b, thick-tufted excitatory neurons.
(A) Representative AP firing response to 300 pA current injection for 10 s in wildtype or Scn8a/2aSR/SR cells with or without 200 nM GNE-4076. (B) Phase plane of AP traces shown in (A). Plots represent AP velocity by taking the first derivative (dV/dt, y-axis) versus the membrane potential (mV, x-axis). To represent changes with phase plane relative to time, a rainbow color spectrum is used with warmer colors representing more time lapsed. (C) Delta threshold (Δ mV), delta peak dV/dt (Δ V/s), and delta instantaneous firing frequency (Δ Hz) binned in 1-s increments normalized to the initial 500 ms of current injection (binned time – initial 500 ms). Circles represent mean Δ value ± SEM. Two-way ANOVA, Holm–Šídák multiple comparisons test. (D) Summary data for the final sec in (C). Delta values are normalized to the initial 500 ms of the stimulus (binned time – initial 500 ms). Box plots show median and 90% tails. Circles represent individual cells (wildtype no drug, n = 12; wildtype + GNE-4076, n = 12; Scn8a/2aSR/SR + GNE-4076, n = 12). One-way ANOVA, Holm–Šídák multiple comparisons test. **p < 0.01, ***p < 0.001, ****p < 0.0001.
-
Figure 5—source data 1
Data values for each experiment described in Figure 5.
- https://cdn.elifesciences.org/articles/105696/elife-105696-fig5-data1-v2.xlsx
Table 4
Action potential (AP) firing properties of first spike in 10 s AP train, related to Figures 5 and 6.
| NaV channel | Threshold (mV) | Peak dV/dt (V/s) |
|---|---|---|
| Wildtype, no drug (n = 12) | –43.1 ± 0.4 | 549.1 ± 8.8 |
| Wildtype + GNE-4076 (n = 12) | –41.7 ± 0.7 | 541.0 ± 12.5 |
| Scn8a/2aSR/SR + GNE-4076 (n = 12) | –43.7 ± 0.4 | 561.3 ± 14.5 |
| Scn2aSR/SR + GNE-4076 (n = 12) | –40.7 ± 0.4 | 500.7 ± 12.5 |
| Scn8aSR/SR + GNE-4076 (n = 11) | –43.3 ± 0.5 | 542.9 ± 11.6 |
We then repeated experiments described above for single mutated channels—where APs were generated with somatic depolarization over 10 s (Figure 6A, B). In cases where NaV1.6 alone could be inhibited, AP threshold depolarized in response to GNE-4076 as much as in WT cases (Figure 6C, D). Furthermore, AP frequency and peak somatic AP dV/dt were reduced to levels observed in WT cells (Figure 6C, D). In cases where NaV1.2 alone could be inhibited, changes in AP threshold and instantaneous frequency were no different than Scn8a/2aSR/SR conditions. Indeed, the only change in AP properties was a decrease in peak AP dV/dt (Figure 6D). This suggests that AP threshold and instantaneous frequency are more sensitive to NaV1.6 antagonism, whereas peak somatic dV/dt can be affected by antagonism of either isoform. Absolute values are also reported for threshold, peak dV/dt, and instantaneous frequency for all recorded cells in prolonged activity burst experiments (Figure 6—figure supplement 1A).
Figure 6 with 1 supplement see all
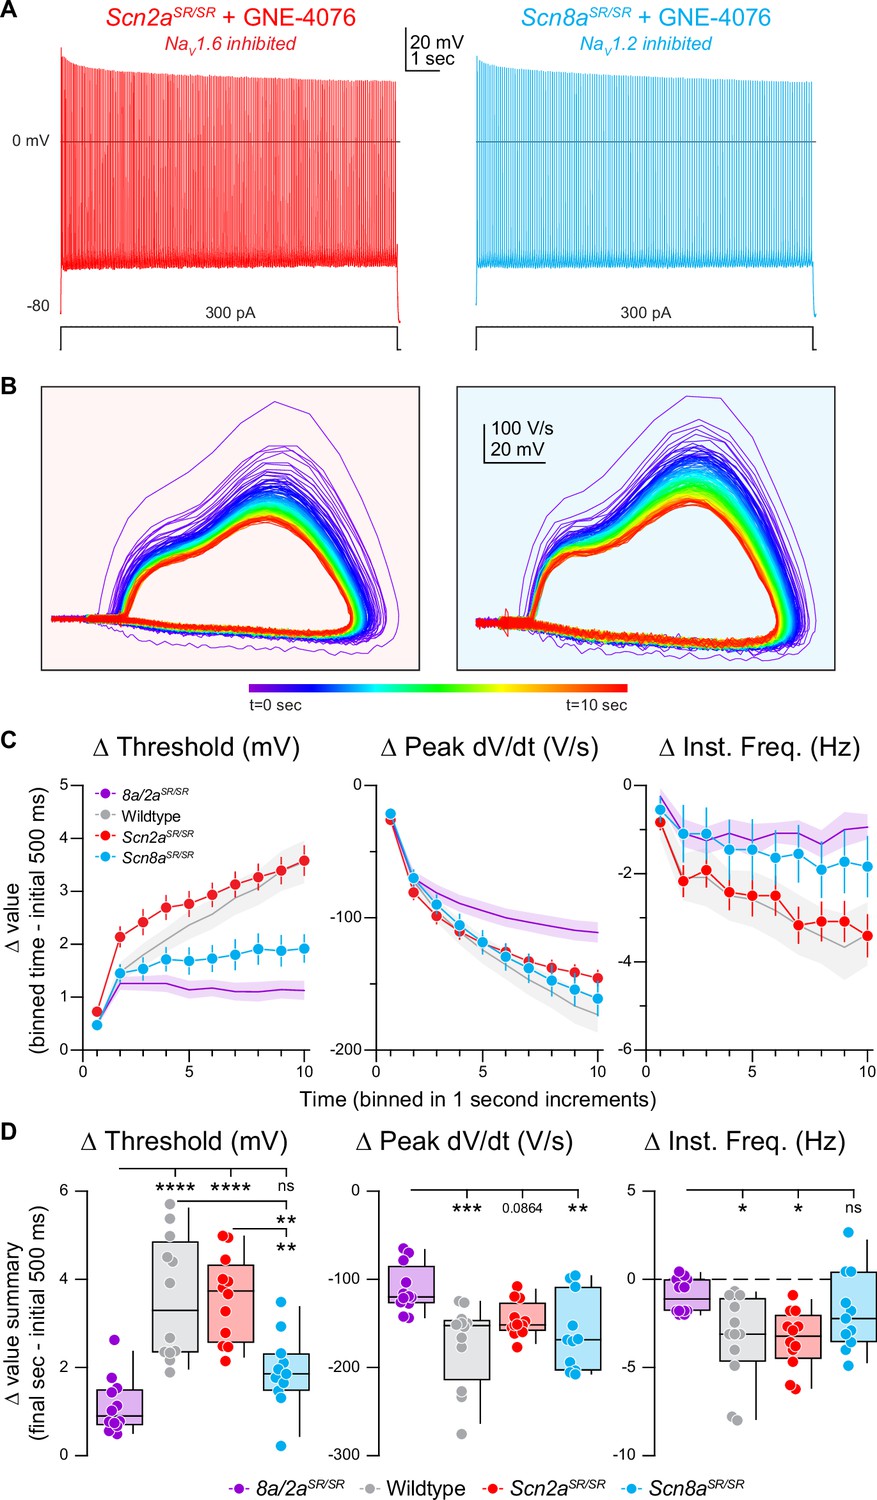
Selective inhibition of NaV1.6 depolarizes action potential (AP) threshold markedly, while blocking both NaV1.6 and NaV1.2 reduces AP velocity.
(A) Representative AP firing response to 300 pA current injection for 10 s in Scn2aSR/SR or Scn8aSR/SR cells with 200 nM GNE-4076 to selectively inhibit NaV1.6 or NaV1.2, respectively. (B) Phase plane of AP traces shown in (A). Plots represent AP velocity by taking the first derivative (dV/dt, y-axis) versus the membrane potential (mV, x-axis). To represent changes with phase plane relative to time, a rainbow color spectrum is used with warmer colors representing more time lapsed. (C) Delta threshold (Δ mV), delta peak dV/dt (Δ V/s), and delta instantaneous firing frequency (Δ Hz) binned in 1-s increments normalized to the initial 500ms of current injection (binned time – initial 500 ms). Circles represent mean Δ value ± SEM. Average Δ value ± SEM for Scn8a/2aSR/SR + GNE-4076 and wildtype + GNE-4076 from Figure 5C are represented. (D) Summary data for the final sec in (C). Delta values are normalized to the initial 500 ms of the stimulus (binned time – initial 500 ms). Box plots show median and 90% tails. Circles represent individual cells (Scn8a/2aSR/SR + GNE-4076, n = 12; wildtype + GNE-4076, n = 12; Scn2aSR/SR + GNE-4076, n = 12; Scn8aSR/SR + GNE-4076, n = 11). One-way ANOVA, Holm–Šídák multiple comparisons test. *p < 0.05, **p < 0.01, ***p < 0.001, ****p < 0.0001.
-
Figure 6—source data 1
Data values for each experiment described in Figure 6.
- https://cdn.elifesciences.org/articles/105696/elife-105696-fig6-data1-v2.xlsx
Leveraging use-dependent, isoform-selective NaV pharmacology as anticonvulsants
Epilepsy is often associated with aberrant, excessive excitability in neocortical networks, whether from direct hyperexcitability in pyramidal cells (Lopez-Santiago et al., 2017; Sanders et al., 2018) or disinhibition of pyramidal cells via alterations in inhibitory networks (Favero et al., 2018; Tran et al., 2020). Several use-dependent NaV antagonists with structures similar to GNE-4076 are being developed, exhibiting differential selectivity for NaV1.2 and NaV1.6 (Goodchild et al., 2024). Use dependence may have advantages as anti-epileptics. In theory, they would have minimal effect on neurotypical network activity unless such networks were hyperactive enough to promote drug binding. This may occur preferentially in seizure states. But given the results above demonstrating that block of NaV1.2 and NaV1.6 can have different effects on overall AP output, it is critical to determine how block of either channel affects overall activity in seizure-like conditions.
To test this, we mimicked synaptic input by repeatedly injecting a 60-s-long somatic current composed of Poisson-distributed EPSC and IPSC-like waveforms designed to elicit ~10 Hz spiking in baseline conditions (Figure 7A). Following this baseline, the PSC-like train was repeated, imposed upon a 400-pA standing current injection to increase spiking to ~30 Hz (Figure 7C), mimicking spike rates commonly observed during cortical seizure (Neckelmann et al., 1998; Timofeev and Steriade, 2004). After this seizure-like event, cells were returned to baseline voltages, and recovery was assessed with four more repetitions of the 60 s PSC stimulus (Figure 7A–C).
Figure 7 with 1 supplement see all
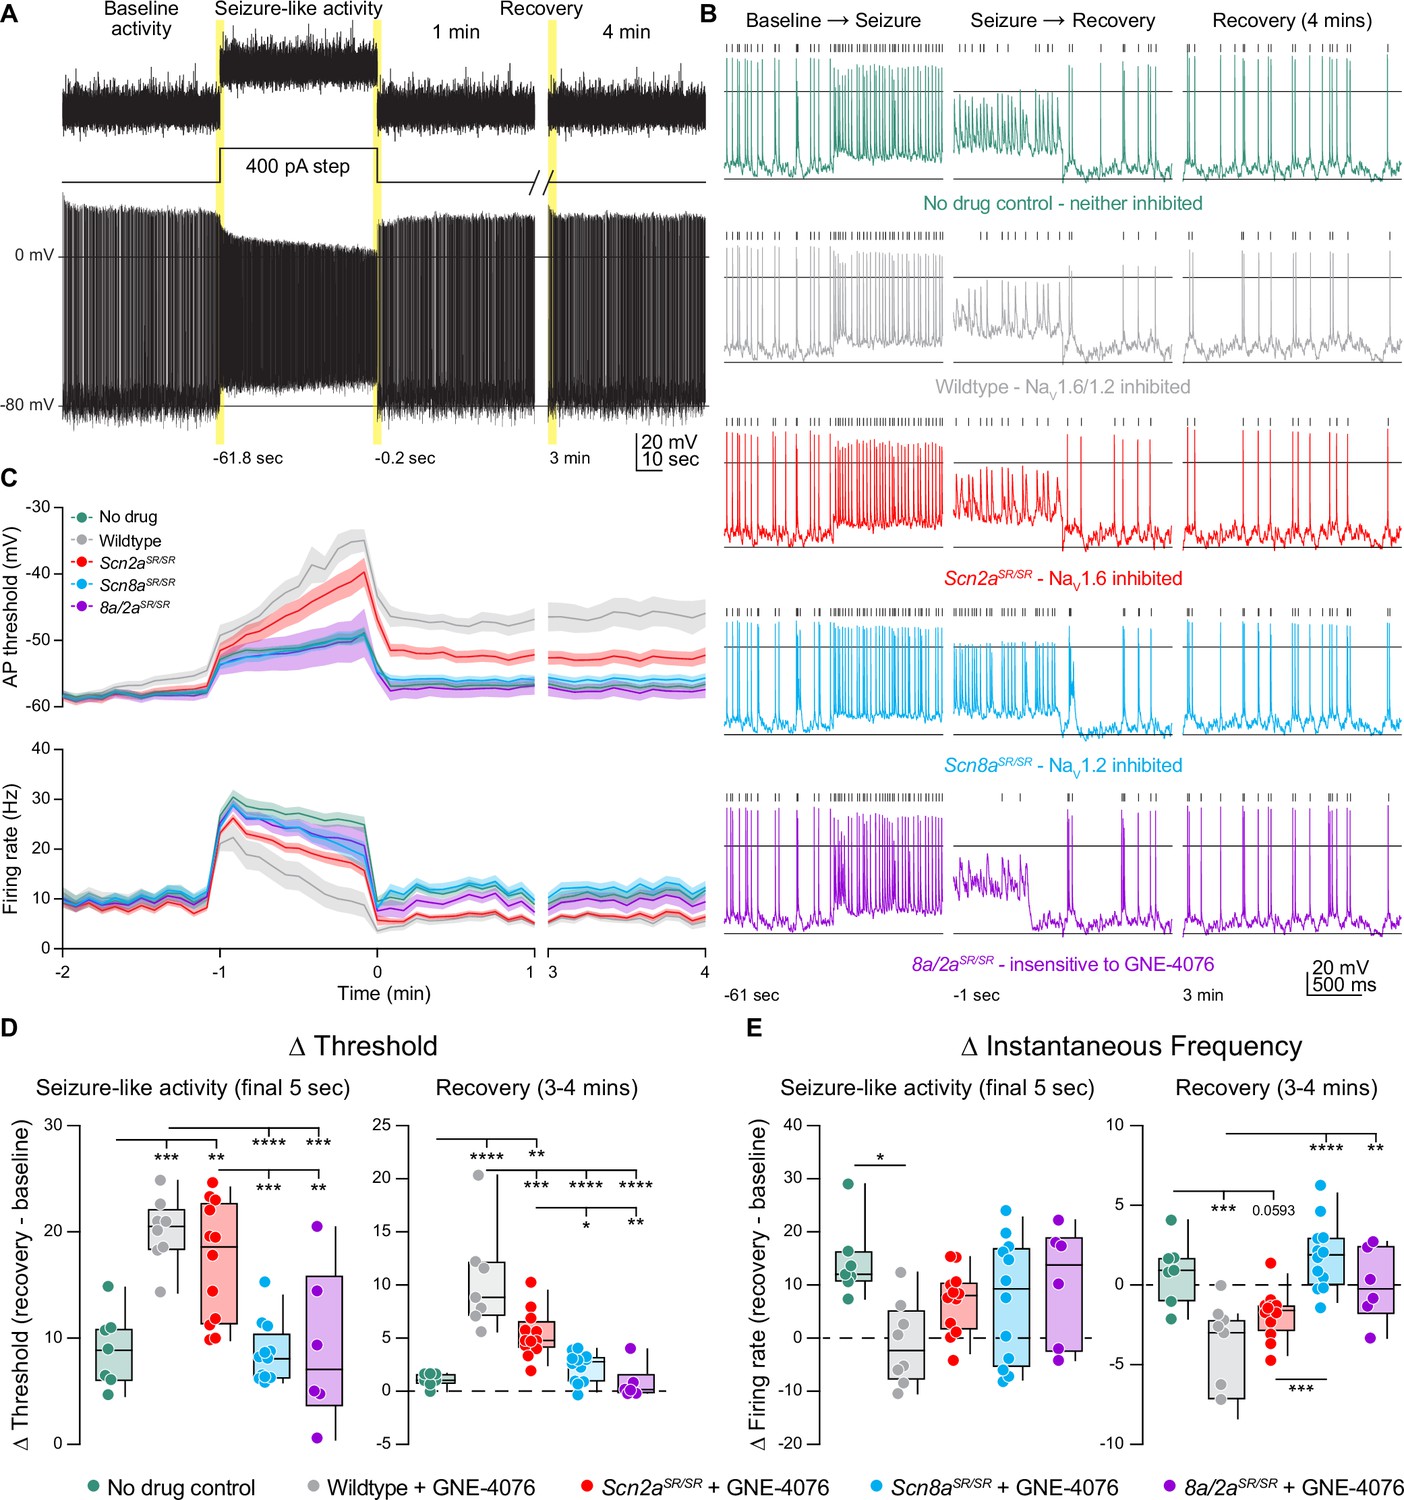
GNE-4076 onboarding following seizure-like activity continually impacts neuronal firing into recovery.
(A) Stimulation protocol and example firing trace of cell injected with fluctuating post-synaptic potentials (PSPs) randomly generated using a Poisson probability distribution function for 60 s. PSPs were continuously applied to acquire baseline activity, seizure-like activity, and recovery activity. During seizure-like activity, a 400-pA step was applied in addition to the PSP. Recovery was continuously recorded for up to 4 min post seizure-like activity. (B) Zoomed-in example traces for all genotypes at the Baseline → Seizure transition, Seizure → Recovery transition, and start of 3–4 min recovery period (highlighted in (A)). Solid horizontal black bar represents membrane potential (Vm) of –12 mV. Tick marks above traces represent detected spikes defined as a change in Vm of 15 V/s or greater. (C) Threshold (mV) or instantaneous firing frequency (Hz) binned in 5-s increments for all genotypes in (B). Solid lines represent mean value ± SEM. Timescale on x-axis mirrors activity presented in (A). (D) Summary of threshold data for the final 5 s of seizure-like activity or entire 3–4 min recovery time point in (C). Delta values are normalized to baseline activity (either at final 5 s or entire period). Box plots show median and 90% tails. Circles represent individual cells (wildtype no drug, n = 7; wildtype + GNE-4076, n = 7–8; Scn2aSR/SR + GNE-4076, n = 12; Scn8aSR/SR + GNE-4076, n = 12; Scn8a/2aSR/SR + GNE-4076, n = 6). One-way ANOVA, Holm–Šídák multiple comparisons test. *p < 0.05, **p < 0.01, ***p < 0.001, ****p < 0.0001. (E) Summary of instantaneous frequency data for the final 5 s of seizure-like activity or entire 3–4 min recovery time point in (C). Delta values are normalized to baseline activity (either at final 5 s or entire period). Box plots show median and 90% tails. Circles represent individual cells. One-way ANOVA, Holm–Šídák multiple comparisons test. *p < 0.05, **p < 0.01, ***p < 0.001, ****p < 0.0001.
-
Figure 7—source data 1
Data values for each experiment described in Figure 7.
- https://cdn.elifesciences.org/articles/105696/elife-105696-fig7-data1-v2.xlsx
In the presence of 200 nM GNE-4076, baseline firing rates were mostly stable across all conditions (Figure 7—figure supplement 1A). Wildtype, no drug and Scn8a/2aSR/SR conditions observed no change in firing rate, while dual or selective NaV1.6 blockade saw a slight decrease by 60 s of postsynaptic activity (Figure 7—figure supplement 1B). Interestingly, we did see a slight increase in baseline firing by 60 s when NaV1.2 was selectively targeted (Figure 7—figure supplement 1A, B), further highlighting a paradoxical shift to hyperactive neurons when NaV1.2 availability decreases. By contrast, a slight depolarization in AP threshold was observed at baseline when both channels were sensitive to GNE-4076 (e.g., WT plus drug) and to a lesser extent with selective block of NaV1.6 (Figure 7—figure supplement 1A, B). Given that this dose can completely block both NaV1.2 and NaV1.6 in HEK cells, a small amount of drug block was expected at baseline.
Seizure-like activity induction depolarized AP threshold markedly in all genotypes, and threshold depolarization persisted into the recovery phase for all neurons experiencing NaV1.6 or dual inhibition (Figure 7C, D). Seizure-like activity increased spike rate across all genotypes at the onset of seizure-like activity induction (Figure 7C, E). All cells exhibited some degree of AP accommodation during this stimulus, including drug-naive controls and cases where both NaV1.2 and NaV1.6 were insensitive to GNE-4076 block. WT cells exposed to GNE-4076 accommodated markedly, returning to baseline firing rates at the end of the seizure-like stimulus (Figure 7C, E). A less dramatic effect was noted when NaV1.6 was blocked alone (Figure 7E). By contrast, cells where NaV1.2 could be blocked alone were not appreciably different than untreated controls (Figure 7E). Furthermore, some cells that remained hyperactive with selective NaV1.2 block compared to control cells throughout the recovery phase. Together, these data suggest that use-dependent pharmacology that targets NaV1.2 and NaV1.6 may be most beneficial if designed for higher potency at NaV1.6.
Discussion
Here, we combined genetic and pharmacological strategies to transiently, selectively, and reversibly inhibit either NaV1.6 or NaV1.2 function using activity-dependent ASCs, which bind channels in the inactivated state. We show that acute blockade of either isoform has opposing effects on neuronal output: inhibition of NaV1.6 decreases AP output, whereas NaV1.2 increases AP output. Given this, we found that the block of NaV1.6 rather than NaV1.2 was more effective at tempering spiking activity in cells driven to seizure-like levels of AP output. This suggests that pharmacology tuned to preferentially block NaV1.6 over NaV1.2 in a use-dependent manner may be useful as an anti-epileptic.
Functional implications of differential compartmental NaV isoform expression
Electrophysiological recordings of AP propagation delays between somatic and axonal recordings demonstrate that APs initiate ~35–50 µm from the soma, in the distal AIS (Shu et al., 2007; Palmer and Stuart, 2006; Baranauskas et al., 2013; Hu et al., 2009). This region is enriched with NaV1.6 (Hu et al., 2009; Tian et al., 2014; Royeck et al., 2008; Lorincz and Nusser, 2008; Akin et al., 2015). Consistent with this, we find that inhibition of NaV1.6 alone alters AP initiation, with an increase in AP threshold and a decrease in total AP number from block of this isoform. Following distal AIS AP initiation, APs sequentially propagate across different neuronal compartments to influence local excitability (Shu et al., 2007; Palmer and Stuart, 2006; Baranauskas et al., 2013). Forward propagation was not examined here, but prior reports demonstrate that it is supported almost exclusively by NaV1.6 in nodes of Ranvier and boutons (Tian et al., 2014; Caldwell et al., 2000; Kaplan et al., 2001). By contrast, backpropagation through the proximal AIS and soma recruits a mix of NaV1.6 and NaV1.2.
Prior work has suggested that NaV1.2 channels localized to the proximal AIS are critical for backpropagation, with modeling suggesting that APs would fail to effectively backpropagate into the soma in the absence of proximal AIS NaV1.2 channels (Hu et al., 2009). While some efforts have been made to test this empirically with conditional Scn2a knockout, such experiments are imperfect, as NaV1.6 redistributes in the AIS of cells that lack NaV1.2 (Spratt et al., 2021). Here, we were able to test the role of NaV1.2 in backpropagation without compensatory effects, using acute pharmacological inhibition. Backpropagation failures were not observed, consistent with results from conditional Scn2a knockout (Spratt et al., 2021). However, we did observe a reduction in the velocity at which the AIS component of the AP depolarized when NaV1.2 was blocked selectively (Figure 3—figure supplement 1B, C). This suggests that proximal AIS-localized NaV1.2 does aid in boosting backpropagating APs as they transit from the distal AIS to the soma. Nevertheless, NaV1.2 channels are still dispensable for recruitment of somatic NaV channels, at least in mouse mPFC layer 5b pyramidal cells. Whether similar effects are observed in other cells, including those with larger somata that may be more difficult to depolarize in the absence of NaV1.2, remains to be tested.
NaV1.2 expression in pyramidal cell dendrites appears to have two roles in neuronal excitability. Intuitively, these channels provide local inward current that boosts dendritic excitability, leading to a recruitment of voltage-gated calcium channels (Spratt et al., 2019; Nelson et al., 2024). But this depolarization also appears to be critical for the recruitment of dendritically localized voltage-gated potassium channels that contribute to AP repolarization and net membrane potential between spikes (Spratt et al., 2021). Indeed, conditional knockout of NaV1.2 paradoxically increases AP output, and we suggested previously that this was due in large part to loss of interactions between dendritic NaV channels and KV channels. But given observed changes in NaV1.6 function as well as potential for other compensatory changes in non-NaV ion channels, it was difficult to ascribe hyperexcitability purely to the loss of NaV1.2 alone (Miralles and Patel, 2022). Here, we showed that identical increases in excitability—associated with depolarization of membrane potential between APs—could be observed with acute NaV1.2 block. This indicates that such effects can be due purely to the interplay between dendritic NaV1.2 and KV channels, and that modifications to potassium channel distribution or function are not necessary for such effects.
Similar to NaV1.2 conditional knockout, where NaV1.6 is upregulated, knockout of NaV1.6 results in an increase in NaV1.2 expression, at least in the AIS. In pyramidal cells from mice constitutively lacking NaV1.6, NaV1.2 occupies the entirety of the AIS rather than just the region proximal to the soma (Ye et al., 2018; Katz et al., 2018; Royeck et al., 2008). Thus, it has not been possible to evaluate the role of NaV1.6 in its normal distribution using genetic manipulations. Here, we find that acute NaV1.6 block reduces AP output with a concomitant increase in AP threshold. This contrasted markedly with block of NaV1.2, which had no effect on threshold. Of note, this distinction can be leveraged to assess the specificity of other NaV-targeting pharmacology that has been suggested to have specificity at select isoforms, as any change in threshold indicates that drugs are interacting with NaV1.6 (Ye et al., 2018; Filipis et al., 2023).
ASC pharmacology for suppression of neuronal hyperexcitability
Epilepsy can arise from genetic and non-genetic factors, often with unexplained etiology (Lindy et al., 2018; Deng et al., 2014). Seizure onset is broadly classified as an electrical imbalance of cellular and network activity that favors hyperexcitability (Agbo et al., 2023), whether it be cell intrinsic, synaptic, or due to complex network effects (Greenfield, 2013; Yin et al., 2013). Thus, seizure suppression can be targeted at multiple levels. Nevertheless, proper dosing can be difficult, as one aims to provide drug concentrations that temper excess activity but limit side effects like sedation associated with elevated drug concentrations.
For genetically defined sodium channelopathies, attention has been directed to neuronal cell types that express each isoform (e.g., SCN1A: NaV1.1, SCN2A: NaV1.2, and SCN8A: NaV1.6) (Encinas et al., 2020; Menezes et al., 2020). Seizures resulting from SCN1A loss of function limit inhibitory neuron excitability, thereby disinhibiting excitatory pyramidal cells (Favero et al., 2018; Tran et al., 2020; Strzelczyk and Schubert-Bast, 2022). SCN2A gain-of-function results in hyperexcitability in pyramidal cells, especially in early development when NaV1.2 channels are the sole isoform expressed in the AIS (Jenkins and Bender, 2025; Gazina et al., 2015). Later in development, SCN8A-encoded NaV1.6 channels are expressed more ubiquitously in the AIS of most cell classes, supporting AP initiation in both excitatory and inhibitory cells (Favero et al., 2018; Lopez-Santiago et al., 2017; Akin et al., 2015; Boiko et al., 2003).
With these cellular distributions and mechanisms of action, guidelines have emerged for treatment. For SCN1A loss-of-function, sodium channel blocking anti-epileptics are typically contraindicated (Kalume et al., 2013; Oakley et al., 2013). This is because currently prescribed sodium channel blockers are non-selective, with little preference for NaV1.1, 1.2, or 1.6 (Bai et al., 2022). Thus, further blocking of the remaining NaV1.1 leads to even more disinhibition of excitatory cells before any beneficial effects of blocking NaV channels in excitatory cells are realized. Similarly, nonspecific sodium channel blockers are contraindicated for SCN2A loss-of-function seizures, as they tend to increase seizure severity. Instead, non-selective NaV inhibitors are useful when channel gain-of-function affects excitatory cells, as is the case for both SCN2A and SCN8A gain-of-function cases.
ASCs may be useful within each of these domains, as their chemistry can be adjusted to bias binding to specific isoforms in an activity-dependent manner (Ahuja et al., 2015; Goodchild et al., 2024; Johnson et al., 2024; Johnson et al., 2022). Indeed, compounds similar to those used here that inhibit both NaV1.2 and NaV1.6 (but not other NaV channels) are effective at suppressing chemoconvulsant-induced seizures in ex vivo models (Goodchild et al., 2024). This parallels our observations, where excess activity was dampened most effectively by dual block of NaV1.2 and NaV1.6 (Figure 7C). This effect appears due in large part to the block of NaV1.6, since, ultimately, this is the isoform responsible for AP initiation. Consistent with this, NaV1.6-preferring ASCs show promise in protecting from chemoconvulsant-induced seizures in vivo (Johnson et al., 2024; Johnson et al., 2022). Similar to our results, Johnson et al. also show that a selective ASC for NaV1.6 (NBI-921352) preferentially targets cortical pyramidal cells, unlike carbamazepine that non-selectively targets many NaV isoforms leading to impaired interneuron activity (Johnson et al., 2022). In fact, drug therapies using agents like carbamazepine, lamotrigine, and phenytoin that have little to no selectivity for NaV isoforms can have adverse effects in certain situations (Agbo et al., 2023). Thus, it may be that preferential block of NaV1.6 would be beneficial in multiple sodium channelopathy conditions, including those associated with channel loss, since network hyperexcitability is ultimately dictated by NaV1.6 function in the AIS of excitatory neurons after the first months of life.
Beyond selectivity, there may also be advantages to ASC activity-dependent properties. The ASC-binding pocket is hidden from drug in a channel’s closed state. This feature, combined with on- and off-rate kinetics, results in an accumulation of block primarily for highly active neurons (Figures 3 and 7). Similar to on-demand, closed-loop electrical or optogenetic approaches for seizure intervention (Krook-Magnuson et al., 2013; Nagaraj et al., 2015; Ledri et al., 2023), ASCs are essentially biased to suppress prolonged, high-frequency activity, including the type of activity commonly observed during seizures. In this study, our focus centered mainly on seizure-like activity across individual neurons. Future studies can extend this approach to examining networks ex vivo and systems in vivo.
Data availability
Figure source data files contain the numerical data used to generate the figures.
References
-
Functional specialization of the axon initial segment by isoform-specific sodium channel targetingThe Journal of Neuroscience 23:2306–2313.https://doi.org/10.1523/JNEUROSCI.23-06-02306.2003
-
Four novel tarantula toxins as selective modulators of voltage-gated sodium channel subtypesMolecular Pharmacology 69:419–429.https://doi.org/10.1124/mol.105.015941
-
International union of pharmacologyPharmacological Reviews 57:397–409.https://doi.org/10.1124/pr.57.4.4
-
D3 receptors regulate excitability in a unique class of prefrontal pyramidal cellsThe Journal of Neuroscience 37:5846–5860.https://doi.org/10.1523/JNEUROSCI.0310-17.2017
-
Voltage-gated sodium channels: structure, function, pharmacology, and clinical indicationsJournal of Medicinal Chemistry 58:7093–7118.https://doi.org/10.1021/jm501981g
-
The molecular biology of genetic-based epilepsiesMolecular Neurobiology 49:352–367.https://doi.org/10.1007/s12035-013-8523-6
-
A transient developmental window of fast-spiking interneuron dysfunction in a mouse model of dravet syndromeThe Journal of Neuroscience 38:7912–7927.https://doi.org/10.1523/JNEUROSCI.0193-18.2018
-
Nav1.2 and BK channel interaction shapes the action potential in the axon initial segmentThe Journal of Physiology 601:1957–1979.https://doi.org/10.1113/JP283801
-
“Neonatal” Nav1.2 reduces neuronal excitability and affects seizure susceptibility and behaviourHuman Molecular Genetics 24:1457–1468.https://doi.org/10.1093/hmg/ddu562
-
State and location dependence of action potential metabolic cost in cortical pyramidal neuronsNature Neuroscience 15:1007–1014.https://doi.org/10.1038/nn.3132
-
High-throughput droplet digital PCR system for absolute quantitation of DNA copy numberAnalytical Chemistry 83:8604–8610.https://doi.org/10.1021/ac202028g
-
DNA targeting specificity of RNA-guided Cas9 nucleasesNature Biotechnology 31:827–832.https://doi.org/10.1038/nbt.2647
-
Axon initial segment structure and function in health and diseasePhysiological Reviews 105:765–801.https://doi.org/10.1152/physrev.00030.2024
-
Sudden unexpected death in a mouse model of Dravet syndromeThe Journal of Clinical Investigation 123:1798–1808.https://doi.org/10.1172/JCI66220
-
Is action potential threshold lowest in the axon?Nature Neuroscience 11:1253–1255.https://doi.org/10.1038/nn.2203
-
Scaling and benchmarking an evolutionary algorithm for constructing biophysical neuronal modelsFrontiers in Neuroinformatics 16:882552.https://doi.org/10.3389/fninf.2022.882552
-
Optogenetics for controlling seizure circuits for translational approachesNeurobiology of Disease 184:106234.https://doi.org/10.1016/j.nbd.2023.106234
-
Cell-type-dependent molecular composition of the axon initial segmentThe Journal of Neuroscience 28:14329–14340.https://doi.org/10.1523/JNEUROSCI.4833-08.2008
-
Action potential initiation and propagation in CA3 pyramidal axonsJournal of Neurophysiology 97:3460–3472.https://doi.org/10.1152/jn.01288.2006
-
Epilepsy-related voltage-gated sodium channelopathies: a reviewFrontiers in Pharmacology 11:1276.https://doi.org/10.3389/fphar.2020.01276
-
Future of seizure prediction and intervention: closing the loopJournal of Clinical Neurophysiology 32:194–206.https://doi.org/10.1097/WNP.0000000000000139
-
Spike-wave complexes and fast components of cortically generated seizures: III synchronizing mechanismsJournal of Neurophysiology 80:1480–1494.https://doi.org/10.1152/jn.1998.80.3.1480
-
Synergistic GABA-enhancing therapy against seizures in a mouse model of dravet syndromeThe Journal of Pharmacology and Experimental Therapeutics 345:215–224.https://doi.org/10.1124/jpet.113.203331
-
Site of action potential initiation in layer 5 pyramidal neuronsThe Journal of Neuroscience 26:1854–1863.https://doi.org/10.1523/JNEUROSCI.4812-05.2006
-
Slowly inactivating component of Na+ current in peri-somatic region of hippocampal CA1 pyramidal neuronsJournal of Neurophysiology 109:1378–1390.https://doi.org/10.1152/jn.00435.2012
-
Complex biophysical changes and reduced neuronal firing in an SCN8A variant associated with developmental delay and epilepsyBiochimica et Biophysica Acta. Molecular Basis of Disease 1870:167127.https://doi.org/10.1016/j.bbadis.2024.167127
-
Sodium channels as molecular targets for antiepileptic drugsBrain Research. Brain Research Reviews 26:16–28.https://doi.org/10.1016/s0165-0173(97)00054-4
-
Anatomy and physiology of the thick-tufted layer 5 pyramidal neuronFrontiers in Cellular Neuroscience 9:233.https://doi.org/10.3389/fncel.2015.00233
-
Discovery of selective, orally bioavailable, N-linked arylsulfonamide Nav1.7 inhibitors with pain efficacy in miceBioorganic & Medicinal Chemistry Letters 27:2087–2093.https://doi.org/10.1016/j.bmcl.2017.03.085
-
Role of axonal NaV1.6 sodium channels in action potential initiation of CA1 pyramidal neuronsJournal of Neurophysiology 100:2361–2380.https://doi.org/10.1152/jn.90332.2008
-
Progress in understanding and treating SCN2A-mediated disordersTrends in Neurosciences 41:442–456.https://doi.org/10.1016/j.tins.2018.03.011
-
Epilepsy-associated SCN2A (NaV1.2) variants exhibit diverse and complex functional propertiesThe Journal of General Physiology 155:e202313375.https://doi.org/10.1085/jgp.202313375
-
Pharmacological determination of the fractional block of Nav channels required to impair neuronal excitability and ex vivo seizuresFrontiers in Cellular Neuroscience 16:964691.https://doi.org/10.3389/fncel.2022.964691
-
Molecular identity of axonal sodium channels in human cortical pyramidal cellsFrontiers in Cellular Neuroscience 8:297.https://doi.org/10.3389/fncel.2014.00297
-
Interneuron desynchronization precedes seizures in a mouse model of dravet syndromeThe Journal of Neuroscience 40:2764–2775.https://doi.org/10.1523/JNEUROSCI.2370-19.2020
-
Pathogenesis of epilepsy: challenges in animal modelsIranian Journal of Basic Medical Sciences 16:1119.
-
Cortical action potential backpropagation explains spike threshold variability and rapid-onset kineticsThe Journal of Neuroscience 28:7260–7272.https://doi.org/10.1523/JNEUROSCI.1613-08.2008
Article and author information
Author details
Alfred L George Jr

Funding
National Institute of Mental Health (MH134674)
- Joshua D Garcia
National Institute of Mental Health (MH125978)
- Kevin J Bender
National Institute of Mental Health (MH126960)
- Kevin J Bender
Hartwell Foundation
- Roy Ben-Shalom
FamiliesSCN2A Foundation
- Roy Ben-Shalom
The funders had no role in study design, data collection, and interpretation, or the decision to submit the work for publication.
Acknowledgements
We thank Drs. JP Johnson, Natali Minassian, Fiona Scott, and members of the Bender Lab for extensive discussions related to this work. This work was supported by NIH grants K00 MH134674 (JDG), MH125978 and MH126960 (KJB), by the Hartwell Foundation through an Individual Biomedical Research Award (RBS) and by FamiliesSCN2A through an Action Potential award (RBS).
Ethics
This study was performed in strict accordance with the recommendations in the Guide for the Care and Use of Laboratory Animals of the National Institutes of Health. All animal procedures were in accordance with the Institutional Animal Care and Use Committee (IACUC) guidelines in accordance with the University of California, San Francisco (UCSF) and was approved by UCSF (protocol # AN194060).
Version history
- Sent for peer review:
- Preprint posted:
- Reviewed Preprint version 1:
- Reviewed Preprint version 2:
- Version of Record published:
- Version of Record updated:
Cite all versions
You can cite all versions using the DOI https://doi.org/10.7554/eLife.105696. This DOI represents all versions, and will always resolve to the latest one.
Copyright
© 2025, Garcia et al.
This article is distributed under the terms of the Creative Commons Attribution License, which permits unrestricted use and redistribution provided that the original author and source are credited.
Metrics
-
- 1,928
- views
-
- 146
- downloads
-
- 10
- citations
Views, downloads and citations are aggregated across all versions of this paper published by eLife.
Citations by DOI
-
- 7
- citations for umbrella DOI https://doi.org/10.7554/eLife.105696
-
- 1
- citation for Reviewed Preprint v1 https://doi.org/10.7554/eLife.105696.1
-
- 1
- citation for Reviewed Preprint v2 https://doi.org/10.7554/eLife.105696.2
-
- 1
- citation for Version of Record https://doi.org/10.7554/eLife.105696.3
Download links
A two-part list of links to download the article, or parts of the article, in various formats.
Downloads (link to download the article as PDF)
Open citations (links to open the citations from this article in various online reference manager services)
Cite this article (links to download the citations from this article in formats compatible with various reference manager tools)
Differential roles of NaV1.2 and NaV1.6 in neocortical pyramidal cell excitability
eLife 14:RP105696.
https://doi.org/10.7554/eLife.105696.3


