Transcriptional dynamics uncover the role of BNIP3 in mitophagy during muscle remodeling in Drosophila
- Cell Biology Center, Institute of Integrated Research, Institute of Science Tokyo, Japan
- Biological Science Research Laboratories, Kao Corporation, Japan
- School of Life Science and Technology, Institute of Science Tokyo, Japan
- Department of Genetics, Graduate School of Medicine, Osaka University, Japan
- Ochanomizu Research Facility (ORF), Bioscience Center, Research Infrastructure Management Center, Institute of Science Tokyo, Japan
- Division of Transcriptomics, Medical Institute of Bioregulation, Kyushu University, Japan
- Department of Multi-Omics, Graduate School of Medical Sciences, Kyushu University, Japan
- Department of Cellular Physiology, Graduate School of Medical Sciences, Kyushu University, Japan
Figures
Figure 1 with 1 supplement
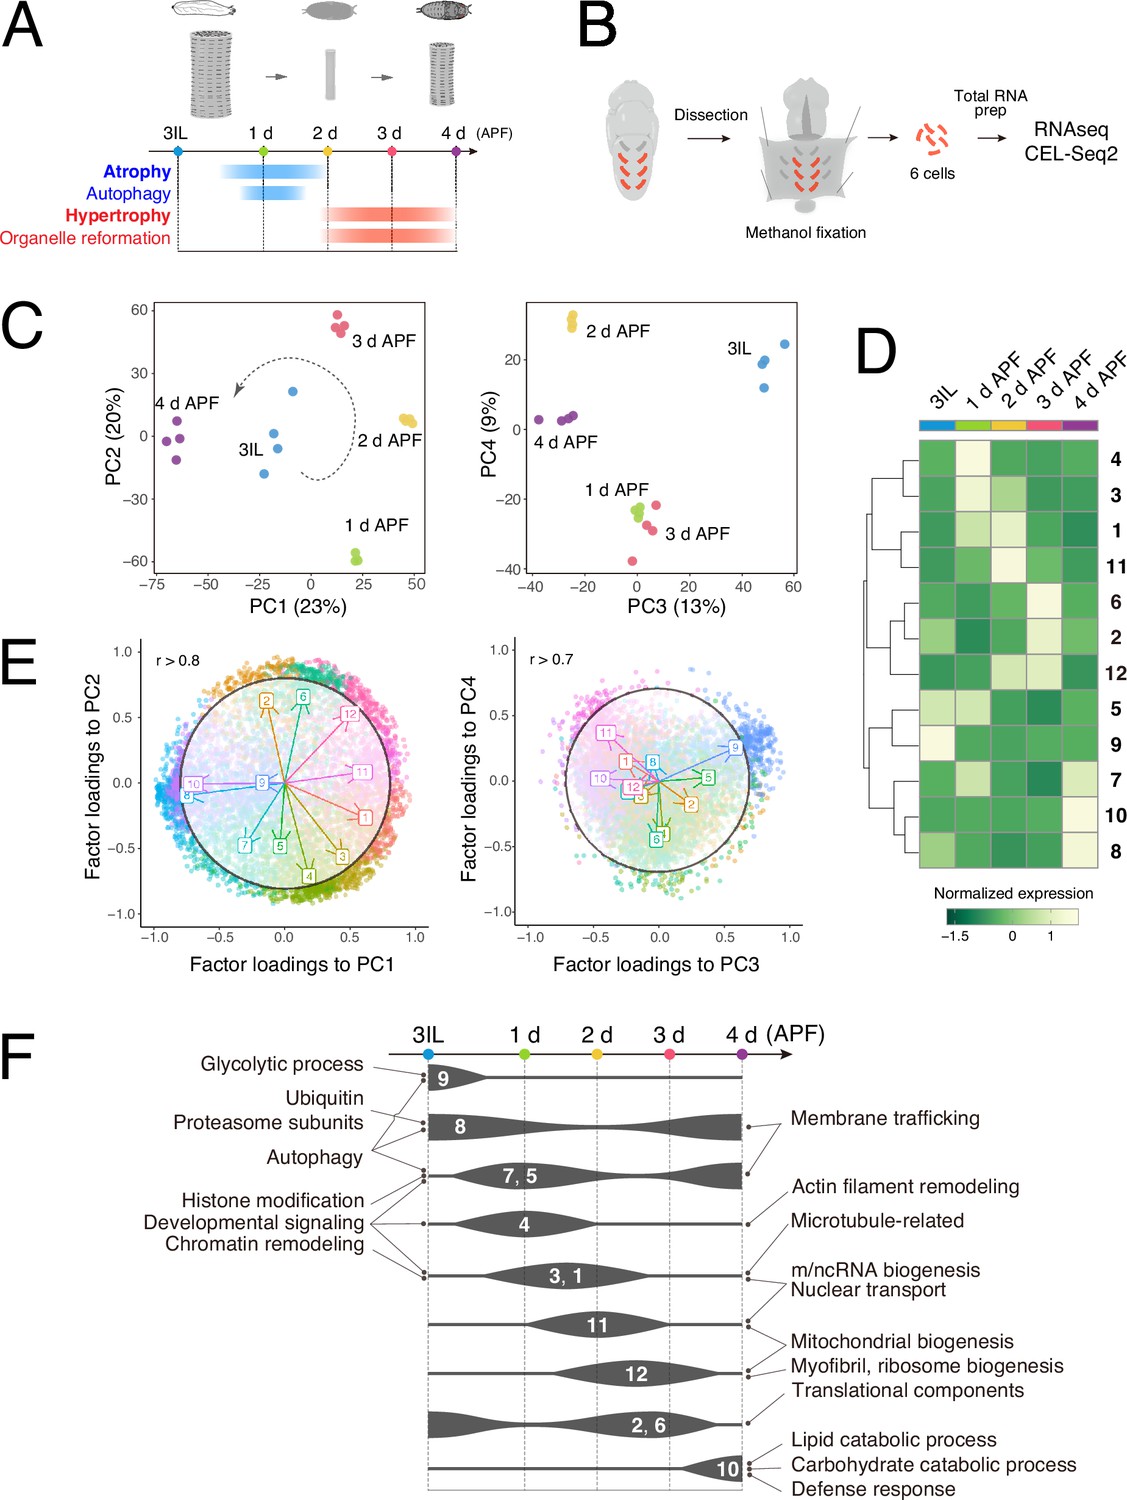
Time-course RNA-seq of the dorsal internal oblique muscle (DIOM) remodeling in wild-type Drosophila.
(A) A timeline of DIOM remodeling. Samples were collected at five time points: third instar larva (3IL) and 1–4 days after puparium formation (APF). (B) The scheme for sample preparation of DIOMs. Red-colored rectangles indicate single DIOMs. (C) DESeq2 principal component analysis (PCA) of all mRNA-seq libraries. The first four principal components are shown. PC1–2, left; PC3–4, right. The dotted arrow in the PC1–2 plot represents the direction of the transcription dynamics. (D) Heatmap of fuzzy c-means cluster core expression profiles. All genes were categorized into 12 clusters. (E) Factor loadings of each cluster to PC1–2 and PC3–4. The circles show r = 0.8 (PC1–2) or r = 0.7 (PC3–4). (F) Gene ontology (GO) enrichment at each time point during metamorphosis. The width of each line represents the expression level of the clusters indicated.
Figure 1—figure supplement 1
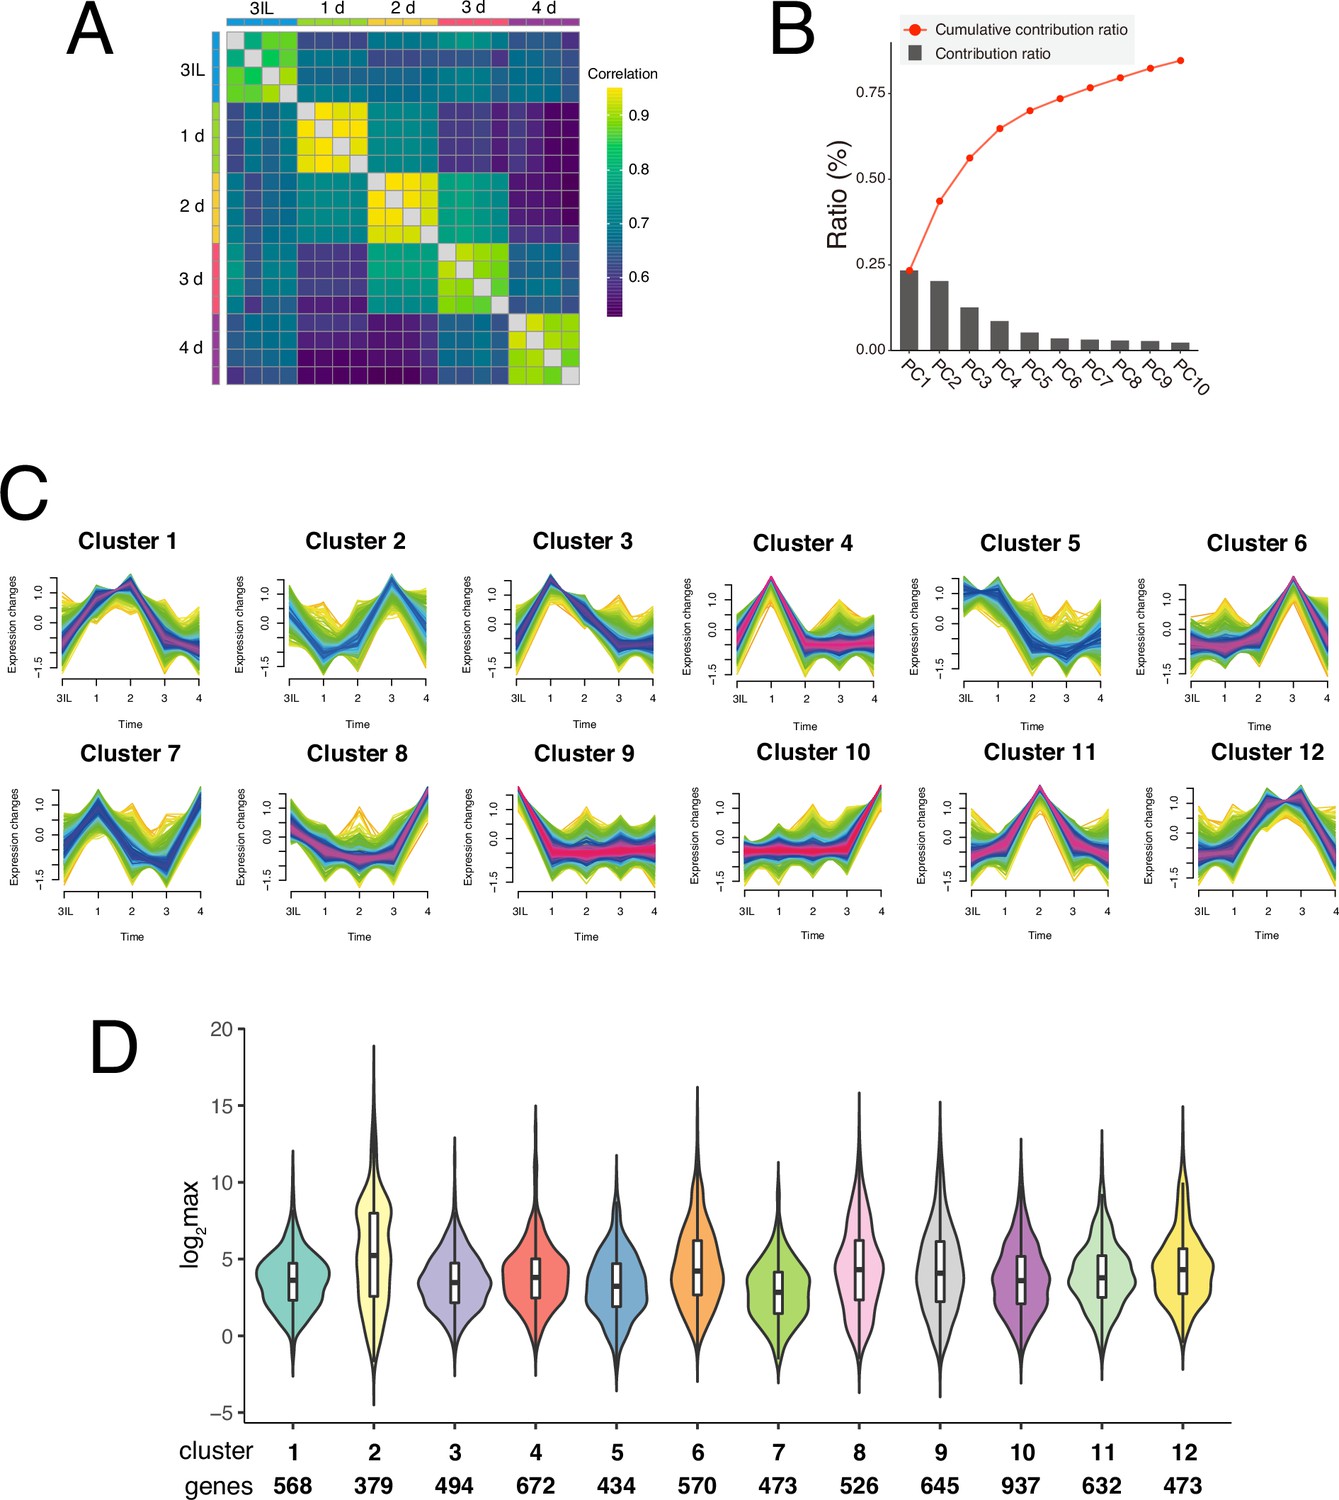
RNA-seq of dorsal internal oblique muscle (DIOM) remodeling.
(A) Heatmap of comparisons for each sample based on correlation coefficients. (B) The contribution ratios (bar) and cumulative contribution ratios (red-colored line) of PC1–10 are shown. (C) Fuzzy c-means clustering categorized expressed genes in DIOMs into 12 groups. (D) Violin plot showing the expression level of each cluster, with the number of genes in each cluster indicated at the bottom.
Figure 2 with 2 supplements
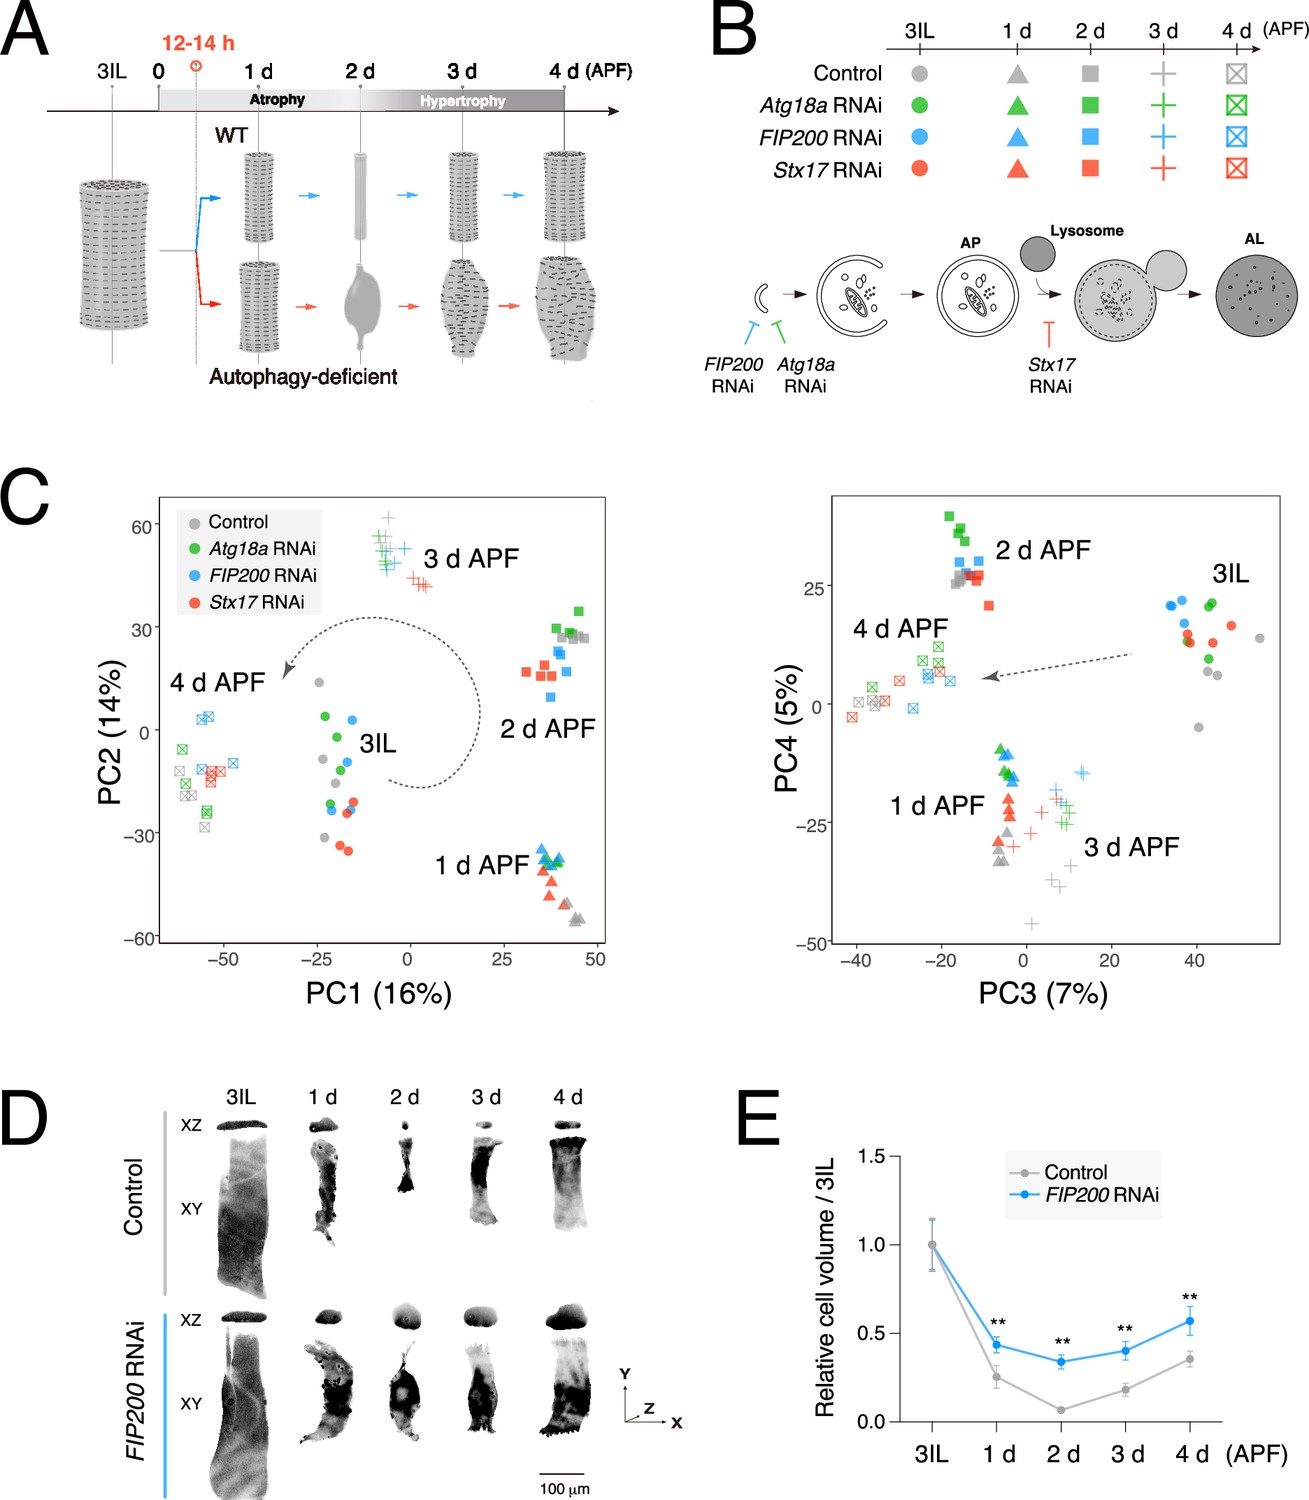
Transcriptional dynamics during dorsal internal oblique muscle (DIOM) remodeling is independent of autophagy.
(A) A schematic of DIOM remodeling in wild-type and autophagy-deficient conditions. Autophagy-dependent muscle atrophy starts at 12–14 hr APF. (B) Genotypes and time points of the comparative RNA-seq analysis (top) and a diagram of autophagosome formation (bottom). FIP200 or Atg18a RNAi blocks autophagosome formation. Stx17 RNAi blocks the autophagosome–lysosome fusion. (C) DESeq2 principal component analysis (PCA) of all mRNA-seq libraries. PC1–2, left; PC3–4, right. A total of 20 samples were analyzed. (D, E) DIOM volume changes in control or FIP200 RNAi from 3IL to 4 d APF. DIOMs were labeled with GFP. Projected images of XY and XZ planes are shown (D). (E) Relative DIOM cell volume for each genotype normalized to 3IL (set to 1). N = 5 (Mann–Whitney test). **p < 0.001.
Figure 2—figure supplement 1
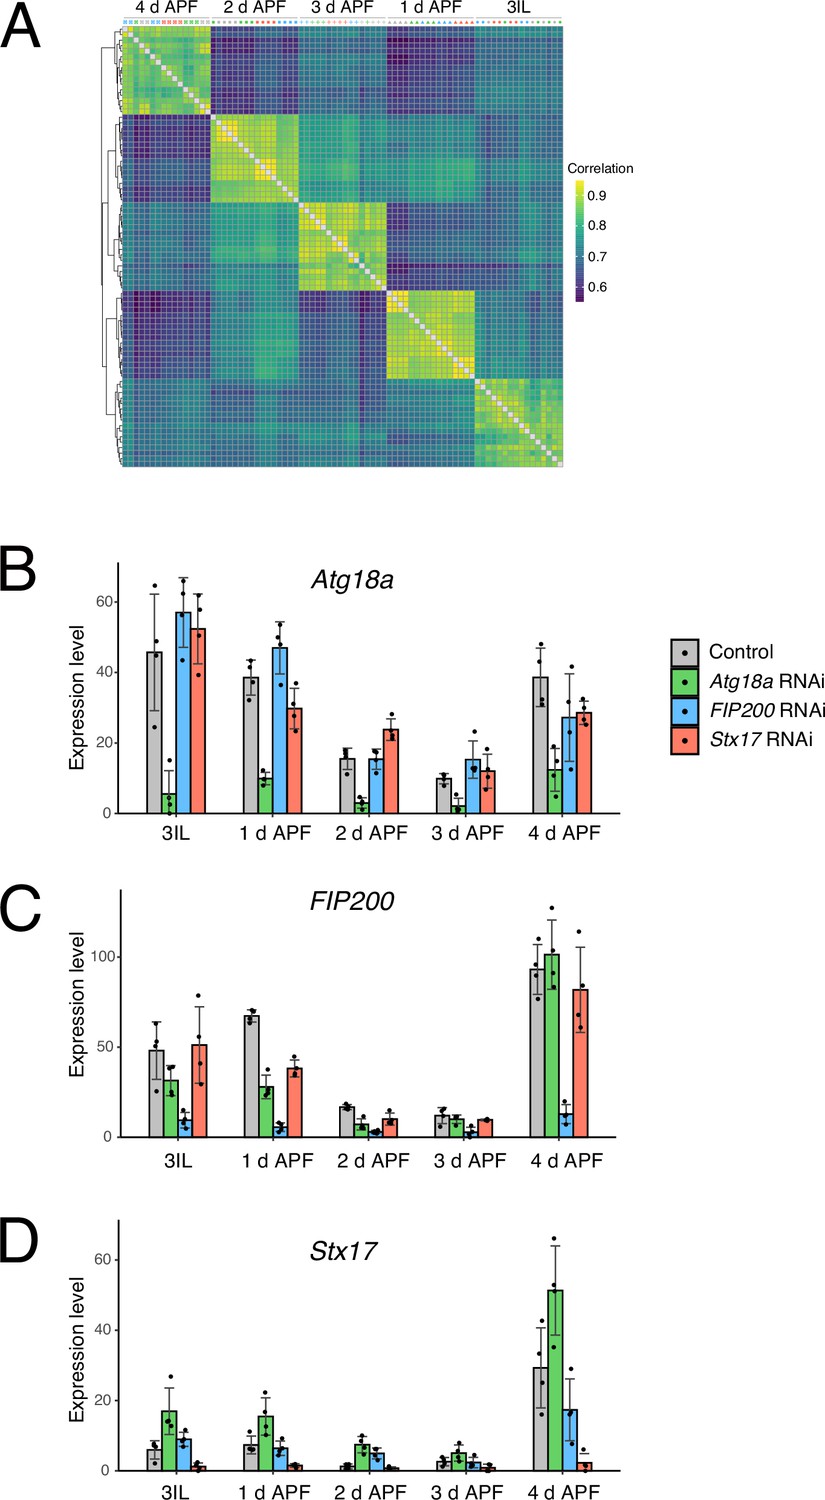
Expression levels of Atg18a, FIP200, and Stx17 during dorsal internal oblique muscle (DIOM) remodeling.
(A) Heatmap of comparisons for each sample based on correlation coefficients. Expression levels of Atg18a (B), FIP200 (C), and Stx17 (D) in DIOMs under the indicated conditions. N = 4.
Figure 2—figure supplement 2
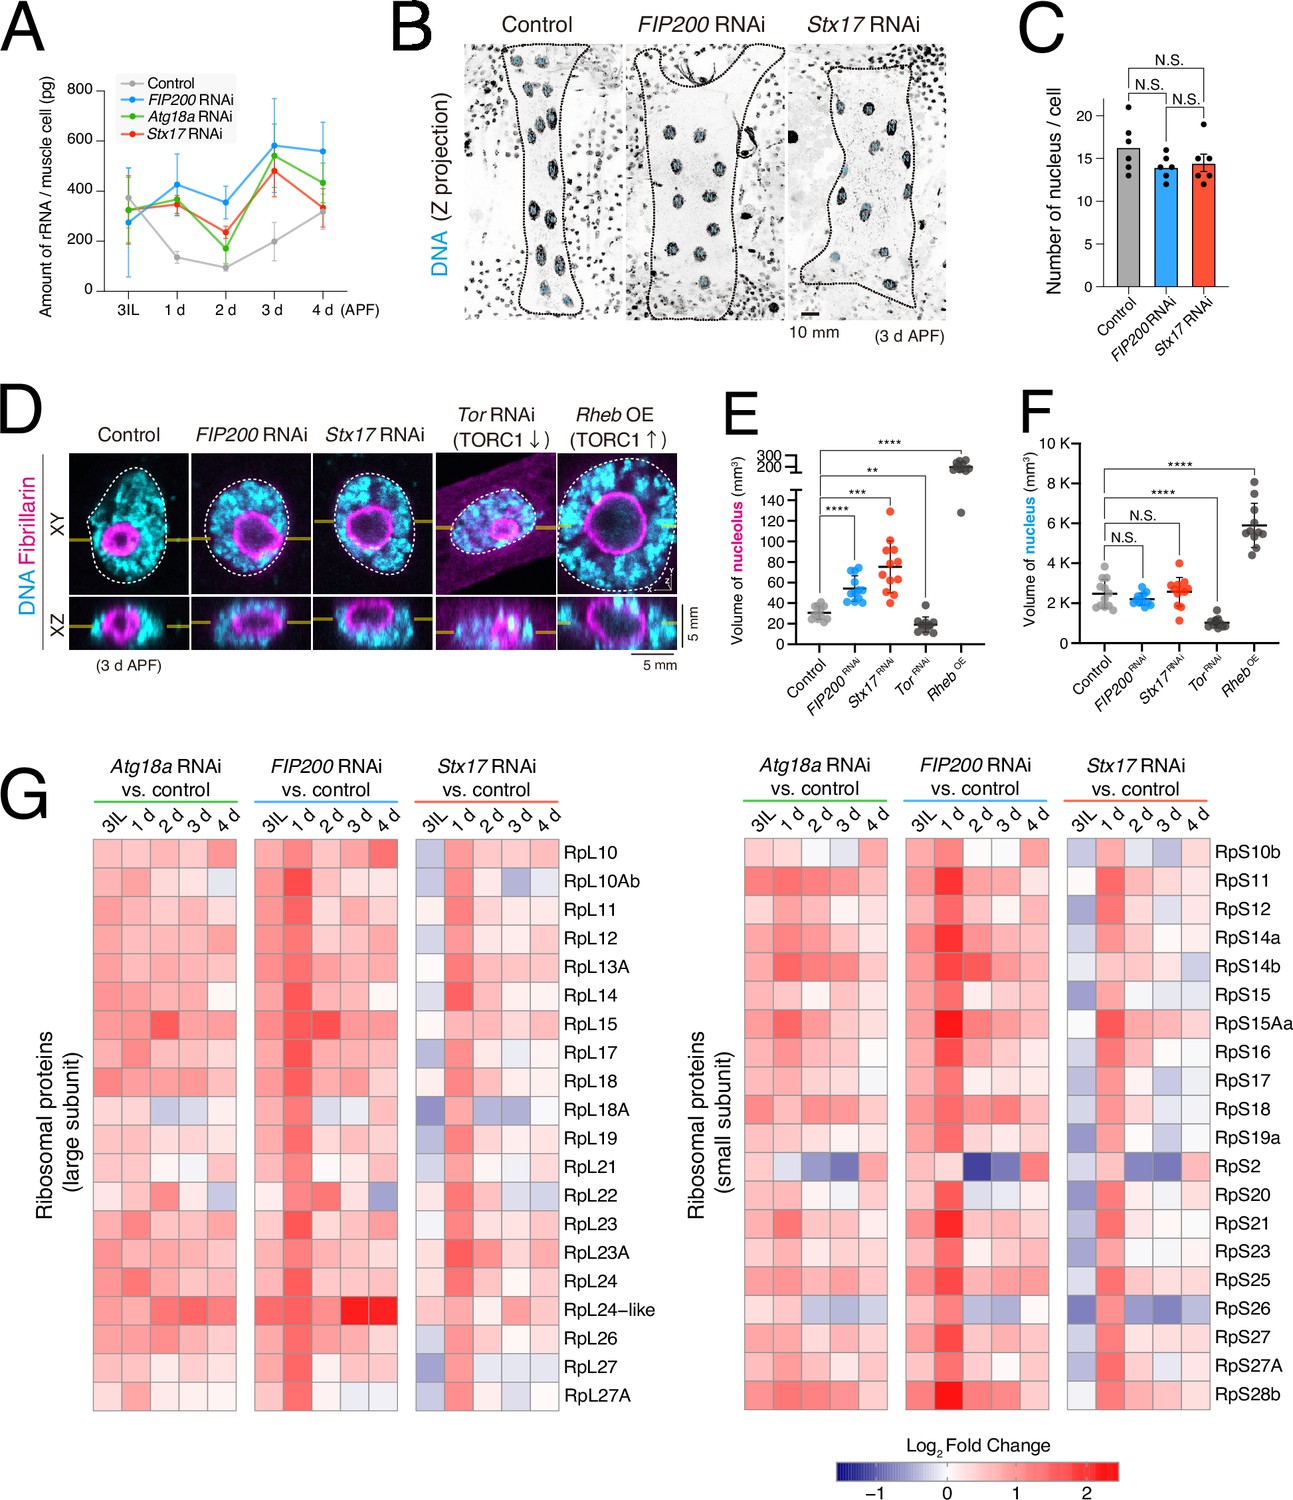
Effect of autophagy deficiency on transcription of ribosomal RNA (rRNA) and proteins.
(A) Time-course analysis of the amount of rRNA during dorsal internal oblique muscle (DIOM) remodeling in the indicated genotypes. (B, C) Loss of autophagy on the number of nuclei in DIOMs at 3 d APF. Nuclei in DIOMs were stained with Hoechst (B). N = 6 (Sidak’s test) (C). (D–F) Loss of autophagy on nucleolus volume in DIOMs at 3 d APF. DNA and fibrillarin were stained. XY and XZ planes are shown (D). The nucleolus (E) and nucleus (F) volumes were calculated from Z-series images. N = 12 (Dunnett’s T3 multiple comparisons test) *p < 0.001, ***p < 0.0001, and ****p < 0.00001. (G) A heatmap of the expression levels of RpLs (left) and RpSs (right) relative to control at each time point.
Figure 3 with 2 supplements
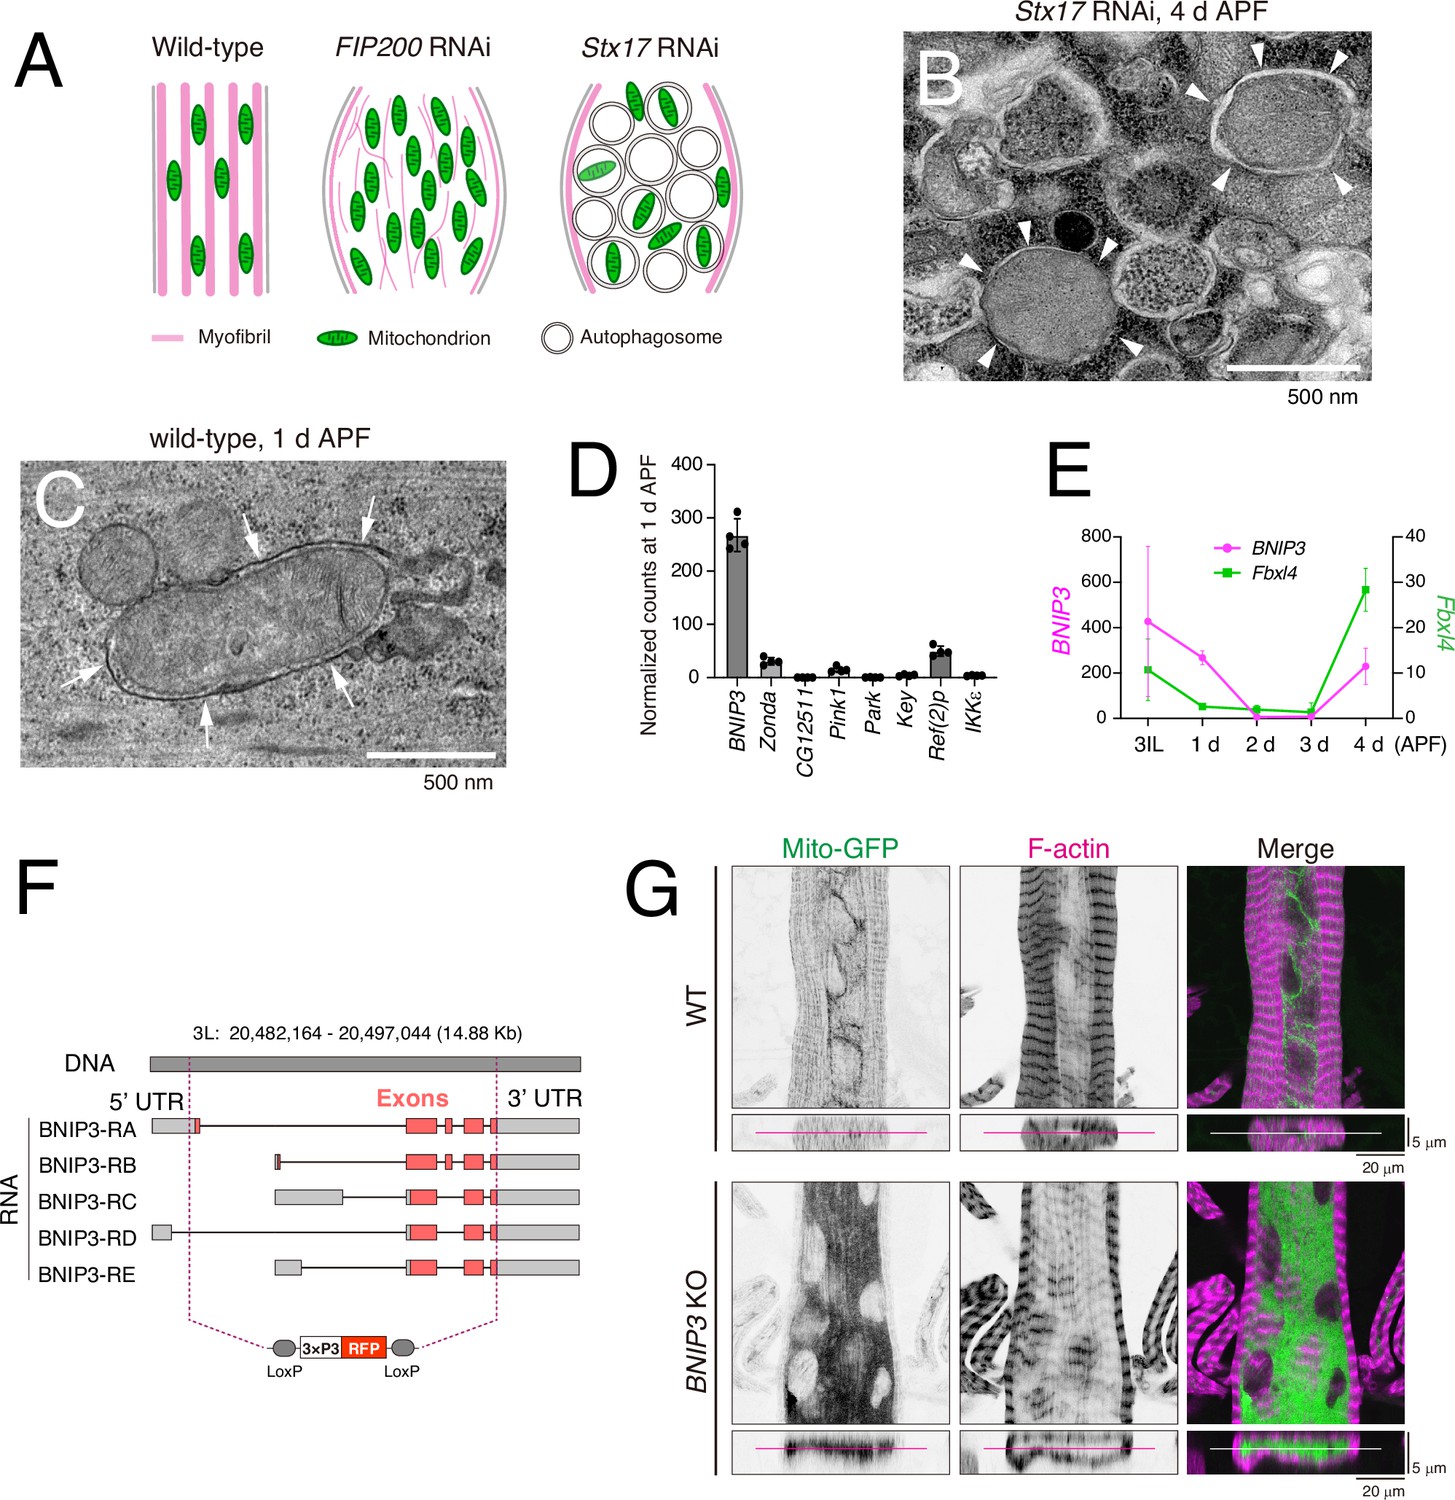
Loss of BNIP3 results in accumulation of mitochondria in dorsal internal oblique muscles (DIOMs).
(A) A schematic of 4 d APF DIOMs in wild-type, FIP200 RNAi, or Stx17 RNAi. (B) Transmission electron microscopy (TEM) image of Stx17 RNAi DIOM at 4 d APF. White arrowheads indicate autophagosome structures. (C) TEM image of wild-type DIOM at 1 d APF. White arrows indicate mitophagosome membrane structure. (D) The expression level of mitophagy regulators in DIOMs at 1 d APF. N = 4. Normalized counts in RNA-seq are shown. (E) The expression level of BNIP3 and Fbxl4 in DIOMs. N = 4. (F) A diagram illustrating the BNIP3 knockout strategy, where all exons were deleted using two guide RNAs (gRNAs) and replaced with a 3xP3-RFP marker. (G) Loss of BNIP3 phenotype on mitochondria and myofibrils in DIOM at 4 d APF. XY (top) and XZ (bottom) planes were shown.
Figure 3—figure supplement 1
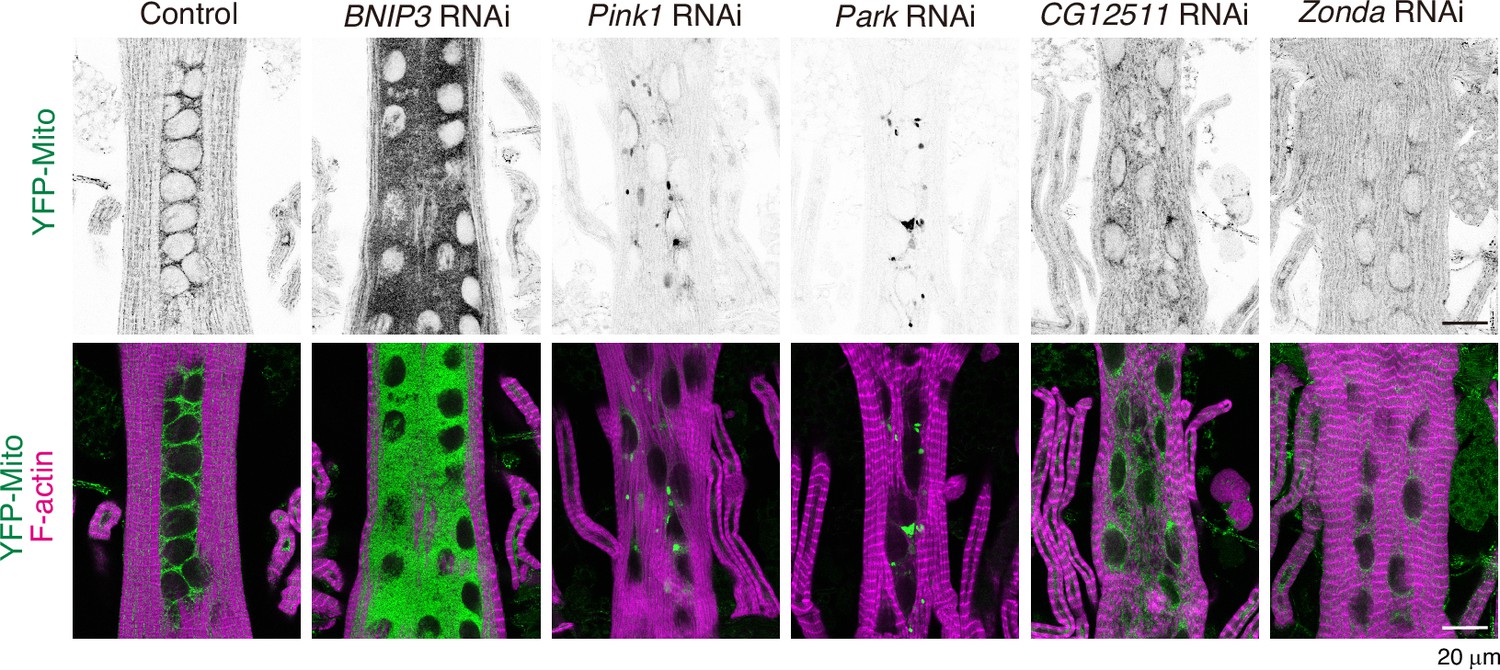
Loss of BNIP3 on mitochondria and myofibrils in dorsal internal oblique muscles (DIOMs).
YFP-Mito and Phalloidin-Alexa633 (F-actin) staining in DIOMs at 4 d APF in the indicated genotypes.
Figure 3—figure supplement 2
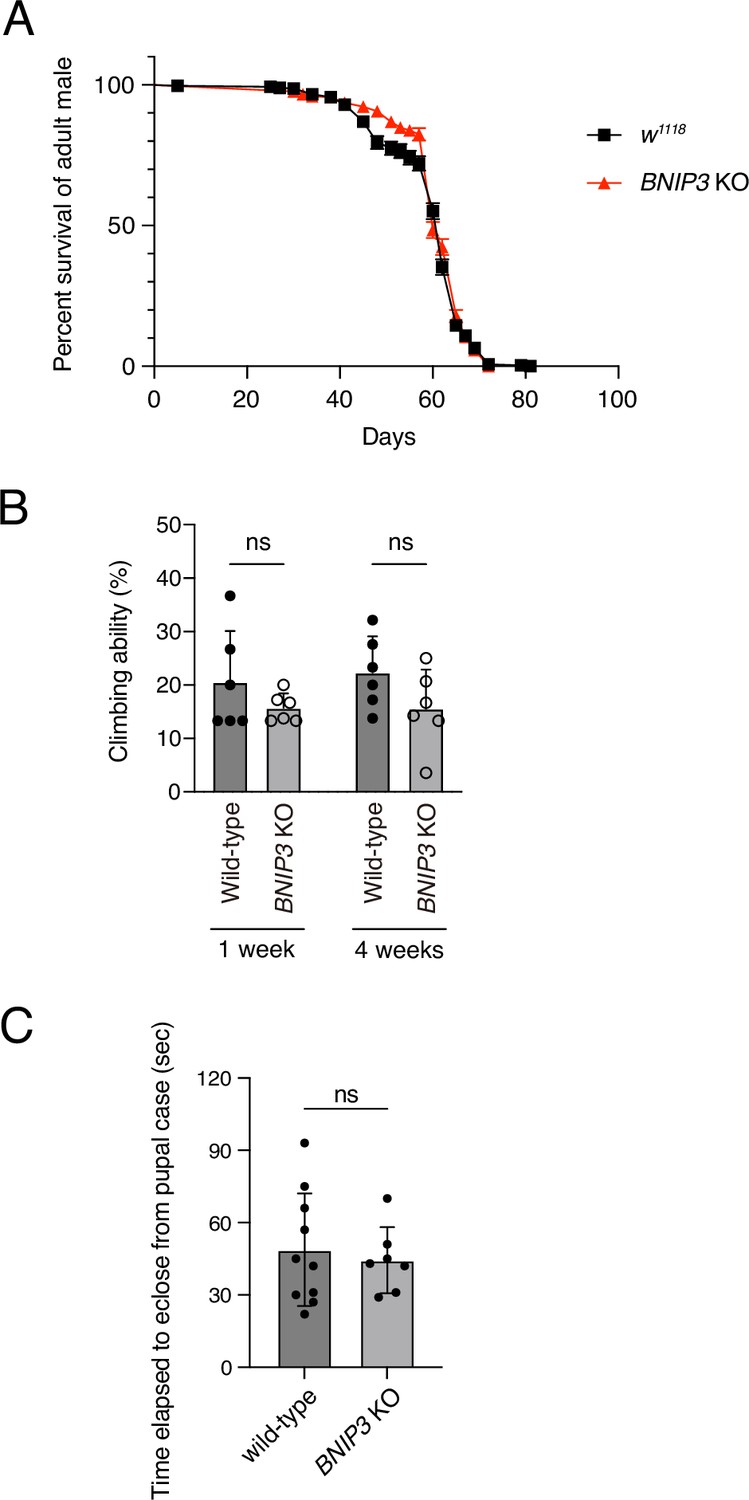
Loss of BNIP3 on adult fly lifespan and mobility.
(A) Survival rates of wild-type and BNIP3 KO adult males. WT, N = 298; BNIP3 KO, N = 297 (log-rank test). (B) Climbing ability of wild-type and BNIP3 KO adult males at 1 and 4 weeks old. N = 6 (Mann–Whitney test). (C) Elapsed time to eclosion in wild-type males and BNIP3 KO males. WT, N = 10; BNIP3 KO, N = 7 (Mann–Whitney test).
Figure 4
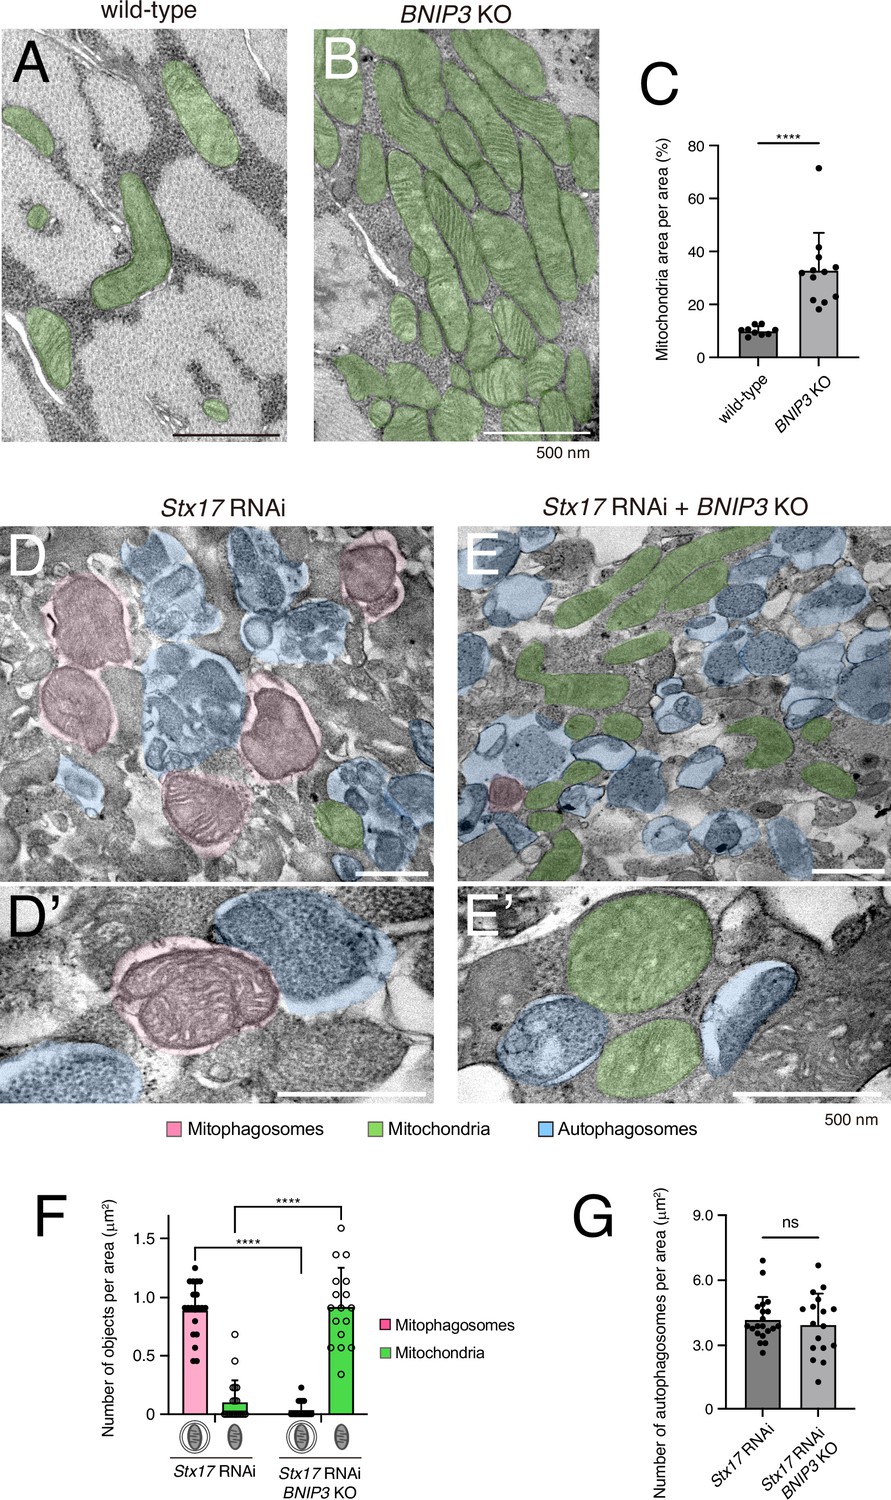
BNIP3 is required for mitophagosome formation.
Transmission electron microscopy (TEM) images of dorsal internal oblique muscle (DIOM) transverse sections at 4 d APF in wild-type (A) or BNIP3 KO (B). Mitochondria are shown in green. (C) The percentages of mitochondrial area per unit area in the indicated genotypes. Wild-type, N = 9; BNIP3 KO, N = 12 (Mann–Whitney test). ****p < 0.00001. (D and E) TEM images of DIOM transverse sections at 4 d APF in Stx17 RNAi (D, D’) or a combination of Stx17 RNAi and BNIP3 KO (E, E’). Mitophagosomes, pink; Mitochondria, green; autophagosomes, blue. (F) The number of mitophagosomes and mitochondria per unit area in the indicated genotypes. (G) The number of total autophagosomes, including mitophagosomes, per unit area in the indicated genotypes. Stx17 RNAi, N = 20; Stx17 RNAi and BNIP3 KO, N = 17 (Mann–Whitney test) (F, G).
Figure 5 with 2 supplements
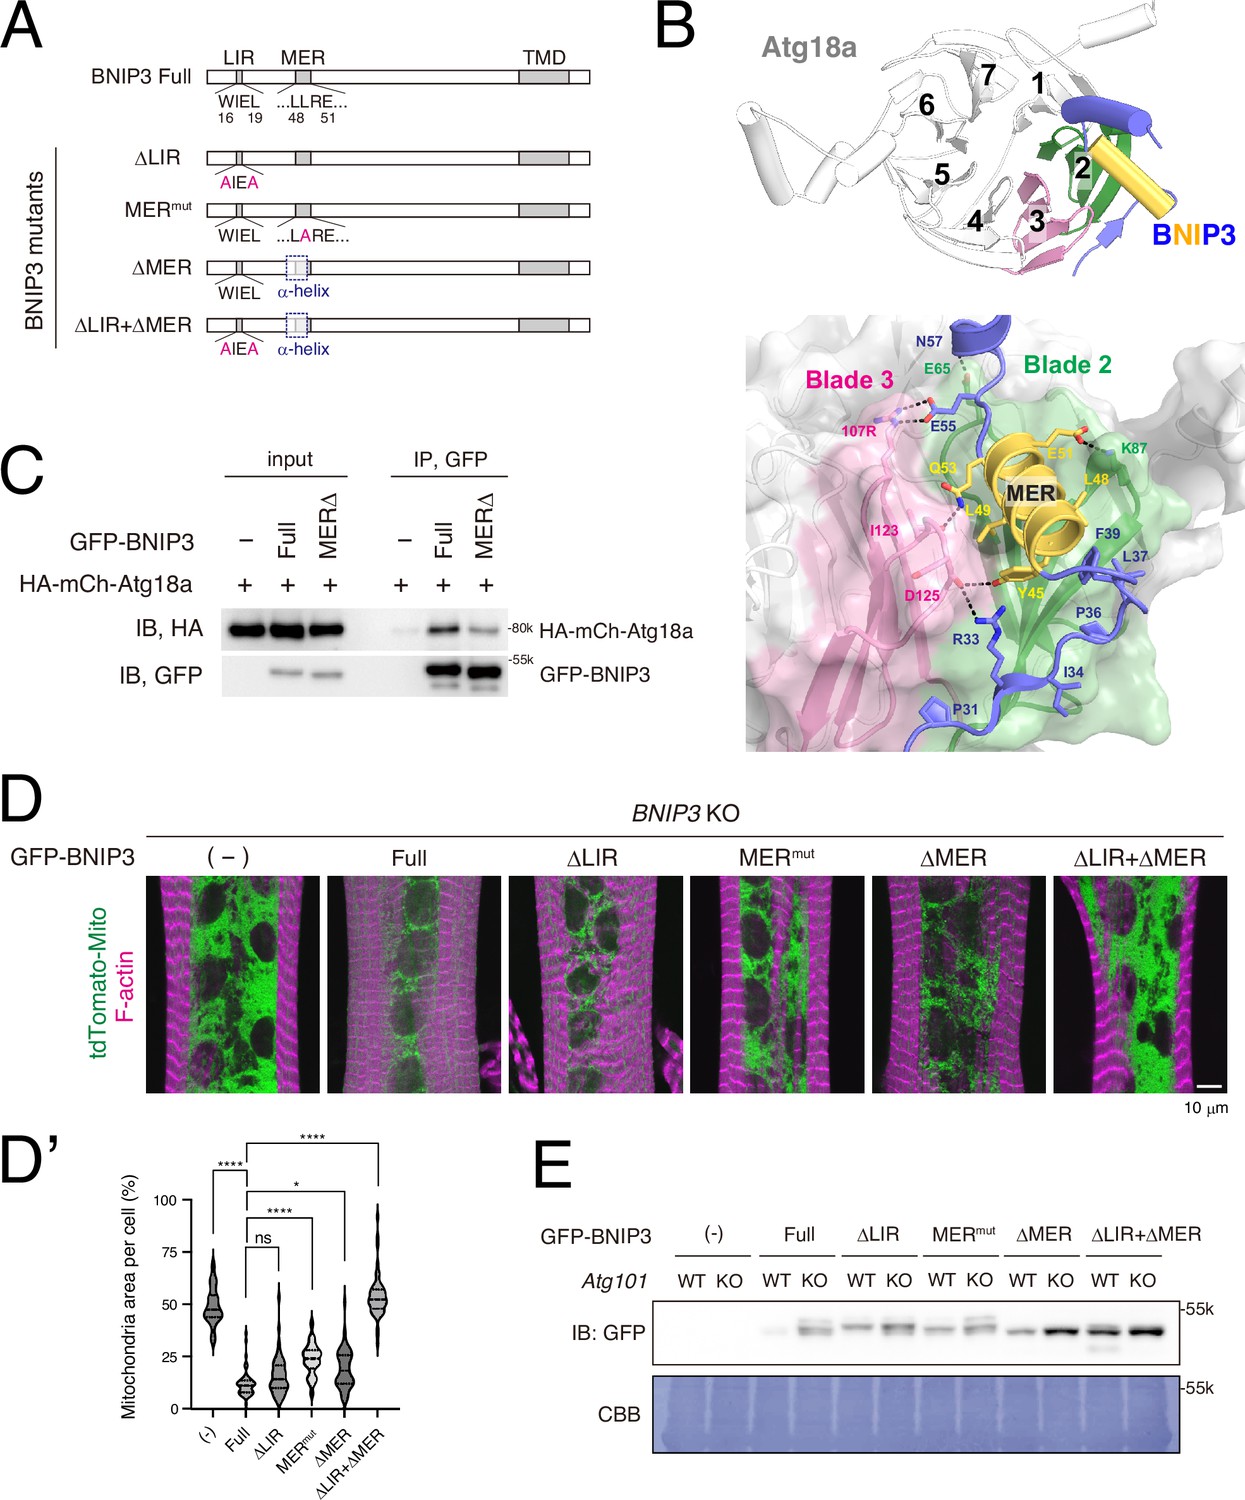
The LIR and MER motifs are required for BNIP3-mediated mitochondrial clearance.
(A) Schematics of Drosophila BNIP3 and its mutants. (B) The structure of the BNIP3-Atg18a complex predicted by AlphaFold 3. Top, overview: Atg18a is depicted in white, featuring a β-propeller structure consisting of seven blades, with blades 2 and 3 highlighted in green and pink, respectively. For BNIP3, only residues 29–74 are shown in blue for clarity, with the α-helix spanning residues 42–53 highlighted in yellow. Bottom, close-up view: Amino acids positioned to form intramolecular contacts through their side chains are labeled and represented as sticks, with potential hydrogen bonds shown as dashed lines. (C) GFP pulldown experiment between GFP-BNIP3_full or MERΔ construct and HA-mCh-Atg18a in HEK293 cells. (D, D’) BNIP3 rescue experiment in dorsal internal oblique muscles (DIOMs) at 4 d APF. The indicated GFP-tagged BNIP3 constructs and tdTomato-Mito were co-expressed in BNIP3 KO flies using the GAL4/UAS system (D). Single-channel images corresponding to the merged panels are presented in Figure 5—figure supplement 1B. The percentages of mitochondrial area in DIOMs for the indicated genotypes. Empty (-), N = 46; Full, N = 55; ΔLIR, N = 52; MERmut, N = 48; ΔMER, N = 54; ΔLIR + ΔMER, N = 51 (Kruskal–Wallis test) *p < 0.05 and ****p < 0.00001 (D’). (E) The amount of GFP-BNIP3 in WT and Atg101 KO muscles. The GFP-BNIP3 constructs were expressed by Mef2-GAL4 in WT or Atg101 KO flies. Larval fillets were lysed and subjected to western blotting for GFP. After immunoblotting, the membrane was stained with CBB to assess total protein loading.
-
Figure 5—source data 1
PDF files containing original western blots for Figure 5C, E.
- https://cdn.elifesciences.org/articles/105834/elife-105834-fig5-data1-v1.zip
-
Figure 5—source data 2
Original files for western blot analysis displayed in Figure 5C, E.
- https://cdn.elifesciences.org/articles/105834/elife-105834-fig5-data2-v1.zip
Figure 5—figure supplement 1
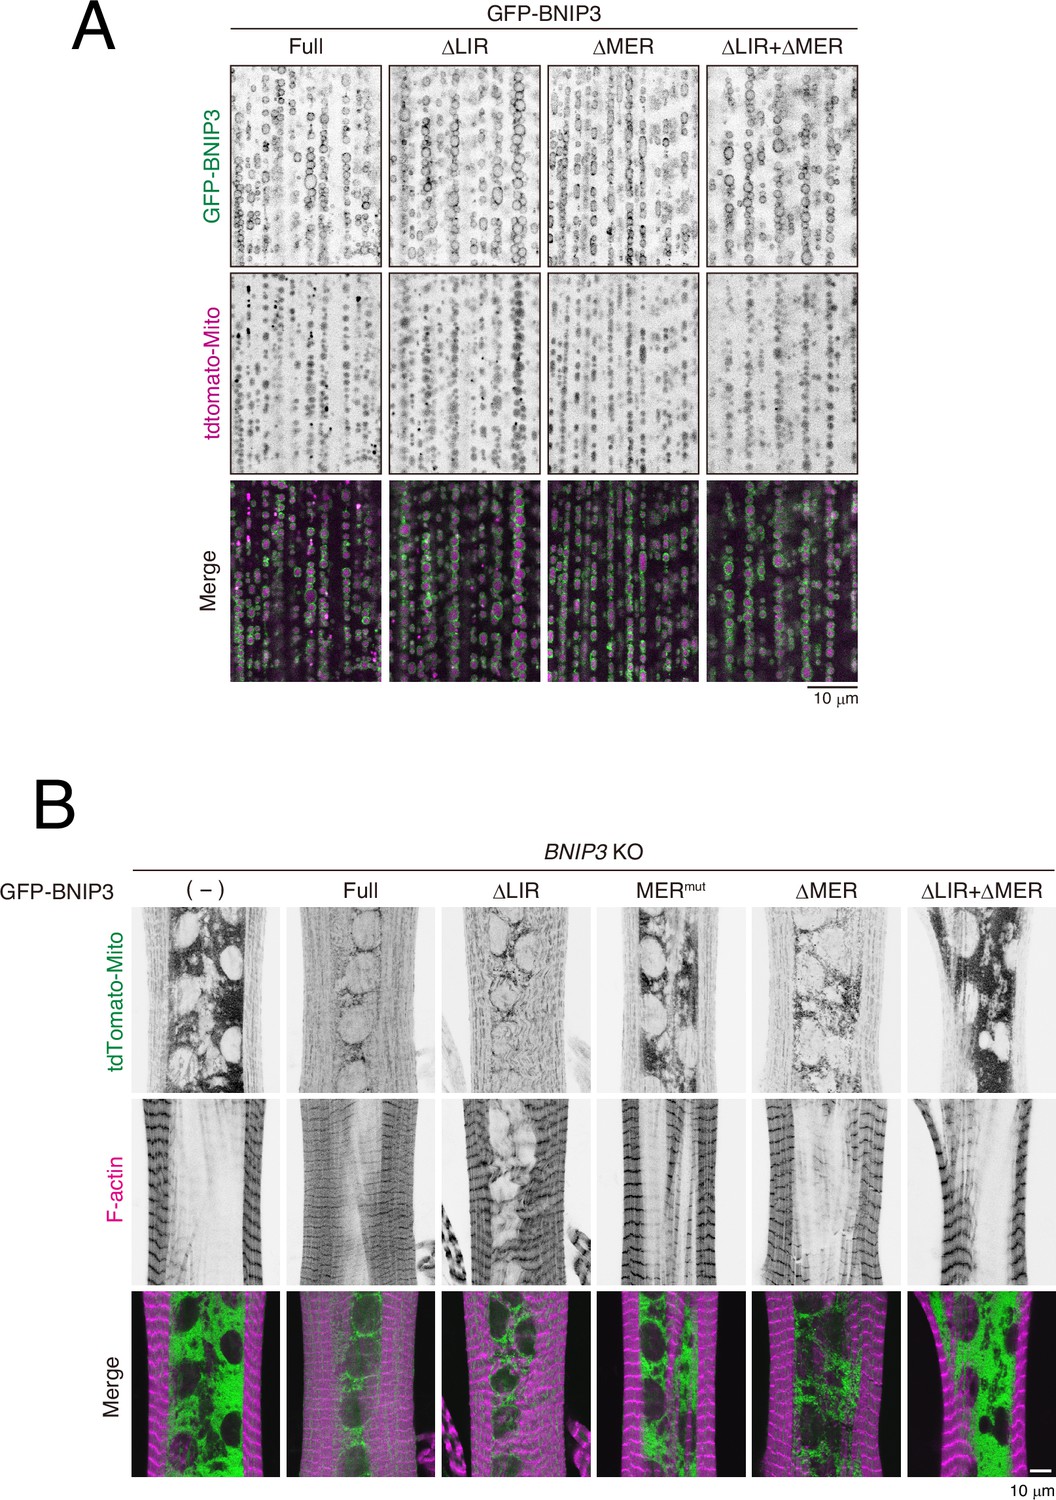
GFP-BNIP3 constructs localize to the outer mitochondrial membrane.
(A) Localization of GFP-BNIP3 constructs and mitochondria matrix-targeted tdTomato (tdTomato-Mito) in 3IL BWMs. (B) BNIP3 rescue experiment in dorsal internal oblique muscles (DIOMs) at 4 d APF. The indicated GFP-tagged BNIP3 constructs and tdTomato-Mito were co-expressed in BNIP3 KO flies using the GAL4/UAS system. Individual fluorescence channels are displayed separately.
Figure 5—figure supplement 2

Effect of GFP-BNIP3 overexpression on mitophagy flux in 3IL BWMs.
GFP-BNIP3 or mitochondria matrix-targeted GFP (Mito-GFP) were overexpressed together with tdTomato-Mito in 3IL BWMs. No clear difference in tdTomato-Mito signal was observed between samples with or without GFP-BNIP3 overexpression.
Figure 6 with 1 supplement
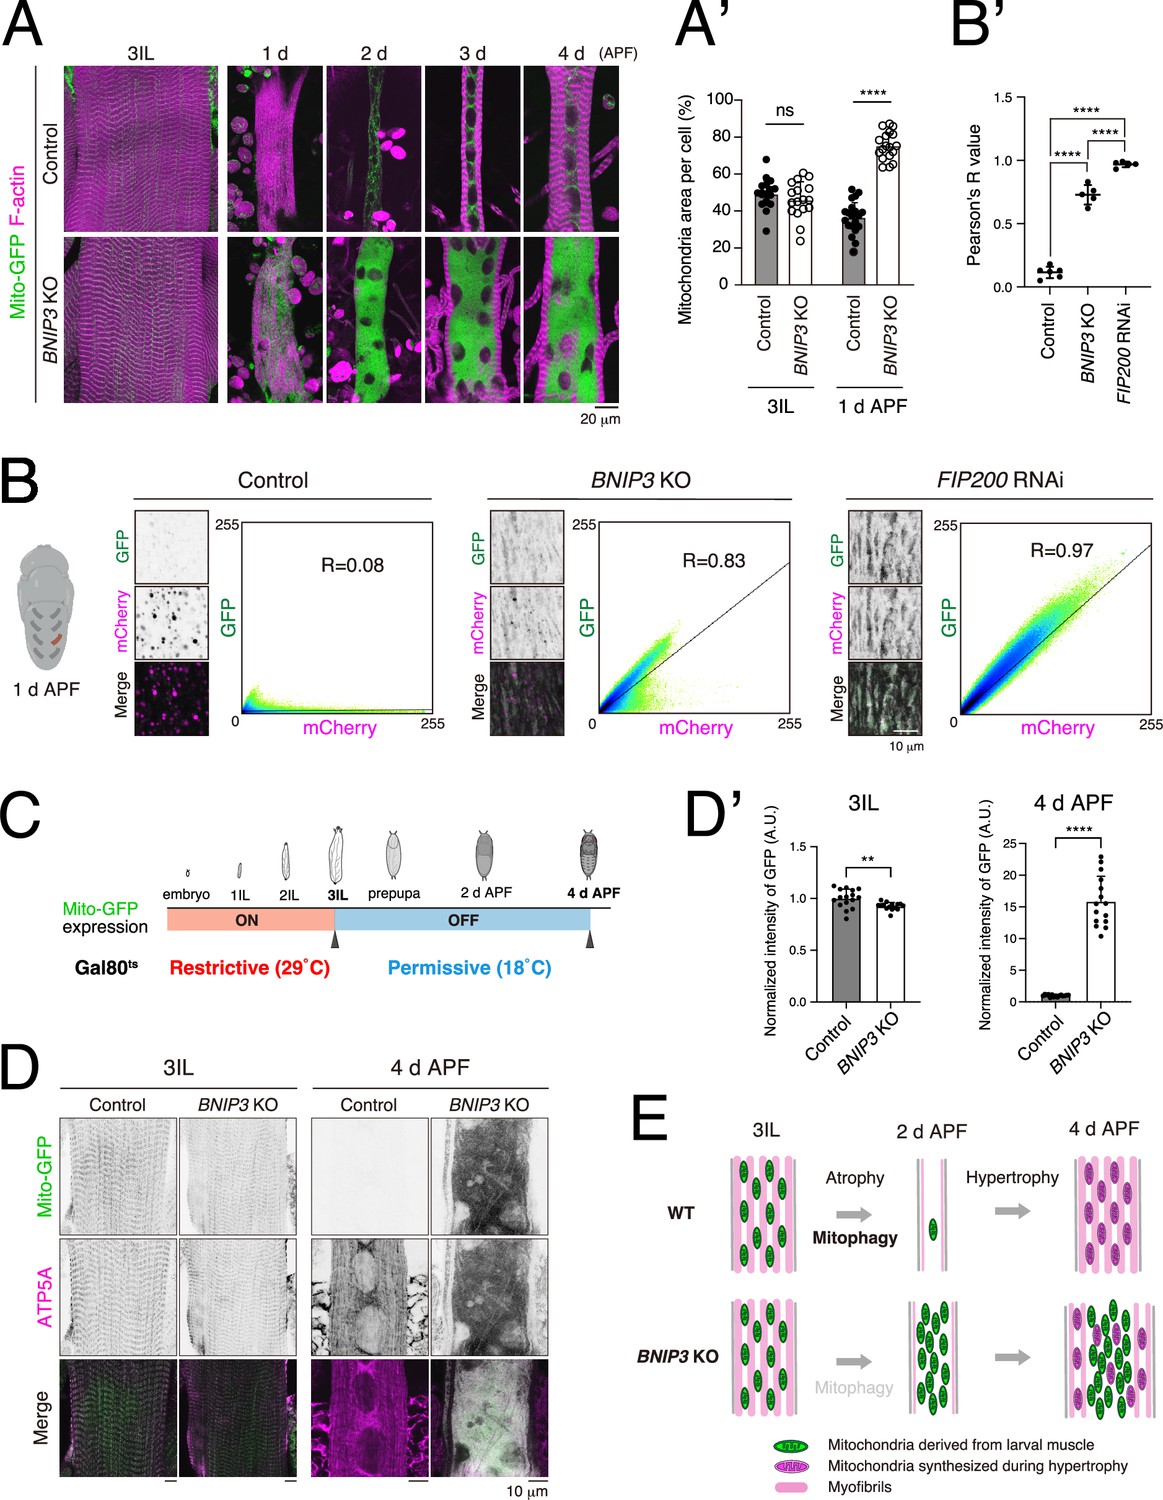
BNIP3-mediated mitophagy eliminates larval muscle mitochondria during muscle remodeling.
(A, A’) Time-course microscopy of Mito-GFP and F-actin in control or BNIP3 KO during dorsal internal oblique muscle (DIOM) remodeling (A). Single-channel images corresponding to the merged panels are presented in Figure 6—figure supplement 1A. Mitochondrial area relative to total cell area. For 3IL, control, N = 18; BNIP3 KO, N = 17. For 1 d APF, control, N = 20; BNIP3 KO, N = 18 (Mann–Whitney test) ****p < 0.00001 (A’). (B, B’) Mitophagy assay using Mito-QC in DIOMs at 1 d APF. Pixel intensity correlation profiles and Pearson’s correlation coefficients (R values) are shown. Control, N = 6; BNIP3 KO, N = 5. FIP200 RNAi, N = 5 (Sidak’s test) ****p < 0.00001. (C, D, D’) Scheme of the use of GAL80 temperature-sensitive mutants (GAL80ts). The animals were raised at 29°C (Restrictive) to induce Mito-GFP expression until mid-3IL, then shifted to 18°C (Permissive) to block expression (C). Mito-GFP and ATP5A immunostaining (total mitochondria) signals in muscles at 3IL or 4 d APF (D). Mito-GFP intensities in muscles at each time point normalized to control (set to 1). For 3IL, control, N = 16; BNIP3 KO, N = 15. For 1 d APF, control, N = 15; BNIP3 KO, N = 15 (Mann–Whitney test) **p < 0.001 and ****p < 0.00001 (D’). (E) A model of muscle remodeling with or without BNIP3. Loss of BNIP3 leads to mitochondrial accumulation, which disrupts muscle remodeling.
Figure 6—figure supplement 1
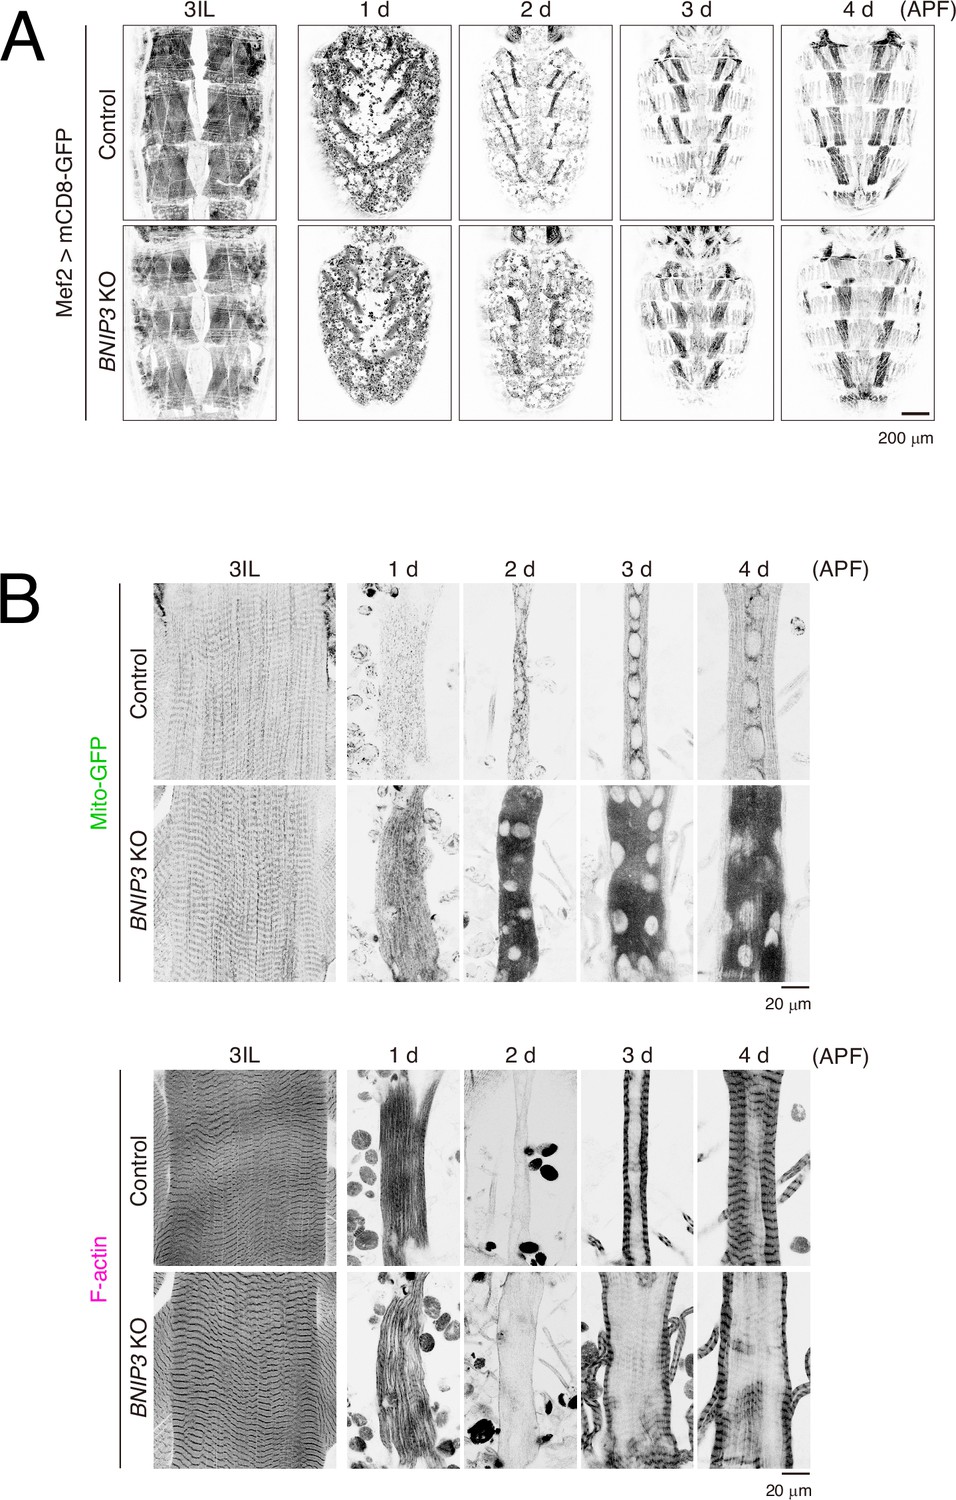
The impact of BNIP3 knockout on the shape of the dorsal internal oblique muscle (DIOM) during metamorphosis.
(A) Time-course microscopy of mCD8-GFP in dorsal muscles imaged through the cuticle in control and BNIP3 KO animals from 3IL to 4 d APF. (B) Time-course microscopy of Mito-GFP and F-actin in control or BNIP3 KO during DIOM remodeling. Individual fluorescence channels are displayed separately.
Tables
Appendix 1—key resources table
| Reagent type (species) or resource | Designation | Source or reference | Identifiers | Additional information |
|---|---|---|---|---|
| Gene (Drosophila melanogaster) | BNIP3 | GenBank | FLYB:FBgn0037007 | |
| Gene (Drosophila melanogaster) | Atg18a | GenBank | FLYB:FBgn0035850 | |
| Gene (Drosophila melanogaster) | Atg17 (FIP200) | GenBank | FLYB:FBgn0037363 | |
| Gene (Drosophila melanogaster) | Stx17 | GenBank | FLYB:FBgn0035540 | |
| Gene (Drosophila melanogaster) | Atg101 | GenBank | FLYB:FBgn0030960 | |
| Strain, strain background (Escherichia coli) | DH5α | Nippon Gene | Cat# 314-06234 | Competent cells |
| Antibody | anti-ATP5A (Mouse monoclonal) | Abcam | Cat# ab14748, RRID:AB_301447 | IF (1:300) |
| Antibody | anti-HA (Rat monoclonal) | Roche | Cat# 11867423001, RRID:AB_390918 | WB (1:1000) |
| Antibody | anti-GFP (Rabbit polyclonal) | MBL | Cat#598, RRID:AB_591816 | WB (1:2000) |
| Antibody | anti- Fibrillarin (Rabbit polyclonal) | Abcam | Cat# ab5821, RRID:AB_2105785 | IF (1:300) |
| Antibody | anti-rabbit IgG Alexa Fluor 594 conjugate (Goat polyclonal) | Thermo Fisher Scientific | Cat# A11012, RRID:AB_2534079 | IF (1:400) |
| Antibody | anti-mouse IgG Alexa Fluor 488 conjugate (Goat polyclonal) | Thermo Fisher Scientific | Cat# A11001, RRID:AB_2534069 | IF (1:400) |
| Antibody | anti-mouse IgG Alexa Fluor 594 conjugate (Goat polyclonal) | Thermo Fisher Scientific | Cat# A11005, RRID:AB_2534073 | IF (1:400) |
| Antibody | HRP-conjugated AffiniPure Goat Anti-Rabbit IgG (Goat polyclonal) | Jackson ImmunoResearch | Cat# 111-035-144, RRID:AB_2307391 | WB (1:10,000) |
| Antibody | AffiniPure Donkey Anti-Rat IgG (Donkey polyclonal) | Jackson ImmunoResearch | Cat# 712-005-153, RRID:AB_2340631 | WB (1:5000) |
| Recombinant DNA reagent | RE48077 (plasmid) | DGRC | DGRC Stock Number:9148 RRID:DGRC_9148 | BNIP3 cDNA |
| Recombinant DNA reagent | pUASt-attB-GFP (plasmid) | This paper | Backbone for UAS constructs with GFP. | |
| Recombinant DNA reagent | pUASt-attB-GFP-BNIP3_full (plasmid) | This paper | Plasmid construct of GFP-tagged full-length BNIP3 under UAS control. | |
| Recombinant DNA reagent | pUAST-attB-BNIP3_ΔLIR (plasmid) | This paper | GFP-BNIP3 construct with mutations in LIR motif (W16A/L19A). | |
| Recombinant DNA reagent | pUAST-attB-BNIP3_MERmut (L49A) (plasmid) | This paper | GFP-BNIP3 construct with mutation in MER motif (L49A). | |
| Recombinant DNA reagent | pUAST-attB-BNIP3_ΔMER (plasmid) | This paper | GFP-BNIP3 construct with deletion in MER motif (G42 to Q53). | |
| Recombinant DNA reagent | pUAST-attB-BNIP3_ΔLIR+ΔMER (plasmid) | This paper | GFP-BNIP3 construct with mutations in LIR and deletion in MER motifs. | |
| Recombinant DNA reagent | pMRX-IRES-puro-GFP-BNIP3_full (plasmid) | This paper | Mammalian expression construct encoding full-length dmBNIP3. | |
| Recombinant DNA reagent | pMRX-IRES-puro-GFP-BNIP3_ΔMER (plasmid) | This paper | Mammalian expression construct encoding ΔMER dmBNIP3. | |
| Recombinant DNA reagent | LD38705 (plasmid) | DGRC | DGRC Stock Number:2722 RRID:DGRC_2722 | Atg18a cDNA |
| Recombinant DNA reagent | pMRX-IRES-puro-3xHA-mCh-Atg18a (plasmid) | This paper | Mammalian expression construct encoding 3xHA-mCherry-dmAtg18a. | |
| Sequence-based reagent | Forward primer for BNIP3 CDS | This paper | PCR primers | 5′-ATGTCTACGACACCAAAATCGAG-3′ |
| Sequence-based reagent | Reverse primer for BNIP3 CDS | This paper | PCR primers | 5′-TCAGTCAATGACCACACGG-3′ |
| Sequence-based reagent | Forward primer for plasmid construction of pUASt-attB-GFP-BNIP3_full | This paper | PCR primers | 5′-CGTGTGGTCATTGACTGAGCGGCCGCGGCTCGAGGGTACC-3′ |
| Sequence-based reagent | Reverse primer for plasmid construction of pUASt-attB-GFP-BNIP3_full | This paper | PCR primers | 5′-TTGGTGTCGTAGACATGGTGAAGGGGGCGGCCGCGGAG-3′ |
| Sequence-based reagent | Forward primer for ΔLIR in BNIP3 | This paper | PCR primers | 5′-CTGCGATCGAAGCGAGCACAACAGCTGCGATG-3′ |
| Sequence-based reagent | Reverse primer for ΔLIR in BNIP3 | This paper | PCR primers | 5′-CTCGCTTCGATCGCAGATTCGCCCAGCAAATC-3′ |
| Sequence-based reagent | Forward primer for MER mut (L49A) in BNIP3 | This paper | PCR primers | 5′-AGACTTGCGCGCGAGGCCCAGCGCGAG-3′ |
| Sequence-based reagent | Reverse primer for MER mut (L49A) in BNIP3 | This paper | PCR primers | 5′-CTCGCGCGCAAGTCTCAGGTACTCCTC-3′ |
| Sequence-based reagent | Forward primer for ΔMER in BNIP3 | This paper | PCR primers | 5′-CAACAATCGCGAGTCGAACCAGTCG-3′ |
| Sequence-based reagent | Reverse primer for ΔMER in BNIP3 | This paper | PCR primers | 5′-GACTCGCGATTGTTGAATGGCAACGG-3′ |
| Sequence-based reagent | Upstream gRNA for BNIP3 KO | This paper | gRNA | 5′-CGTCAACACCAAAGATAACT[TGG]-3′ |
| Sequence-based reagent | Downstream gRNA for BNIP3 KO | This paper | gRNA | 5′-CTTTCAGTCAATGACCACAC[GGG]-3′ |
| Sequence-based reagent | Upstream gRNA for Atg101 KO | This paper | gRNA | 5′-GTCCACCTGACGACCCTCCA[TGG]-3′ |
| Sequence-based reagent | Downstream gRNA for Atg101 KO | This paper | gRNA | 5′-CTCGCAATGTGACGGGCTGT[CGG]-3′ |
| Commercial assay or kit | ReliaPrep RNA Miniprep Systems | Promega | Cat#: Z6111 | |
| Commercial assay or kit | MEGAscript T7 kit | Thermo Fisher Scientific | Cat#: AM1334 | |
| Commercial assay or kit | RNA 6000 Pico Kit | Agilent | Cat#: 5067–1513 | |
| Commercial assay or kit | FluorSave reagent | Merck Millipore | Cat#: 345789 | |
| Commercial assay or kit | KOD One PCR Master Mix | TOYOBO | Cat#: KMM-101 | |
| Commercial assay or kit | PrimeSTAR GXL Premix | Takara Bio | Cat#: R051A | |
| Commercial assay or kit | Can Get Signal Solution 1 | TOYOBO | Cat#: NKB-201 | |
| Commercial assay or kit | Clarity Western ECL Substrate | Bio-Rad | Cat#: 1705060 | |
| Commercial assay or kit | jetPRIME transfection reagent | Polyplus-transfection | Cat#: 101000015 | |
| Chemical compound, drug | Epon 812 | TABB | Cat#: 342 | |
| Chemical compound, drug | Protease Inhibitor Cocktail | Nacalai Tesque | Cat#: 03969-34 | |
| Software, algorithm | HISAT2 | Johns Hopkins University | RRID:SCR_015530 | |
| Software, algorithm | featureCounts | PMID:24227677 | RRID:SCR_012919 | |
| Software, algorithm | UMI-tools | PMID:28100584 | RRID:SCR_017048 | |
| Software, algorithm | DESeq2 | Bioconductor | RRID:SCR_015687 | |
| Software, algorithm | pheatmap | CRAN | RRID:SCR_016418 | |
| Software, algorithm | prcomp | R base package | ||
| Software, algorithm | Mfuzz | Bioconductor | RRID:SCR_000523 | |
| Software, algorithm | FLUOVIEW | EVIDENT | ||
| Software, algorithm | ImageJ | NIH | RRID:SCR_003070 | |
| Software, algorithm | PyMOL | Schrödinger | RRID:SCR_000305 | |
| Software, algorithm | R programming language | CRAN | RRID:SCR_001905 | |
| Software, algorithm | AlphaFold Server | DeepMind | ||
| Software, algorithm | GraphPad Prism | GraphPad | RRID:SCR_002798 | Version 9.5.1 |
| Other | Alexa Fluor 633 Phalloidin | Thermo Fisher Scientific | Cat#: A22284 | (1:200). |
| Other | Bisbenzimide H33342 Fluorochrome Trihydrochloride DMSO Solution | Nacalai Tesque | Cat#: 04915-81 | (1:10,000 dilution) |
| Other | GFP-Trap Agarose | Chromotek | Cat#: gta |
Additional files
-
Supplementary file 1
Normalized counts from time-course RNA-seq of dorsal internal oblique muscle (DIOM) remodeling during metamorphosis.
- https://cdn.elifesciences.org/articles/105834/elife-105834-supp1-v1.xlsx
-
Supplementary file 2
Raw data files corresponding to all quantified results presented in the manuscript.
- https://cdn.elifesciences.org/articles/105834/elife-105834-supp2-v1.xlsx
-
Supplementary file 3
Detailed Drosophila genotypes, developmental stages, and experimental temperatures are provided.
- https://cdn.elifesciences.org/articles/105834/elife-105834-supp3-v1.xlsx
-
MDAR checklist
- https://cdn.elifesciences.org/articles/105834/elife-105834-mdarchecklist1-v1.pdf
Download links
A two-part list of links to download the article, or parts of the article, in various formats.
Downloads (link to download the article as PDF)
Open citations (links to open the citations from this article in various online reference manager services)
Cite this article (links to download the citations from this article in formats compatible with various reference manager tools)
Transcriptional dynamics uncover the role of BNIP3 in mitophagy during muscle remodeling in Drosophila
eLife 14:RP105834.
https://doi.org/10.7554/eLife.105834.3


