Structural insights into heterohexameric assembly of epilepsy-related ligand–receptor complex LGI1–ADAM22
- Department of Chemistry, Graduate School of Science, Kyoto University, Japan
- Laboratory for Protein Functional and Structural Biology, RIKEN Center for Integrative Medical Sciences, Japan
- Division of Molecular and Cellular Pharmacology, Nagoya University Graduate School of Medicine, Japan
- Division of Neuropharmacology, Nagoya University Graduate School of Medicine, Japan
- Institute for Frontier Science Initiative, Kanazawa University, Japan
- WPI Nano Life Science Institute (WPI-NanoLSI), Kanazawa University, Japan
Figures
Figure 1 with 4 supplements
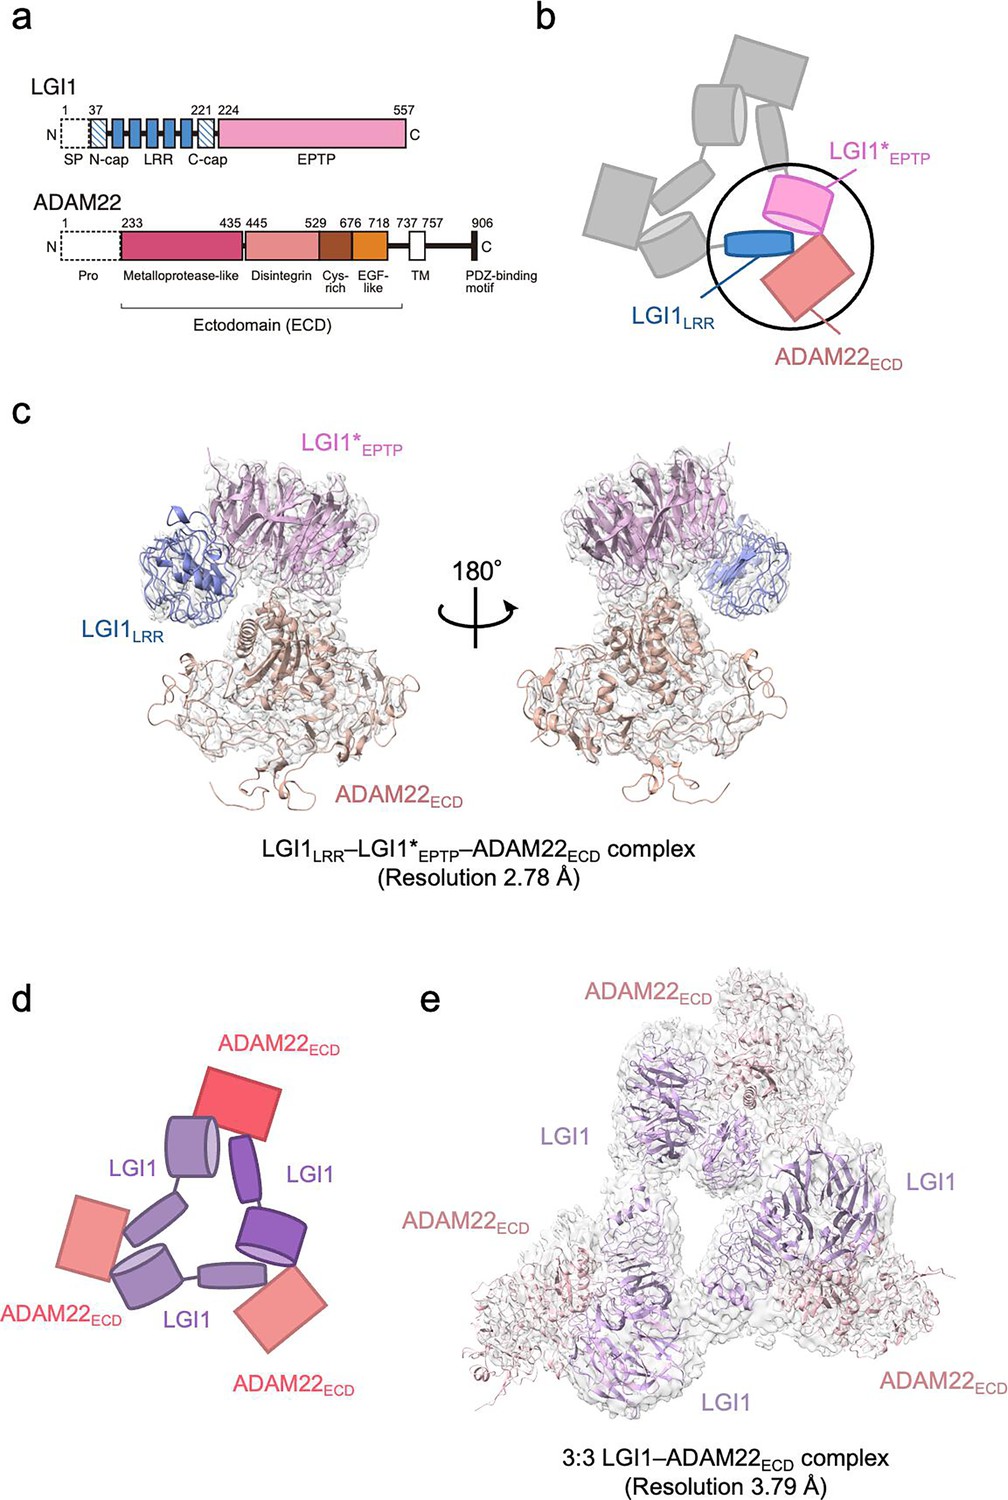
Structure of the LGI1–ADAM22ECD complex.
(a) Domain organizations of LGI1 and ADAM22. LGI1 consists of the leucine-rich repeat (LRR) (blue) and epitempin-repeat (EPTP) (pink) domains. The N-terminal secretion signal peptide (SP, enclosed by dotted lines) is removed in the secreted LGI1. The shaded blue boxes represent the N- and C-terminal caps, whereas the filled blue boxes represent the LRRs. The premature form of ADAM22 contains the N-terminal prosequence (enclosed by dotted lines). The mature ADAM22 consists of the metalloprotease-like (magenta), disintegrin (salmon pink), cysteine-rich (brown), EGF-like (orange), transmembrane (TM; white), and cytoplasmic domains. The major ADAM22 isoform has a PDZ-binding motif in the C-terminal of the cytoplasmic domain. (b) Schematic diagram of the LGI1LRR–LGI1*EPTP–ADAM22ECD complex. The black circle indicates the location of this complex within the 3:3 LGI1–ADAM22 complex. * indicates a distinct molecule. (c) Cryo-electron microscopy (cryo-EM) map and structure of the LGI1LRR–LGI1*EPTP–ADAM22ECD complex at 2.78 Å resolution. (d) Schematic diagram of the 3:3 LGI1–ADAM22ECD complex. (e) Cryo-EM map and structure of the 3:3 LGI1–ADAM22ECD complex at 3.79 Å resolution.
Figure 1—figure supplement 1
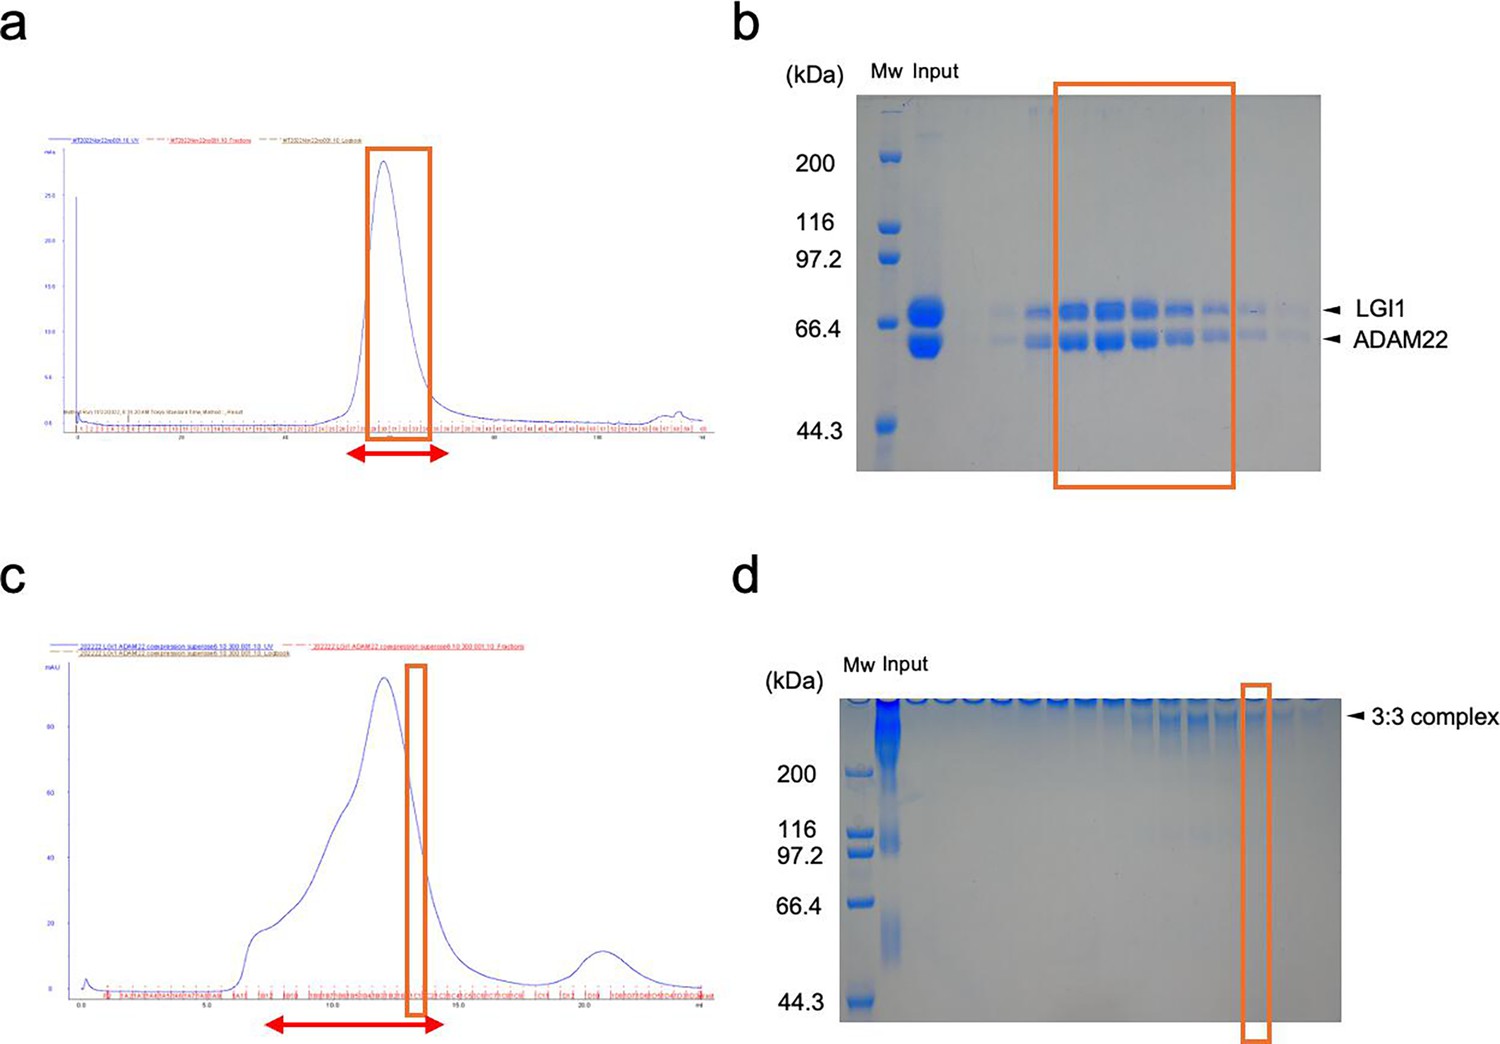
Purification of the 3:3 LGI1–ADAM22ECD complex.
(a, b) Gel filtration chromatography (a) and SDS-PAGE (b) of the 3:3 LGI1–ADAM22ECD complex before cross-linking. The red arrow indicates the fractions subjected to SDS-PAGE. The orange boxes represent the fractions used for cross-linking. (c, d) Gel filtration chromatography (c) and SDS-PAGE (d) of the 3:3 LGI1–ADAM22ECD complex after cross-linking. The red arrow indicates the fractions subjected to SDS-PAGE. The orange boxes represent the fraction used for cryo-electron microscopy (cryo-EM) analysis.
-
Figure 1—figure supplement 1—source data 1
Original files for SDS-PAGE analysis displayed in Figure 1—figure supplement 1b (P1080457.RW2) and Figure 1—figure supplement 1d (P1080458.RW2).
- https://cdn.elifesciences.org/articles/105918/elife-105918-fig1-figsupp1-data1-v1.zip
-
Figure 1—figure supplement 1—source data 2
PDF file containing uncropped images of SDS-PAGE gels for Figure 1—figure supplement 1b and d, indicating the relevant bands.
- https://cdn.elifesciences.org/articles/105918/elife-105918-fig1-figsupp1-data2-v1.pdf
Figure 1—figure supplement 2
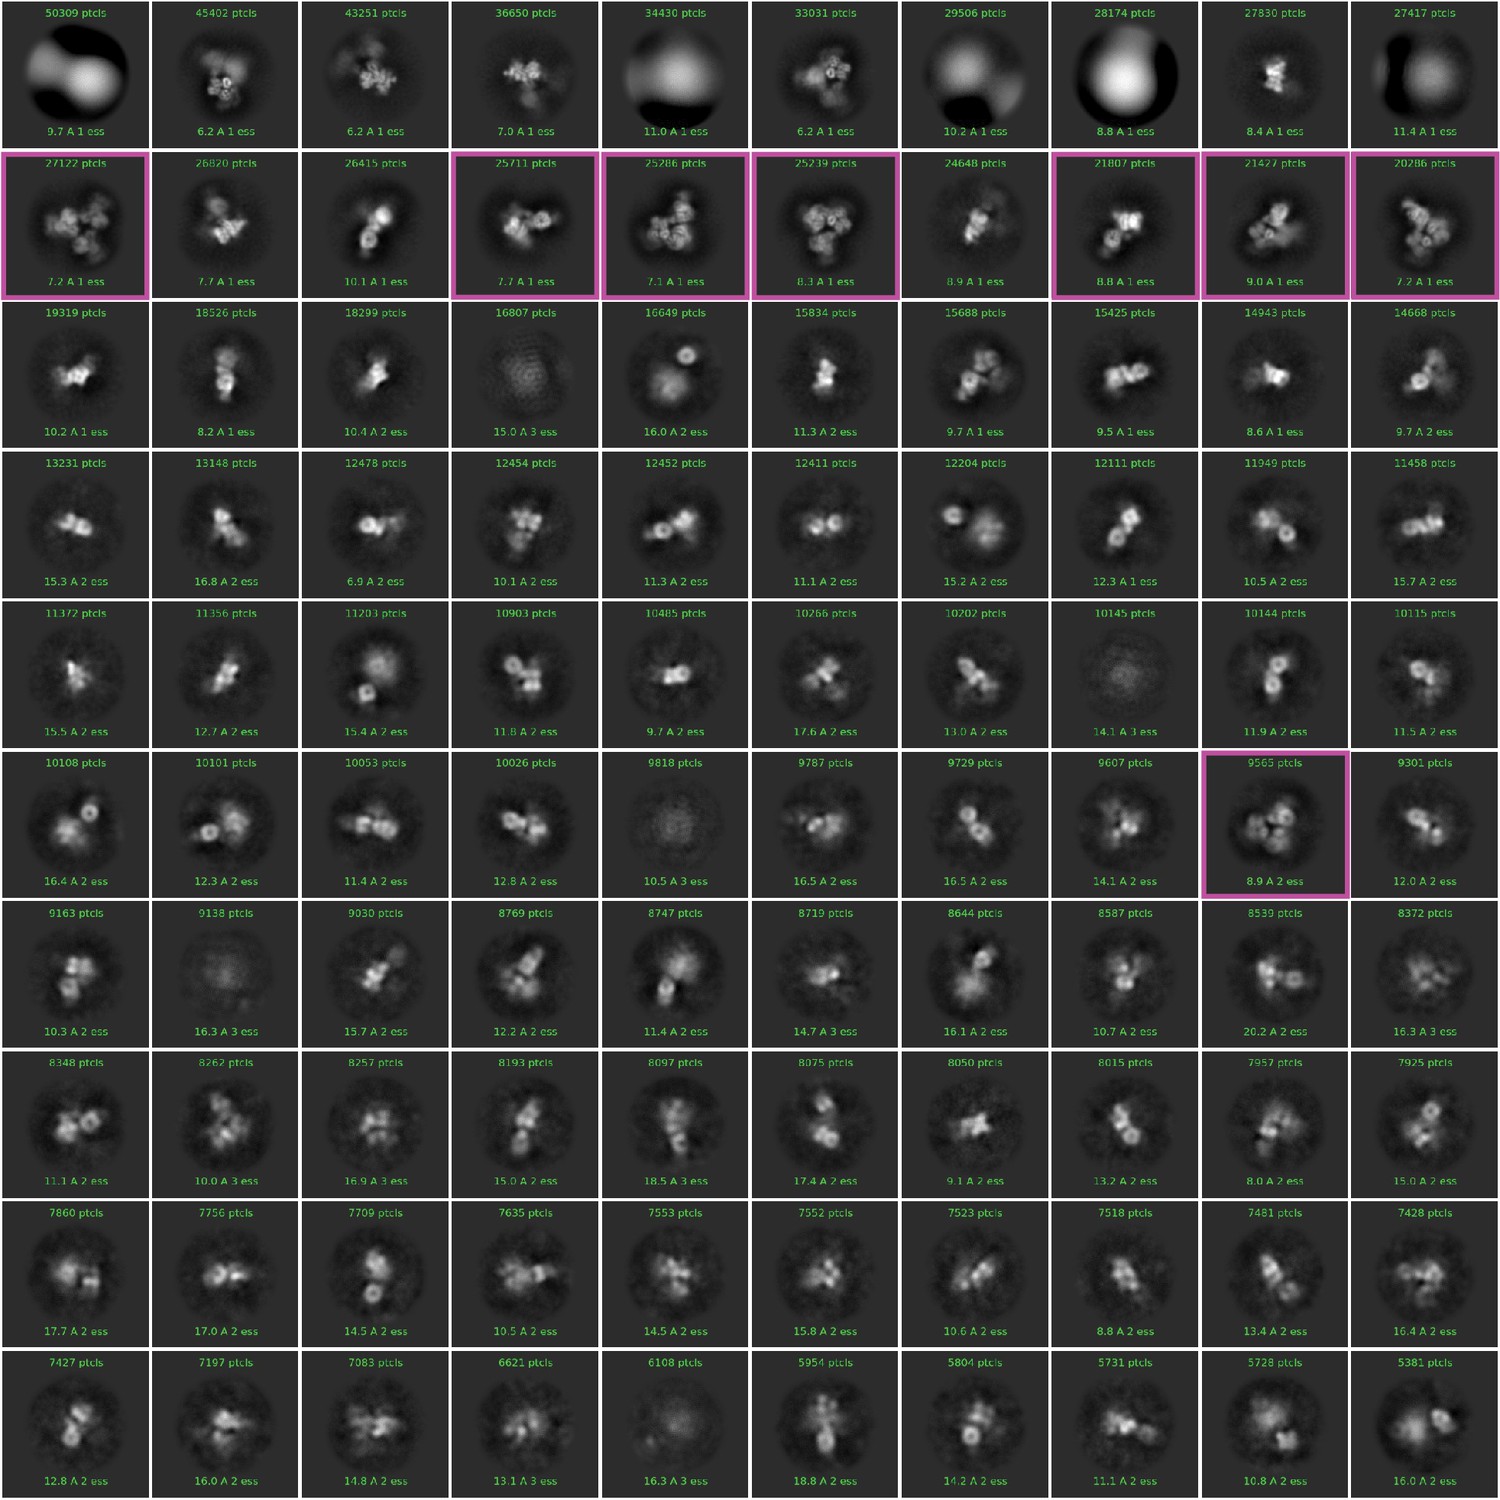
Two-dimensional (2D) class averages of the particles from blob picker in CryoSPARC.
1,403,037 particles were picked without templates and classified into 100 classes. The particle images surrounded by magenta boxes were selected as templates for template picking.
Figure 1—figure supplement 3
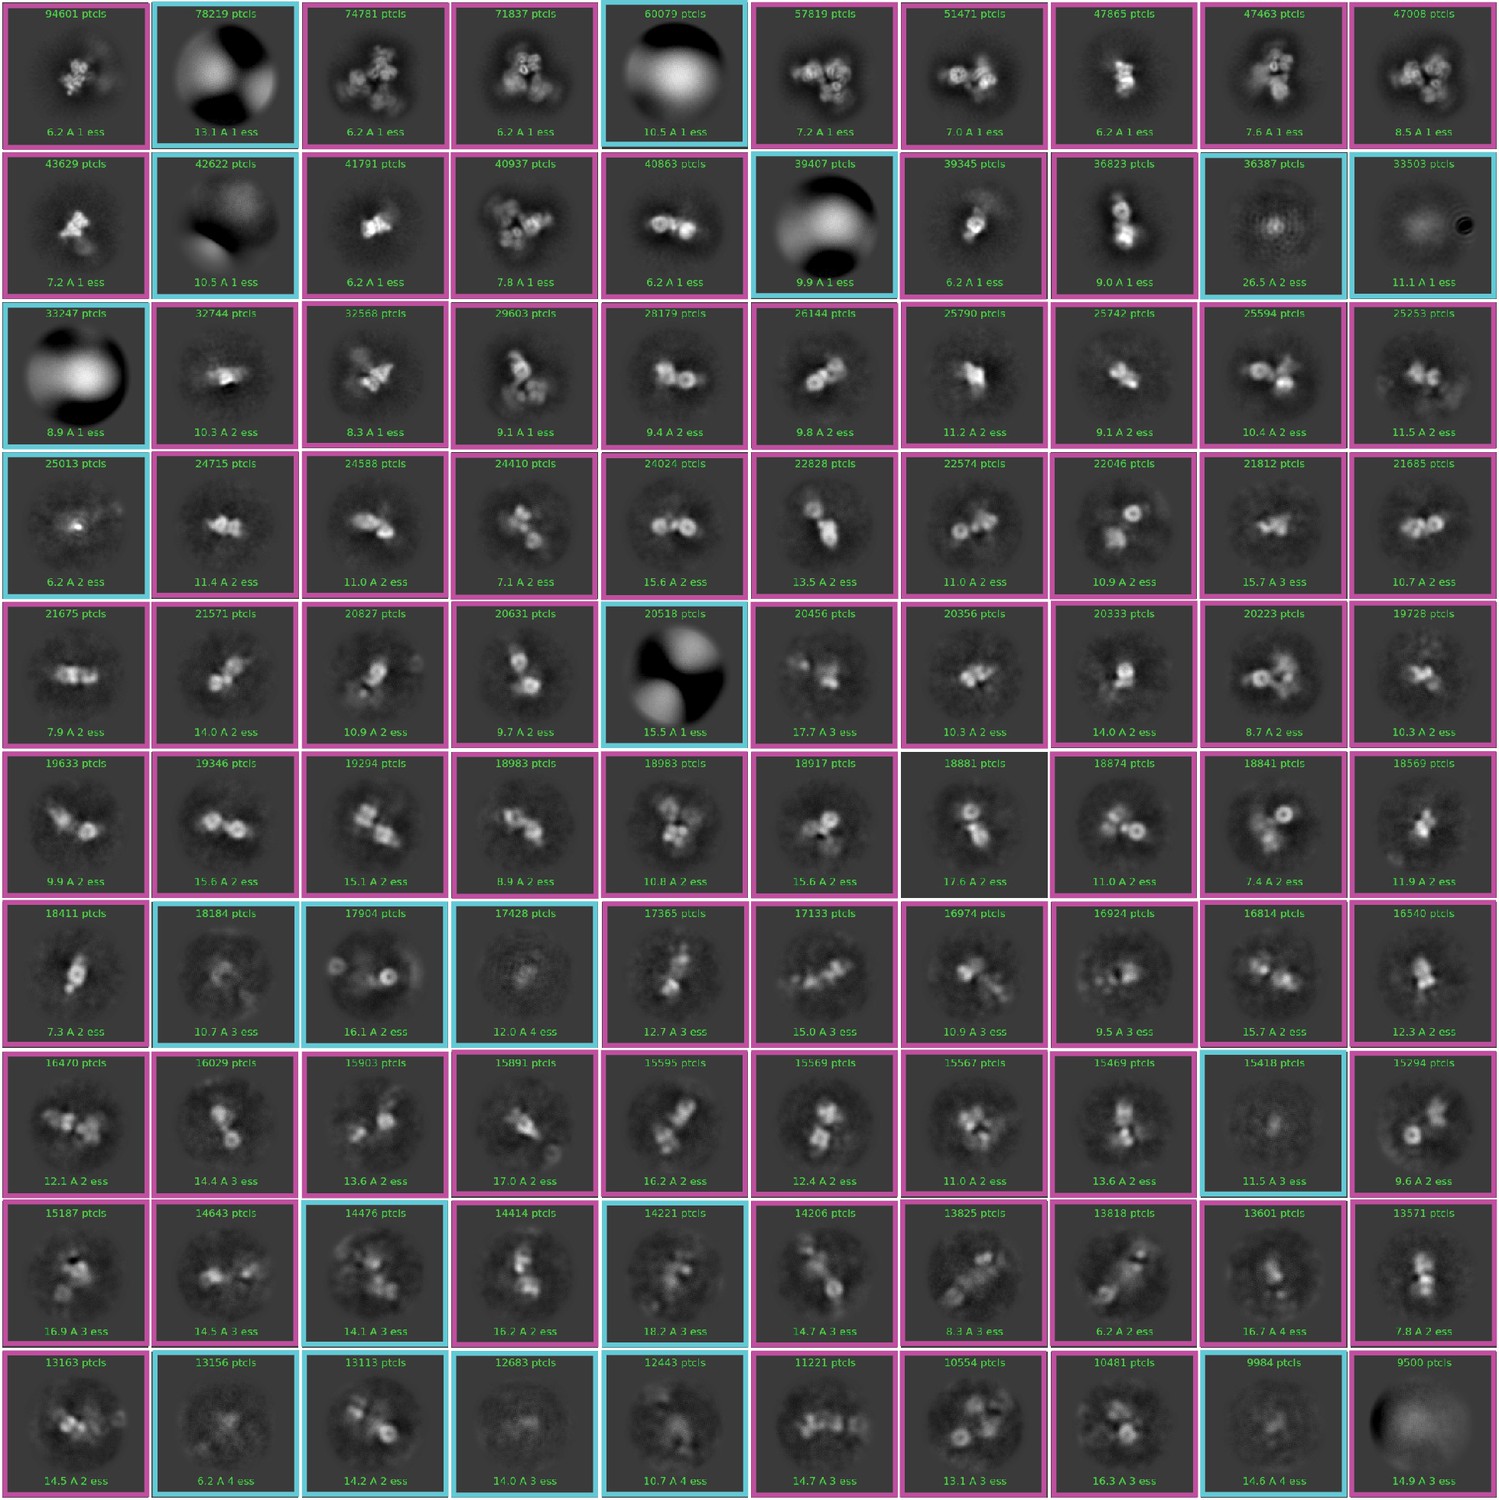
Two-dimensional (2D) class averages of the particles from template picker in CryoSPARC.
2,530,790 particles were picked with templates and classified into 100 classes. The particle images surrounded by magenta boxes were subjected to ab initio reconstruction, whereas those surrounded by cyan boxes were excluded.
Figure 1—figure supplement 4
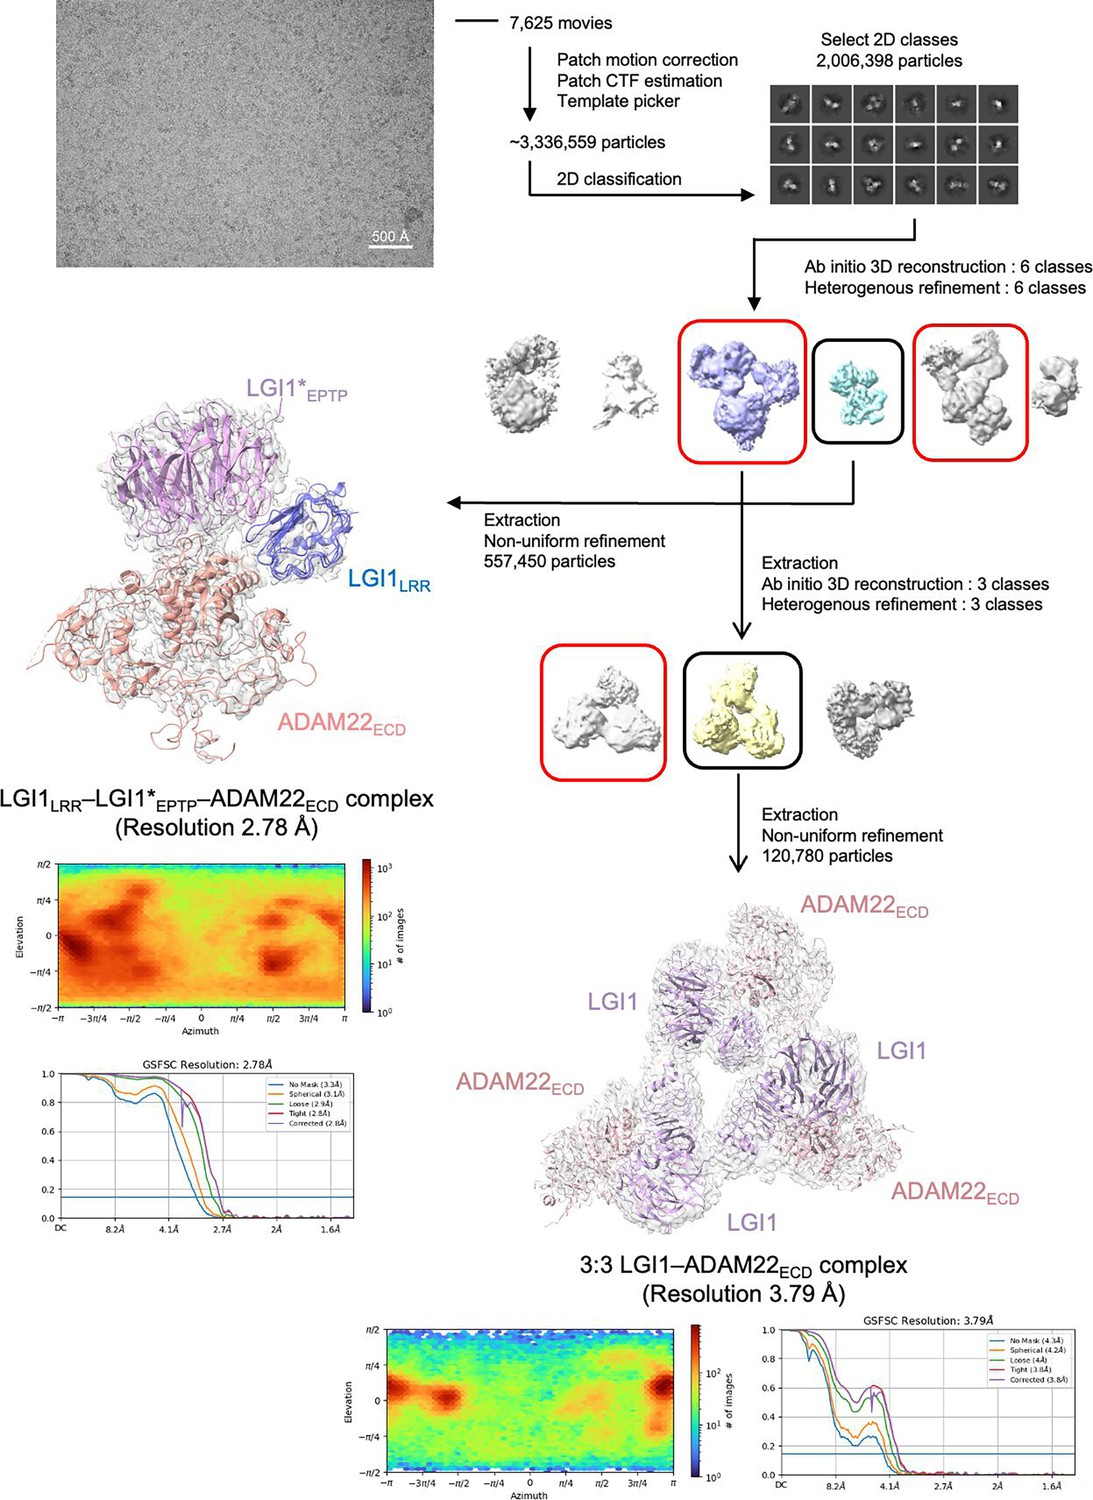
Cryo-electron microscopy (cryo-EM) data and processing for the LGI1LRR–LGI1*EPTP–ADAM22ECD and 3:3 LGI1–ADAM22ECD complexes.
Representative two-dimensional (2D) class averages are shown in the ‘Select 2D classes’. The obtained final maps are shown as white surfaces with protein structures. The red rounded boxes indicate the density maps that were supposed to correspond to the 3:3 LGI1–ADAM22ECD complex but were not used to calculate the final map.
Figure 2 with 1 supplement
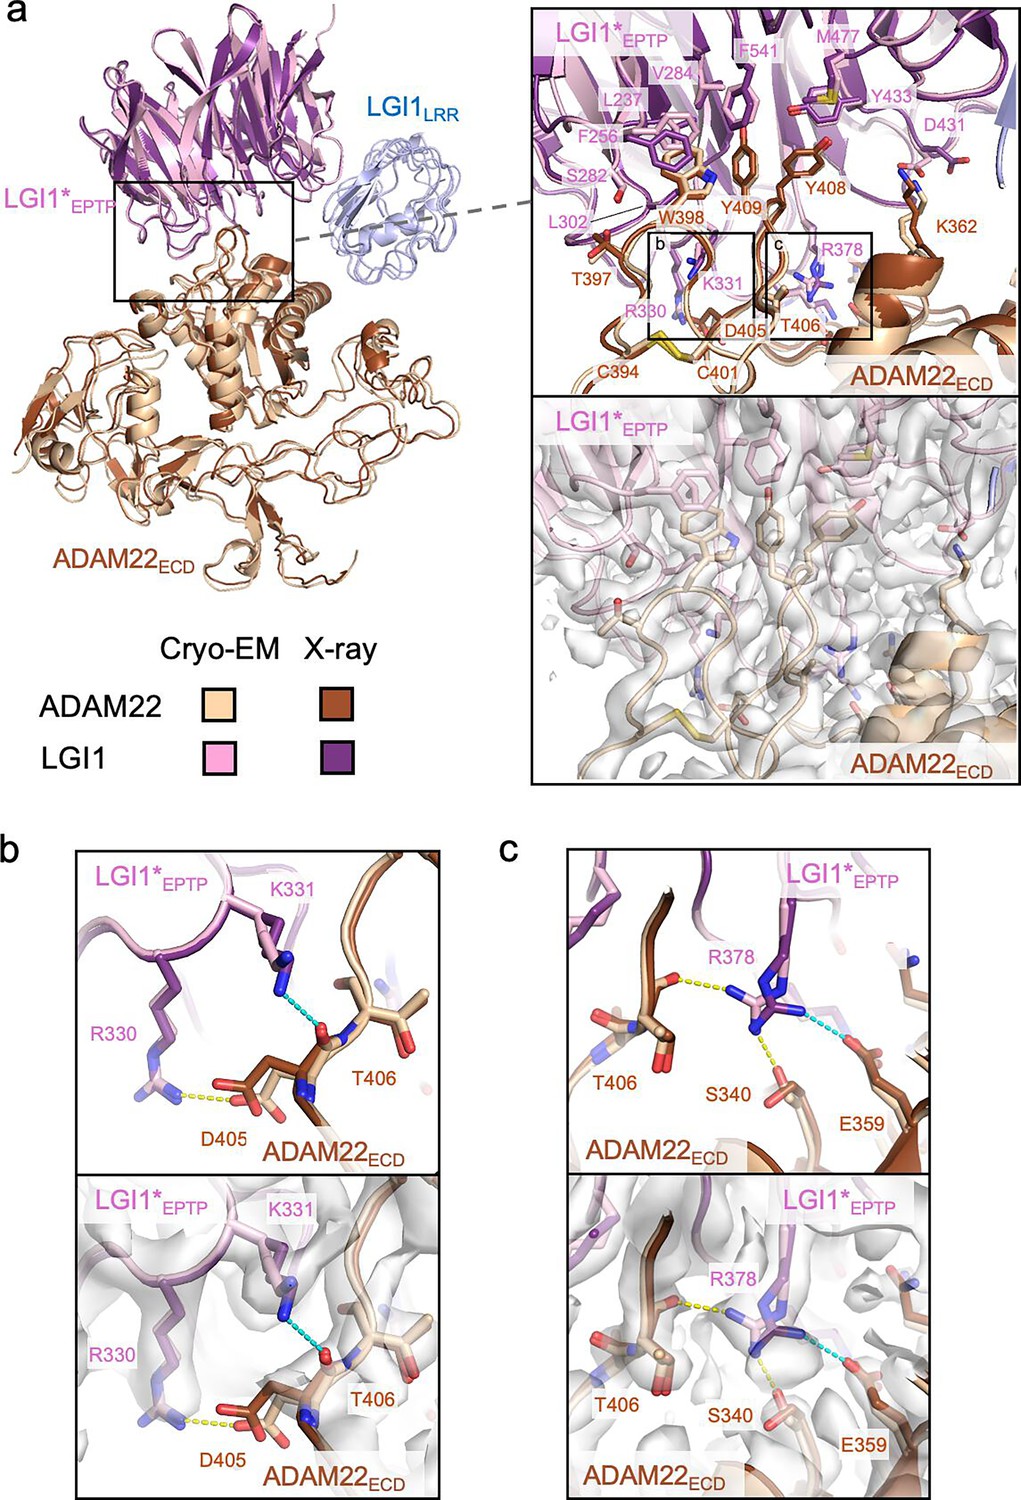
Interactions between LGI1EPTP and ADAM22ECD.
(a) Overall view of the cryo-electron microscopy (cryo-EM) structure of the LGI1LRR–LGI1*EPTP–ADAM22ECD complex and a magnified view of the interface between LGI1*EPTP and ADAM22ECD. The density map of the interface is shown as white surfaces. The previously reported X-ray structure of the LGI1EPTP–ADAM22ECD complex (PDB 5Y2Z) is superposed with distinct colors. Two boxes in the magnified view indicate the locations of the views shown in (b, left box) and (c, right box). (b) Close-up view of the interaction between Arg330 of LGI1*EPTP and Asp405 of ADAM22ECD. The structure (top) and corresponding map (bottom) are shown. Yellow and cyan dashed lines indicate a hydrogen bond observed in the cryo-EM and X-ray structures, respectively. (c) Close-up view of the interaction around Arg378 of LGI1. The structure (top) and corresponding map (bottom) are shown. Yellow and cyan dashed lines indicate hydrogen bonds observed in the cryo-EM and X-ray structures, respectively.
Figure 2—figure supplement 1
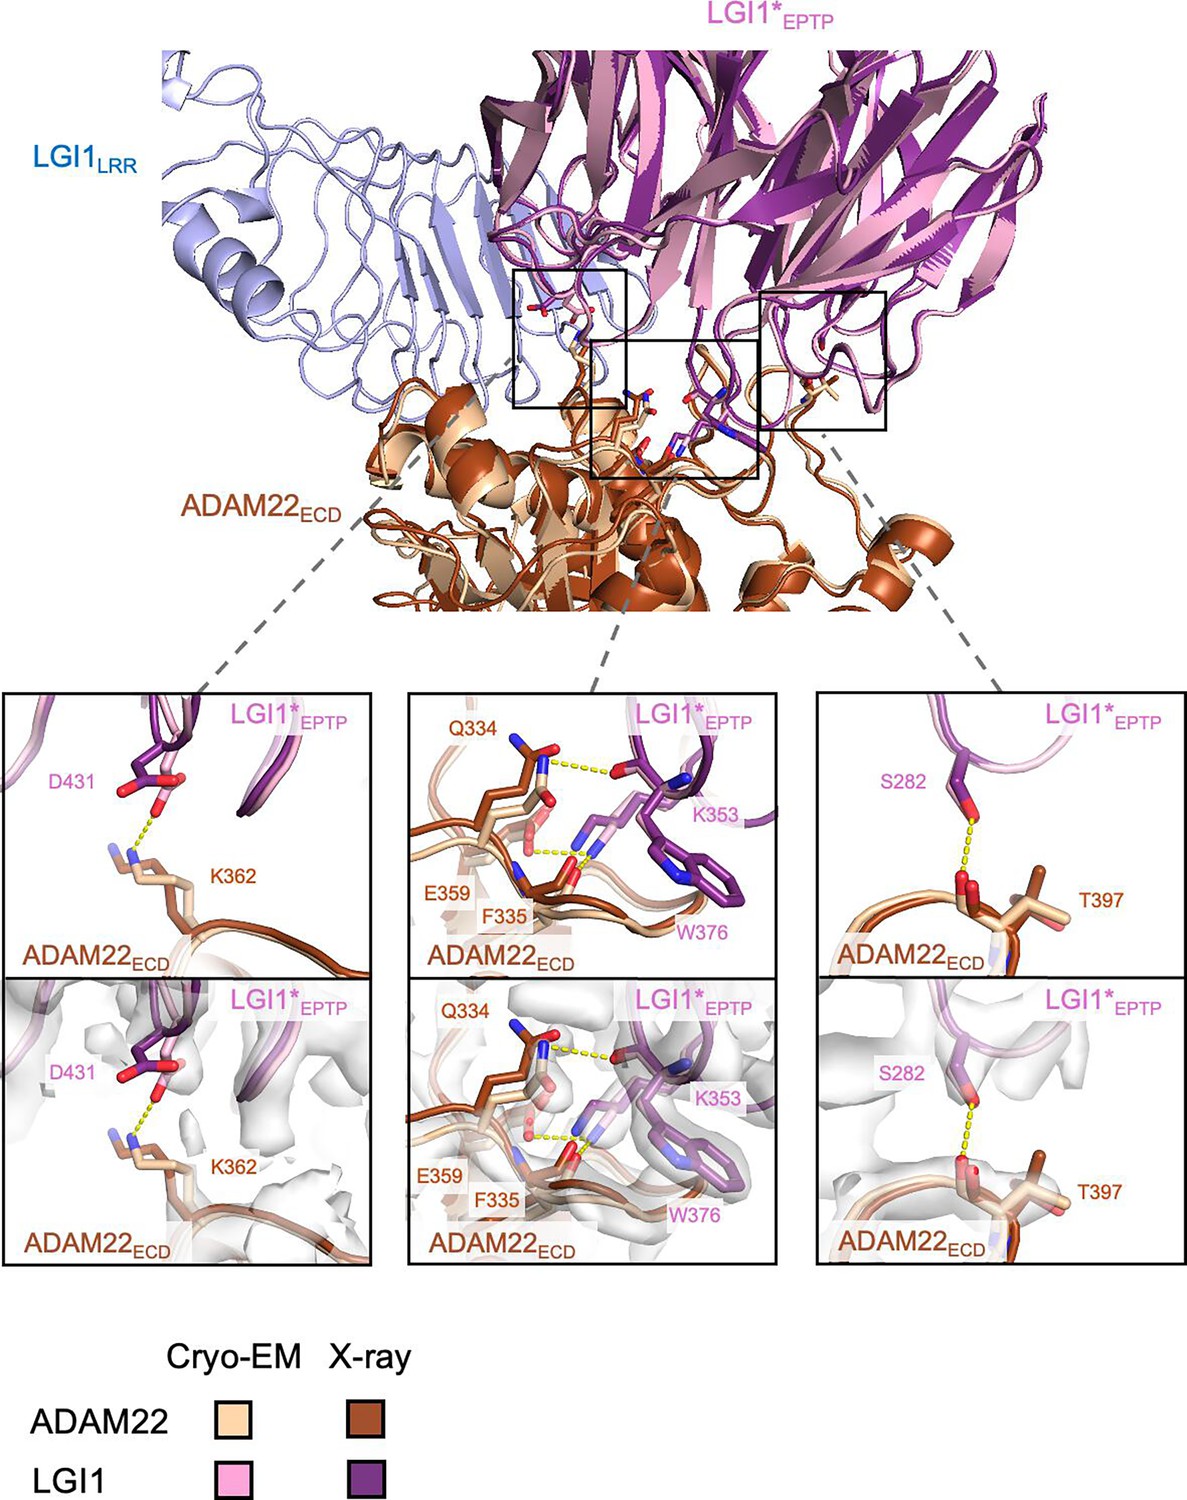
Comparison of the LGI1EPTP–ADAM22ECD interaction between the cryo-electron microscopy (cryo-EM) and crystal structures.
The present cryo-EM structure of the LGI1LRR–LGI1*EPTP–ADAM22ECD complex and the previous X-ray crystal structure of the LGI1EPTP–ADAM22ECD complex (PDB 5Y2Z) are superposed. Close-up views (bottom panels) highlight amino acid residues involved in hydrogen bonds between LGI1EPTP and ADAM22ECD that were observed in the cryo-EM structure but not in the previous X-ray structure. These hydrogen bonds are indicated by dashed yellow lines. Density maps are shown as white surfaces.
Figure 3 with 5 supplements
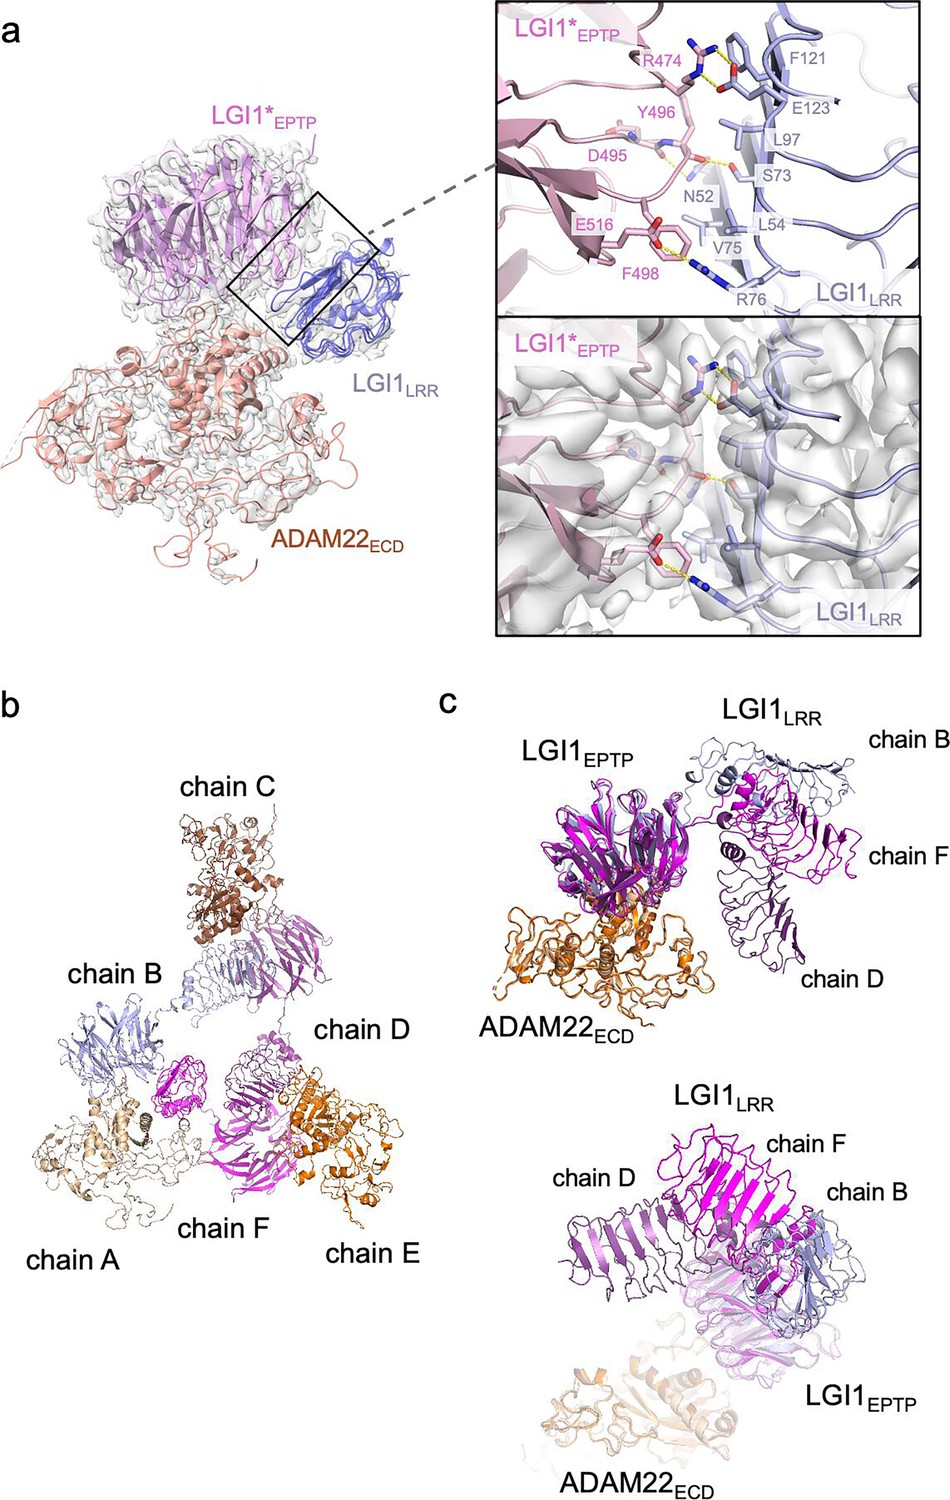
Structure and interaction of the higher-order LGI1–ADAM22ECD complex.
(a) Overall view of the cryo-electron microscopy (cryo-EM) structure of the LGI1LRR–LGI1*EPTP–ADAM22ECD complex and a magnified view of the interface between LGI1LRR and LGI1*EPTP. The density map of the interface is shown as white surfaces. (b) Chain IDs of the individual LGI1 or ADAM22ECD molecules in the 3:3 LGI1–ADAM22ECD complex, assigned in this study. (c) Superposition of the three LGI1–ADAM22ECD complexes in the cryo-EM structure of the 3:3 LGI1-ADAM22ECD complex, using LGI1EPTP–ADAM22ECD as the reference.
Figure 3—figure supplement 1
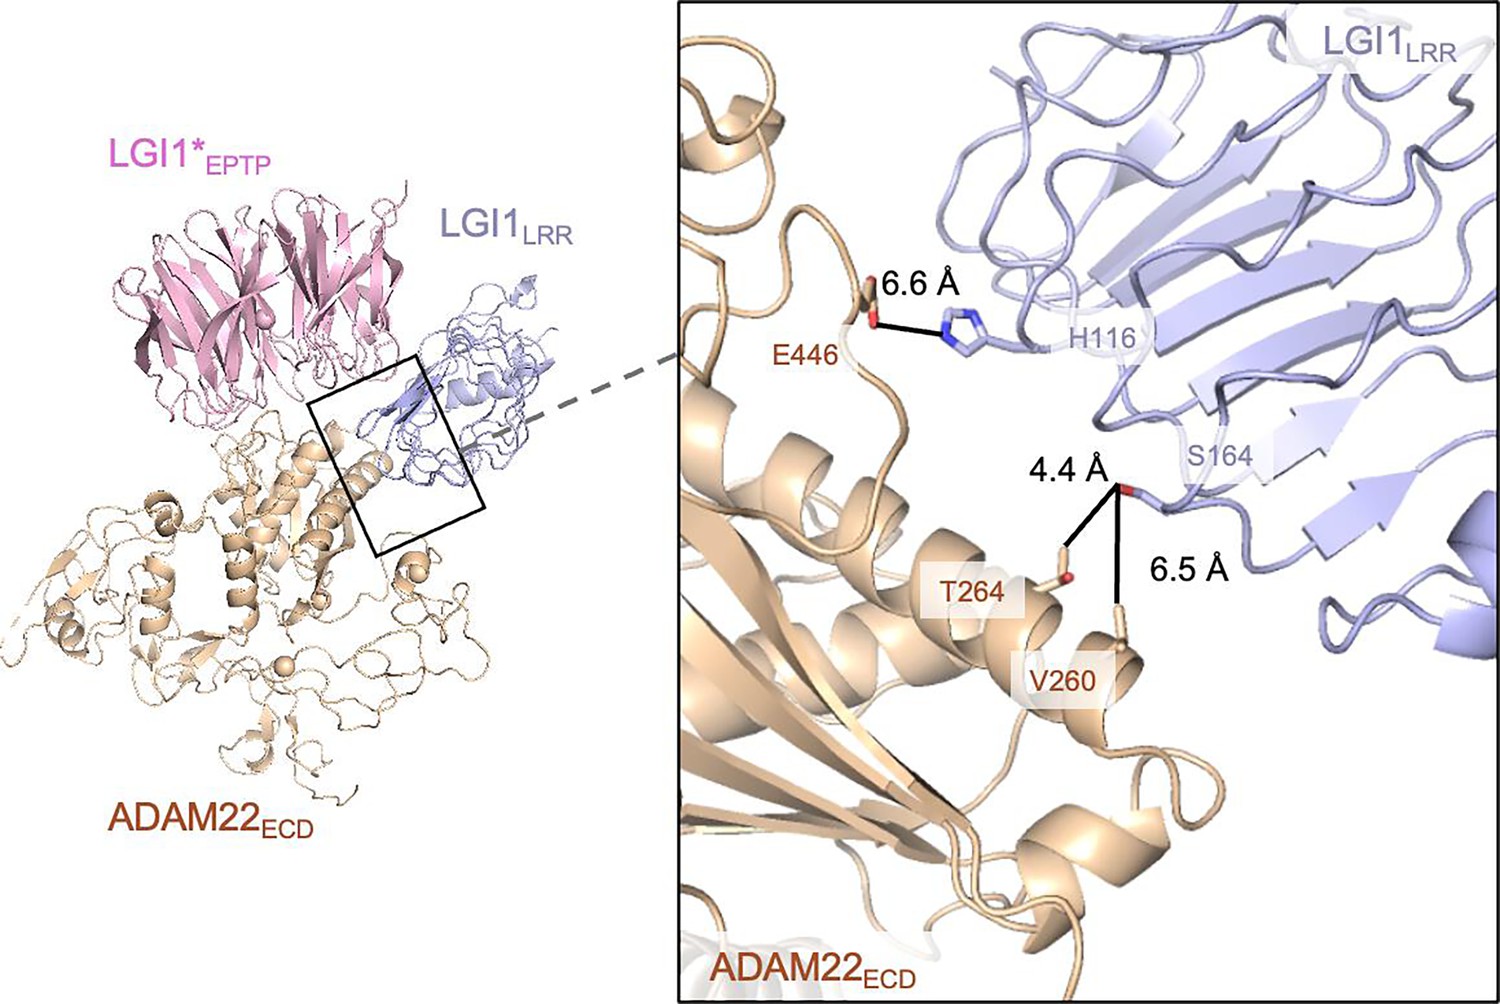
LGI1LRR and ADAM22ECD in the LGI1–ADAM22ECD assembly.
LGI1LRR is located in close proximity to ADAM22ECD. However, no tight interaction was observed between LGI1LRR and ADAM22ECD in the cryo-electron microscopy (cryo-EM) structure.
Figure 3—figure supplement 2
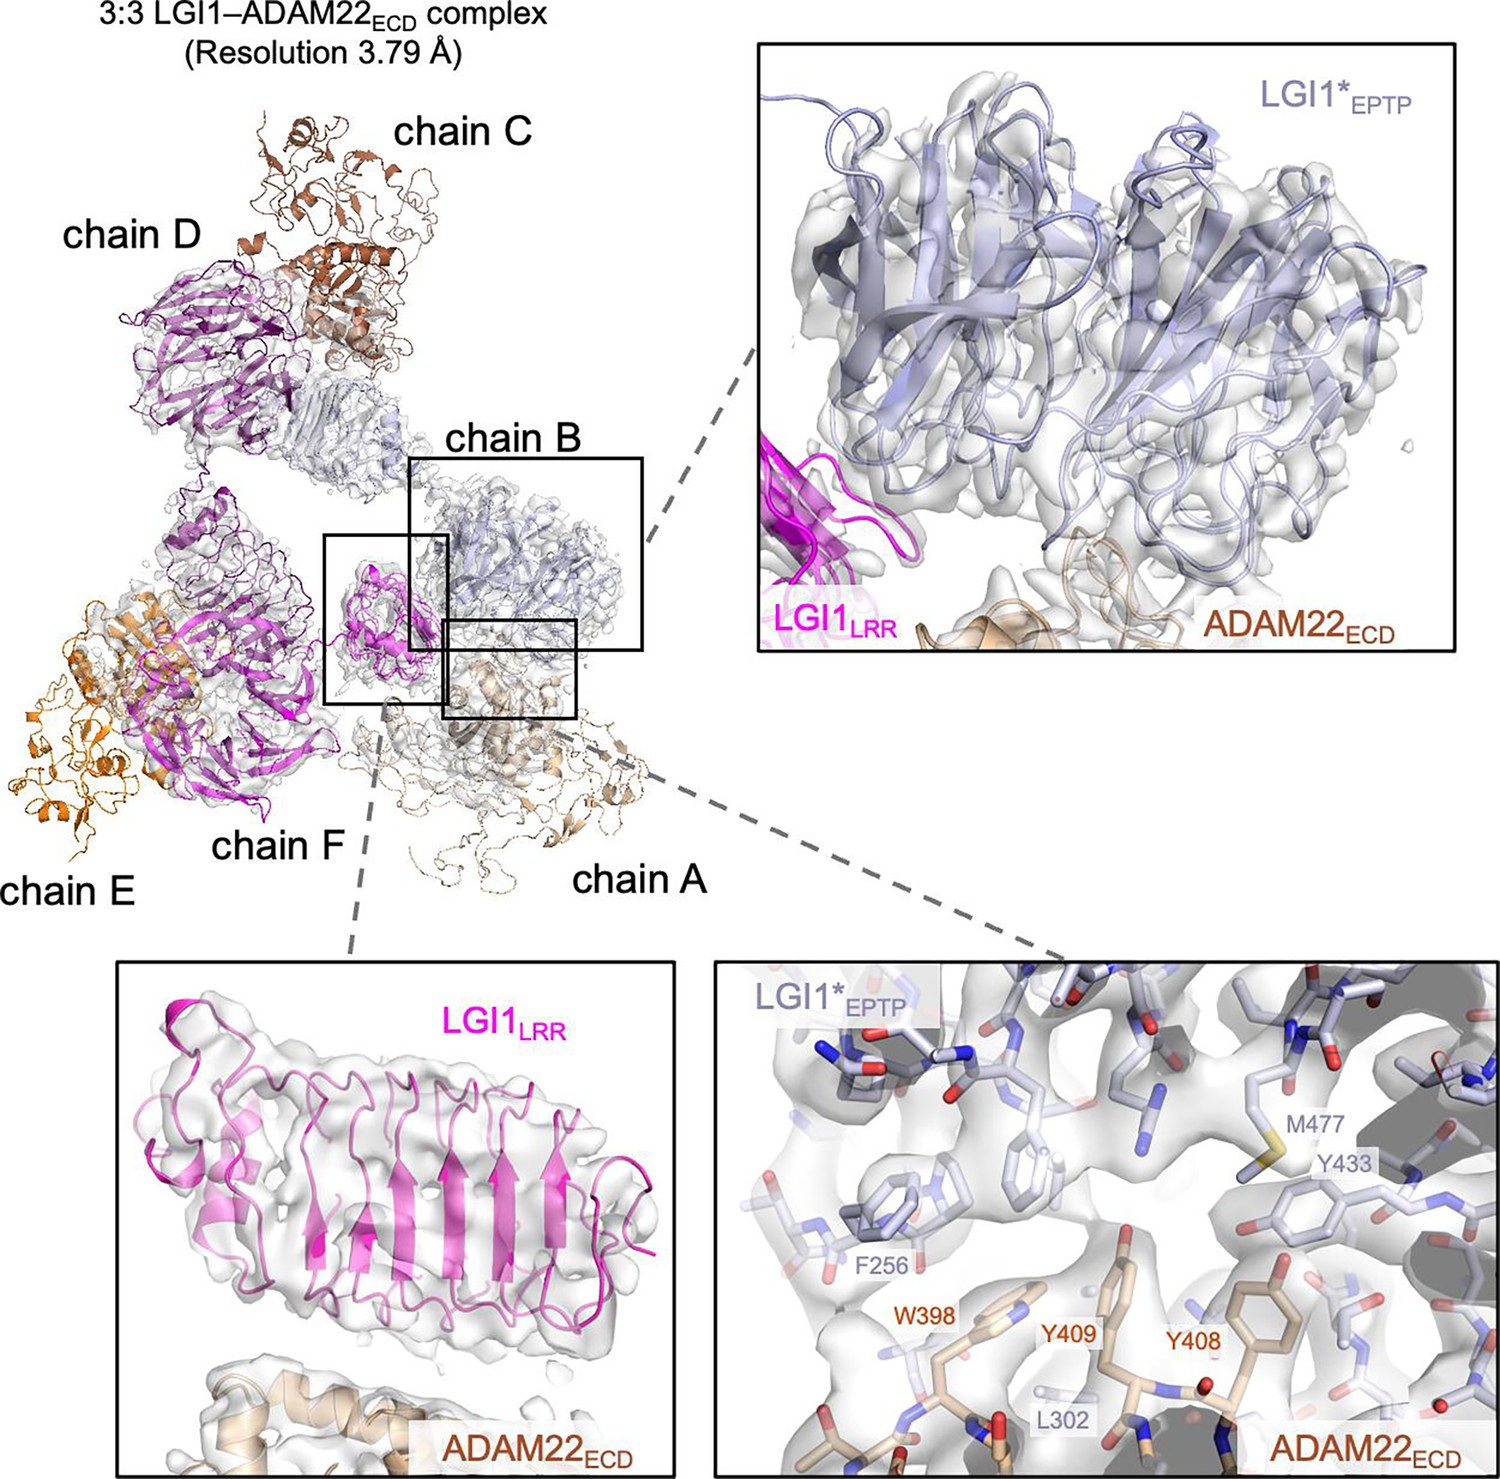
Cryo-electron microscopy (cryo-EM) density map of the 3:3 LGI1–ADAM22ECD complex.
Density maps of LGI1LRR in chain F, LGI1EPTP in chain B, and the interface between LGI1EPTP in chain B and ADAM22ECD in chain A are shown, along with the overall view of the map of the 3:3 LGI1–ADAM22ECD complex. The labeled residues are important for the LGI1EPTP–ADAM22ECD interaction.
Figure 3—figure supplement 3
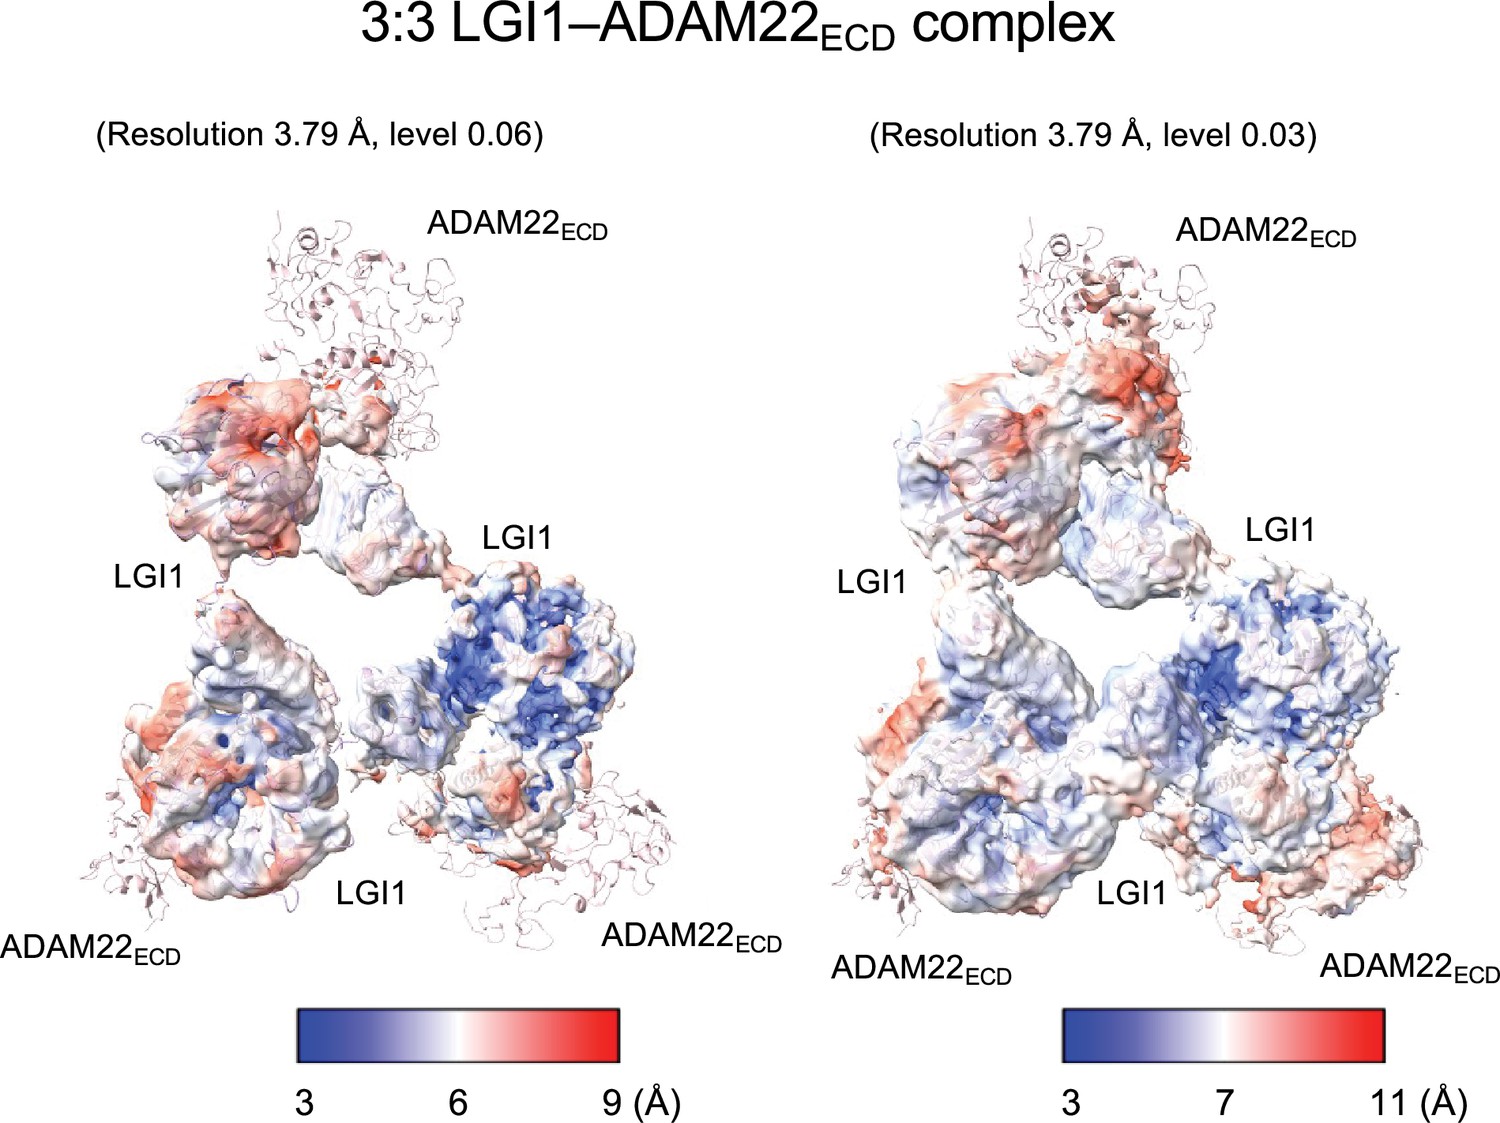
Local resolution of the cryo-electron microscopy (cryo-EM) structure of the 3:3 LGI1–ADAM22ECD complex.
Distribution of the resolution was plotted onto the density at high (0.06) and low (0.03) levels.
Figure 3—figure supplement 4
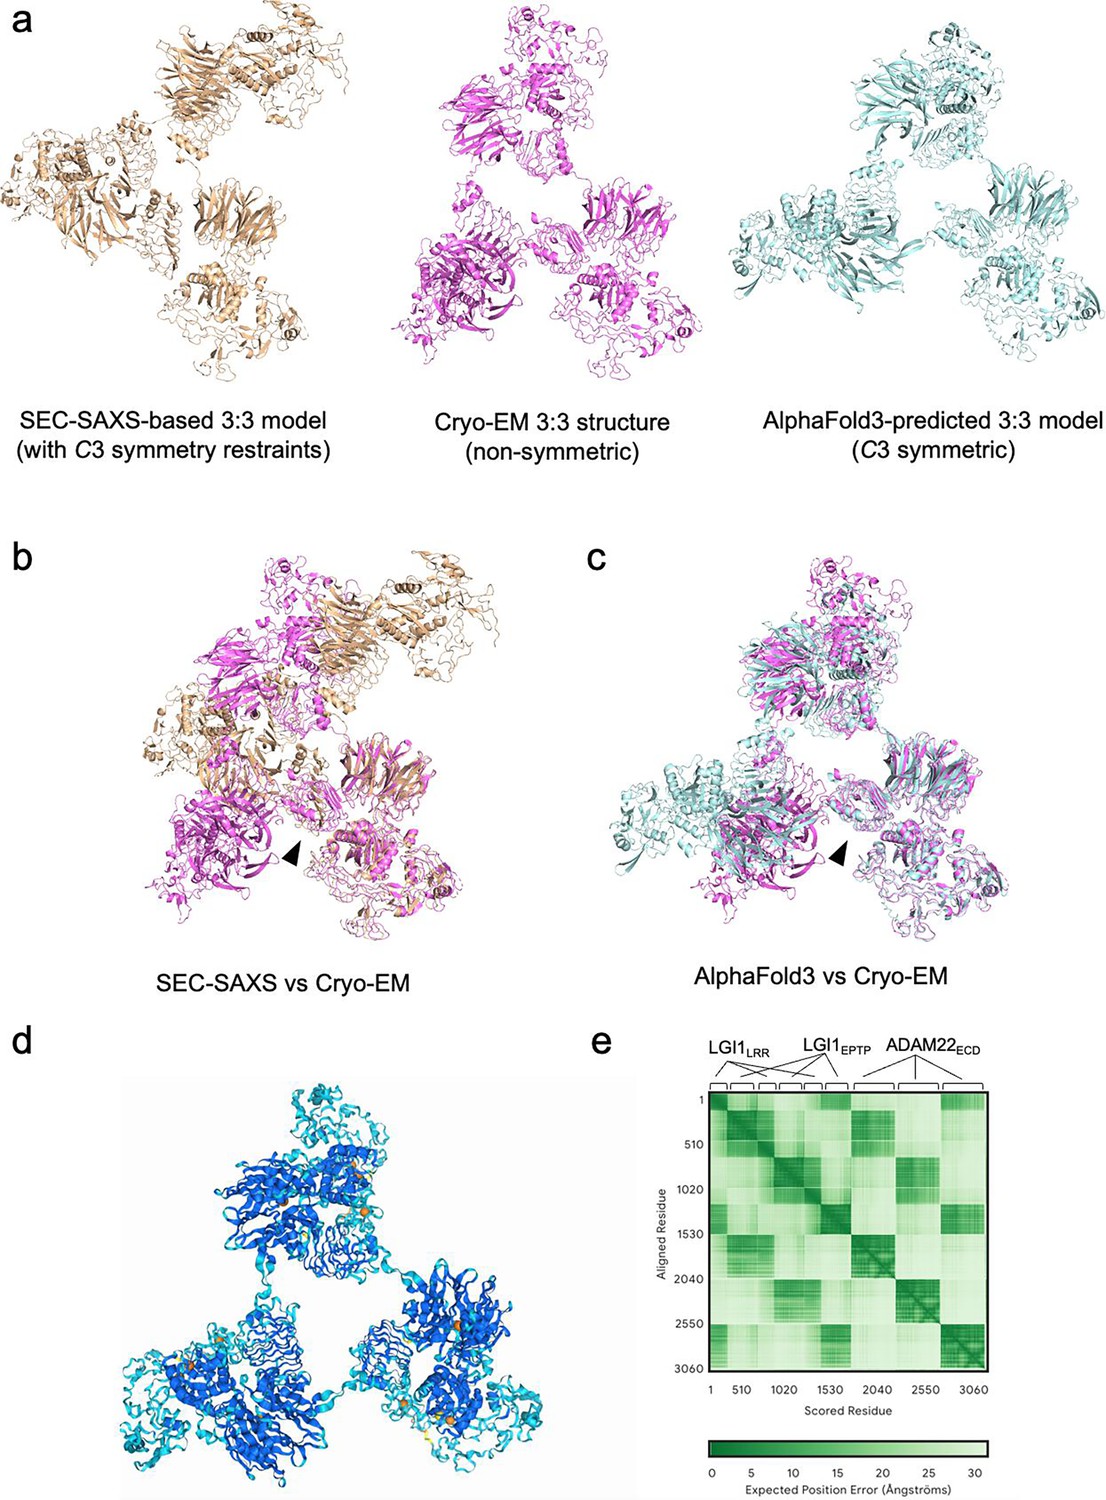
Comparison of the 3:3 LGI1–ADAM22ECD assembly determined by cryo-electron microscopy (cryo-EM) with that calculated based on size-exclusion chromatography-small-angle X-ray scattering (SEC-SAXS) analysis and that predicted by AlphaFold3.
(a) SEC-SAXS-based model (left), cryo-EM structure (middle), and AlphaFold3-predicted model (right). (b) Superposition of the SEC-SAXS-based model with C3 symmetry restraints and the cryo-EM structure. The structures were aligned based on LGI1EPTP in chain A from the cryo-EM structure. The orientation of LGI1LRR (indicated by the arrowhead) differs between these two structures. (c) Superposition of the C3 symmetric model predicted by AlphaFold3 and the cryo-EM structure. The structures were aligned based on LGI1EPTP in chain A from the cryo-EM structure. The orientation of LGI1LRR (indicated by the arrowhead) is similar between these two structures, although the overall trimeric configuration is different. (d) AlphaFold3-predicted model colored according to pLDDT confidence scores (orange: 0–50; yellow: 50–70; cyan: 70–90; blue: 90–100). (e) Predicted aligned error (PAE) matrix of the AlphaFold3 prediction.
Figure 3—figure supplement 5
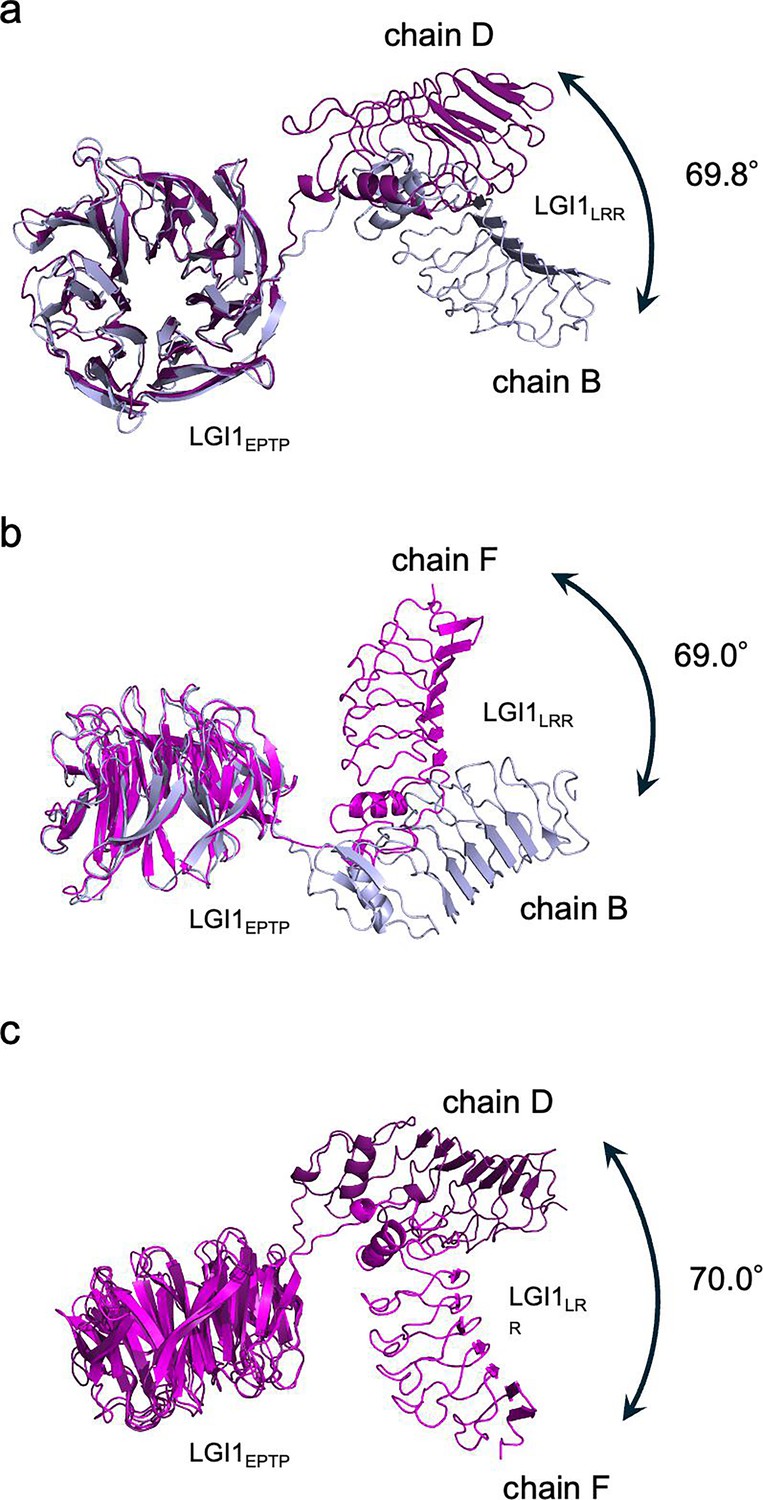
Conformational difference of the three LGI1 molecules in the 3:3 LGI1–ADAM22ECD assembly.
The conformational difference was analyzed by the DynDom server. The superpositions of chains B and D (a), chains B and F (b), and chains D and F (c), along with their rotations about the hinge axis, are shown individually. Black arrows indicate the rotations of LGI1LRR relative to LGI1EPTP.
Figure 4 with 2 supplements
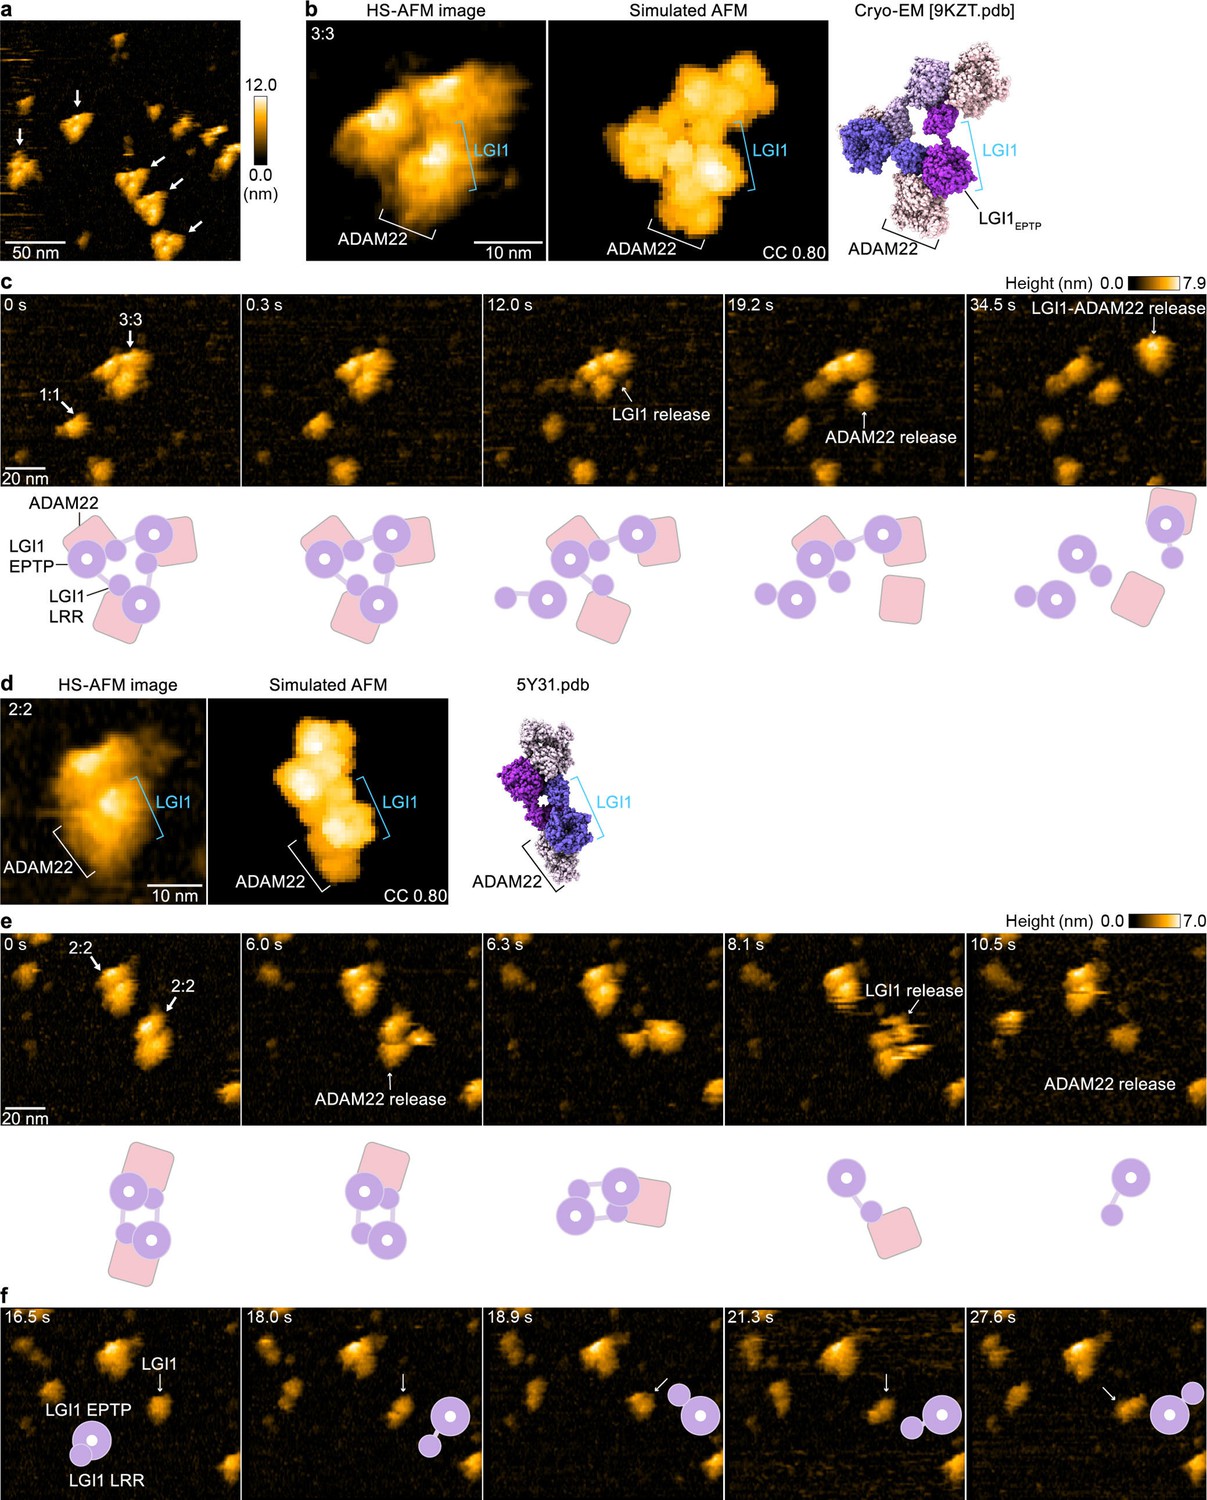
High-speed atomic force microscopy (HS-AFM) observations of LGI1–ADAM22ECD complexes.
(a) A representative HS-AFM image of the 3:3 LGI1–ADAM22ECD complex. The color bars on the right indicate height in nanometers. White arrows indicate the 3:3 complex. The frame rate was 1.0 frames/s. (b, d) Magnified HS-AFM images of the 3:3 (left in b) and 2:2 (left in d) LGI1–ADAM22ECD complexes. The simulated AFM images (middle) were derived from fitting to the experimental HS-AFM image (left). The well-fitting simulated AFM images and the coefficient of correlation (CC) are indicated. The cryo-electron microscopy (cryo-EM) structure of the 3:3 complex (right in b) and the X-ray structure of the 2:2 complex (right in d) are shown in the same orientation as the simulated AFM images. (c, e, f) Sequential HS-AFM images of the 3:3 (c; see also Figure 4—video 1) and 2:2 (e, f; see also Figure 4—video 2) LGI1–ADAM22ECD complexes. A schematic illustration of the interpretation of HS-AFM images is shown at the bottom. Imaging parameters: scanning area = 120 × 96 nm2 (240×192 pixels); frame rate = 3.3 frames/s. HS-AFM experiments were repeated independently at least three times with consistent results.
Figure 4—video 1
High-speed atomic force microscopy (HS-AFM) videos of three representative 3:3 LGI1–ADAM22ECD complexes on the AP-mica, related to Figure 4c.
White, blue, and magenta arrows indicate LGI1 release, ADAM22 release, and LGI1–ADAM22 release, respectively. Image size, 240 × 192 pixels2; scan area, 120 × 96 nm2; frame rate, 3.3 fps.
Figure 4—video 2
High-speed atomic force microscopy (HS-AFM) videos of a representative 2:2 LGI1–ADAM22ECD complex on the AP-mica, related to Figure 4e.
White and blue arrows indicate LGI1 release and ADAM22 release, respectively. Image size, 240 × 192 pixels; scan area, 120 × 96 nm2; frame rate, 3.3 fps.
Videos
Animation 1
3D flexible refinement (3D Flex) analysis of the 3:3 LGI1–ADAM22ECD complex.
Two latent coordinates were used in the 3D Flex analysis. Two 3D Flex movies (Animations 1 and 2) are displayed at the same threshold.
Animation 2
3D flexible refinement (3D Flex) analysis of the 3:3 LGI1–ADAM22 complex.
Two latent coordinates were used in the 3D Flex analysis. Two 3D Flex movies (Animations 1 and 2) are displayed at the same threshold.
Animation 3
3D Variability Analysis (3D VA) of the 3:3 LGI1–ADAM22ECD complex.
Three variability components are represented in the 3D VA. Three 3D VA movies (Animations 3–5) are displayed at the same threshold. Two movies (Animations 3 and 4) show twisting motion, whereas one movie (Animation 5) shows stretching motion.
Animation 4
3D Variability Analysis (3D VA) of the 3:3 LGI1–ADAM22ECD complex.
Three variability components are represented in the 3D VA. Three 3D VA movies (Animations 3–5) are displayed at the same threshold. Two movies (Animations 3 and 4) show twisting motion, whereas one movie (Animation 5) shows stretching motion.
Animation 5
3D Variability Analysis (3D VA) of the 3:3 LGI1–ADAM22ECD complex.
Three variability components are represented in the 3D VA. Three 3D VA movies (Animations 3–5) are displayed at the same threshold. Two movies (Animations 3 and 4) show twisting motion, whereas this movie shows stretching motion.
Tables
Table 1
Data collection/processing and refinement statistics of cryo-electron microscopy (cryo-EM) single-particle analysis.
| LGI1LRR–LGI1*EPTP–ADAM22ECD complex | 3:3 LGI1–ADAM22ECD complex | |
|---|---|---|
| Data collection and processing | ||
| Magnification | 60,000 | 60,000 |
| Voltage (kV) | 300 | 300 |
| Dose rate (e-/pixel/s) | 10.6743 | 10.6743 |
| Defocus range (µm) | –0.8 to –2.2 | –0.8 to –2.2 |
| Pixel size (Å) | 0.752 | 0.752 |
| Symmetry imposed | C1 | C1 |
| Initial particle images (no.) | 2,061,420 | 2,061,420 |
| Final particle images (no.) | 557,450 | 120,728 |
| Map resolution (Å) | 2.78 | 3.78 |
| FSC threshold | 0.143 | 0.143 |
| Refinement | ||
| Model resolution (Å) | ||
| FSC 0.143, unmasked/masked | 2.76/2.73 | 3.91/3.81 |
| Model composition | ||
| Non-hydrogen atoms | 7846 | 23,526 |
| Protein residues | 993 | 2979 |
| Ligands | 4 | 0 |
| B factors (Å2) | ||
| Protein (Å2) | 58.78 | 43.80 |
| Ligands (Å2) | 51.14 | |
| RMS deviation | ||
| Bond length (Å) | 0.002 | 0.012 |
| Bond angle (°) | 0.474 | 1.153 |
| MolProbity score | 1.45 | 2.28 |
| Clash score | 6.47 | 24.79 |
| Rotamer outliers (%) | 0.00 | 0.60 |
| Ramachandran plot | ||
| Favored (%) | 97.56 | 94.16 |
| Allowed (%) | 2.44 | 5.84 |
| Disallowed (%) | 0.00 | 0.00 |
Table 2
Domain motion analysis of LGI1 in the 3:3 LGI1–ADAM22ECD complex by the DynDom server.
| Chain IDs | DynDom parameters | LGI1 |
|---|---|---|
| B vs D | Fixed domain | Residues 225–549 (RMSD 1.79 Å) |
| Moving domain | Residues 43–224 (RMSD 1.16 Å) | |
| Rotation angle (°) | 69.8 | |
| Translation (Å) | –1.8 | |
| Closure (%) | 13.8 | |
| Bending residues | 215–225 | |
| B vs F | Fixed domain | Residues 223–549 (RMSD 1.01 Å) |
| Moving domain | Residues 43–222 (RMSD 1.19 Å) | |
| Rotation angle (°) | 69.0 | |
| Translation (Å) | –0.8 | |
| Closure (%) | 52.8 | |
| Bending residues | 215–223 | |
| D vs F | Fixed domain | Residues 224–549 (RMSD 1.82 Å) |
| Moving domain | Residues 43-223 (RMSD 1.24 Å) | |
| Rotation angle (°) | 70.0 | |
| Translation (Å) | –1.7 | |
| Closure (%) | 99.0 | |
| Bending residues | 218–225 |
Key resources table
| Reagent type (species) or resource | Designation | Source or reference | Identifiers | Additional information |
|---|---|---|---|---|
| Gene (Homo sapiens) | LGI1 | GenBank | NM_005097 | |
| Gene (Homo sapiens) | ADAM22 | GenBank | NM_021723 | |
| Cell line (Homo sapiens) | Expi293F | Thermo Fisher Scientific | Cat # A14527 | |
| Transfected construct (Homo sapiens) | Igκ-LGI1 (37–557; R470A) -His6 (plasmid) | Yamagata et al., 2018 (PMID:29670100) | pEBMulti-Neo (backbone) | |
| Transfected construct (Homo sapiens) | non-tagged ADAM22 (1–729) (plasmid) | Yamagata et al., 2018 (PMID:29670100) | pEBMulti-Neo (backbone) | |
| Software, algorithm | SerialEM | Mastronarde, 2005; http://bio3d.colorado.edu/SerialEM/ | RRID:SCR_017293 | |
| Software, algorithm | yoneoLocr Version 1.0 | Yonekura et al., 2021; https://github.com/YonekuraLab/yoneoLoc | ||
| Software, algorithm | CryoSPARC Version 4.1.2 | Punjani et al., 2017; https://cryosparc.com | RRID:SCR_016501 | |
| Software, algorithm | Coot | Emsley and Cowtan, 2004; https://www2.mrc-lmb.cam.ac.uk/personal/pemsley/coot/ | RRID:SCR_014222 | |
| Software, algorithm | Phenix Version 1.19–4092 | Adams et al., 2011; https://phenix-online.org | RRID:SCR_014224 | |
| Software, algorithm | UCSF ChimeraX Version 1.15 | Meng et al., 2023; https://www.cgl.ucsf.edu/chimerax/ | RRID:SCR_015872 | |
| Software, algorithm | PyMOL Version 3.1.0 | Schrödinger, LLC ; http://www.pymol.org | RRID:SCR_000305 | |
| Software, algorithm | Fiji (ImageJ) software | Schindelin et al., 2012; https://imagej.net/software/fiji/ | RRID:SCR_002285 | |
| Software, algorithm | BioAFMviewer | Amyot and Flechsig, 2020; https://www.bioafmviewer.com/index.php | ||
| Other | Expi293 Expression Medium | Thermo Fisher Scientific | Cat # A1435101 | Cell culture medium for Expi293F cells |
| Other | Quantifoil holey carbon grid | Quantifoil | R1.2/1.3, Cu, 300 mesh | Carbon holey grid for cryo-EM |
Additional files
Download links
A two-part list of links to download the article, or parts of the article, in various formats.
Downloads (link to download the article as PDF)
Open citations (links to open the citations from this article in various online reference manager services)
Cite this article (links to download the citations from this article in formats compatible with various reference manager tools)
Structural insights into heterohexameric assembly of epilepsy-related ligand–receptor complex LGI1–ADAM22
eLife 14:RP105918.
https://doi.org/10.7554/eLife.105918.3


