Structural insights into heterohexameric assembly of epilepsy-related ligand–receptor complex LGI1–ADAM22
- Department of Chemistry, Graduate School of Science, Kyoto University, Japan
- Laboratory for Protein Functional and Structural Biology, RIKEN Center for Integrative Medical Sciences, Japan
- Division of Molecular and Cellular Pharmacology, Nagoya University Graduate School of Medicine, Japan
- Division of Neuropharmacology, Nagoya University Graduate School of Medicine, Japan
- Institute for Frontier Science Initiative, Kanazawa University, Japan
- WPI Nano Life Science Institute (WPI-NanoLSI), Kanazawa University, Japan
eLife Assessment
In this convincing work by Yamaguchi et al. the cryo-EM structure of the heterohexameric 3:3 LGI1-ADAM22 complex is presented. The findings suggest that LGI1 can cluster ADAM22 in a trimeric fashion. The clustering of cell surface proteins is important in controlling signaling in the nervous system. This new version of the manuscript has been improved substantially and the figures have been enhanced and clarified.
https://doi.org/10.7554/eLife.105918.3.sa0Significance of the findings:
Important: Findings that have theoretical or practical implications beyond a single subfield
- Landmark
- Fundamental
- Important
- Valuable
- Useful
Strength of evidence:
Convincing: Appropriate and validated methodology in line with current state-of-the-art
- Exceptional
- Compelling
- Convincing
- Solid
- Incomplete
- Inadequate
During the peer-review process the editor and reviewers write an eLife Assessment that summarises the significance of the findings reported in the article (on a scale ranging from landmark to useful) and the strength of the evidence (on a scale ranging from exceptional to inadequate). Learn more about eLife Assessments
Abstract
Leucine-rich glioma-inactivated 1 protein (LGI1) is a secreted neuronal protein consisting of the N-terminal leucine-rich repeat (LRR) and C-terminal epitempin-repeat (EPTP) domains. LGI1 is linked to epilepsy, a neurological disorder that can be caused by genetic mutations of genes regulating neuronal excitability (e.g. voltage- or ligand-gated ion channels). ADAM22 is a membrane receptor that binds to LGI1 extracellularly and interacts with AMPA-type glutamate receptors via PSD-95 intracellularly to maintain normal synaptic signal transmission. Structural analysis of the LGI1–ADAM22 complex is important for understanding the molecular mechanism of epileptogenesis and developing new therapies against epilepsy. We previously reported the crystal structure of a 2:2 complex consisting of two molecules of LGI1 and two molecules of the ADAM22 ectodomain (ECD), which is suggested to bridge neurons across the synaptic cleft. On the other hand, multiangle light scattering, small-angle X-ray scattering, and cryo-electron microscopy (cryo-EM) analyses have suggested the existence of a 3:3 complex consisting of three molecules of LGI1 and three molecules of ADAM22. In the previous cryo-EM analysis, many observed particles were in a dissociated state, making it difficult to determine the three-dimensional (3D) structure of the 3:3 complex. In this study, we stabilized the 3:3 LGI1–ADAM22ECD complex using chemical cross-linking and determined the cryo-EM structures of the LGI1LRR–LGI1EPTP–ADAM22ECD and 3:3 LGI1–ADAM22ECD complexes at 2.78 Å and 3.79 Å resolutions, respectively. Furthermore, high-speed atomic force microscopy (HS-AFM) visualized the structural features and flexibility of the 3:3 LGI1–ADAM22ECD complex in solution. We discuss new insights into the interaction modes of the LGI1–ADAM22 higher-order complex and the structural properties of the 3:3 LGI1–ADAM22 complex.
Introduction
Epilepsy is a prevalent neurological disorder, affecting approximately 1% of the population. Epilepsy is characterized by recurrent, unprovoked seizures, resulting from an imbalance between excitation and inhibition within neural circuits. Mutations associated with epilepsy frequently occur in genes that regulate neuronal excitability through ion channels such as voltage-gated ion channels (e.g. K+, Na+, and Ca2+ channels) and ligand-gated ion channels (e.g. nicotinic acetylcholine and GABAA receptors) (Fukata and Fukata, 2017; Noebels, 2015; Steinlein, 2004). Additionally, some epilepsy-related mutations have been identified in genes encoding non-ion channel proteins such as LGI1 (Gu et al., 2002; Kalachikov et al., 2002; Morante-Redolat et al., 2002; Staub et al., 2002).
LGI1 is a 60 kDa secreted neuronal protein that consists of the N-terminal leucine-rich repeat (LRR) domain and the C-terminal epitempin-repeat (EPTP) domain (Staub et al., 2002; Figure 1a). Mutations in the LGI1 gene, resulting in incorrect folding and posttranslational modifications, cause autosomal dominant epilepsy with auditorial features (ADEAF) (Gu et al., 2002; Kalachikov et al., 2002; Morante-Redolat et al., 2002). For example, the E383A mutant of LGI1 is eliminated by the endoplasmic reticulum and becomes deficient in secretion (Yokoi et al., 2015). Meanwhile, the S473L mutation of LGI1 causes epileptiform seizures due to reduced binding to ADAM22, which is a member of the A disintegrin and metalloproteinase (ADAM) family (Fukata et al., 2010; Schulte et al., 2006) and acts as a receptor for LGI1 in neurons without protease activity (Fukata et al., 2006; Sagane et al., 1999). ADAM22 is a single-pass transmembrane protein. The ectodomain (ECD) of ADAM22 consists of a metalloprotease-like domain, a disintegrin domain, a cysteine-rich domain, and an EGF-like domain (Liu et al., 2009; Figure 1a). The metalloprotease-like domain interacts with the EPTP domain of LGI1 in the extracellular space (Fukata et al., 2006; Yamagata et al., 2018). In the cytoplasm, the PDZ-binding motif-containing C-terminal tail of ADAM22 binds to a synaptic scaffolding protein PSD-95, which regulates the cellular dynamics of α-amino-3-hydroxy-5-methyl-4-isoxazolepropionic acid (AMPA) receptors through binding to Stargazin, an auxiliary subunit of AMPA receptors, in the postsynapse (Chen et al., 2000; Nicoll et al., 2006). Furthermore, LGI1 forms a complex with the voltage-gated potassium channel through ADAM22/23 (Fukata et al., 2021; Schulte et al., 2006; Seagar et al., 2017). As such, the LGI1–ADAM22 complex maintains normal nerve signal transduction through the interaction network, including synaptic ion channels (Fukata et al., 2006; Fukata et al., 2010; Lovero et al., 2015). Structural analysis of the LGI1–ADAM22 complex is important for understanding the molecular basis of epileptogenesis and for developing therapeutic strategies based on this understanding.
Figure 1 with 4 supplements see all
Structure of the LGI1–ADAM22ECD complex.
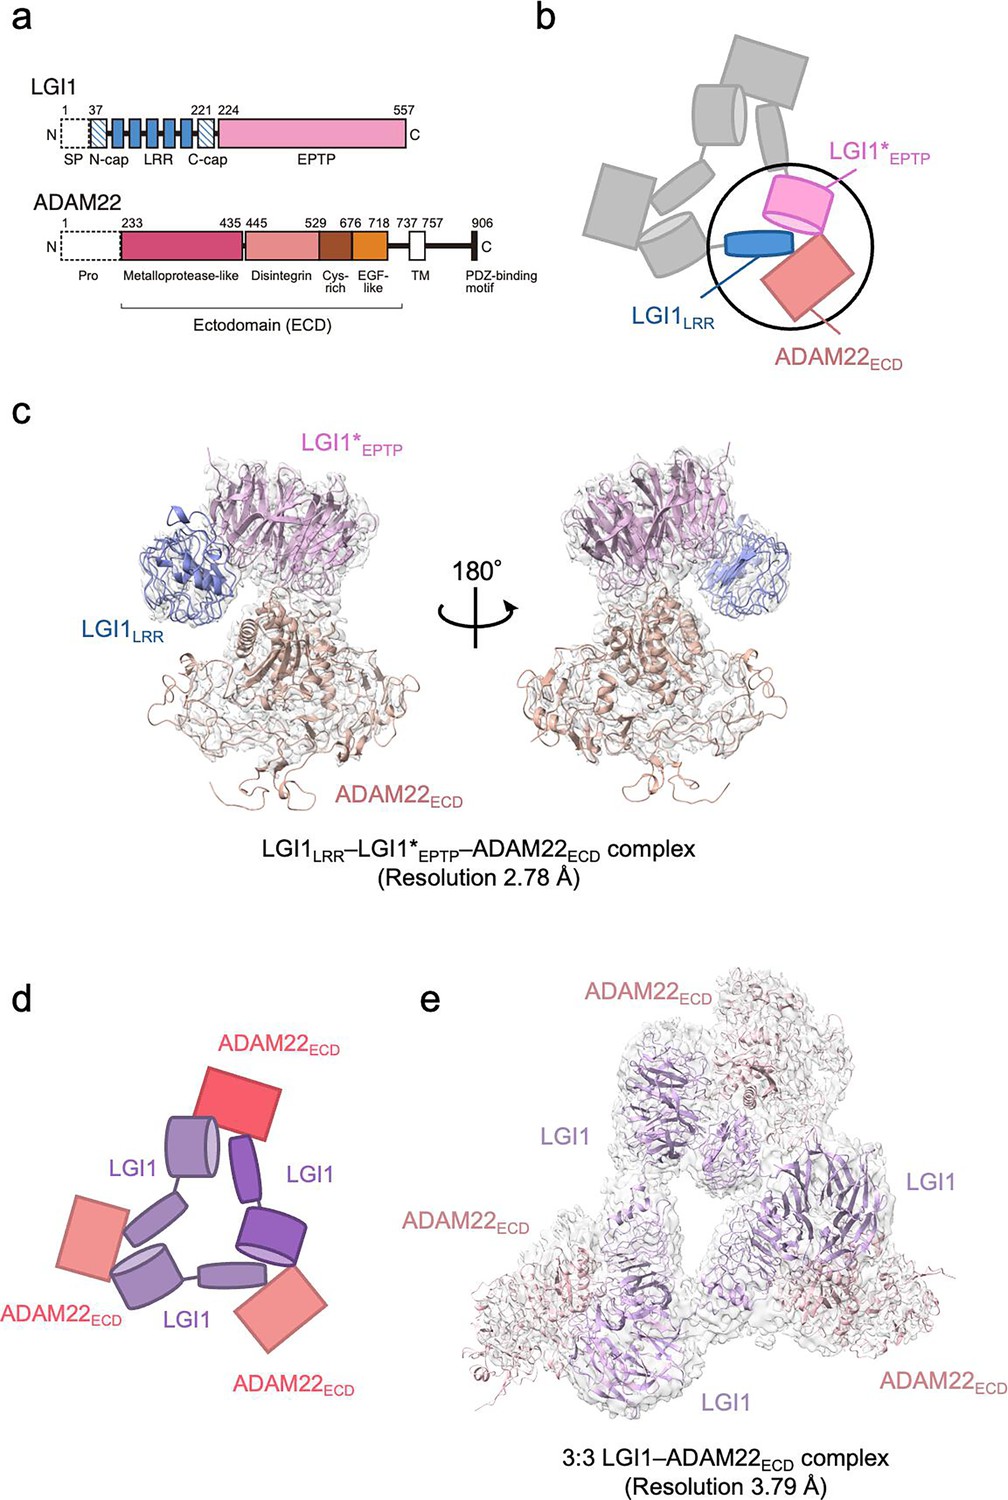
(a) Domain organizations of LGI1 and ADAM22. LGI1 consists of the leucine-rich repeat (LRR) (blue) and epitempin-repeat (EPTP) (pink) domains. The N-terminal secretion signal peptide (SP, enclosed by dotted lines) is removed in the secreted LGI1. The shaded blue boxes represent the N- and C-terminal caps, whereas the filled blue boxes represent the LRRs. The premature form of ADAM22 contains the N-terminal prosequence (enclosed by dotted lines). The mature ADAM22 consists of the metalloprotease-like (magenta), disintegrin (salmon pink), cysteine-rich (brown), EGF-like (orange), transmembrane (TM; white), and cytoplasmic domains. The major ADAM22 isoform has a PDZ-binding motif in the C-terminal of the cytoplasmic domain. (b) Schematic diagram of the LGI1LRR–LGI1*EPTP–ADAM22ECD complex. The black circle indicates the location of this complex within the 3:3 LGI1–ADAM22 complex. * indicates a distinct molecule. (c) Cryo-electron microscopy (cryo-EM) map and structure of the LGI1LRR–LGI1*EPTP–ADAM22ECD complex at 2.78 Å resolution. (d) Schematic diagram of the 3:3 LGI1–ADAM22ECD complex. (e) Cryo-EM map and structure of the 3:3 LGI1–ADAM22ECD complex at 3.79 Å resolution.
We previously reported the crystal structure of a 2:2 LGI1–ADAM22ECD complex consisting of two molecules of LGI1 and two molecules of ADAM22ECD (Yamagata et al., 2018). The long-axis length of the 2:2 complex is approximately 190 Å, which is comparable to the width of the synaptic cleft. This 2:2 complex structure and the structure-guided study on a mouse model for familial epilepsy suggested that the formation of the 2:2 complex bridges neurons in the synaptic cleft. The results revealed the structural basis of the interaction between the EPTP domain of one LGI1 and the LRR domain of the other LGI1, as well as the interaction between the EPTP domain of LGI1 and the metalloproteinase-like domain of ADAM22 (Yamagata et al., 2018). On the other hand, size-exclusion chromatography-multiangle light scattering (SEC-MALS), size-exclusion chromatography-small-angle X-ray scattering (SEC-SAXS), and cryo-electron microscopy (cryo-EM) analyses suggested that three molecules of LGI1 and three molecules of ADAM22ECD bind to each other to form a 3:3 complex at near physiological salt concentrations (Yamagata et al., 2018). Similarly to the 2:2 complex, the 3:3 complex might serve as an extracellular scaffold to stabilize Kv1 channels or AMPA receptors in a trans-synaptic fashion (Fukata et al., 2021; Lovero et al., 2015; Schulte et al., 2006). In addition, the 3:3 assembly in a cis fashion on the same membrane might regulate the accumulation of Kv1 channel complexes at the axon initial segment (Hivert et al., 2019; Seagar et al., 2017). However, no clear evidence to prove these potential mechanistic roles of the 3:3 assembly has been provided, and the 3D structure of the 3:3 complex has not yet been determined.
In this study, the 3D structure of the 3:3 LGI1–ADAM22ECD complex was determined at a nominal resolution of 3.79 Å by cryo-EM single-particle analysis. We also determined the 3D structure of the LGI1LRR–LGI1EPTP–ADAM22ECD complex at a nominal resolution of 2.78 Å. These higher-resolution 3D structures provide more detailed interaction mechanisms for the LGI1–ADAM22 higher-order assembly. We also performed high-speed atomic force microscopy (HS-AFM) (Ando et al., 2001; Sumino et al., 2024) to directly visualize the molecular dynamics of the LGI1–ADAM22ECD assembly and characterize its structural property. The cryo-EM and HS-AFM results suggest that the 3:3 LGI1–ADAM22ECD assembly does not form a rigid threefold symmetric structure but rather a flexible triangular structure accompanying relative motions between each protomer.
Results
Cryo-EM single-particle analysis of the LGI1–ADAM22ECD complex
As we reported previously, the molar mass of the complex between the full-length LGI1 and ADAM22ECD determined by SEC-MALS at 150 mM NaCl was 356 kDa, corresponding to the 3:3 hexameric assembly of LGI1–ADAM22ECD in solution (Yamagata et al., 2018). This is consistent with our initial cryo-EM analysis, where 5% of the reference-free 2D class averaged images showed particles with pseudo-C3 symmetry suggestive of the 3:3 assembly. Since the 3:3 complex class was clearly seen and appeared structurally stable, we tried to determine the 3D structure of the 3:3 LGI1–ADAM22ECD complex by single-particle analysis but failed due to insufficient numbers of particles of the 3:3 complex. On this basis, we decided to perform a structural analysis of the complex stabilized by chemical cross-linking. We co-expressed His6-tagged LGI1 and non-tagged ADAM22ECD in Expi293F cells and purified the complex using Ni-NTA affinity chromatography and gel filtration chromatography at 50 mM NaCl (Figure 1—figure supplement 1a and b, Figure 1—figure supplement 1—source data 1, Figure 1—figure supplement 1—source data 2). Then, fractions containing the LGI1–ADAM22ECD complex were collected and treated with glutaraldehyde to chemically cross-link the 3:3 complex. The sample was purified again by gel filtration chromatography. The chromatogram showed a peak likely corresponding to the 3:3 LGI1–ADAM22ECD complex (Figure 1—figure supplement 1c and d, Figure 1—figure supplement 1—source data 1, Figure 1—figure supplement 1—source data 2). One of the peak fractions was collected and subjected to single-particle analysis by cryo-EM. Among 2,061,420 particles picked from 7625 movies without templates, 1,403,037 particle images were extracted with a box size of 544 pixels (0.752 Å/pixel) and downsampled to a size of 136 pixels (3.008 Å/pixel) by Fourier cropping. The downsampled images were subjected to reference-free 2D classification, which generated images of triangle-shaped particles considered to be the 3:3 LGI1–ADAM22ECD complex (Figure 1—figure supplement 2). Other images looked like two particles stacked on top of each other or single particles clearly smaller than the 3:3 complex (Figure 1—figure supplement 2). The stacked particle images might represent the 2:2 complex viewed along the long axis or the 3:3 complex viewed from the side, which were difficult to distinguish. Eight classes with 176,443 particles of the putative 3:3 LGI1-ADAM22ECD complex were used as templates for picking particles again. 2,530,790 particle images were extracted, downsampled, and subjected to the second run of reference-free 2D classification, resulting in a set of images similar to that generated in the first run of 2D classification (Figure 1—figure supplement 3). Eighty 2D classes with 2,006,398 particles were selected for ab initio 3D reconstruction. Six classes of ab initio 3D models were generated and then refined by heterogeneous refinement. The resultant 3D map in one class corresponded to a complex comprising LGI1LRR, LGI1*EPTP, and ADAM22ECD (* indicates a distinct molecule hereafter). Nonuniform refinement using the particle images with the original pixel size yielded a density map at a nominal resolution of 2.78 Å (Figure 1b and c, Figure 1—figure supplement 4, and Table 1). This map corresponds to a part of the 3:3 complex, where two-thirds of the complex may adopt various conformations. The 3D map of one other class corresponded to the 3:3 LGI1–ADAM22ECD complex. Nonuniform refinement using the particle images with the original pixel size yielded a density map at a nominal resolution of 3.79 Å (Figure 1d and e, Figure 1—figure supplement 4, and Table 1). Using these two maps, we constructed atomic models of the LGI1LRR–LGI1*EPTP–ADAM22ECD complex and the 3:3 LGI1-ADAM22ECD complex (Table 1). The resolutions of the present cryo-EM analysis (2.78 Å and 3.79 Å) are better than that of the crystal structure of the 2:2 complex (7.125 Å).
Table 1
Data collection/processing and refinement statistics of cryo-electron microscopy (cryo-EM) single-particle analysis.
| LGI1LRR–LGI1*EPTP–ADAM22ECD complex | 3:3 LGI1–ADAM22ECD complex | |
|---|---|---|
| Data collection and processing | ||
| Magnification | 60,000 | 60,000 |
| Voltage (kV) | 300 | 300 |
| Dose rate (e-/pixel/s) | 10.6743 | 10.6743 |
| Defocus range (µm) | –0.8 to –2.2 | –0.8 to –2.2 |
| Pixel size (Å) | 0.752 | 0.752 |
| Symmetry imposed | C1 | C1 |
| Initial particle images (no.) | 2,061,420 | 2,061,420 |
| Final particle images (no.) | 557,450 | 120,728 |
| Map resolution (Å) | 2.78 | 3.78 |
| FSC threshold | 0.143 | 0.143 |
| Refinement | ||
| Model resolution (Å) | ||
| FSC 0.143, unmasked/masked | 2.76/2.73 | 3.91/3.81 |
| Model composition | ||
| Non-hydrogen atoms | 7846 | 23,526 |
| Protein residues | 993 | 2979 |
| Ligands | 4 | 0 |
| B factors (Å2) | ||
| Protein (Å2) | 58.78 | 43.80 |
| Ligands (Å2) | 51.14 | |
| RMS deviation | ||
| Bond length (Å) | 0.002 | 0.012 |
| Bond angle (°) | 0.474 | 1.153 |
| MolProbity score | 1.45 | 2.28 |
| Clash score | 6.47 | 24.79 |
| Rotamer outliers (%) | 0.00 | 0.60 |
| Ramachandran plot | ||
| Favored (%) | 97.56 | 94.16 |
| Allowed (%) | 2.44 | 5.84 |
| Disallowed (%) | 0.00 | 0.00 |
Interaction of the LGI1EPTP–ADAM22ECD complex
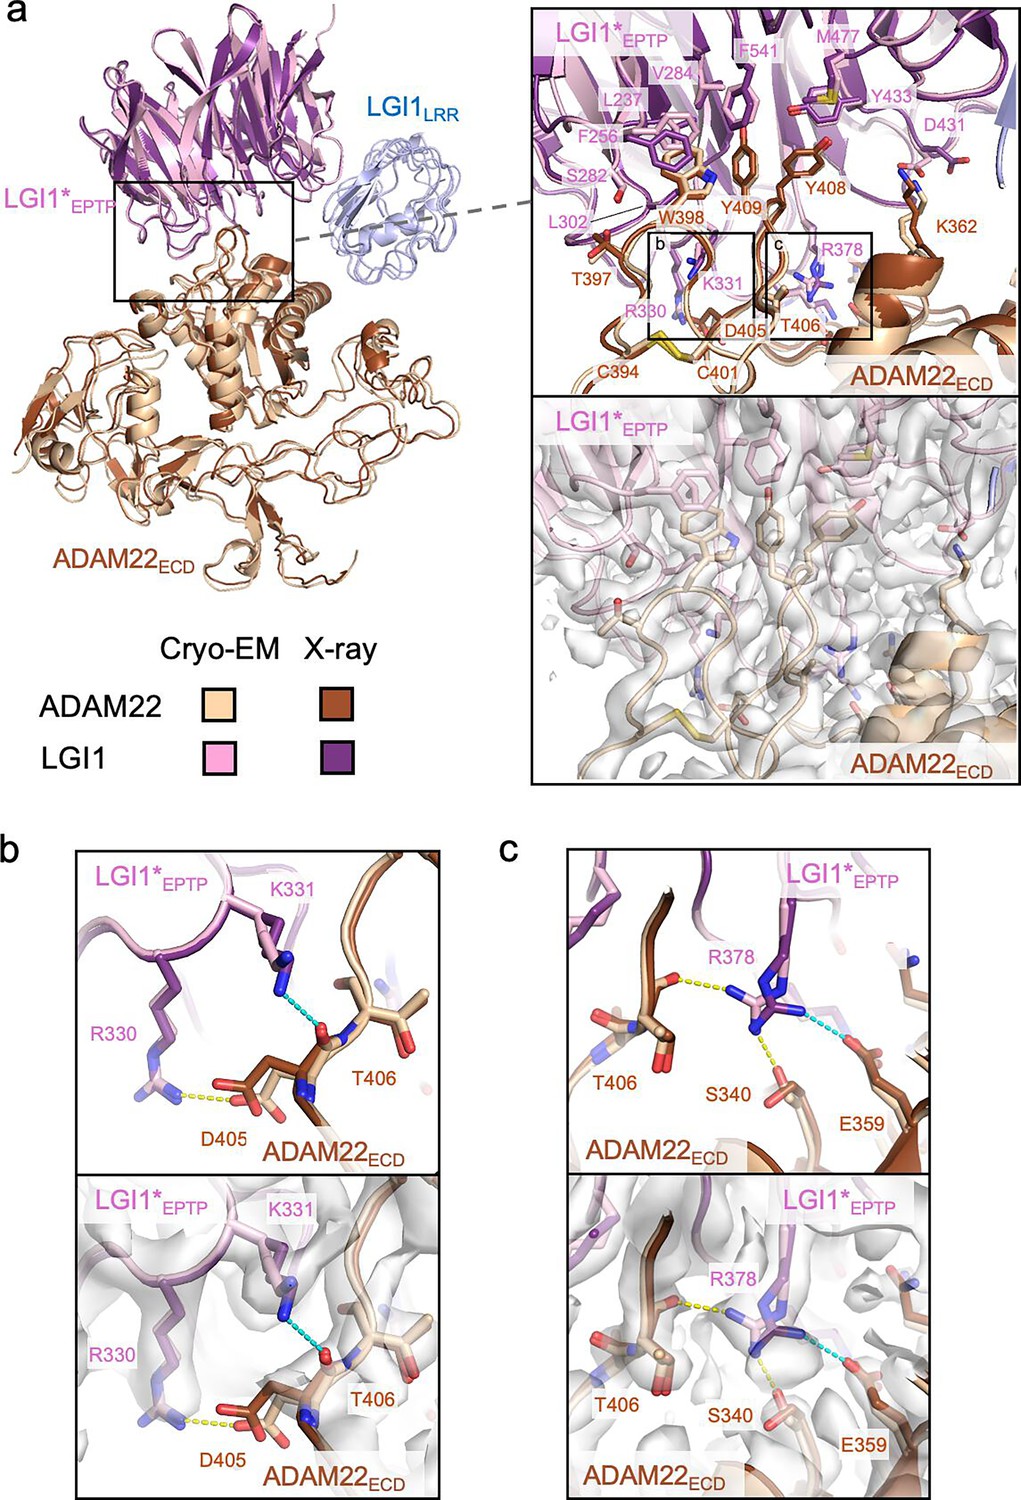
In the cryo-EM structure of the LGI1LRR–LGI1*EPTP–ADAM22ECD complex, the LGI1EPTP–ADAM22ECD structure is essentially identical to that determined by X-ray crystallography (Figure 2a). At the interface, Trp398, Tyr408, and Tyr409 of ADAM22 are stacked in a layer and project into the hydrophobic inner rim of the central channel of LGI1EPTP, which consists of Leu237, Phe256, Val284, Leu302, Tyr433, Met477, and Phe541 of LGI1 (Figure 2a). In addition, several hydrogen bonds are formed between LGI1 and ADAM22: Arg330 and Lys353 of LGI1 form hydrogen bonds with Asp405 and Glu359 of ADAM22, respectively, whereas Arg378 of LGI1 forms hydrogen bonds with Ser340 and Thr406 of ADAM22 (Figure 2b and c, Figure 2—figure supplement 1). The hydrogen bond between Asp431 of LGI1 and Lys362 of ADAM22 was also found in the cryo-EM structure (Figure 2—figure supplement 1). These hydrogen bonds differ slightly from those in the previous crystal structure: in the previous crystal structure, Lys331 of LGI1 formed a hydrogen bond with the main-chain carbonyl of Asp405 of ADAM22. On the other hand, in the present cryo-EM structure, Lys331 of LGI1 is reoriented and does not form a hydrogen bond (Figure 2b). Arg378 of LGI1 hydrogen bonds with Ser340 and Glu359 in the crystal structure, while it does with Ser340 and Thr406 in the cryo-EM structure (Figure 2c). In the crystal structure, Asp431 of LGI1 faces outward and does not form a hydrogen bond with Lys362 of ADAM22 (Figure 2—figure supplement 1). These differences in hydrogen bonding may reflect the varying contribution of each interacting residue to the affinity between LGI1EPTP and ADAM22ECD. As shown in our previous pull-down experiments, mutations of the hydrophobic residues at the interface of ADAM22 (i.e. Trp398, Tyr408, and Tyr409) almost or completely abolished binding to LGI1, whereas the E359A or D405A mutation of ADAM22 decreased but did not abolish binding to LGI1 (Yamagata et al., 2018). The hydrogen bonds involved in the LGI1EPTP–ADAM22ECD interaction might be so weak that the orientation of the hydrogen bonding residues could alter. In the cryo-EM structure, we also found hydrogen bonds between Ser282 of LGI1 and the main-chain carbonyl of Thr397 of ADAM22, between the main-chain carbonyl of Trp376 of LGI1 and Gln334 of ADAM22, and between Lys353 of LGI1 and the main-chain carbonyl of Phe335 of ADAM22 (Figure 2—figure supplement 1). These three hydrogen bonds were also formed in the crystal structure.
Figure 2 with 1 supplement see all
Interactions between LGI1EPTP and ADAM22ECD.
(a) Overall view of the cryo-electron microscopy (cryo-EM) structure of the LGI1LRR–LGI1*EPTP–ADAM22ECD complex and a magnified view of the interface between LGI1*EPTP and ADAM22ECD. The density map of the interface is shown as white surfaces. The previously reported X-ray structure of the LGI1EPTP–ADAM22ECD complex (PDB 5Y2Z) is superposed with distinct colors. Two boxes in the magnified view indicate the locations of the views shown in (b, left box) and (c, right box). (b) Close-up view of the interaction between Arg330 of LGI1*EPTP and Asp405 of ADAM22ECD. The structure (top) and corresponding map (bottom) are shown. Yellow and cyan dashed lines indicate a hydrogen bond observed in the cryo-EM and X-ray structures, respectively. (c) Close-up view of the interaction around Arg378 of LGI1. The structure (top) and corresponding map (bottom) are shown. Yellow and cyan dashed lines indicate hydrogen bonds observed in the cryo-EM and X-ray structures, respectively.
Intermolecular interactions between LGI1LRR and LGI1*EPTP
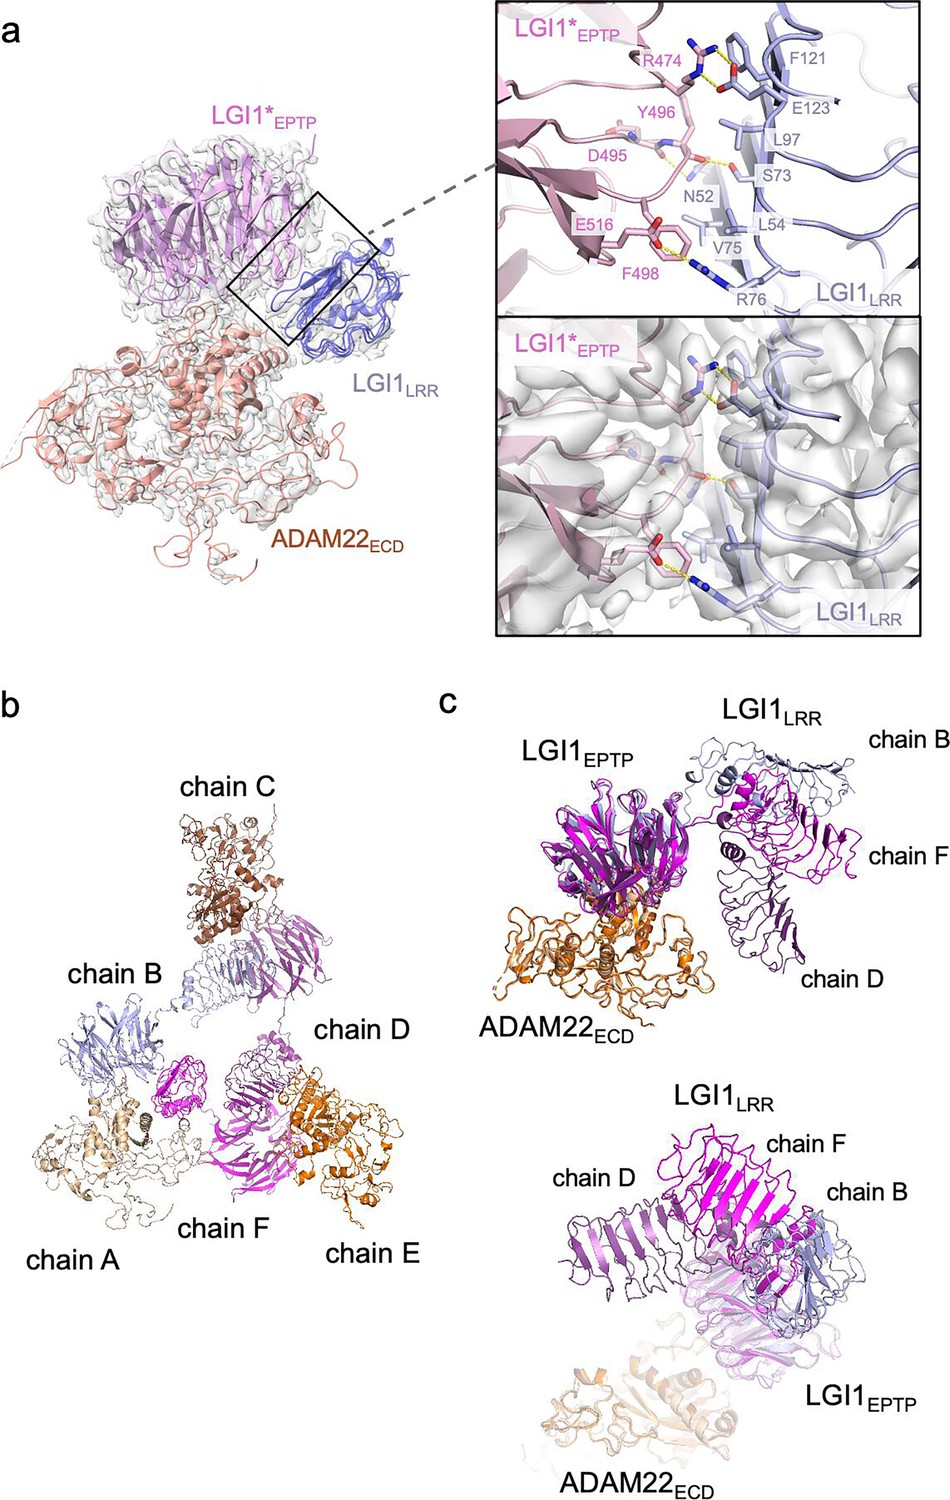
The present cryo-EM map of the LGI1LRR–LGI1*EPTP–ADAM22ECD complex provides a more detailed view of the interaction between LGI1LRR and LGI1*EPTP (Figure 3a) than the previous crystal structure of the 2:2 complex at a moderate resolution of 7.125 Å. Specifically, Glu123 and Arg76 of LGI1LRR form hydrogen bonds with Arg474 and Glu516 of LGI1*EPTP, respectively. The hydrogen bond between Glu123 of LGI1LRR and Arg474 of LGI*EPTP is reinforced by stacking with Phe121 of LGI1LRR (Figure 3a). Additionally, Asn52 and Ser73 of LGI1LRR form hydrogen bonds with the main-chain carbonyls of Tyr496 and Asp495 of LGI1*EPTP, respectively. Leu54, Val75, Leu97, and Phe121 of LGI1LRR also form extensive hydrophobic interactions (Figure 3a). The R474Q mutation in LGI1EPTP is a missense ADEAF mutation in LGI1, known to cause epileptic symptoms by inhibiting the assembly of the LGI1–ADAM22 higher-order complex (Dazzo et al., 2016; Kawamata et al., 2010; Yamagata et al., 2018). The present higher-resolution structure demonstrates that Arg474 of LGI1*EPTP forms a hydrogen bond with Glu123 of LGI1LRR, which was ambiguous in the previous moderate-resolution crystal structure. Regarding interactions for the higher-order assembly, the previous crystal structure suggested a possible interaction between His116 of LGI1LRR and Glu446 of ADAM22 (Yamagata et al., 2018). However, in the present cryo-EM structure, the distance between His116 and Glu446 is 6.6 Å (Figure 3—figure supplement 1), indicating that they do not interact with each other. No tight interaction was found between LGI1LRR and ADAM22ECD in the cryo-EM structure of the LGI1LRR–LGI1*EPTP–ADAM22ECD complex.
Figure 3 with 5 supplements see all
Structure and interaction of the higher-order LGI1–ADAM22ECD complex.
(a) Overall view of the cryo-electron microscopy (cryo-EM) structure of the LGI1LRR–LGI1*EPTP–ADAM22ECD complex and a magnified view of the interface between LGI1LRR and LGI1*EPTP. The density map of the interface is shown as white surfaces. (b) Chain IDs of the individual LGI1 or ADAM22ECD molecules in the 3:3 LGI1–ADAM22ECD complex, assigned in this study. (c) Superposition of the three LGI1–ADAM22ECD complexes in the cryo-EM structure of the 3:3 LGI1-ADAM22ECD complex, using LGI1EPTP–ADAM22ECD as the reference.
Cryo-EM structure of the 3:3 LGI1–ADAM22ECD complex
The cryo-EM structure of the LGI1LRR–LGI1*EPTP–ADAM22ECD complex could fit a density map of the 3:3 LGI1–ADAM22ECD complex well. Three LGI1LRR–LGI1*EPTP–ADAM22ECD complex structures were put into the 3.79-Å-resolution map of the 3:3 complex. The density of LGI1 and the metalloprotease-like domain of ADAM22ECD appears relatively strong. The density of one interface between LGI1*EPTP and ADAM22ECD is especially resolved well (Figure 3—figure supplement 2; see the interface between chains A and B). Although the density of amino acid side chains in LGI1LRR is not well separated, the main-chain structure of LGI1LRR could be fitted to the density map (Figure 3—figure supplement 2; see the density of LGI1LRR in chain F). On the other hand, the density of the disintegrin, cysteine-rich, and EGF-like domains after Pro445 of ADAM22 is relatively weak in all three molecules. Correspondingly, in the local resolution map of the 3:3 LGI1–ADAM22ECD complex, the resolution of these ADAM22 domains after Pro445 is low (Figure 3—figure supplement 3). Like the crystal structure of the 2:2 LGI1–ADAM22ECD complex, the LRR and EPTP domains of LGI1 are linked by a two-residue linker (Ile222–Ile223) in an extended conformation. LGI1EPTP interacts with the metalloprotease-like domain of ADAM22 to form the LGI1EPTP–ADAM22ECD complex, while the LRR domain of one LGI1 molecule interacts with the EPTP domain of the neighboring LGI1, thereby bridging three distant ADAM22 molecules in the 3:3 complex (Figure 1d and e). The C-termini of the three ADAM22 molecules point in opposite directions. When the three assembled LGI1–ADAM22ECD complexes were superposed with the LGI1EPTP–ADAM22ECD structure as the reference, all three LGI1 LRR domains were oriented differently (Figure 3b and c). Although the triangular shape observed in the 2D class-averaged image suggested (pseudo-)C3 symmetry of the 3:3 complex, the determined structure of the 3:3 complex was not symmetric. Actually, the C3 symmetry-restrained 3:3 model that we previously calculated based on the SEC-SAXS analysis using the program SASREF (Petoukhov and Svergun, 2005; Yamagata et al., 2018) could not be fitted with the present cryo-EM structure (Figure 3—figure supplement 4a and b). This discrepancy arises from the difference in the orientation of LGI1LRR relative to the LGI1*EPTP–ADAM22 complex between the previous model and the present cryo-EM structure (indicated by the arrowhead in Figure 3—figure supplement 4b). The structure of the 3:3 LGI1–ADAM22 complex was also predicted by AlphaFold3 (Abramson et al., 2024), which suggested a C3 symmetric assembly (Figure 3—figure supplement 4a). Intriguingly, the orientation of LGI1LRR relative to LGI1*EPTP–ADAM22 was similar to that observed in the present cryo-EM structure (indicated by the arrowhead in Figure 3—figure supplement 4c), despite relatively low prediction accuracy of the assembly (ipTM = 0.47, pTM = 0.52; pLDDT color outputs and PAE plot are shown in Figure 3—figure supplement 4d and e). On the other hand, the overall trimeric configuration is different between the C3 symmetric AlphaFold3 model and the nonsymmetric cryo-EM structure (Figure 3—figure supplement 4c).
We then analyzed the interdomain motion of the three LGI1 domains (assigned to chains B, D, and F in the deposited PDB file; Figure 3b) in the 3:3 LGI1–ADAM22ECD complex by the DynDom server (Veevers and Hayward, 2019; Figure 3—figure supplement 5, and Table 2). Analysis of the motion between the three pairs of chains suggested that the static domain corresponds to the EPTP domain, while the mobile domain corresponds to the LRR domain, predicting a hinge region for interdomain bending. The LRR domain of chain D was rotated 69.8° around the hinge axis compared to chain B, and the LRR domain of chain F was rotated 69.0° around the hinge axis compared to chain B. The LRR domains of chain D and chain F were also rotated 70.0° around the hinge axis relative to each other, suggesting that each LRR domain rotates approximately 70° about the hinge axis in the 3:3 LGI1–ADAM22ECD complex (Table 2). Furthermore, the motion of each LRR domain varied widely: the movement of the LRR domain of chain D with respect to chain B follows a standard closure motion of 14%, whereas the movement of the LRR domain of chain F with respect to chain D follows a standard closure motion of 99% (Table 2). This closure motion appears to locate the LRR domain of chain F in close proximity to that of chain D to make the triangular assembly slightly more compact, which might stabilize the nonsymmetric trimeric configuration observed in the cryo-EM structure.
Table 2
Domain motion analysis of LGI1 in the 3:3 LGI1–ADAM22ECD complex by the DynDom server.
| Chain IDs | DynDom parameters | LGI1 |
|---|---|---|
| B vs D | Fixed domain | Residues 225–549 (RMSD 1.79 Å) |
| Moving domain | Residues 43–224 (RMSD 1.16 Å) | |
| Rotation angle (°) | 69.8 | |
| Translation (Å) | –1.8 | |
| Closure (%) | 13.8 | |
| Bending residues | 215–225 | |
| B vs F | Fixed domain | Residues 223–549 (RMSD 1.01 Å) |
| Moving domain | Residues 43–222 (RMSD 1.19 Å) | |
| Rotation angle (°) | 69.0 | |
| Translation (Å) | –0.8 | |
| Closure (%) | 52.8 | |
| Bending residues | 215–223 | |
| D vs F | Fixed domain | Residues 224–549 (RMSD 1.82 Å) |
| Moving domain | Residues 43-223 (RMSD 1.24 Å) | |
| Rotation angle (°) | 70.0 | |
| Translation (Å) | –1.7 | |
| Closure (%) | 99.0 | |
| Bending residues | 218–225 |
Dynamics of the LGI1–ADAM22 higher-order complex observed by HS-AFM
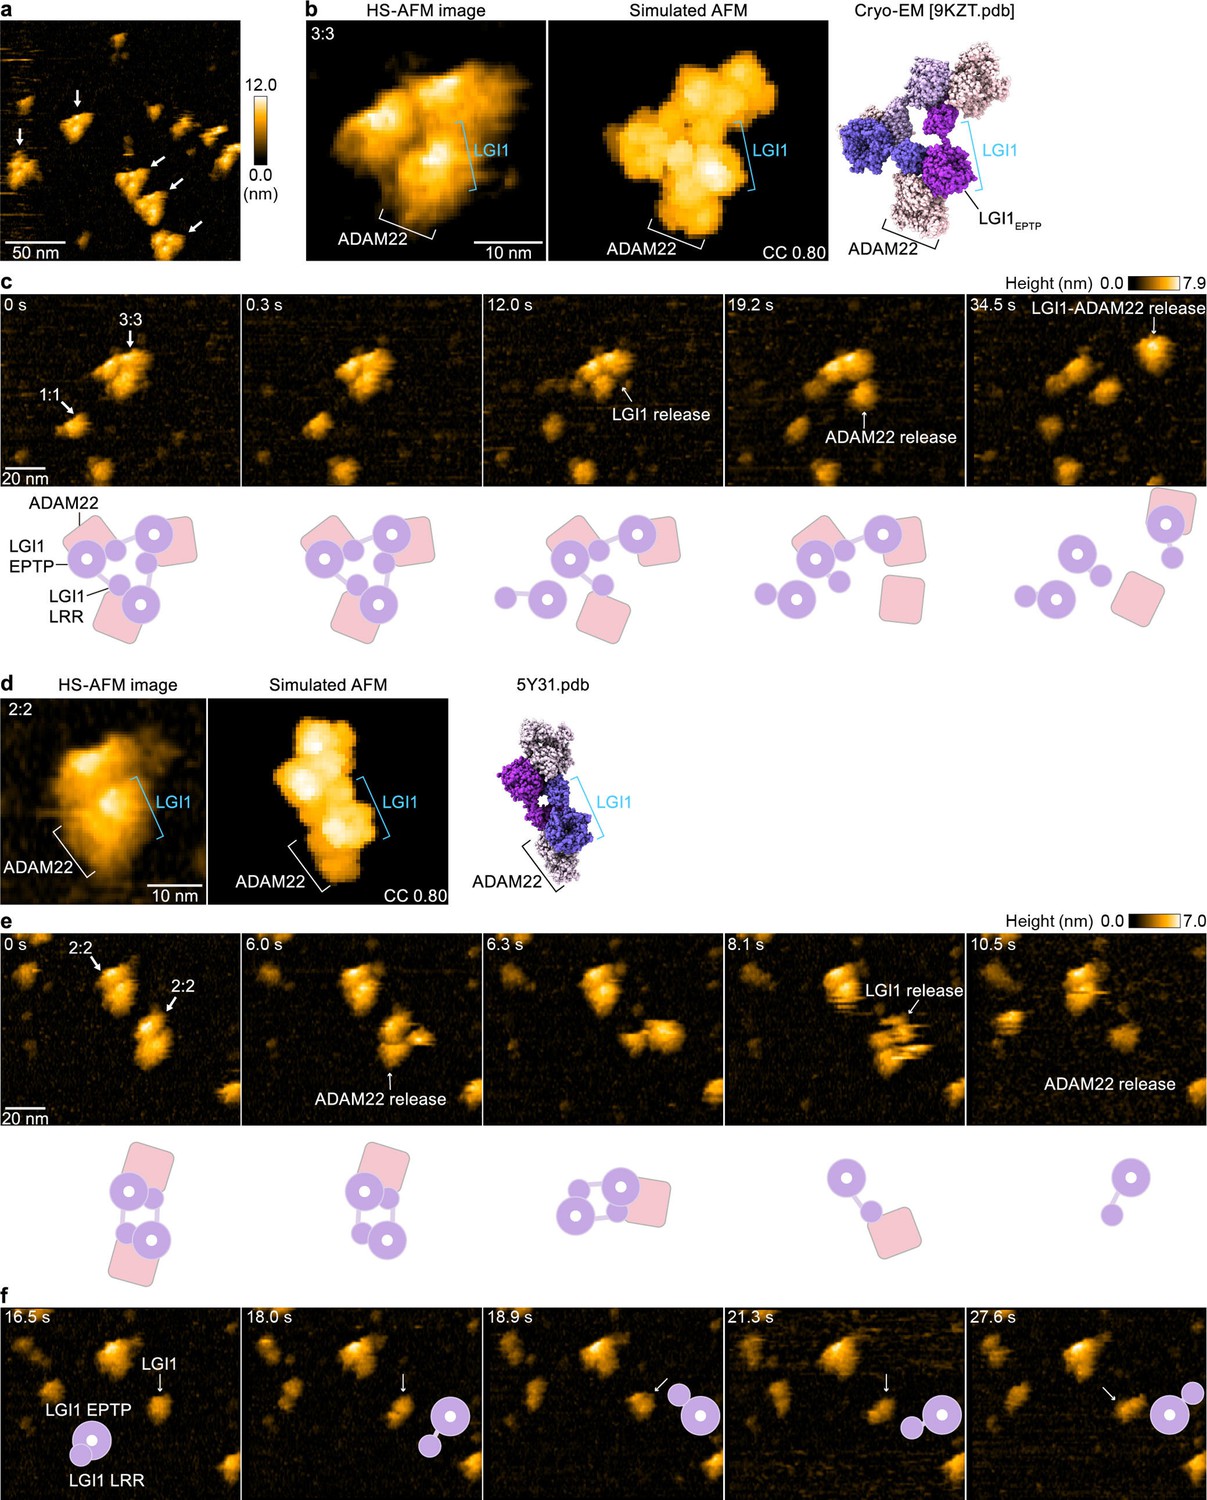
To directly visualize the molecular dynamics of the LGI1–ADAM22ECD complex and characterize its structural properties in solution, we performed HS-AFM (Ando et al., 2001; Sumino et al., 2024). HS-AFM images of gel filtration chromatography fractions containing the 3:3 LGI1–ADAM22ECD complex (not chemically cross-linked with glutaraldehyde) predominantly revealed triangular-shaped molecules, which appeared to exist stably with no drastic structural changes (Figure 4a–c and Figure 4—video 1). A comparison with the simulated AFM image suggests that the protrusion on the exterior of the triangle is likely ADAM22 (Figure 4b). This site frequently appeared to dissociate during HS-AFM scanning (Figure 4c and Figure 4—video 1), indicating that the interaction between LGI1 and ADAM22 is weaker than the interactions among LGI1 molecules within the 3:3 LGI1–ADAM22ECD assembly. Together with the cryo-EM structure, this also indicates that the trimerization can be entirely organized by LGI1, suggesting the possibility that LGI1 could trimerize on its own, although this possibility could not be tested due to the difficulty in the expression of the full-length LGI1 alone for biophysical analysis in our hands. On the other hand, considering the dynamic property of the 3:3 complex and spatial alignment of LGI1LRR and ADAM22ECD, we cannot exclude the possibility that ADAM22 could act as a platform to facilitate the intermolecular interaction between LGI1LRR and LGI1*EPTP for the trimerization of LGI1.
Figure 4 with 2 supplements see all
High-speed atomic force microscopy (HS-AFM) observations of LGI1–ADAM22ECD complexes.
(a) A representative HS-AFM image of the 3:3 LGI1–ADAM22ECD complex. The color bars on the right indicate height in nanometers. White arrows indicate the 3:3 complex. The frame rate was 1.0 frames/s. (b, d) Magnified HS-AFM images of the 3:3 (left in b) and 2:2 (left in d) LGI1–ADAM22ECD complexes. The simulated AFM images (middle) were derived from fitting to the experimental HS-AFM image (left). The well-fitting simulated AFM images and the coefficient of correlation (CC) are indicated. The cryo-electron microscopy (cryo-EM) structure of the 3:3 complex (right in b) and the X-ray structure of the 2:2 complex (right in d) are shown in the same orientation as the simulated AFM images. (c, e, f) Sequential HS-AFM images of the 3:3 (c; see also Figure 4—video 1) and 2:2 (e, f; see also Figure 4—video 2) LGI1–ADAM22ECD complexes. A schematic illustration of the interpretation of HS-AFM images is shown at the bottom. Imaging parameters: scanning area = 120 × 96 nm2 (240×192 pixels); frame rate = 3.3 frames/s. HS-AFM experiments were repeated independently at least three times with consistent results.
In addition to the 3:3 complex, HS-AFM also captured the dynamics of the 2:2 LGI1–ADAM22ECD complex (Figure 4d and e and Figure 4—video 2). A comparison of the experimental HS-AFM image with the simulated AFM image based on the crystal structure of the 2:2 complex indicates that the outer site corresponds to ADAM22, suggesting that LGI1 and ADAM22 are facing each other. The 2:2 complex also exhibited fragility during HS-AFM imaging, similar to the 3:3 complex (Figure 4e and Figure 4—video 2). In individual LGI1 molecules dissociated from the complex, the LRR domain moved freely relative to the EPTP domain (Figure 4f and after 10.2 s in Figure 4—video 2), likely reflecting the conformational difference in the relative orientation between LGI1LRR and LGI1EPTP observed within the cryo-EM structure of the 3:3 complex. Thus, single-molecule observations using HS-AFM demonstrated that the 3:3 LGI1–ADAM22ECD complex is present in solution, that the binding between ADAM22 and LGI1 is relatively weak within the 3:3 LGI1–ADAM22ECD assembly, and that the LRR domain of LGI1 exhibits flexibility.
Discussion
In this study, the ligand–receptor complex between LGI1, a secreted protein of neurons, and its receptor protein, ADAM22, was investigated by cryo-EM and HS-AFM. By chemically cross-linking with glutaraldehyde, we successfully captured much larger numbers of particle images of the 3:3 LGI1–ADAM22ECD complex than in our initial, preliminary cryo-EM study (Yamagata et al., 2018). We could determine not only the overall 3D structure of the 3:3 LGI1–ADAM22ECD complex but also the 3D structure of the LGI1LRR–LGI1*EPTP–ADAM22ECD complex at a nominal resolution of 2.78 Å, revealing the interaction mode of the LGI1–ADAM22 higher-order complex at a higher resolution than before. HS-AFM successfully imaged the LGI1–ADAM22ECD higher-order complex and confirmed that LGI1–ADAM22ECD forms a 3:3 complex in solution.
The present 3.79-Å-resolution cryo-EM map of the 3:3 LGI1–ADAM22ECD complex was calculated from 120,708 particle images selected after two rounds of heterogeneous refinement. On the other hand, a few classes of other particle images display triangular shapes with missing parts, suggesting domain motions or conformational heterogeneity in the 3:3 complex (Figure 1—figure supplement 4). This raised the possibility that motion-based refinement might improve resolution in flexible regions. Therefore, we first performed 3D flexible refinement (3D Flex) using CryoSPARC (Punjani and Fleet, 2023; Animation 1 and 2). However, even with the 3D Flex refinement, the density of the disintegrin, cysteine-rich, and EGF-like domains in the ADAM22 molecule remained poorly resolved. Then, we next hypothesized that the 3:3 LGI1–ADAM22ECD complex undergoes discrete, non-rigid motions and performed 3D Variability Analysis (3D VA) in CryoSPARC (Punjani and Fleet, 2021). Using three orthogonal principal modes, the 3D VA indicated two twisting motions and one stretching motion of the triangular-shaped 3:3 LGI1–ADAM22ECD complex (Animation 3–5). This analysis also visualized relatively large motions of the disintegrin, cysteine-rich, and EGF-like domains of ADAM22 (Animation 3–5), suggestive of intrinsic conformational flexibilities of these domains, likely resulting in lower local resolution in the periphery of the complex (Figure 3—figure supplement 3).
Animation 1
3D flexible refinement (3D Flex) analysis of the 3:3 LGI1–ADAM22ECD complex.
Two latent coordinates were used in the 3D Flex analysis. Two 3D Flex movies (Animations 1 and 2) are displayed at the same threshold.
Animation 2
3D flexible refinement (3D Flex) analysis of the 3:3 LGI1–ADAM22 complex.
Two latent coordinates were used in the 3D Flex analysis. Two 3D Flex movies (Animations 1 and 2) are displayed at the same threshold.
Animation 3
3D Variability Analysis (3D VA) of the 3:3 LGI1–ADAM22ECD complex.
Three variability components are represented in the 3D VA. Three 3D VA movies (Animations 3–5) are displayed at the same threshold. Two movies (Animations 3 and 4) show twisting motion, whereas one movie (Animation 5) shows stretching motion.
Animation 4
3D Variability Analysis (3D VA) of the 3:3 LGI1–ADAM22ECD complex.
Three variability components are represented in the 3D VA. Three 3D VA movies (Animations 3–5) are displayed at the same threshold. Two movies (Animations 3 and 4) show twisting motion, whereas one movie (Animation 5) shows stretching motion.
Animation 5
3D Variability Analysis (3D VA) of the 3:3 LGI1–ADAM22ECD complex.
Three variability components are represented in the 3D VA. Three 3D VA movies (Animations 3–5) are displayed at the same threshold. Two movies (Animations 3 and 4) show twisting motion, whereas this movie shows stretching motion.
Previous studies have shown that LGI1 is enriched not only at the synapse but also at the axon initial segment and colocalized with ADAM22/23 and the voltage-gated potassium (Kv1) channels (Hivert et al., 2019; Seagar et al., 2017). The Kv1-associated cell-adhesion molecules, TAG-1 and Caspr2, likely mediate this colocalization by binding to ADAM22/23. LGI1 knockout mice show a reduced density of Kv1 channels, which is associated with increased neuronal excitability of hippocampal CA3 neurons, indicating that LGI1 regulates Kv1 channel function (Seagar et al., 2017). In addition, the LGI1 R474Q mutation has been found to interfere with the colocalization of ADAM22/23 and Kv1 channels (Hivert et al., 2019). Given that the LGI1 R474Q mutation inhibits the higher-order assembly of LGI1–ADAM22 with little impact on LGI1 secretion and binding to ADAM22, the higher-order complex of LGI1–ADAM22 likely regulates the axonal Kv1 channel function. The 3:3 LGI1–ADAM22 complex observed in vitro might facilitate efficient clustering of the axonal Kv1 channels to control their density and inhibit epilepsy. A recent study has shown that LGI3, a member of the LGI family, selectively co-assembles with Kv1 channels by using ADAM23 as the receptor in axons (Miyazaki et al., 2024). LGI3 is secreted by oligodendrocytes in the brain and enriched at juxtaparanodes of myelinated axons to form subclusters. LGI1 and LGI3, along with ADAM22 and ADAM23, belong to the same subfamily and share a similar domain organization. This suggests that the LGI3–ADAM23 complex, like the LGI1–ADAM22 complex, may form a higher-order assembly, which could be related to the clustering mechanism of Kv1 channels in axons. In this context, as discussed in Miyazaki et al., 2024, either or both of the 2:2 and 3:3 complexes might be formed in a trans fashion at the juxtaparanode of myelinated axons and bridge the axon and the innermost myelin membrane. Alternatively, the 3:3 complex formed in a cis fashion might positively regulate the clustering of the axonal Kv channels at the juxtaparanode, possibly in a similar manner at the axon initial segment. Finally, this study proposes that the LGI1–ADAM22 complex is an interesting therapeutic target for epilepsy and other neurological disorders. The 3:3 LGI1–ADAM22 complex structure revealed in this study could serve as a useful platform for structure-based drug design and facilitate the development of antiepileptic drugs.
Materials and methods
Key resources table
| Reagent type (species) or resource | Designation | Source or reference | Identifiers | Additional information |
|---|---|---|---|---|
| Gene (Homo sapiens) | LGI1 | GenBank | NM_005097 | |
| Gene (Homo sapiens) | ADAM22 | GenBank | NM_021723 | |
| Cell line (Homo sapiens) | Expi293F | Thermo Fisher Scientific | Cat # A14527 | |
| Transfected construct (Homo sapiens) | Igκ-LGI1 (37–557; R470A) -His6 (plasmid) | Yamagata et al., 2018 (PMID:29670100) | pEBMulti-Neo (backbone) | |
| Transfected construct (Homo sapiens) | non-tagged ADAM22 (1–729) (plasmid) | Yamagata et al., 2018 (PMID:29670100) | pEBMulti-Neo (backbone) | |
| Software, algorithm | SerialEM | Mastronarde, 2005; http://bio3d.colorado.edu/SerialEM/ | RRID:SCR_017293 | |
| Software, algorithm | yoneoLocr Version 1.0 | Yonekura et al., 2021; https://github.com/YonekuraLab/yoneoLoc | ||
| Software, algorithm | CryoSPARC Version 4.1.2 | Punjani et al., 2017; https://cryosparc.com | RRID:SCR_016501 | |
| Software, algorithm | Coot | Emsley and Cowtan, 2004; https://www2.mrc-lmb.cam.ac.uk/personal/pemsley/coot/ | RRID:SCR_014222 | |
| Software, algorithm | Phenix Version 1.19–4092 | Adams et al., 2011; https://phenix-online.org | RRID:SCR_014224 | |
| Software, algorithm | UCSF ChimeraX Version 1.15 | Meng et al., 2023; https://www.cgl.ucsf.edu/chimerax/ | RRID:SCR_015872 | |
| Software, algorithm | PyMOL Version 3.1.0 | Schrödinger, LLC ; http://www.pymol.org | RRID:SCR_000305 | |
| Software, algorithm | Fiji (ImageJ) software | Schindelin et al., 2012; https://imagej.net/software/fiji/ | RRID:SCR_002285 | |
| Software, algorithm | BioAFMviewer | Amyot and Flechsig, 2020; https://www.bioafmviewer.com/index.php | ||
| Other | Expi293 Expression Medium | Thermo Fisher Scientific | Cat # A1435101 | Cell culture medium for Expi293F cells |
| Other | Quantifoil holey carbon grid | Quantifoil | R1.2/1.3, Cu, 300 mesh | Carbon holey grid for cryo-EM |
Protein preparation
Request a detailed protocolFor preparation of the LGI1–ADAM22ECD complex, the C-terminally His6-tagged LGI1 (R470A) was co-expressed with the non-tagged ADAM22ECD in Expi293F cells (Thermo Fisher Scientific). As reported previously, the R470A mutation of LGI1 increases the yield of the LGI1–ADAM22ECD complex without affecting the higher-order assembly of LGI1–ADAM22ECD (Yamagata et al., 2018). The vectors for co-expression were the pEBMulti-Neo vector (Wako Chemicals) harboring the gene encoding human LGI1 (full length, residues 37–557; R470A) with the N-terminal Igκ signal sequence and that harboring the gene encoding human ADAM22ECD, including the N-terminal prosequence (residues 1–729), both of which were reported previously (Yamagata et al., 2018). The culture media were loaded onto a Ni-NTA (QIAGEN) column pre-equilibrated with 20 mM Tris-HCl (pH 8.0) containing 300 mM NaCl. After the column was washed with 20 mM Tris-HCl (pH 8.0) containing 300 mM NaCl and 25 mM imidazole, the proteins were eluted with 20 mM Tris-HCl (pH 8.0) containing 300 mM NaCl and 250 mM imidazole. The eluted proteins were further purified by size-exclusion chromatography using Superdex200 (GE Healthcare) with 20 mM Tris-HCl (pH 7.5) buffer containing 50 mM NaCl. The purified proteins were concentrated to 0.25 g/L in Amicon Ultra-15 50,000 MWCO filter (Millipore), and glutaraldehyde was added at a final concentration of 0.1% (vol/vol). The sample was concentrated to 500 µL in Amicon Ultra-4 50,000 MWCO filter (Millipore) and purified by gel filtration chromatography using a Superose 6 10/300 GL (GE Healthcare) column with 20 mM Tris-HCl buffer (pH 7.5) containing 50 mM NaCl. One of the peak fractions was concentrated to 0.5 g/L by Amicon Ultra-0.5 50,000 MWCO filter (Millipore).
Cryo-EM single-particle analysis
Request a detailed protocolCu grids (R1.2/1.3, 300 mesh, Quantifoil) with holey carbon films were hydrophilized using a JEC-3000FC Auto Fine Coater (JEOL) at 7 Pa, 10 mA, and 10 s. A 3 μL aliquot of 0.5 g/L protein solution was added to the grids using a Vitrobot Mark IV (Thermo Fisher Scientific) at a temperature of 8°C and 100% humidity. The grids were then immersed in liquid ethane and rapidly frozen under the following conditions: waiting time of 0 s, blotting time of 3 s, and blotting force of 10. Data collection was carried out on a CRYO ARM 300 transmission electron microscope (JEOL Ltd., Japan) operating at 300 kV, equipped with an Omega-type in-column energy filter (slit width 20 eV) and a Gatan K3 electron detector (operated in correlated doubling sample mode) at SPring-8 (Hyogo, Japan). A total of 7625 movies were automatically collected using SerialEM (Mastronarde, 2005). Hole centering was performed using yoneoLocr (Yonekura et al., 2021) integrated as a SerialEM macro. Movies were collected using the beam-image shift method (5×5×1 matrices), at a target defocus range of −1.4 to −1.7 μm and a nominal magnification of ×60,000, corresponding to a calibrated pixel size of 0.752 Å/pixel. Each movie was recorded with an exposure time of 2.79627 s, subdivided into 60 frames with a total electron dose of 60.8046 e−1 Å−2.
All processing was performed in CryoSPARC v.4.1.2 or higher (Punjani et al., 2017). The collected micrographs were processed using patch motion correction and patch CTF estimation. Particles were picked from 7635 particle images using a template, yielding 3,336,559 particles. After extracting the particles from the micrographs and classifying them into 2D classes, about 60% of the particles based on the average 2D image of the protein were selected. An initial 3D reconstruction and heterogeneous refinement were performed on six classes, and one of these classes was further refined by nonuniform refinement to obtain a 2.78 Å resolution 3D map of the LGI1LRR–LGI1*EPTP–ADAM22ECD complex. Additionally, by performing ab initio reconstruction and heterogeneous refinement of one of the six classes into three subclasses and refining one of these subclasses further with nonuniform refinement (Punjani et al., 2020), a 3D map of the 3:3 LGI1–ADAM22ECD complex with a resolution of 3.79 Å was obtained. Overall resolution estimates correspond to a Fourier shell correlation of 0.143 using an optimized mask that is automatically determined after refinement. Local resolution maps were obtained using local resolution estimation. Movies were created using 3D VA (Punjani and Fleet, 2021) and 3D Flex (Punjani and Fleet, 2023).
Model building
Request a detailed protocolModel building was performed using the programs Coot (Emsley and Cowtan, 2004) and UCSF ChimeraX (Meng et al., 2023). The initial model of the LGI1LRR–LGI1*EPTP–ADAM22ECD complex was built using a part of the crystal structure of the 2:2 LGI1–ADAM22ECD complex (PDB 5Y31) (Yamagata et al., 2018) and fitted into the cryo-EM map. The initial model of the 3:3 LGI1–ADAM22ECD complex was built using the cryo-EM structure of the LGI1LRR–LGI1*EPTP–ADAM22ECD complex. Three LGI1LRR–LGI1*EPTP–ADAM22ECD complexes were fitted into the cryo-EM map, and LGI1LRR and LGI1EPTP were connected by modeling the linker region. The structure refinement was performed using the Phenix software package (Adams et al., 2011). All figures and movies were created using the program PyMOL (Schrödinger, LLC) and UCSF ChimeraX (Meng et al., 2023).
HS-AFM observations
Request a detailed protocolHS-AFM experiments were conducted using a custom-built HS-AFM operating in tapping mode (Sumino et al., 2024). Briefly, an optical beam deflection detector monitored the cantilever’s (BL-AC10DS-A2, Olympus, Japan) deflection using a 780 nm, 0.8 mW infrared (IR) laser. The cantilever exhibited a spring constant of approximately 100 pN/nm, a resonant frequency near 400 kHz, and a quality factor around 2 in a liquid environment. The IR beam was directed onto the cantilever’s back surface through a ×60 objective lens (CFI S Plan Fluor ELWD 60X, Nikon, Japan), and its reflection was detected by a two-segmented PIN photodiode (MPR-1, Graviton, Japan). The initial AFM tip had a triangular section resembling a bird’s beak. To enhance spatial resolution, an amorphous carbon tip was grown on the bird beak tip via electron beam deposition using a scanning electron microscope (FE-SEM; Verious 5UC, Thermo Fisher Scientific, USA). The additional AFM tip was roughly 500 nm long, with an apex radius of approximately 1 nm after plasma etching with a plasma cleaner (Tergeo, PIC Scientific, USA). All HS-AFM images were obtained using the cantilever with the additional AFM tip. The cantilever’s free oscillation amplitude was less than 1 nm, and during HS-AFM scanning, the set point amplitude was adjusted to roughly 90% of the free amplitude. To minimize interaction forces between the sample and the AFM tip, ‘only trace imaging’ (OTI) mode (Fukuda and Ando, 2021) was employed for HS-AFM.
HS-AFM observations of the LGI1–ADAM22ECD complex (not chemically cross-linked with glutaraldehyde) were conducted on AP-mica, prepared by treating the mica surface with 0.00005% (3-aminopropyl)triethoxysilane (APTES) (Shin-Etsu Chemical, Japan) in MilliQ water for 3 min. Samples at a concentration of 10 nM were added to the AP-mica surface after 3 min incubation of 3 µL. HS-AFM observations of the LGI1–ADAM22ECD complex were performed in 20 mM Tris-HCl (pH 7.4) buffer containing 150 mM NaCl. All HS-AFM experiments were performed at room temperature (24–26°C) and were independently repeated at least three times, consistently yielding similar results. For image processing, the HS-AFM images were processed using Fiji (ImageJ) software (NIH, USA) (Schindelin et al., 2012). A mean filter with a radius of 0.5 pixels was utilized to lower noise levels in each image. The Template Matching and Slice Alignment plugin for ImageJ was used to correct for drift between sequential images.
Simulation of AFM images
Request a detailed protocolThe BioAFMviewer software (Amyot and Flechsig, 2020) was utilized to validate the captured topographies of the LGI1–ADAM22ECD complex. The simulated scanning was based on the nonelastic collisions between a rigid cone-shaped tip model and the rigid van der Waals atomic model of the protein structure. Automatized fitting (Amyot et al., 2022) was employed to generate a simulated image that closely matched the HS-AFM target image (image correlation coefficients reported in each figure). In the simulation presented in Figure 4, the tip shape parameters were set to R=0.4 nm for the tip probe sphere radius and α=5.0° for the cone half angle.
Cell lines
Request a detailed protocolExpi293F cell lines were purchased from and authenticated by Thermo Fisher Scientific (A14527). The mycoplasma contamination test was confirmed to be negative.
Data availability
The coordinates and maps of the LGI1LRR–LGI1*EPTP–ADAM22ECD complex and the 3:3 LGI1–ADAM22ECD complex have been deposited in the Protein Data Bank/Electron Microscopy Data Bank under the accession codes of 9KZC/EMD-62659 and 9KZT/EMD-62668, respectively.
-
Worldwide Protein Data BankCryo-EM structure of the LGI1 LRR-LGI1 EPTP-ADAM22 ECD complex.https://doi.org/10.2210/pdb9KZC/pdb
-
Electron Microscopy Data BankID EMD-62659. Cryo-EM structure of the LGI1 LRR-LGI1 EPTP-ADAM22 ECD complex.
-
Worldwide Protein Data BankCryo-EM structure of the 3:3 LGI1-ADAM22 complex.https://doi.org/10.2210/pdb9KZT/pdb
-
Electron Microscopy Data BankID EMD-62668. Cryo-EM structure of the 3:3 LGI1-ADAM22 complex.
References
-
BioAFMviewer: An interactive interface for simulated AFM scanning of biomolecular structures and dynamicsPLOS Computational Biology 16:e1008444.https://doi.org/10.1371/journal.pcbi.1008444
-
Coot: model-building tools for molecular graphicsActa Crystallographica. Section D, Biological Crystallography 60:2126–2132.https://doi.org/10.1107/S0907444904019158
-
Epilepsy and synaptic proteinsCurrent Opinion in Neurobiology 45:1–8.https://doi.org/10.1016/j.conb.2017.02.001
-
Faster high-speed atomic force microscopy for imaging of biomolecular processesThe Review of Scientific Instruments 92:033705.https://doi.org/10.1063/5.0032948
-
LGI1 is mutated in familial temporal lobe epilepsy characterized by aphasic seizuresAnnals of Neurology 52:364–367.https://doi.org/10.1002/ana.10280
-
ADAM22 and ADAM23 modulate the targeting of the Kv1 channel-associated protein LGI1 to the axon initial segmentJournal of Cell Science 132:jcs219774.https://doi.org/10.1242/jcs.219774
-
Automated electron microscope tomography using robust prediction of specimen movementsJournal of Structural Biology 152:36–51.https://doi.org/10.1016/j.jsb.2005.07.007
-
UCSF ChimeraX: Tools for structure building and analysisProtein Science 32:e4792.https://doi.org/10.1002/pro.4792
-
Mutations in the LGI1/Epitempin gene on 10q24 cause autosomal dominant lateral temporal epilepsyHuman Molecular Genetics 11:1119–1128.https://doi.org/10.1093/hmg/11.9.1119
-
Pathway-driven discovery of epilepsy genesNature Neuroscience 18:344–350.https://doi.org/10.1038/nn.3933
-
3D variability analysis: resolving continuous flexibility and discrete heterogeneity from single particle cryo-EMJournal of Structural Biology 213:107702.https://doi.org/10.1016/j.jsb.2021.107702
-
Fiji: an open-source platform for biological-image analysisNature Methods 9:676–682.https://doi.org/10.1038/nmeth.2019
-
The novel EPTP repeat defines a superfamily of proteins implicated in epileptic disordersTrends in Biochemical Sciences 27:441–444.https://doi.org/10.1016/s0968-0004(02)02163-1
-
Genetic mechanisms that underlie epilepsyNature Reviews. Neuroscience 5:400–408.https://doi.org/10.1038/nrn1388
-
Methodological improvements for the analysis of domain movements in large biomolecular complexesBiophysics and Physicobiology 16:328–336.https://doi.org/10.2142/biophysico.16.0_328
Article and author information
Author details
Funding
Japan Society for the Promotion of Science (19H03162)
- Atsushi Yamagata
Japan Society for the Promotion of Science (23H00374)
- Masaki Fukata
Japan Society for the Promotion of Science (18H03983)
- Shuya Fukai
Japan Society for the Promotion of Science (23H04070)
- Shuya Fukai
Japan Agency for Medical Research and Development (JP24wm0625319)
- Yuko Fukata
Japan Agency for Medical Research and Development (JP24ek0109649)
- Masaki Fukata
Takeda Science Foundation
- Shuya Fukai
Ministry of Education, Culture, Sports, Science and Technology (WPI)
- Mikihiro Shibata
The funders had no role in study design, data collection and interpretation, or the decision to submit the work for publication.
Acknowledgements
This research was partially supported by the Research Support Project for Life Science and Drug Discovery (Basis for Supporting Innovative Drug Discovery and Life Science Research [BINDS]) from AMED under Grant Number JP24ama121001. Preliminary cryo-EM experiments were performed at EM01CT/EM02CT with the approval of the Japan Synchrotron Radiation Research Institute (JASRI) (Proposal No. 2021B2542, 2022A2542, 2022B2543, and 2023A2543). This work was supported by JSPS/MEXT KAKENHI (19H03162 to AY, 23H00374 to MF, 18H03983 and 23H04070 to SF), Japan Agency for Medical Research and Development (JP24wm0625319 to YF and JP24ek0109649 to MF), Takeda Science Foundation (to SF), the World Premier International Research Center Initiative (WPI), MEXT, Japan (to MS).
Version history
- Preprint posted:
- Sent for peer review:
- Reviewed Preprint version 1:
- Reviewed Preprint version 2:
- Version of Record published:
Cite all versions
You can cite all versions using the DOI https://doi.org/10.7554/eLife.105918. This DOI represents all versions, and will always resolve to the latest one.
Copyright
© 2025, Yamaguchi, Okatsu et al.
This article is distributed under the terms of the Creative Commons Attribution License, which permits unrestricted use and redistribution provided that the original author and source are credited.
Metrics
-
- 1,391
- views
-
- 123
- downloads
-
- 2
- citations
Views, downloads and citations are aggregated across all versions of this paper published by eLife.
Citations by DOI
-
- 1
- citation for umbrella DOI https://doi.org/10.7554/eLife.105918
-
- 1
- citation for Version of Record https://doi.org/10.7554/eLife.105918.3
Download links
A two-part list of links to download the article, or parts of the article, in various formats.
Downloads (link to download the article as PDF)
Open citations (links to open the citations from this article in various online reference manager services)
Cite this article (links to download the citations from this article in formats compatible with various reference manager tools)
Structural insights into heterohexameric assembly of epilepsy-related ligand–receptor complex LGI1–ADAM22
eLife 14:RP105918.
https://doi.org/10.7554/eLife.105918.3


