Identification of a Munc13-sensitive step in chromaffin cell large dense-core vesicle exocytosis
- Max Planck Institute of Experimental Medicine, Germany
- Leibniz Institute for Molecular Pharmacology, Germany
- Faculty of Health and Medical Sciences and Lundbeck Foundation Center for Biomembranes in Nanomedicine, University of Copenhagen, Denmark
- Saarland University, Germany
Figures
Figure 1 with 1 supplement

Expression of Munc13 isoforms in the mouse adrenal gland.
KO mouse lines of the respective Munc13 isoform were used as control. The antibodies used to detect individual Munc13 isoforms and loading controls are indicated on the left. (A) Munc13-1 (*) is barely detectable in perinatal adrenal gland. (B) ubMunc13-2, but not bMunc13-2, is expressed. (C) Munc13-3 was not detected. (D) Baiap3 was detected, but not (E) Munc13-4. Jx refers to mice homozygous for the Unc13dJinxmutation (Crozat et al., 2007). (F) Munc13-1 and Baiap3 are mainly located in the medulla (Med), but ubMunc13-2 is present in cortex (Cort) as well. Please note that the difference in the position of ubMunc13-2 relative to the marker in panels (B) and (F) is due to how far the respective gels were run. Loading controls were valosin-containing protein (VCP), glyceraldehyde-3-phosphate dehydrogenase (GAPDH) and CgA. Brain samples, and spleen tissue in the case of Munc13-4, were used for comparison. Please note that the Baiap3KO (Wojcik et al., 2013) and Unc13aKO animals express truncated protein products, whereas the truncated product present in the Unc13bKO (Cooper et al., 2012) is not shown here. Based on previous analyses of the Unc13aKO and Unc13bKO mice (Augustin et al., 1999; Cooper et al., 2012; Varoqueaux et al., 2002), the truncated Munc13-1 and Munc13-2 products are neither functional, nor do they have a dominant-negative effect. The truncated Baiap3 product was not detected in adrenal gland, and its effect in the brain, where it can be detected in young animals up to P21, is currently unknown (Wojcik et al., 2013). See also Figure 1—figure supplement 1.
Figure 1—figure supplement 1

Comparison of Munc13-1, Munc13-2, and Munc13-3 expression.
(A) Adrenal gland and brain homogenates from Unc13a-EYFP, Unc13b-EYFP, and Unc13c-EGFP knock-in (KI) mice were probed using an antibody that recognizes the GFP-derived tags, which allowed us to compare expression levels of Munc13-1, ubMunc13-2, bMunc13-2 and Munc13-3 with the same antibody. The two bands detected in the Unc13b-EYFP KI brain sample represent ubMunc13-2 (lower band) and bMunc13-2 (upper band). While all isoforms were detected in brain, ubMunc13-2-EYFP was the only isoform readily detectable in the adrenal gland. Valosin-containing protein (VCP) was used as a loading control. (B) Adrenal gland and brain samples from Unc13aKOUnc13bKO (DKO) mice and WT controls, probed with antibodies to Munc13-1, ubMunc13-2 and VCP as a loading control. Expression of Munc13-1 (marked with *, to distinguish it from co-migrating bands of higher molecular weight) is low in E18 adrenal glands, while ubMunc13-2 can be readily detected. The expression of both isoforms was abrogated in DKO mice. Please note that, like the single KO lines, the DKO animals express truncated Munc13-1 protein products and a truncated Munc13-2 product (Cooper et al., 2012), the latter is not shown here.
Figure 2 with 1 supplement

Flash photolysis induced LDCV exocytosis in chromaffin cells.
For each KO line, the average intracellular [Ca2+] ± SEM and the average △Cm are shown in panels (A–C, E). Single gene deletions of (A) Unc13a, (B) Unc13c, or (C) Baiap3 did not impair LDCV exocytosis. (D) Summary of burst sizes, sustained release rates, and time constants. (E) LDCV exocytosis is dramatically reduced in Unc13aKOUnc13bKO cells, Unc13aWTUnc13bKO cells, and Unc13aHetUnc13bKO cells. This reduction is primarily due to the absence of ubMunc13-2. (F) Fast burst, slow burst and the rate of sustained release are reduced in the absence of Munc13-1 and ubMunc13-2, as well as in the absence of ubMunc13-2 alone (ANOVA with post-hoc Tukey’s test). (G) Compared to Unc13aWTUnc13bKO cells, the deletion of Munc13-1 causes significant reductions in the slow burst and the rate of sustained release (Student’s t-test, two-tailed). (H) Delay of the onset of exocytosis after the flash stimulus (ANOVA with post-hoc Tukey’s test). (I) Normalized traces show identical release kinetics of the exocytotic burst. (J) Summary of the release components shown in panels (E, F, G). Time constants are not significantly different (ANOVA with post-hoc Tukey’s test). (*p < 0.05, **p < 0.01, ***p < 0.001). See also Figure 2—figure supplement 1.
Figure 2—figure supplement 1
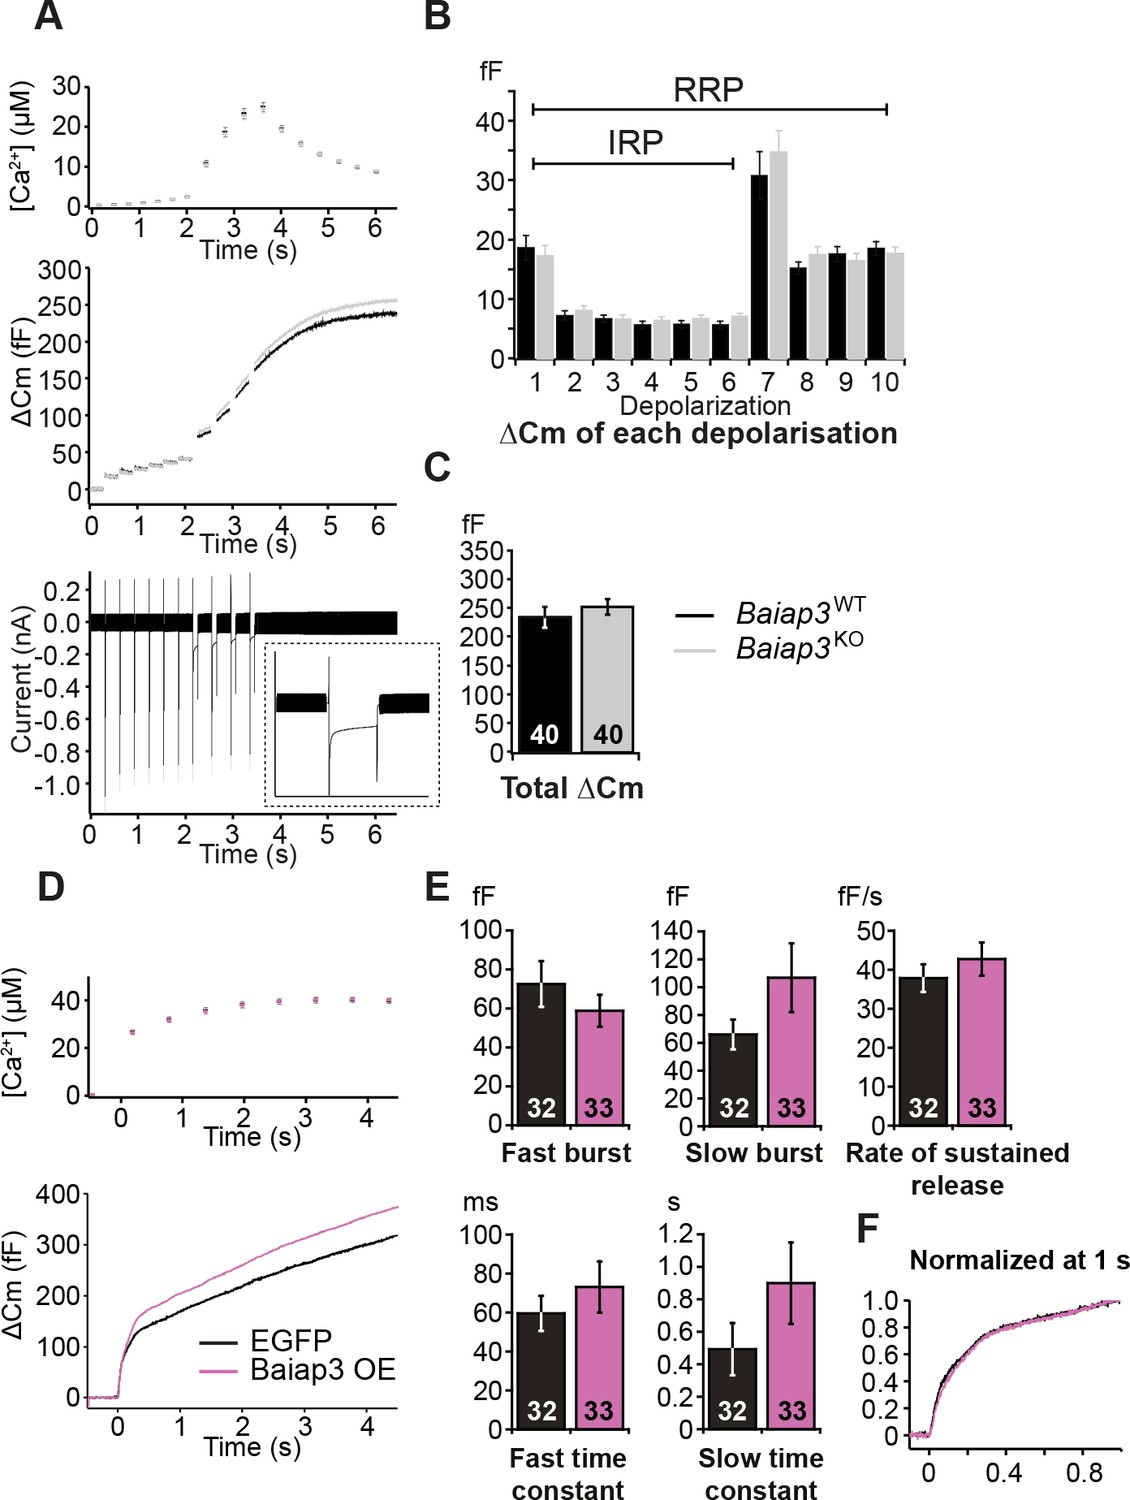
Single gene deletion or overexpression of Baiap3 does not affect LDCV exocytosis in chromaffin cells.
(A) LDCV exocytosis was elicited by a series of depolarizing steps to analyze the Immediately-Releasable Pool (IRP) of vesicles localized in the vicinity of Ca2+ channels and the Readily-Releasable Pool (RRP). Shown are the averaged [Ca2+] ± SEM, ΔCm, and whole-cell current traces. The inset in the whole-cell current panel shows an enlargement of the first 100 ms depolarization. (B) The size of the IRP, estimated based on the release elicited by 6 short (10 ms) depolarization pulses, was not altered. (C) The total ΔCm caused by the depolarization train was also not altered in Baiap3KO cells. Note that the data from Baiap3KO and Baiap3WT were matched for equal ionic influx according to the ionic charge of the first 100 ms depolarization to eliminate effects of differential ionic influx. (D) Overexpression (OE) of Baiap3 in WT chromaffin cells. EGFP expression in WT cells was used as control. Shown are the averaged [Ca2+] ± SEM and ΔCm traces. (E) Burst sizes, rate of sustained release and the kinetics of release were not altered by the overexpression of Baiap3 (Student’s t-test, two-tailed). (F) Normalized traces of Baiap3WT and Baiap3KO cells overlapped with each other, indicating no alterations in release kinetics in Baiap3KO cells.
Figure 3
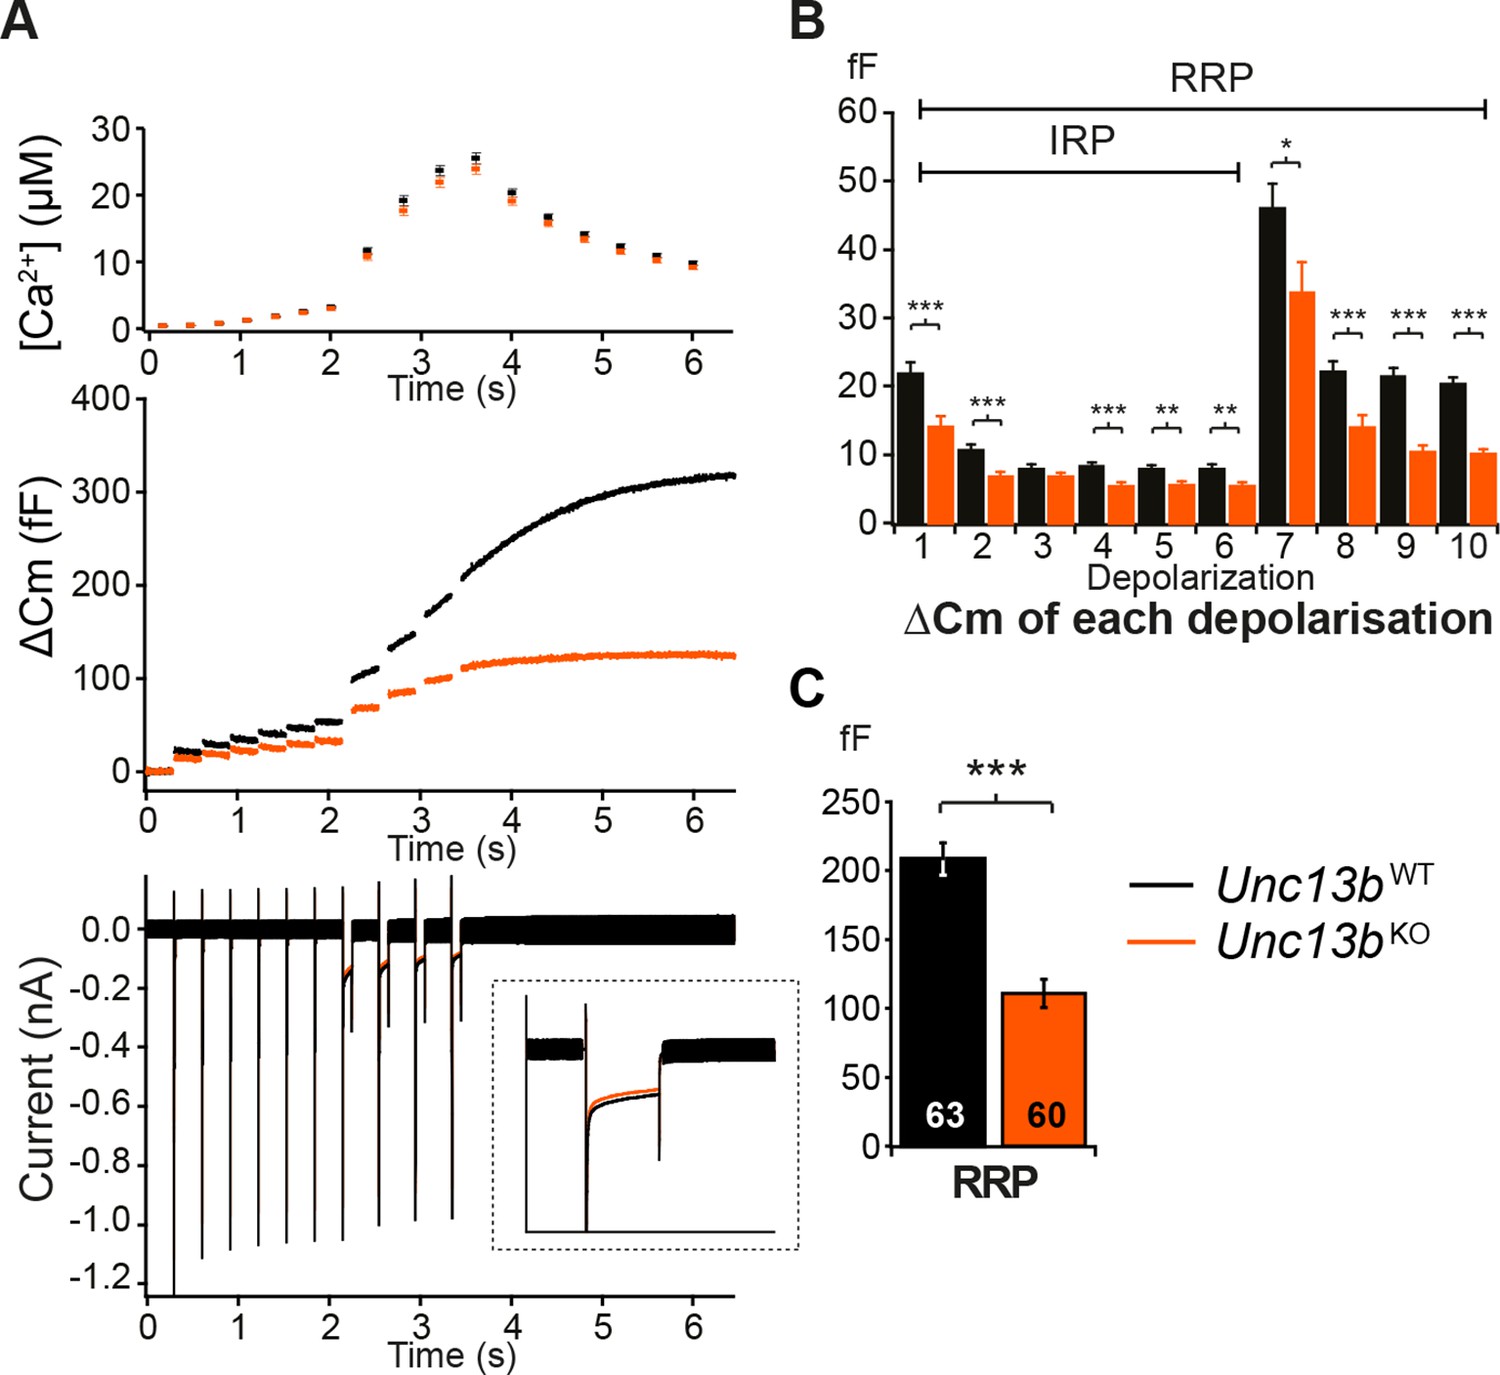
Absence of Munc13-2 results in a significant release deficit in response to depolarization.
(A) Shown are the averaged [Ca2+] ± SEM, △Cm, and whole-cell current traces of Unc13bWT and Unc13bKO cells. The inset in the whole-cell current panel shows an enlargement of the first 100 ms depolarization. (B) △Cm elicited by individual depolarizations was significantly different between the two groups. RRP, Readily-releasable Pool; IRP, Immediately-Releasable Pool. (C) The size of the RRP was measured as the △Cm after the train of depolarization pulses and was significantly reduced in Unc13bKO cells. (*p < 0.05, **p < 0.01, ***p < 0.001; Student’s t-test, two-tailed).
Figure 4
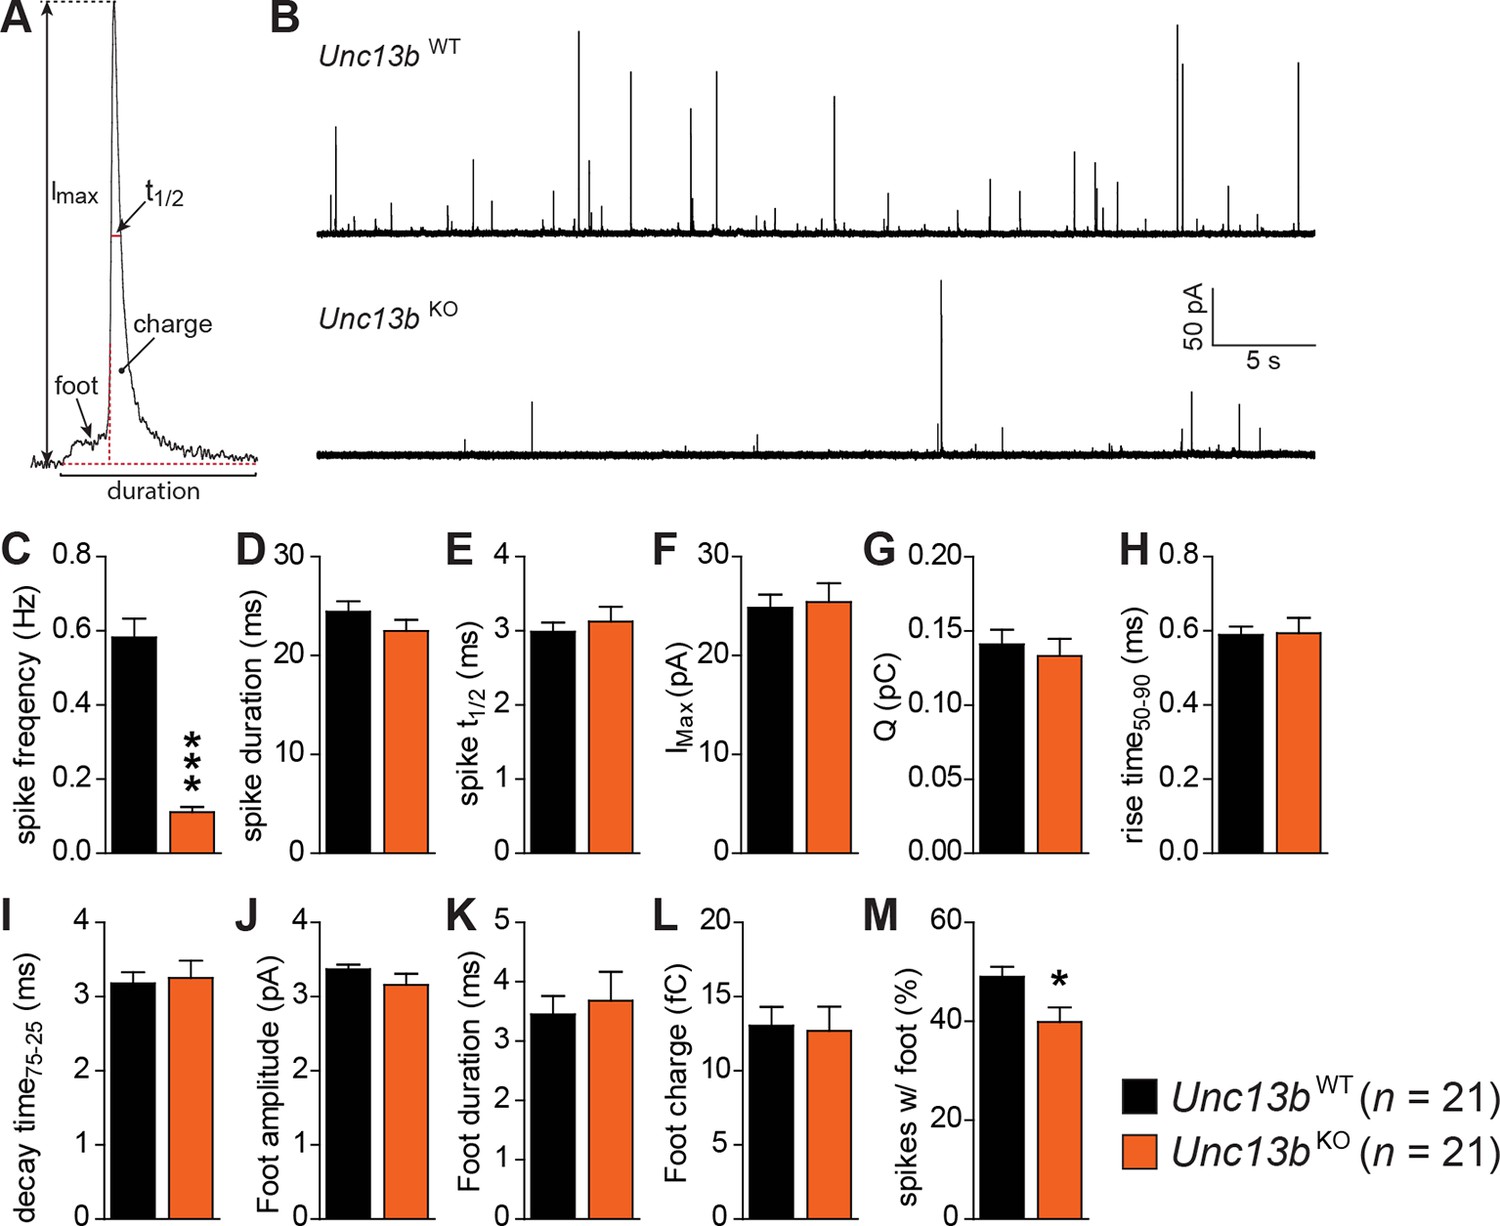
Reduced number of fusion events of catecholamine-containing LDCVs in the absence of Munc13-2.
(A) Illustration of a single amperometric spike, corresponding to the release of catecholamines from a single LDCV, and the parameters analyzed. (B) Representative amperometric recordings of a Unc13bWT and a Unc13bKO cell. (C) Dramatic reduction in spike frequency in Unc13bKO chromaffin cells. (D) Spike duration, (E) width at half amplitude (t½), (F) maximum spike amplitude, (G) amperometric charge, (H) rise time, and (I) decay time were unchanged in the Unc13bKO. The stability of fusion pores was also not altered, as shown by the unchanged (J) foot amplitude, (K) duration and (L) charge. (M) The fraction of amperometric spikes with a detectable foot was reduced in Unc13bKO cells. (*p < 0.05, ***p < 0.001; Student’s t-test, two-tailed).
Figure 5 with 2 supplements
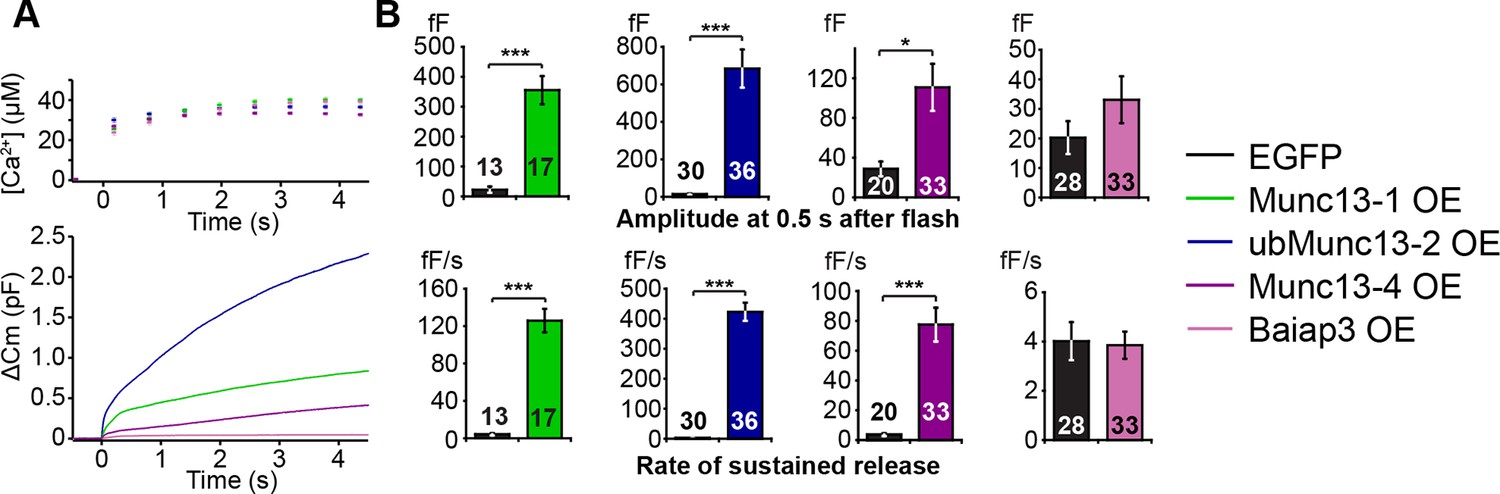
LDCV exocytosis in Unc13aKOUnc13bKO chromaffin cells is rescued by overexpression (OE) of Munc13-1, ubMunc13-2 and Munc13-4, but not Baiap3.
Unc13aKOUnc13bKO cells were infected with SFV-Munc13-1-EGFP, SFV-ubMunc13-2-EGFP, SFV-Munc13-4-IRES-EGFP or SFV-Baiap3-IRES-EGFP using SFV-EGFP as control. (A) Averaged [Ca2+] ± SEM and capacitance traces △Cm are shown in the same graph to compare the efficiency of rescue: ubMunc13-2 > Munc13-1 > Munc13-4 > Baiap3. (B) Burst sizes and rates of sustained release after analysis of individual traces. (*p < 0.05, ***p < 0.001; Student’s t-test, two-tailed). See Figure 5—figure supplement 1 for a direct comparison of Munc13-1-EGFP- and ubMunc13-2-EGFP-expressing cell matched for fluorescence intensity, and Figure 5—figure supplement 2 for western blotting to confirm the expression of Munc13-4 and Baiap3 from the IRES-constructs.
Figure 5—figure supplement 1
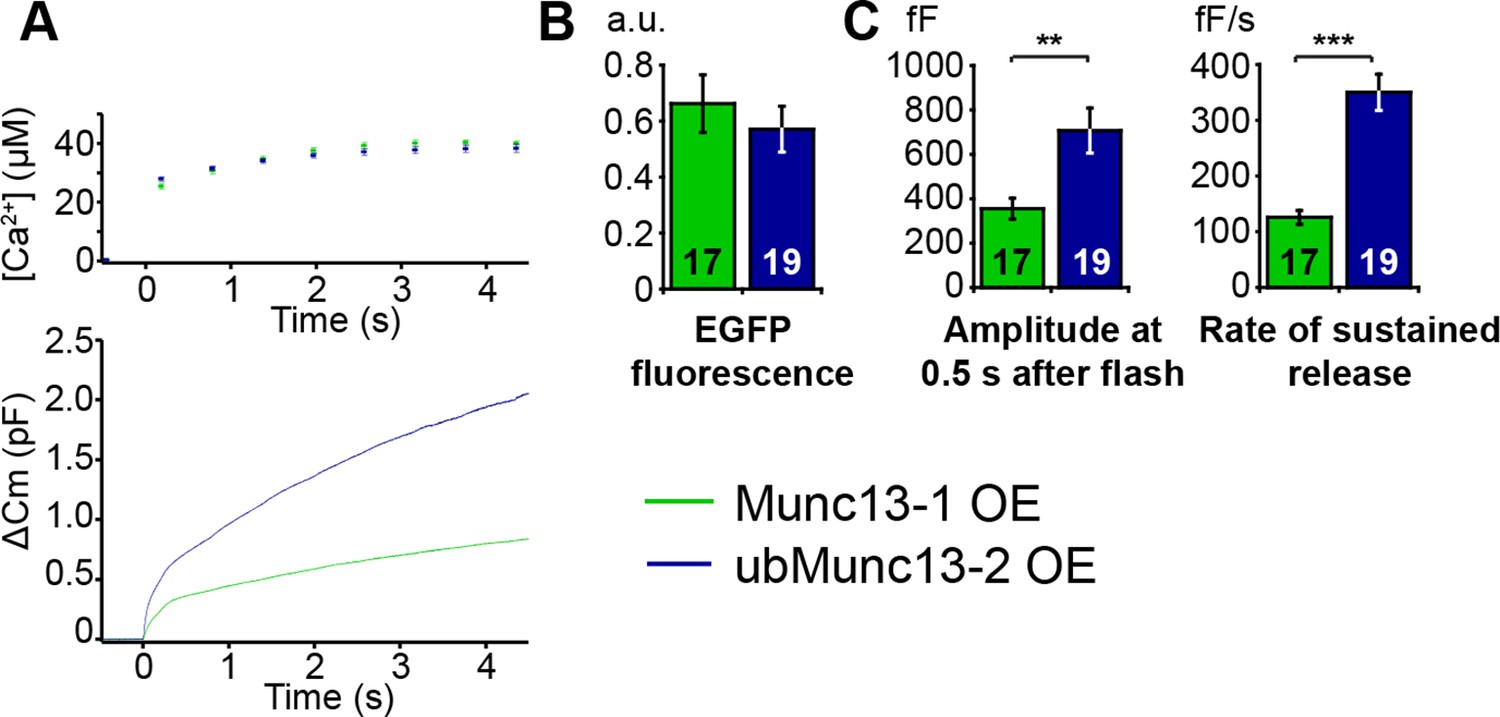
Direct comparison of Munc13-1 and ubMunc13-2 over-expressing cells with matching EGFP fluorescence.
(A) Averaged [Ca2+] ± SEM and capacitance traces △Cm are shown in the same graph to compare the efficiency of rescue. (B) Fluorescence intensity in arbitrary units (a.u.) of Unc13aKOUnc13bKO chromaffin cells overexpressing Munc13-1-EGFP and ubMunc13-2-EGFP. (C) Expression of ubMunc13-2 resulted in a significantly larger enhancement of burst size and rate of sustained release than expression of Munc13-1. (**p < 0.01, p < 0.001; Student’s t-test, two-tailed).
Figure 5—figure supplement 2

Western blot analysis confirming expression of Munc13-4 and Baiap3 SFV constructs.
Neuronal cultures were infected with SFV-Baiap3-IRES-EGFP and SFV-Munc13-4-IRES-EGFP, respectively. Tissue samples from Baiap3 and Unc13d (Jx) WT and KO mice were used as controls. Both Baiap3 and Munc13-4 were expressed. Please note that we had to use infected neurons for this analysis, because our chromaffin cell cultures do not provide enough material for western blotting.
Figure 6 with 1 supplement
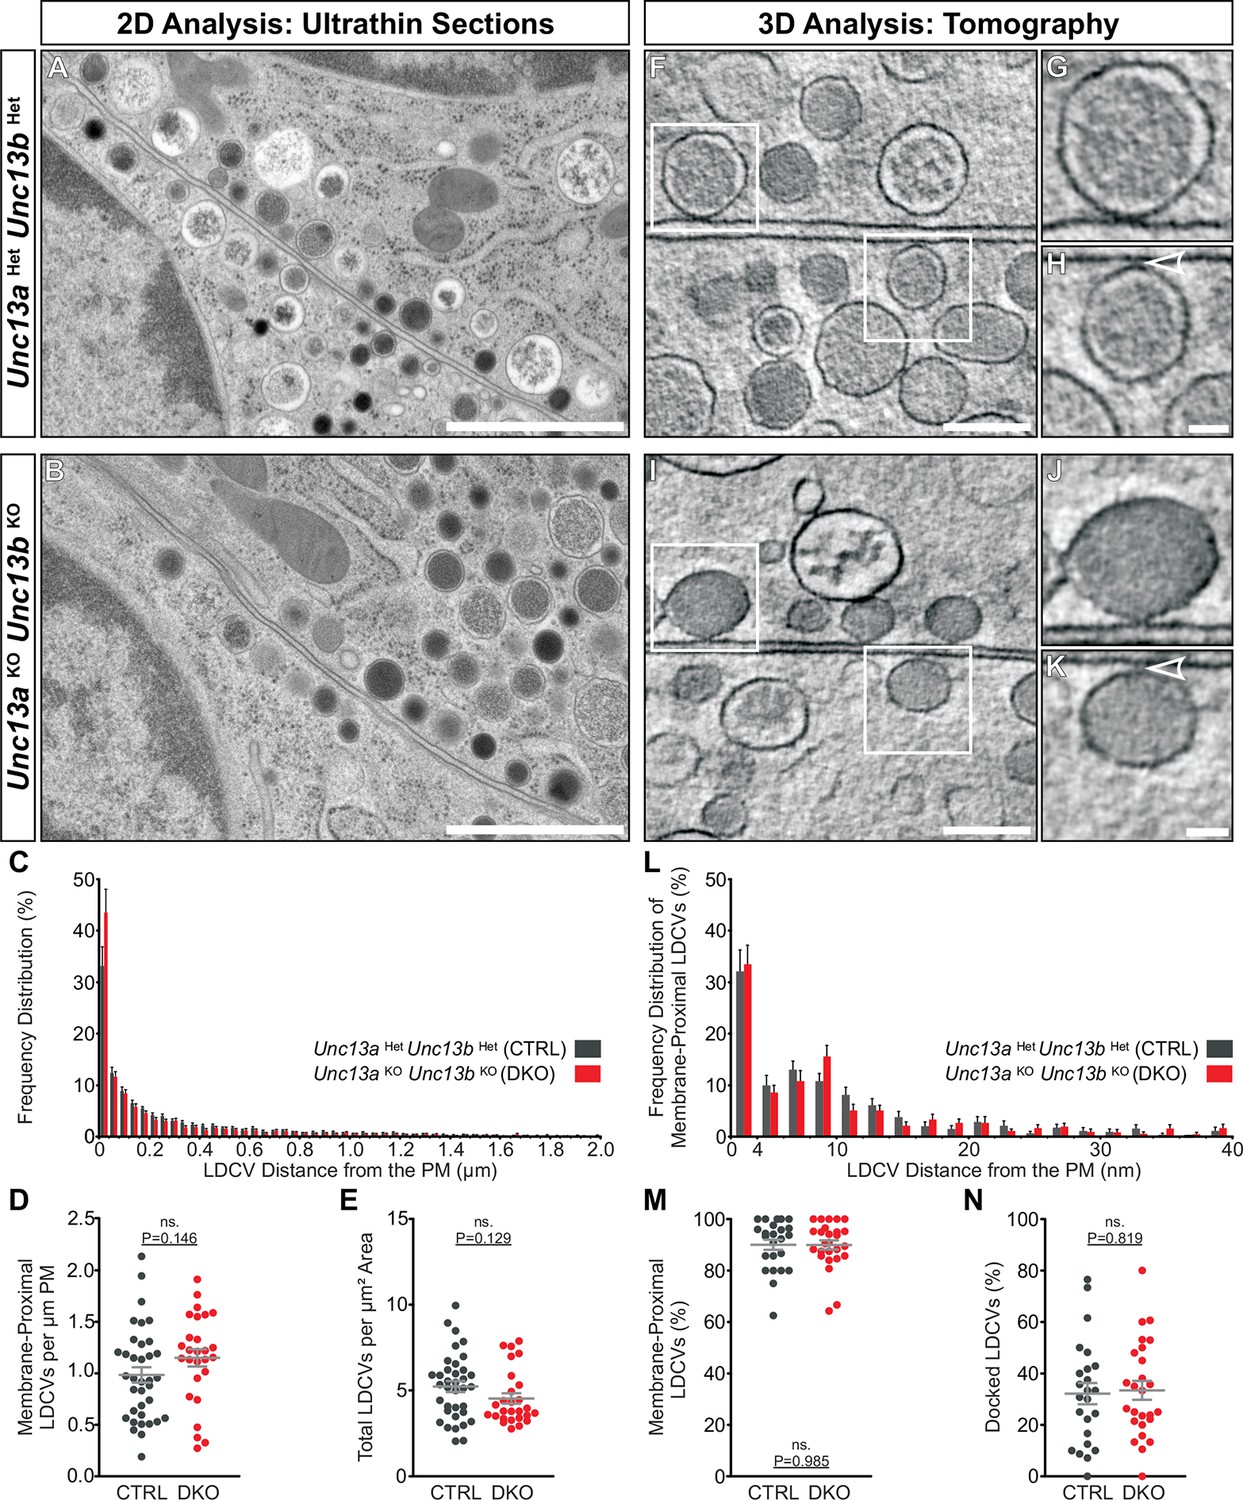
Ultrastructural analysis of LDCV docking in adrenal chromaffin cells.
2D-EM of (A) Unc13aHetUnc13bHet (CTRL) and (B) Unc13aKOUnc13bKO (DKO) adrenal glands. (C) Frequency distribution of LDCVs within 0–2 µm of the plasma membrane (PM). (D) Membrane-proximal LDCVs (0–40 nm of PM) normalized to PM circumference. (E) Total number of LDCVs normalized to cytoplasmic area. (F–K) Tomographically reconstructed subvolumes from 400 nm-thick sections through (F–H) Unc13aHetUnc13bHet and (I–K) Unc13aKOUnc13bKO cells in which docked LDCVs (enlarged in panels G,J) and undocked LDCVs (enlarged in panels H and K, small gaps separating undocked LDCVs from the PM indicated with arrowheads) can be distinguished. (L) Frequency distribution of membrane-proximal LDCVs distributed within 0–40 nm of the PM. (M) Number of membrane-proximal LDCVs expressed as a percentage of all LDCVs within 0–100 nm of the plasma membrane. (N) Percentage of docked LDCVs with respect to all membrane-proximal LDCVs (within 0–40 nm of PM). Scale bars represent 1 µm in (A,B), 200 nm in (F,I), and 50 nm in (H,K). C: 5779 LDCVs in CTRL and 4120 LDCVs in DKO profiles. D, E: CTRL: N=2, n=36; DKO: N=2; n=27. L: 473 LDCVs in CTRL and 386 LDCVs in DKO tomographic subvolumes. M, N: CTRL: N=2, n=24;DKO: N=2, n=26. Values indicate mean ± SEM. (Student’s t-test, two-tailed). See also Figure 6—figure supplement 1.
Figure 6—figure supplement 1
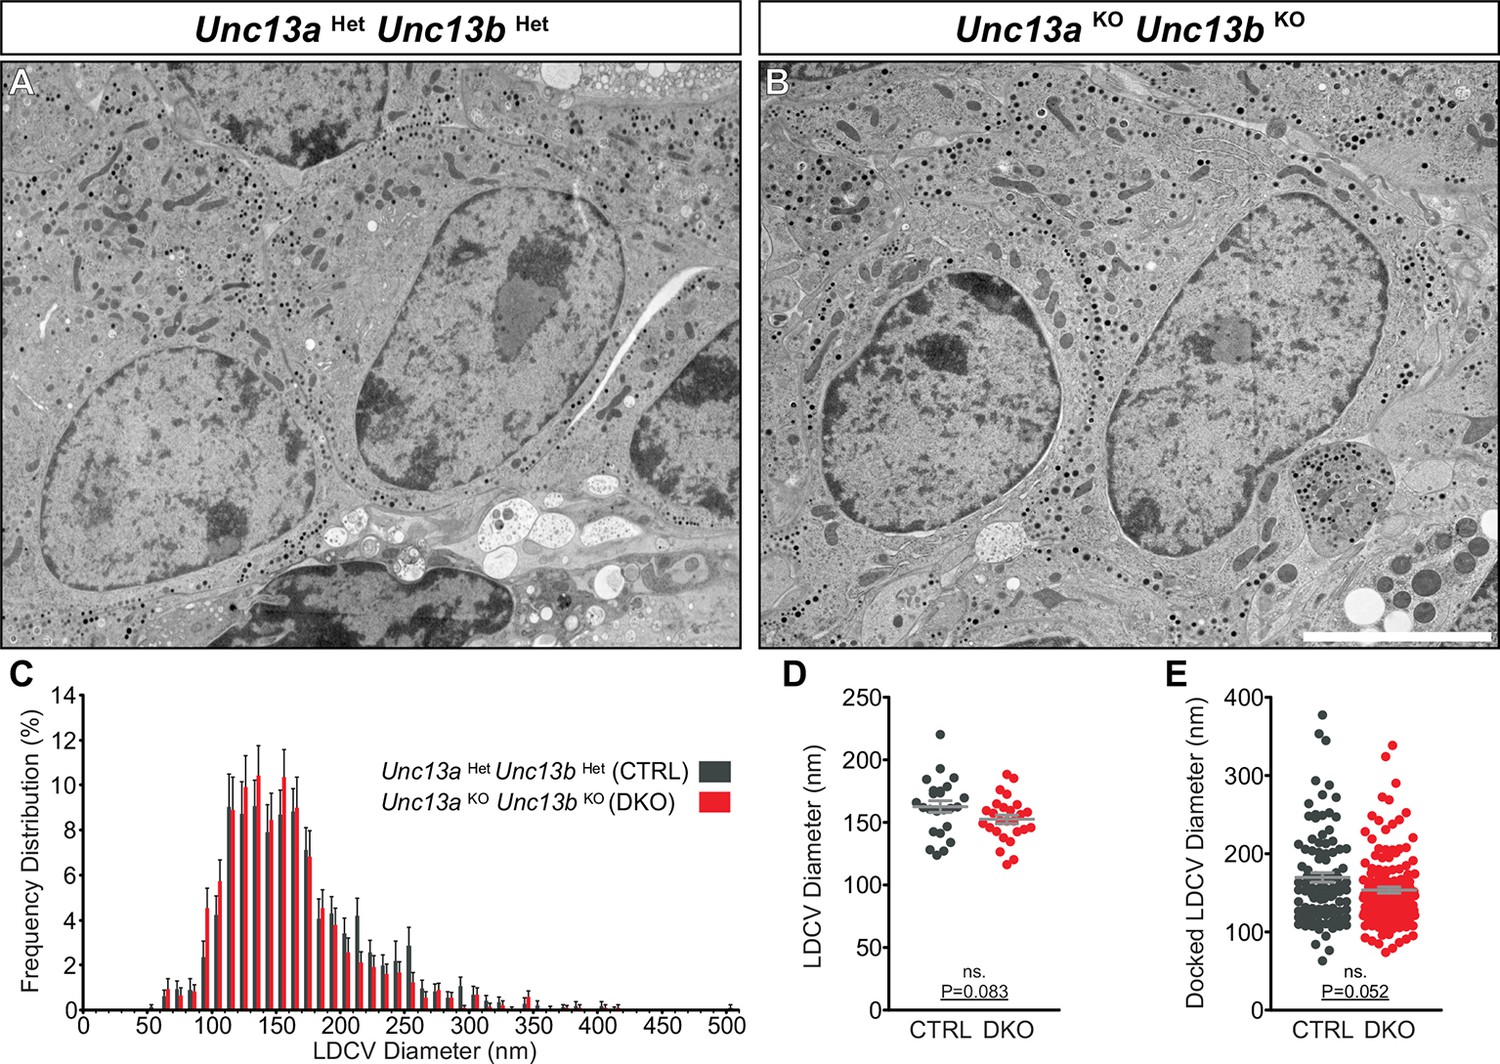
Ultrastructural analysis of LDCV size in adrenal chromaffin cells.
2D-EM of (A) Unc13aHetUnc13bHet (CTRL) and (B) Unc13aKOUnc13bKO (DKO) adrenal glands. (C) Frequency distribution of LDCV diameters measured by 3D-ET. (D) Mean LDCV diameter in randomly imaged chromaffin cell areas. (E) LDCV diameter of docked (0–4 nm of PM) vesicles. Scale bar in B represents 5 µm. C: 846 LDCVs in CTRL and 831 LDCVs in DKO tomographic subvolumes. D: CTRL: N=2, n=24; DKO: N=2, n=26. E: CTRL: N=2, n=98; DKO: N=2, n=140. Values indicate mean ± SEM. (Student’s t-test, two-tailed; diameters of docked LDCVs were tested with Mann-Whitney U-test).
Figure 7 with 1 supplement
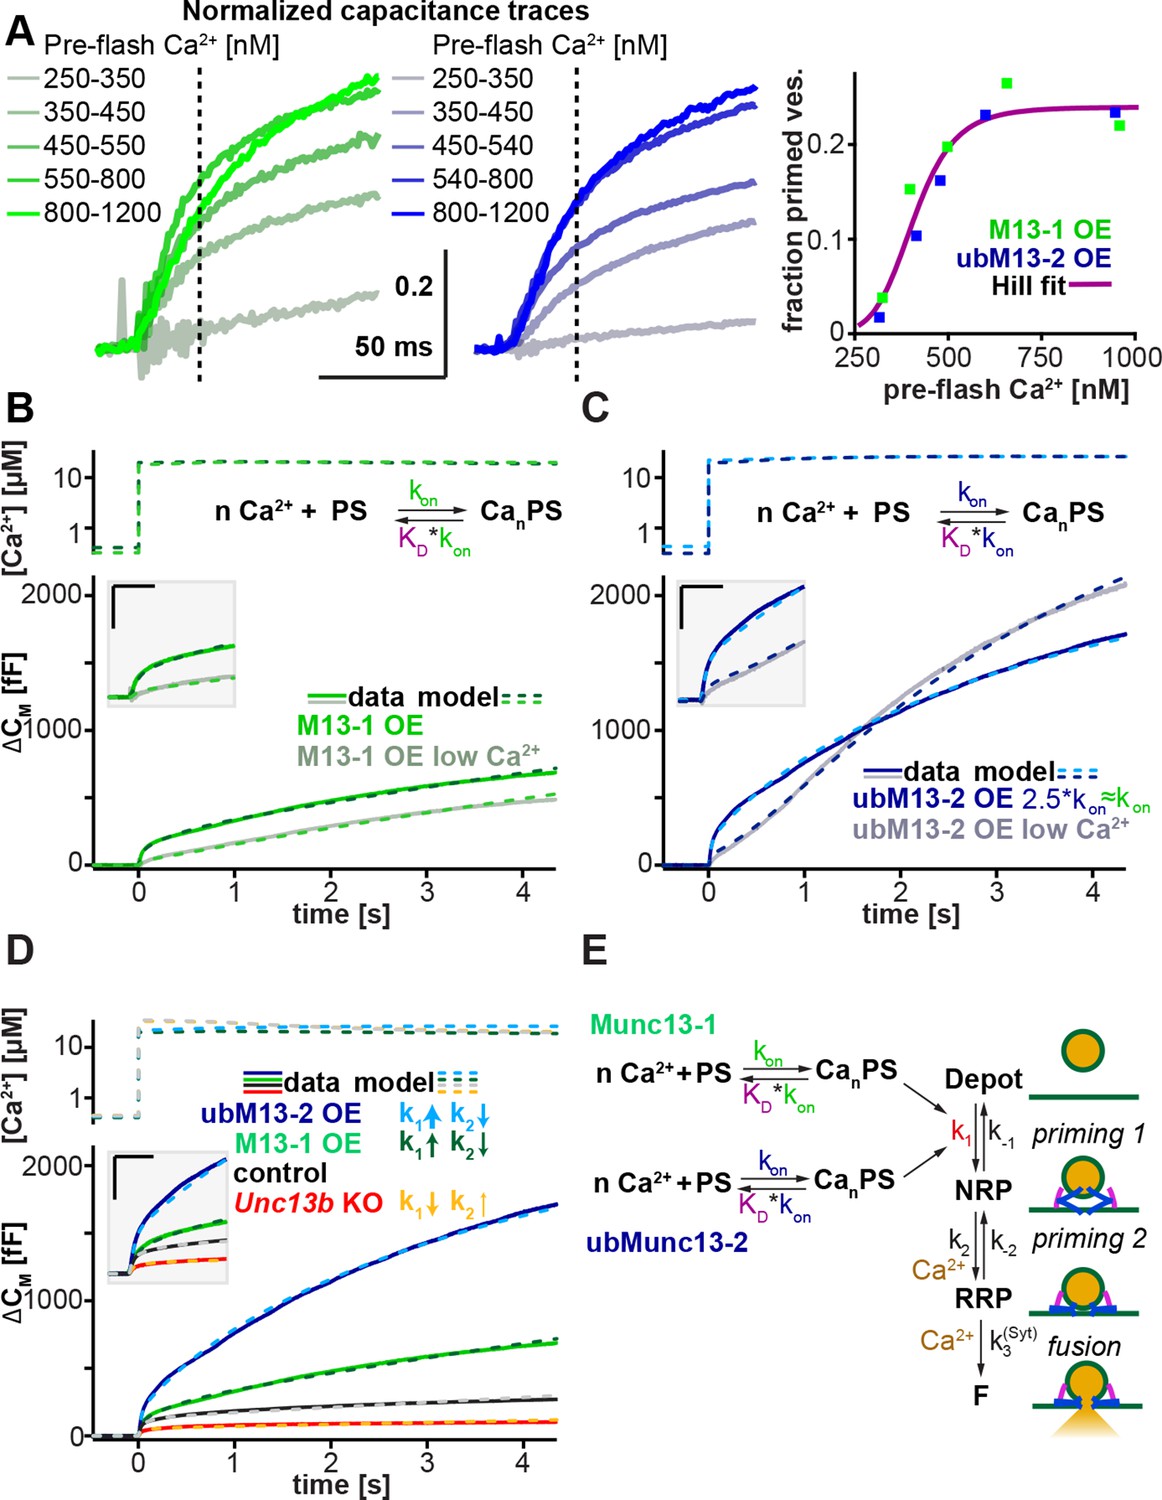
Munc13-1 and ubMunc13-2 accelerate upstream vesicle priming ('priming step 1') with identical Ca2+ affinities, but distinct rates.
(A) Estimation of steady-state Ca2+ affinities of vesicle priming driven by Munc13-1 or ubMunc13-2. Left two panels: binned and averaged secretory responses in Unc13aKOUnc13bKO cells overexpressing (OE) either Munc13-1 (green) or ubMunc13-2 (blue). The release fraction at 30 ms (traces normalized to their amplitude after 3 s) after the stimulus was determined as the read-out for priming (vertical broken lines). Right panel: the fraction of release plotted as a function of pre-flash [Ca2+]. Both genotypes are described by the same Hill function, suggesting a similar Ca2+-dependence of priming (i.e. identical cooperativity and affinity). (B) Fits of a secretion model (see panel E) to the capacitance responses observed experimentally in Unc13aKOUnc13bKO cells expressing Munc13-1 at intermediate and low pre-flash [Ca2+]. Top panel: measured Ca2+ values were used to drive the secretion model. The chemical equation shows a priming sensor (PS), which is active in the Ca2+ bound state (CanPS). The lower panel shows the experimental capacitance data (solid lines) together with simulations with the best fit parameters (broken lines; see Table 1). Insert: magnified view with horizontal/vertical scale bars: 200 ms/200 fF. (C) Same as (B), but for Unc13aKOUnc13bKO cells expressing ubMunc13-2. The secretion model was fitted using identical KDs and n for the Ca2+ binding to the PS (determined by the analysis shown in panel A). The best-fit values suggest a ∼2.5-fold slower on-rate (activation rate), but a 4.5-fold higher maximal priming rate for ubMunc13-2 (see Table 1), resulting in a sigmoidal secretion response from low pre-flash [Ca2+]. (D) Fitting our secretion model to the experimental data of several genotypes suggests that Munc13-1 and ubMunc13-2 both primarily act by increasing the forward priming rate (k1, see also panel E), while loss of ubMunc13-2 – the dominant endogenous isoform – has the opposite effect. The downstream priming step ('priming 2', k2) changes in the opposite direction. (E) Secretion model: Munc13-1 (green) and ubMunc13-2 (blue) regulate the Ca2+ binding rates (kon) to a PS, which controls the asymptotic forward priming rate k1 (see text for details, Table 1 for fitted parameters, and Walter et al., 2013 for model development). NRP: Non-Releasable Pool; RRP: Readily-Releasable Pool; F: Fused pool. See also Figure 7—figure supplement 1.
Figure 7—figure supplement 1

Exocytotic burst size as a function of pre-flash [Ca2+].
Unc13aKOUnc13bKO cells were rescued by Munc13-1 or ubMunc13-2 overexpression (OE). For ubMunc13-2, data from 23 cells already analyzed for Figure 5 were included here as well. The average size of the exocytotic burst is plotted as the ΔCm 0.5 s after the flash stimulus ± SEM against average pre-flash [Ca2+] ± SEM. Cells were binned according to pre-flash [Ca2+]. For Munc13-1, bins are 250–350 nM (n = 17), 350–450 nM (n = 15), 450–550 nM (n = 11), 550–800 nM (n = 11), 800–1200 nM (n = 13), 1200–1700 nM (n = 7). For ubMunc13-2, bins are 250–350 nM (n = 11), 350–450 nM (n = 20), 450–540 nM (n = 10), 540–800 nM (n = 12), 800–1200 nM (n = 10) and 1200–1700 nM (n = 4).
Tables
Table 1
Parameters of the exocytosis model.
| Parameter | Control | Unc13bKO | Munc13-1 OE | ubMunc13-2 OE | Comment |
|---|---|---|---|---|---|
| Vtot | 2350 | Total number of vesicles, best fit | |||
| k1 | |||||
| fraction of activated PS | |||||
| kon | 8.96*10-9 s-1 µM-n | 2.25*10-8 s-1 µM-n | 2.25*10-8 s-1 µM-n | 8.96*10-9 s-1 µM-n | On-rate calcium binding to PS |
| k1Max | 1.99*10-2 s-1 | 6.89*10-3 s-1 | 7.44*10-2 s-1 | 3.42*10-1 s-1 | Maximal priming rate, best fit |
| 0.407 µM | Experiment, Hill plot Figure 7 | ||||
| k-1 | 4.70*10-1 s-1 | Best fit | |||
| n | 7.38 | Cooperativity PS, experiment, Hill plot Figure 7 | |||
| k2 | (Walter et al., 2013) | ||||
| k-2 | (Walter et al., 2013) | ||||
| g(Ca2+) | (Walter et al., 2013) | ||||
| k20 | 2.37*10-2 s-1 | 2.95*10-2 s-1 | 1.29*10-2 s-1 | 5.80*10-3 s-1 | Best fit |
| k2cat | 3.95*101 s-1 | 4.91*101 s-1 | 2.14*101 s-1 | 9.65*100 s-1 | Best fit |
| k-20 | 2.10*10-2 s-1 | Best fit | |||
| k-2cat | (Walter et al., 2013) | ||||
| KD, cat | 138 µM | Best fit | |||
| k3 | 4.4 s-1μM-1 | (Voets, 2000) | |||
| k-3 | 56 s-1 | (Voets, 2000) | |||
| k4 | 1450 s-1 | (Voets, 2000) | |||
Additional files
-
Source code 1
Custom macro: Three-Exponential-Fit-Macro-Igor.
Macro for kinetic analysis of chromaffin cell capacitance traces developed with Igor Pro v6.32A (WaveMetrics) and Patcher’s Power Tools v2.19 (http://www3.mpibpc.mpg.de/groups/neher/index.php?page=software). Capacitance changes were triggered with calcium uncaging and the traces recorded with PatchMaster v2.20 (HEKA).
- https://doi.org/10.7554/eLife.10635.017
Download links
A two-part list of links to download the article, or parts of the article, in various formats.
Downloads (link to download the article as PDF)
Open citations (links to open the citations from this article in various online reference manager services)
Cite this article (links to download the citations from this article in formats compatible with various reference manager tools)
Identification of a Munc13-sensitive step in chromaffin cell large dense-core vesicle exocytosis
eLife 4:e10635.
https://doi.org/10.7554/eLife.10635


