The structure and dynamics of secretory component and its interactions with polymeric immunoglobulins
- California Institute of Technology, United States
- University of California, United States
Figures
Figure 1
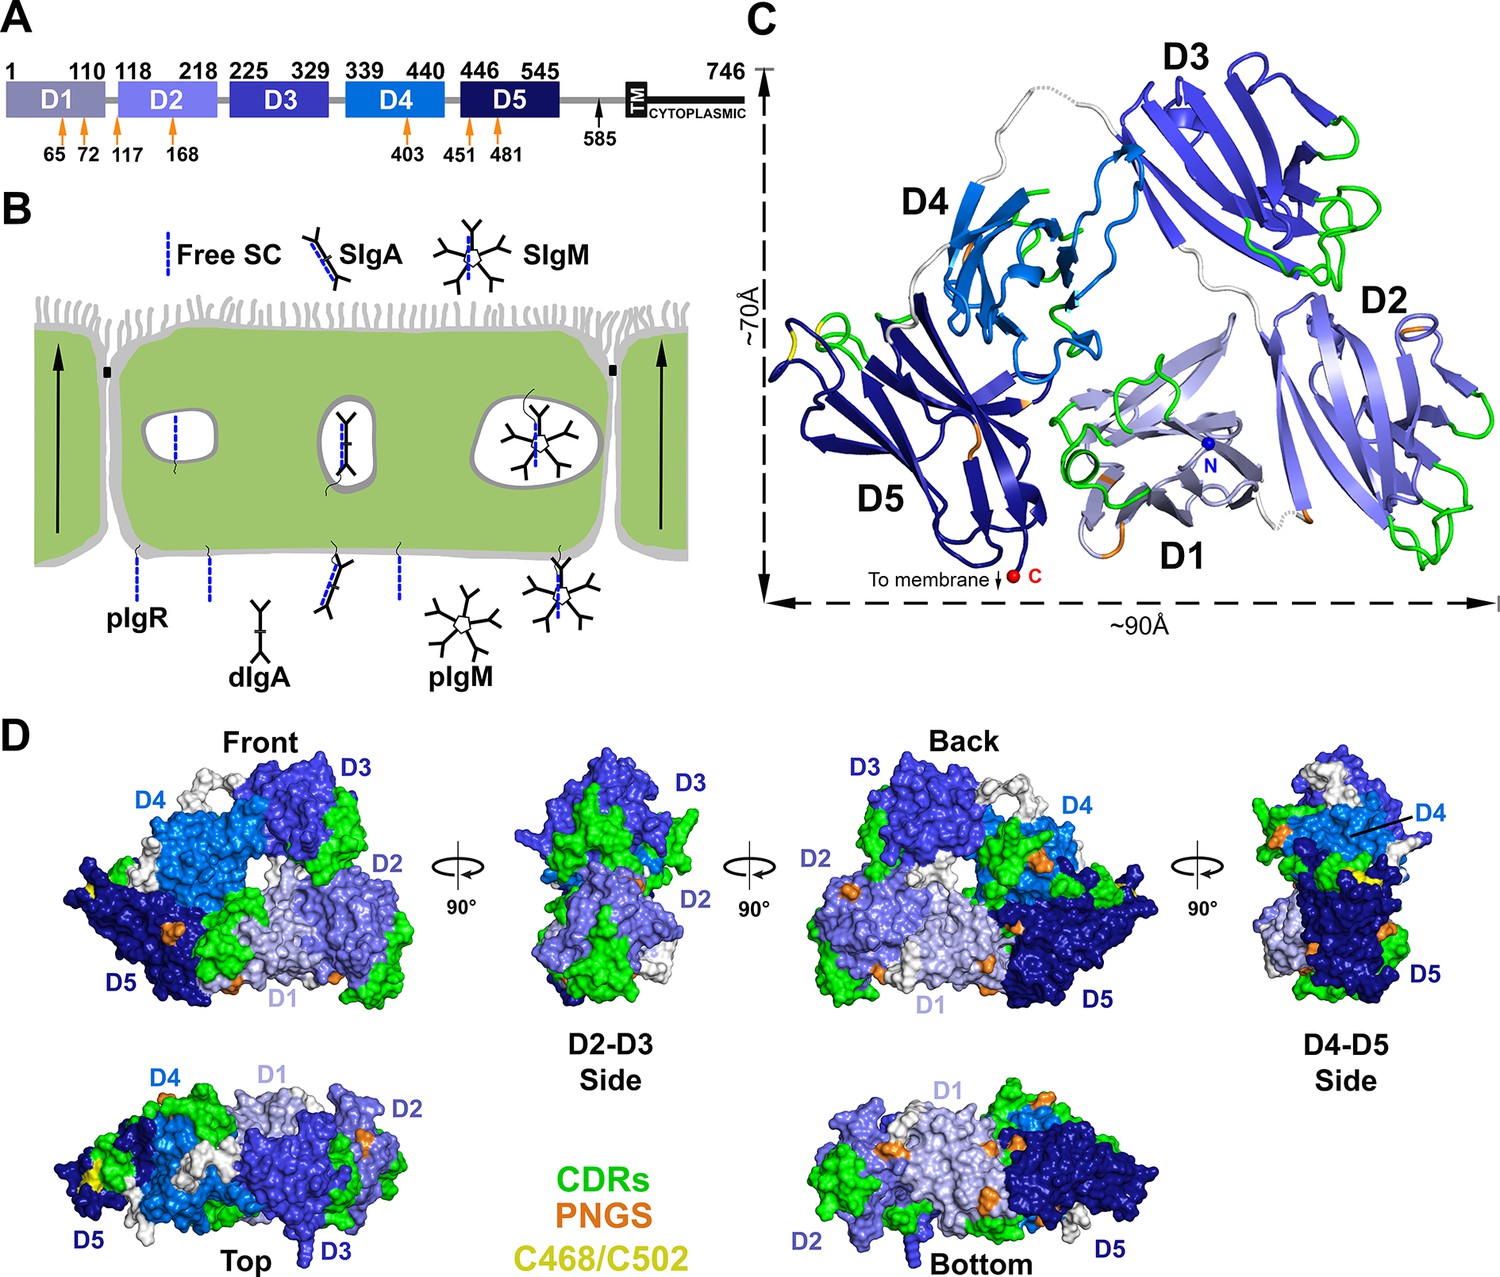
Structure of hSC.
(A) Schematic of mature human pIgR protein indicating Ig-domain (D1-D5) boundaries. The proteolytic cut site that releases hSC from the apical membrane (black arrow), the 23-residue transmembrane region (TM), cytoplasmic tail, and potential N-linked glycosylation sites (PNGS, orange arrows) are indicated. (B) Schematic epithelial cell layer showing basolateral to apical transcytosis (arrows) of pIgR and release of free SC, SIgA, and SIgM. (C) Cartoon representation of the hSC structure viewed from the front face colored to highlight CDR loops (green), D5 Cys468 and Cys502 (yellow), PNGS (orange), domain linkers (grey), and hSC termini (N-terminus: blue sphere; C-terminus: red sphere). (D) Molecular surface representation of the hSC structure shown in six orientations and colored as in (C).
Figure 2 with 1 supplement
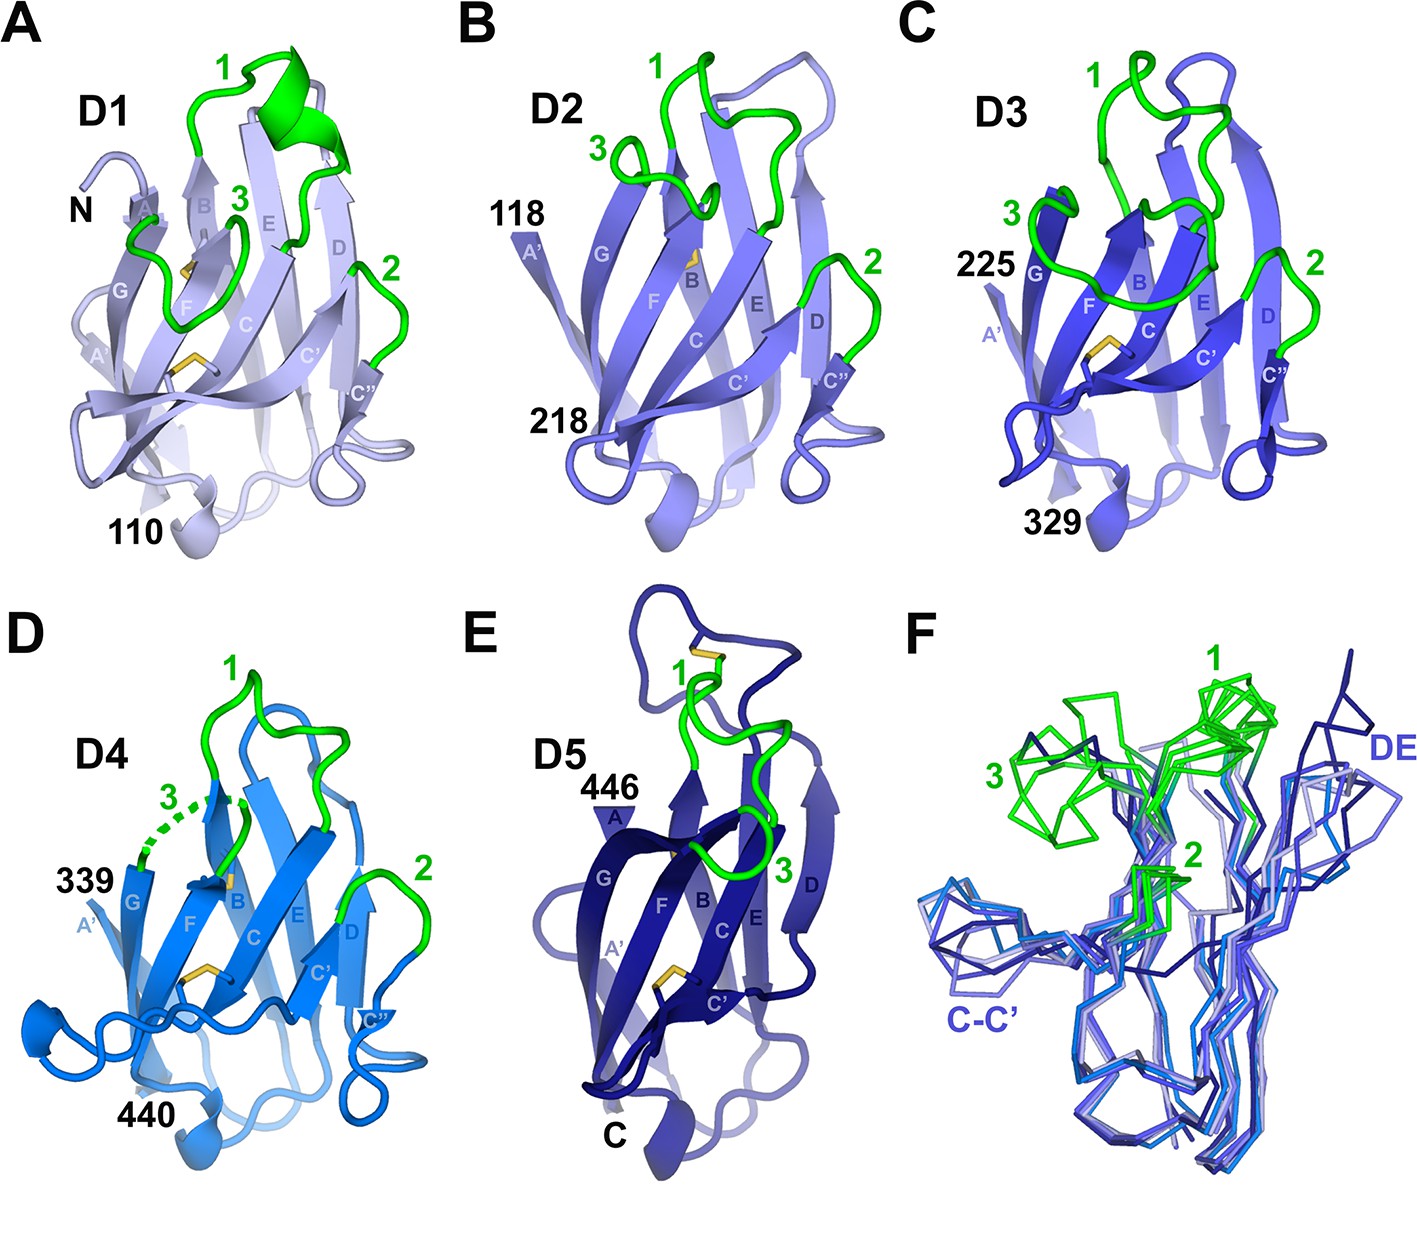
Individual hSC domains.
(A-E) Cartoon representations of hSC domains shown in the same orientation. Disulfides are shown as sticks (yellow), and CDR loops (green), N- and C-terminal residues, and β-strands within Ig domain topology are labeled. The D4 CDR3 is likely flexible because five of its seven residues are disordered (dashed lines). (F) Ribbon diagram showing Cα traces of aligned domains D1-D5 viewed from an orientation ~90° clockwise from (A-E) with CDR loops and regions with structural differences among domains indicated. See also Figure 2—figure supplement 1.
Figure 2—figure supplement 1
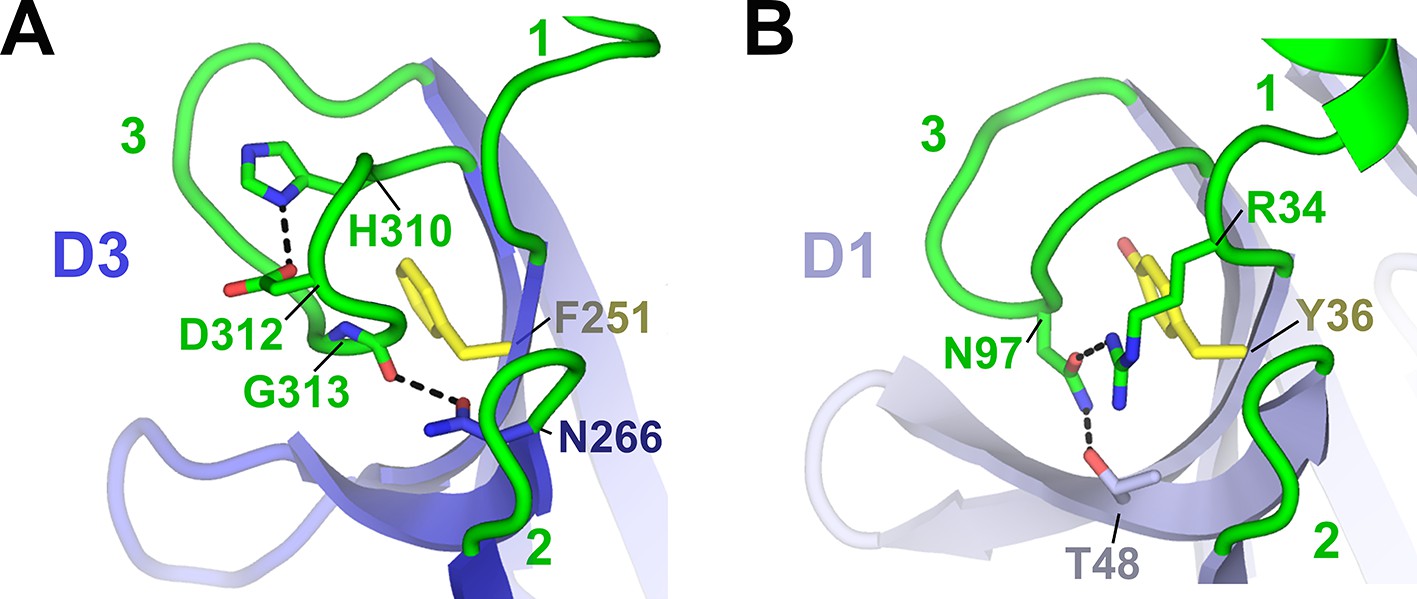
Comparison between human D1 and D3 CDR3 loop structures.
Cartoon representations of human D3 (A) and D1 (B) with residues stabilizing the CDR3 loop positions shown as sticks and CDRs labeled. The D3 CDR3 is stabilized by the side chain of Phe251 and His310, which forms a pH-dependent salt bridge with neighboring residue Asp312, and by a hydrogen bond linking the Gly313 main chain oxygen and C’ residue Asn266. D3 residue Phe251 is structurally equivalent to D1 residue Try36, which stabilizes the position of D1 CDR3 (Hamburger et al., 2004).
Figure 3 with 2 supplements
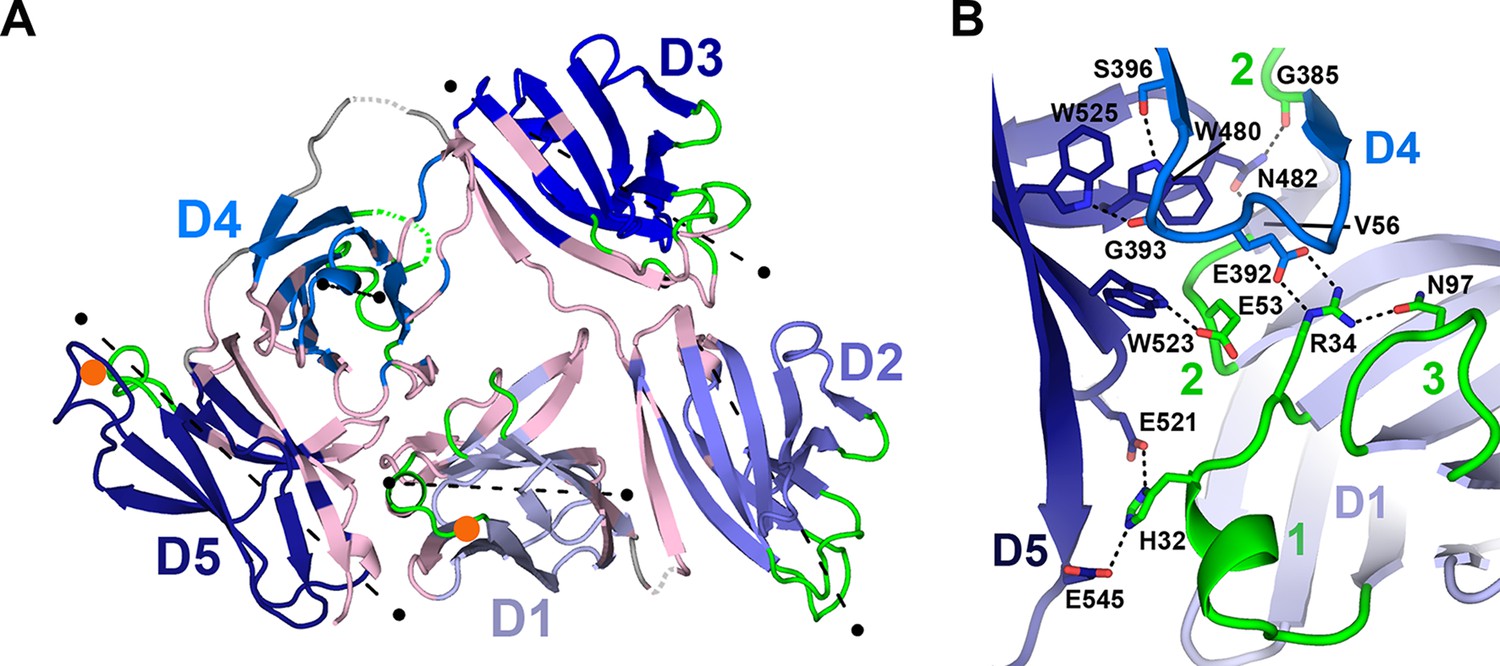
Domain interfaces of hSC.
(A) Cartoon representation of the hSC structure showing the front face view with interface residues colored pink and axes used to determine angles between domains shown as dashed lines (each line is 50Å long). The approximate position of D1 CDR1 Pro26 and D5 CDR1 Cys468 are shown as orange circles. (B) Cartoon representation of the D1-D4-D5 interface with residues involved in putative hydrogen-bonding interactions shown as sticks and including three conserved D4-D5 interface residues, Trp480, Trp523 and Trp525, which bracket the D4 C”-D loop, and are positioned within hydrogen bonding distance of D4 Ser396 and Gly393. See also Figure 3—figure supplements 1, 2.
Figure 3—figure supplement 1
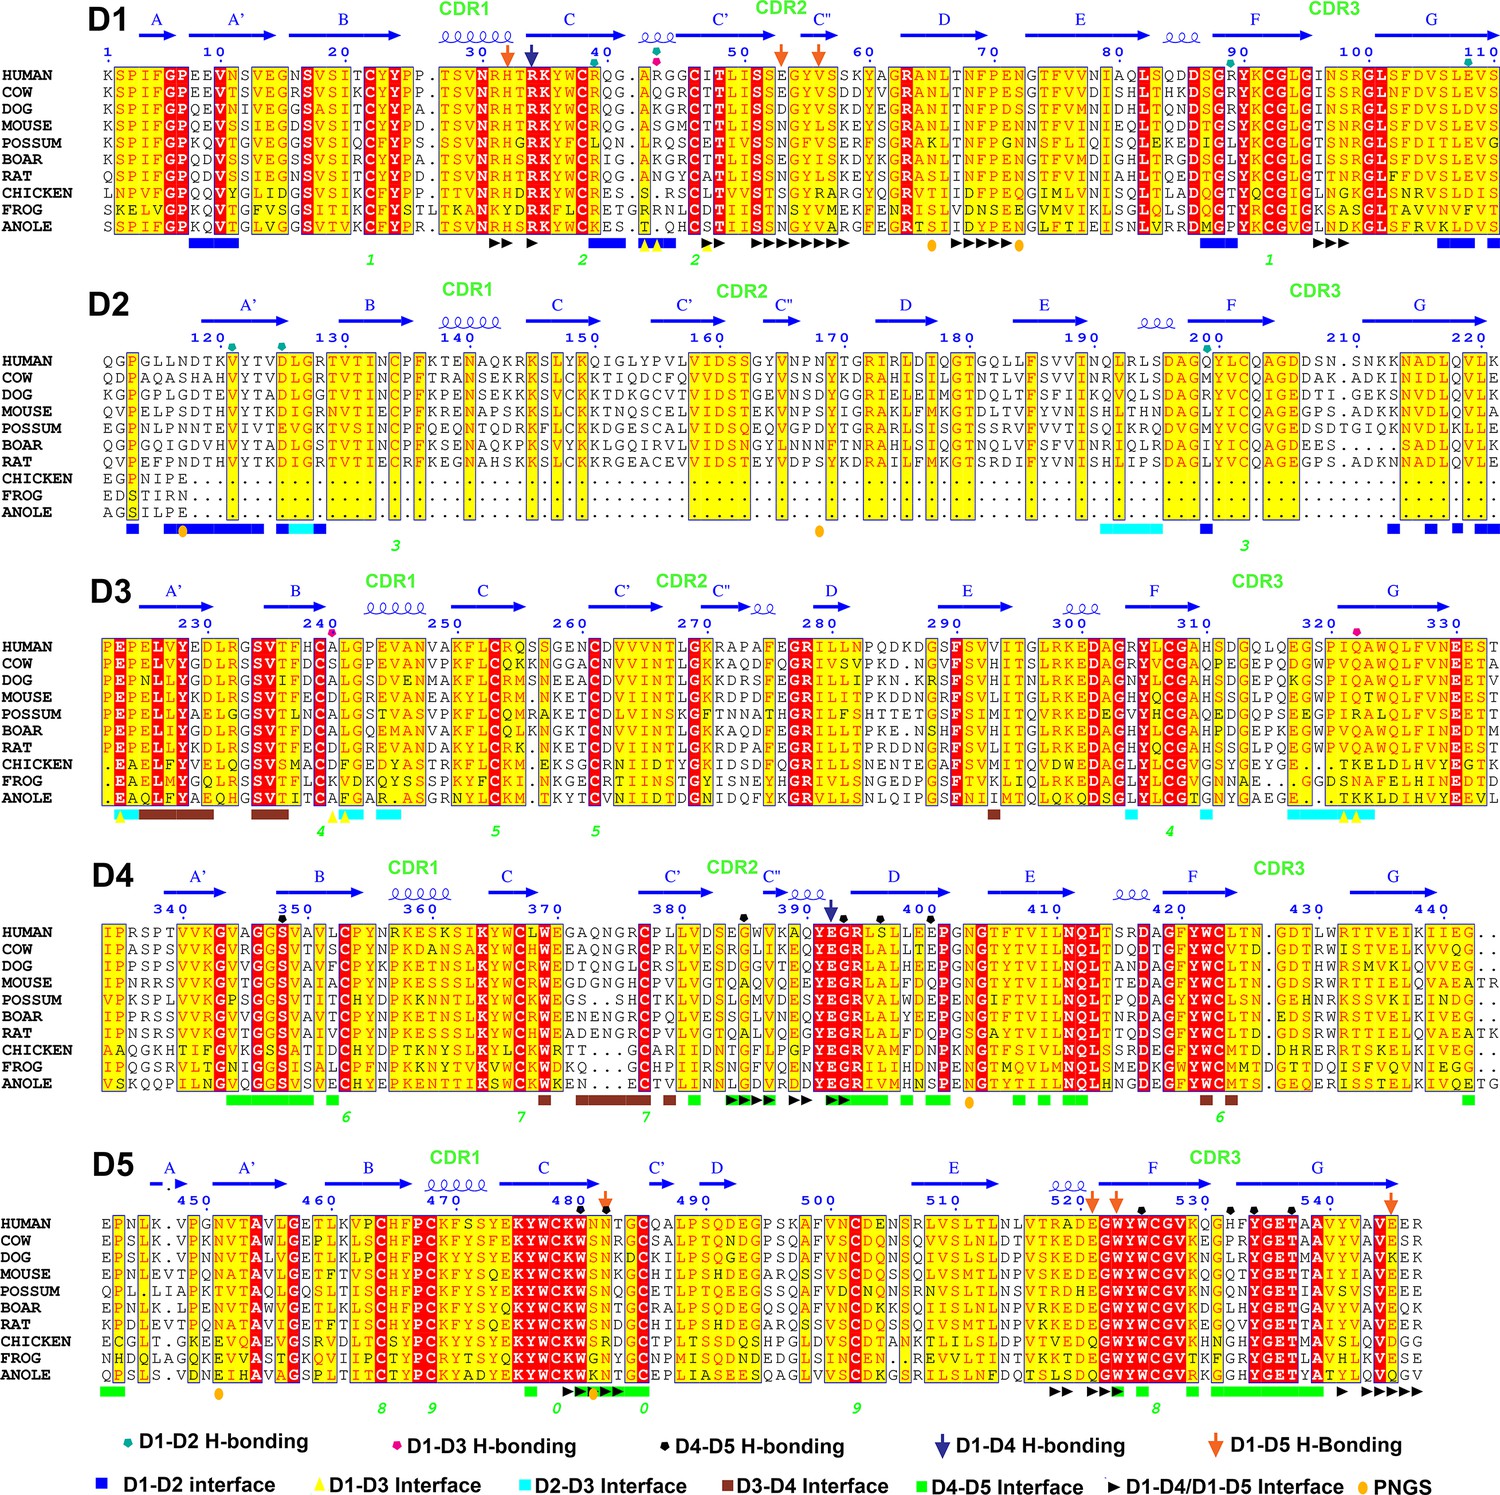
Sequence alignment of representative SC D1-D5 domains.
The secondary structures, locations of CDR loops, and hydrogen bonding (H-bonding) interactions based on the hSC structure are indicated above the alignment; interface residues, N-linked glycosylation sites (PNGS) and disulfide pairing (numbered; green) are indicated below.
Figure 3—figure supplement 2
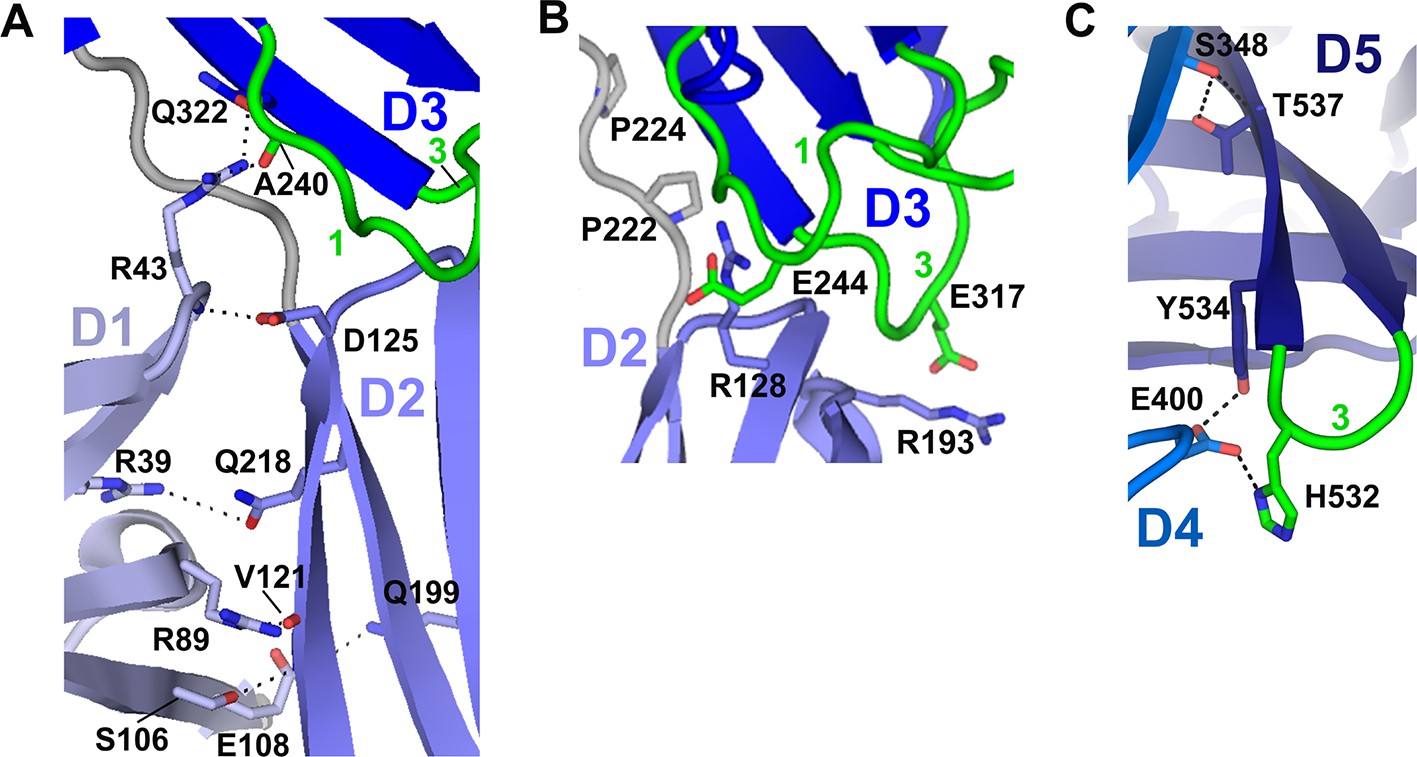
Domain interfaces.
(A) Close-up (front face) view of D1-D2-D3 interface with residues involved in putative hydrogen bonding interactions shown as sticks. Interactions between D1 Arg39 and D2 Gln218 are conserved among many mammalian SC sequences (Figure 3—figure supplement 1). The D1 C-C’ loop residue Arg43 contacts D3 through a side chain-mediated salt bridge with Glu322 and uses its main chain to contact the D2 Asp125 side chain. Glu322 and Asp125 are conserved among most mammalian SCs (the only vertebrates with an SC D2 domain), whereas Arg43 is not conserved (Figure 3—figure supplement 1). Inter-domain contacts involving D1 C-C’ appear necessary to stabilize this segment of D1, as this region was disordered in the structure of isolated D1 (Hamburger et al., 2004). (B) Close-up view of the D2-D3 interface. Hydrogen bonds between the D2 and D3 domains are absent. However, the close proximity of interfacing loops from each domain is likely maintained by the four-residue D2-D3 linker, which contains two conserved prolines (shown as sticks). The interface is stabilized through electrostatic interactions between D2 Arg128/Arg193 and D3 Glu244 (CDR1)/Glu317 (CDR3) side chains, which are separated by ~4.5Å. (C) Close-up view detailing part of the D4-D5 interface. Residues near and in the D5 CDR3 involved in putative hydrogen bonding between D4 and D5 (shown as sticks) include Ser348 and Thr537, and Glu400 and Tyr534; Glu400 is also within hydrogen bonding distance of D5 CDR3 His532. Ser348, Thr537 and Tyr534 are conserved whereas Glu400 and His532 are not (Figure 3—figure supplement 1).
Figure 4 with 1 supplement
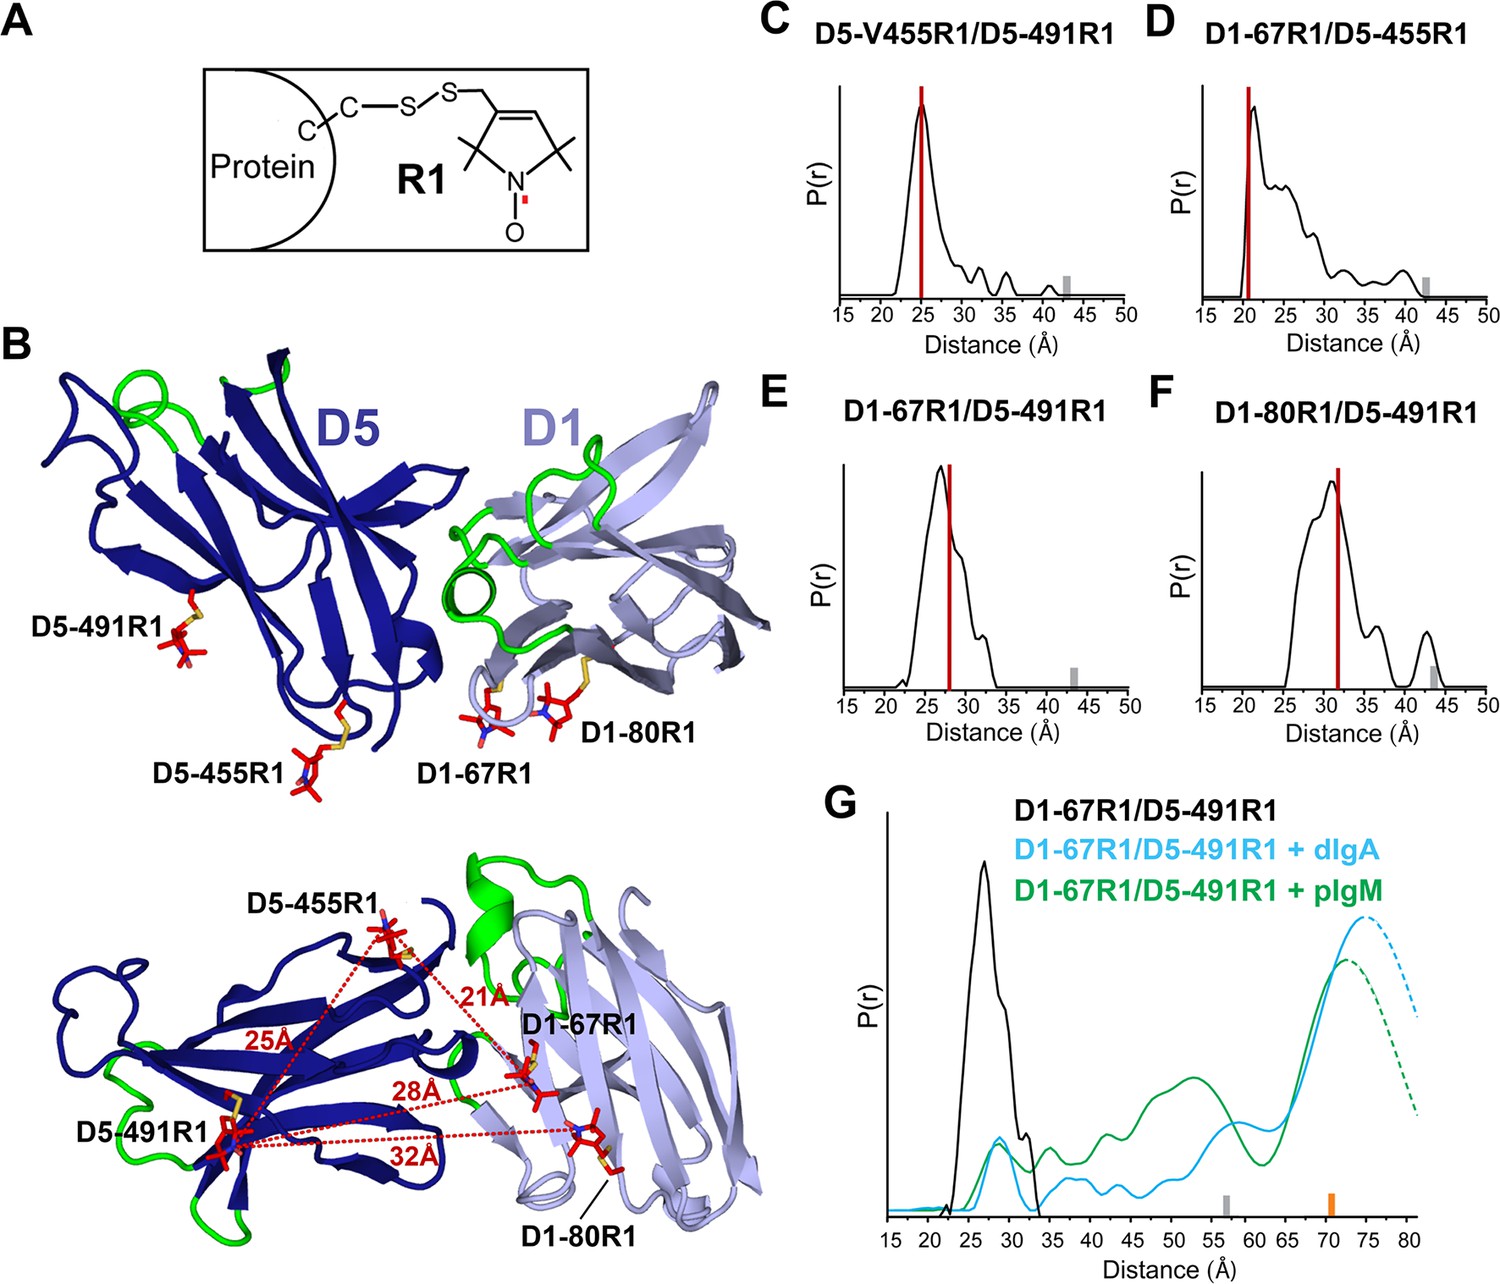
DEER spectroscopy of spin-labeled hSC.
(A) Structure of R1 nitroxide (unpaired electron shown in red) attached to a cysteine residue. (B) Cartoon representation in two orientations showing modeling of an R1 side chain (red sticks) at the indicated sites on the hSC crystal structure. The distances measured are indicated as red dashed lines in the lower panel. (C-F) Distance distributions for the indicated mutants obtained after model-free fitting of the dipolar evolution function (DEF). The vertical red lines indicate the expected interspin distance based on modeling of the R1 side chain on the hSC crystal structure. (G) Same as C-F but for D1-67R1/D5-491R1 complexes with dIgA (cyan) or pIgM (green). Minor peaks at 27Å likely correspond to unliganded SC, and peaks observed with maxima at ~57Å upon dIgA binding and at ~53Å upon pIgM binding may reflect structural heterogeneity in ligand structure or arise from intermediate binding states. The relative populations of these states cannot be determined due to existence of distance probabilities outside the reliable range of detection. The gray and orange bars indicate the upper limit of reliable distance and shape of the distribution for unliganded and liganded hSC variants, respectively (see Experimental Procedures). For D1-67R1/D5-491R1 complexes, distances above 70 Å are beyond detection limits (dashed traces). See also Figure 4—figure supplement 1.
Figure 4—figure supplement 1
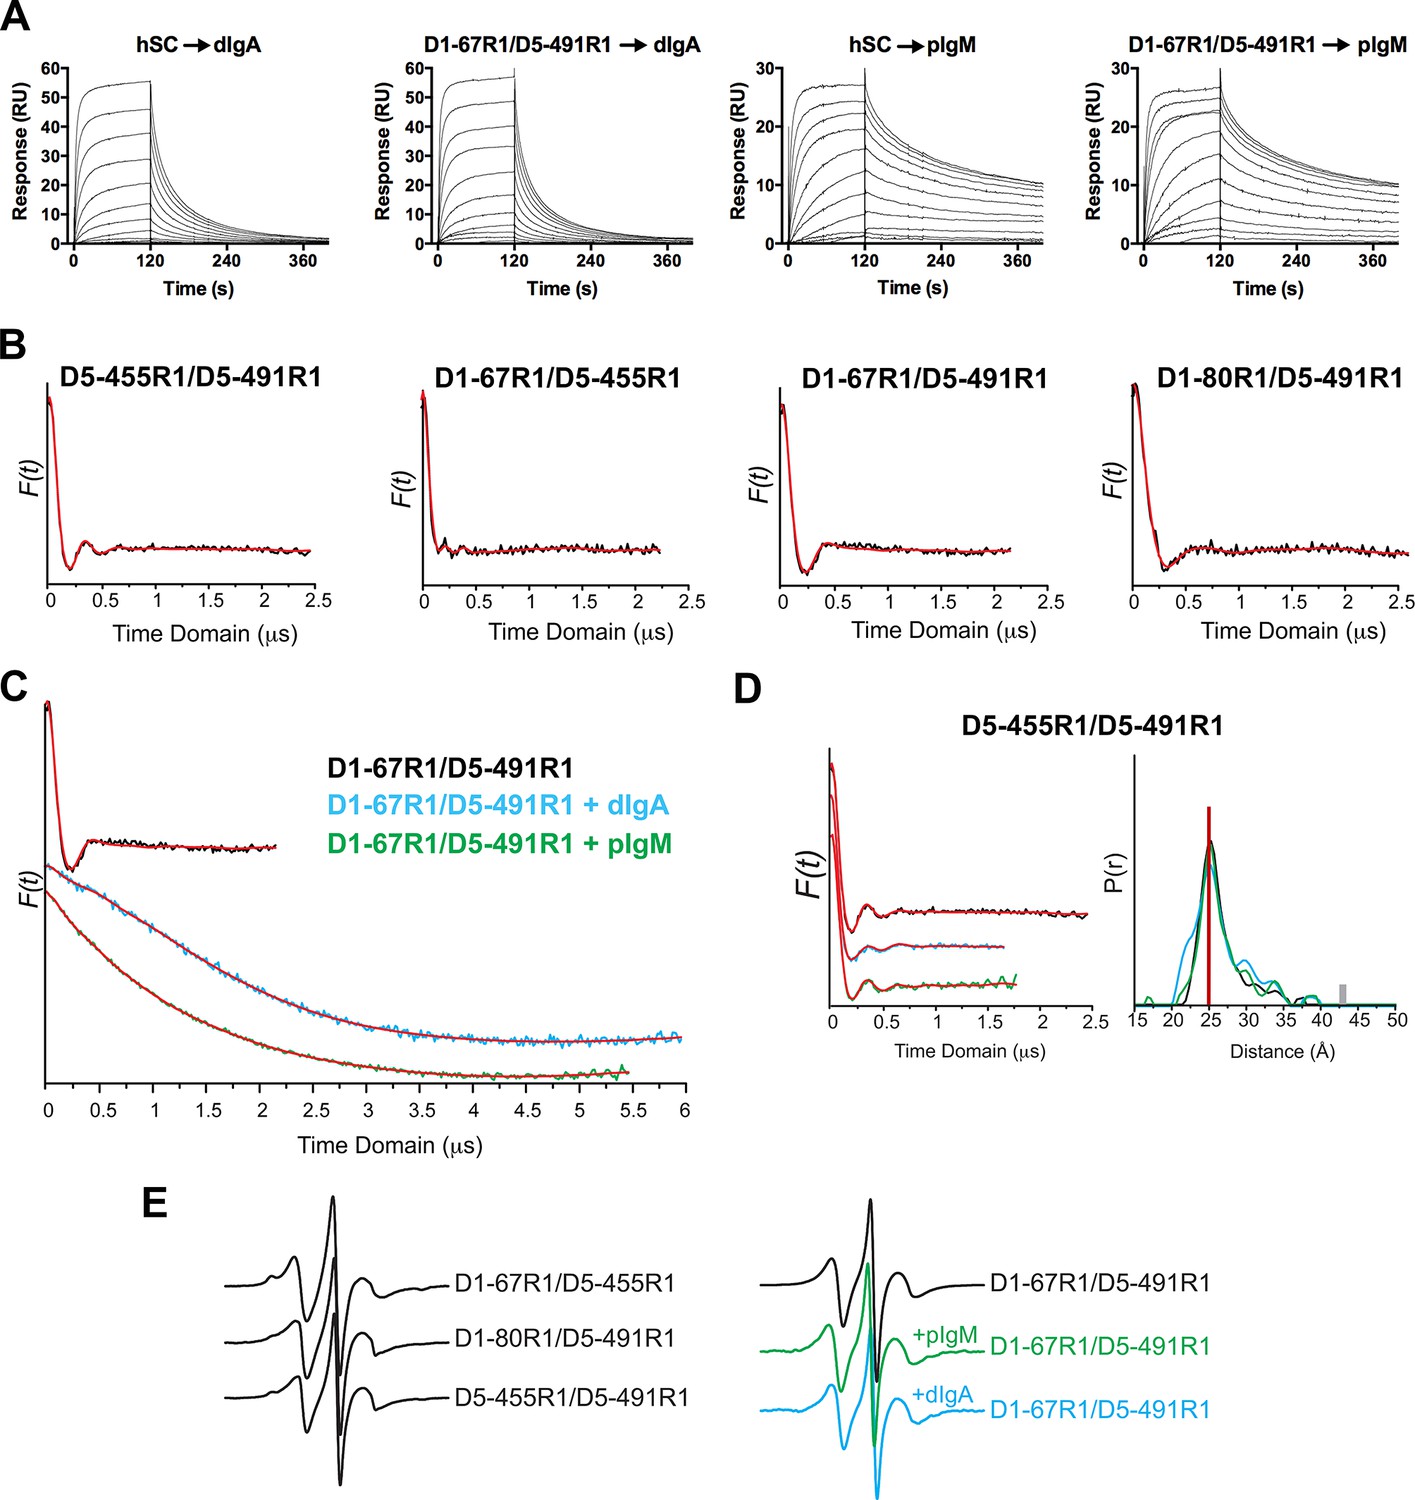
SPR data, time domain data and CW EPR spectra and control DEER measurements.
(A) SPR measurements showing similar sensorgrams for unmodified and spin-labeled hSC proteins binding to dIgA and pIgM. hSC or D1-67R1/D5-491RI spin-labeled hSC were injected over dIgA or pIgM immobilized surfaces in a two-fold dilution series starting at a highest concentrations of 1.02 µM (dIgA) and 0.26 µM (pIgM). Uncertainty of the binding mechanism precluded our ability to accurately model kinetics for these data. (B) Time domain of the dipolar evolution function (DEF) (shown in black) for the indicated mutants with model-free fit shown in red. (C) Same as B but for D1-67R1/D5-491R1 complexes with dIgA or pIgM. (D) Time domain data (left) and corresponding distance distribution (right) obtained after model-free fitting of the DEF (red) for control hSC variants D5-455R1/D5-491R1 before (black) and after incubation with dIgA (cyan) and pIgM (green) ligands. The vertical red line on the distance distribution indicates the distance measured between 455R1 and 491R1 on the hSC crystal structure (Figure 4B). (E) CW spectra recorded for three indicated hSC variants labeled with the R1 sidechain (left) and for the D1-67R1/D5-491R1 variant before and after its incubation with dIgA or pIgM (right).
Figure 5 with 1 supplement
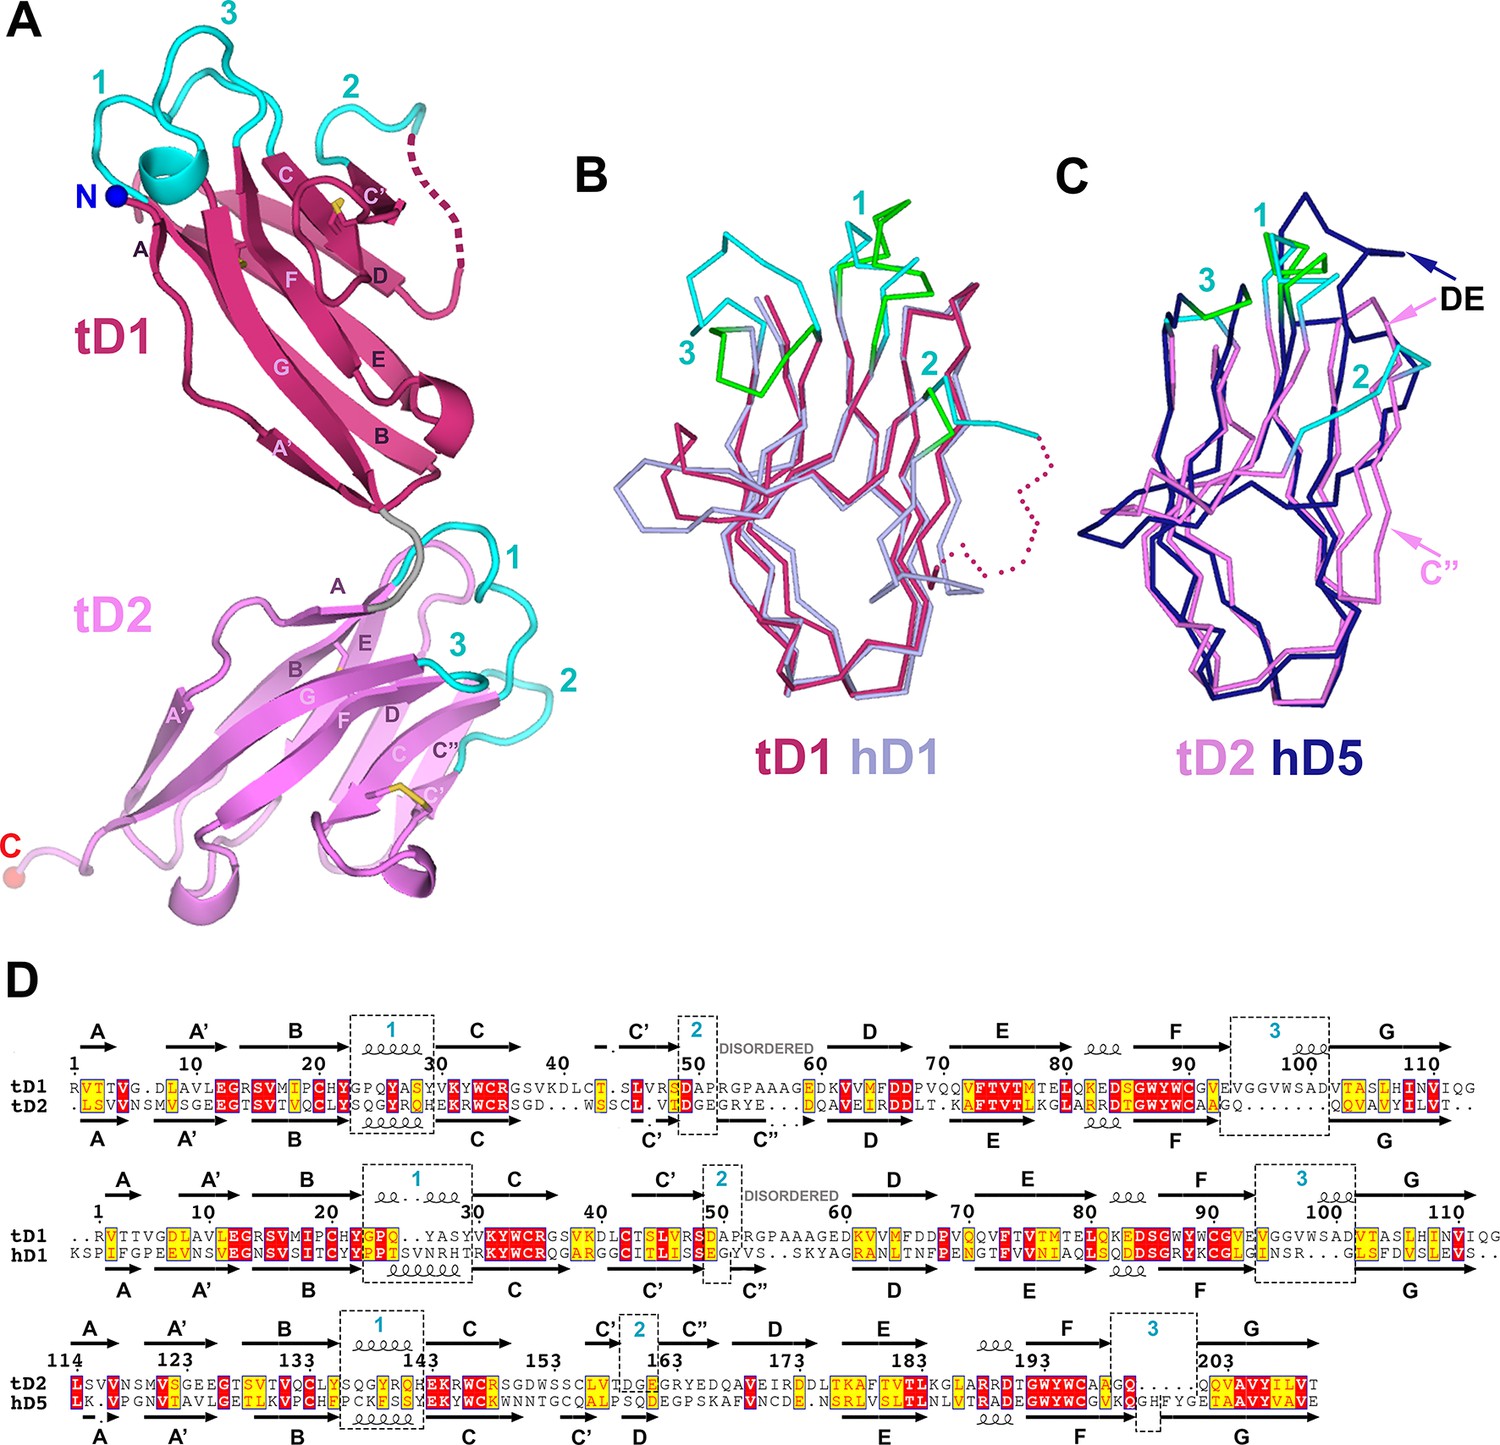
Structure of tSC.
(A) Cartoon representation of the tSC structure with disulfides shown as yellow sticks, CDR loops colored cyan, N- and C-termini indicated (blue and red spheres) and Ig domain topology labeled. (B) Ribbon diagram showing Cα traces of tD1 and human D1 (hD1) following alignment. tD1 is deep salmon with cyan CDRs, and hD1 is light purple with green CDRs. (C) Ribbon diagram showing aligned Cα traces of tD2 and human D5 (hD5). tD2 is pink with cyan CDRs, and hD5 is dark blue with green CDRs. (D) Structure-based sequence alignments of tD1-tD2, tD1-hD1, and tD2-hD5 with corresponding secondary structure and CDR boundaries shown. See also Figure 5—figure supplement 1.
Figure 5—figure supplement 1
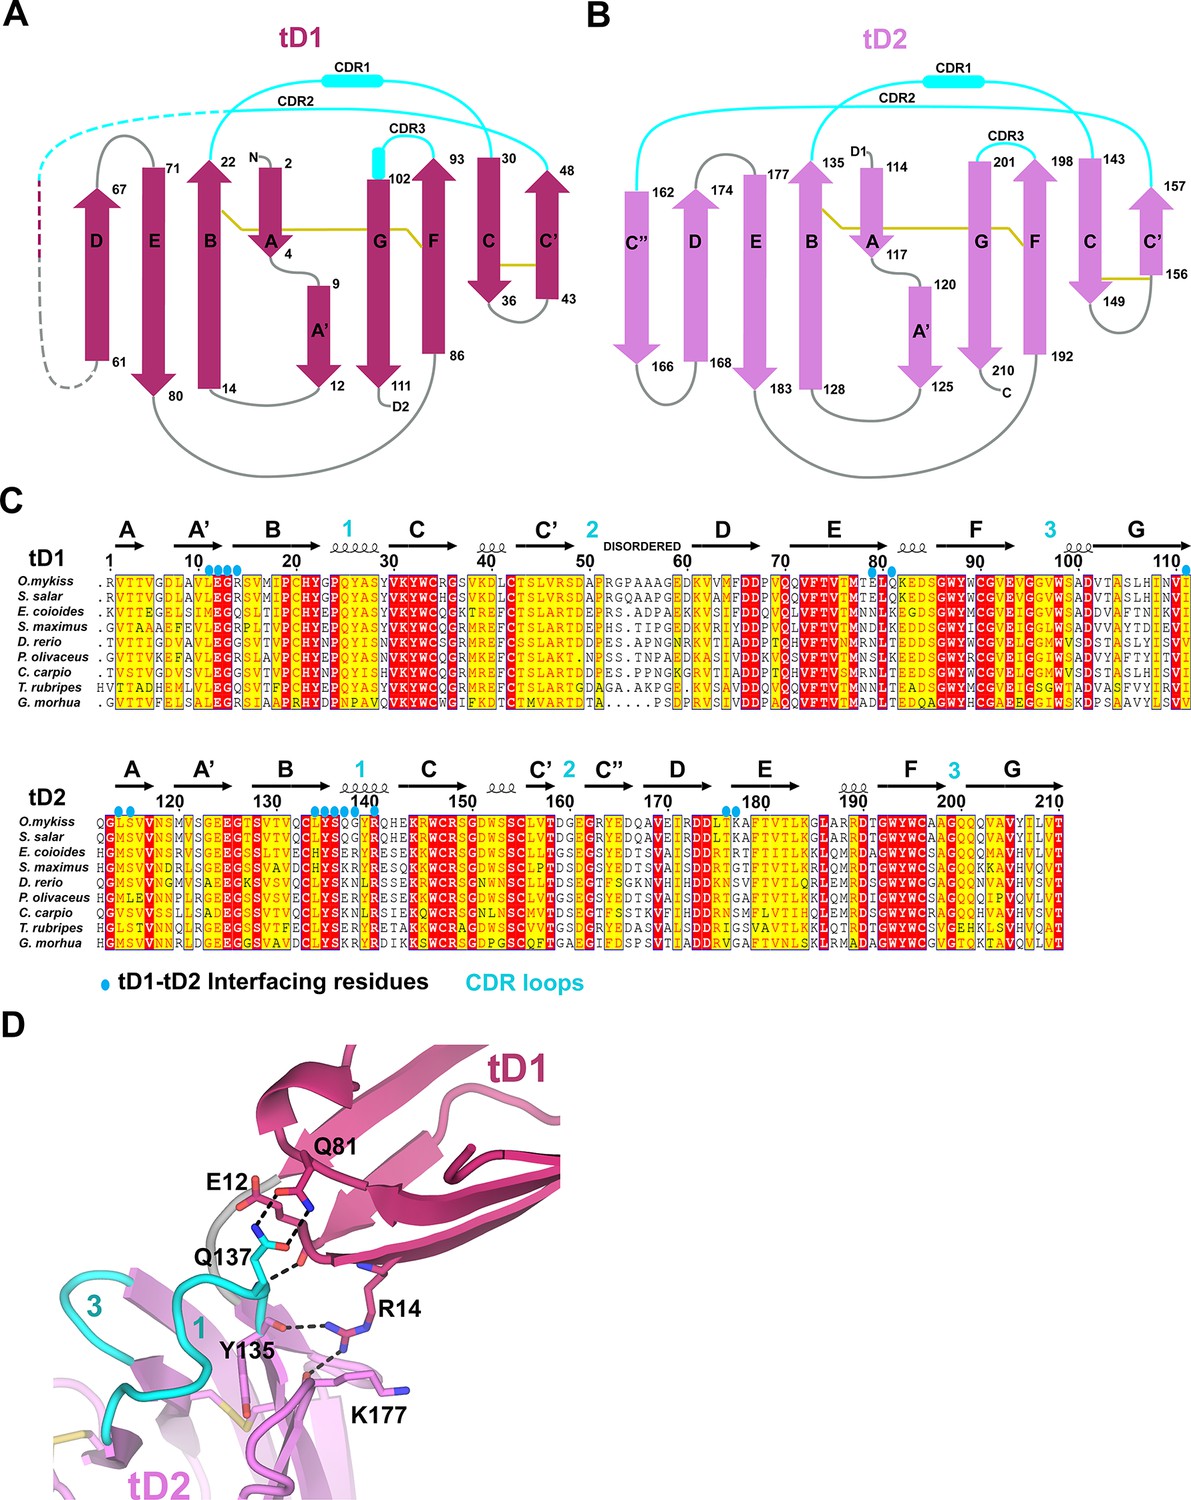
tSC domain interfaces and sequence conservation.
(A-B) Topology diagrams of tSC domain 1 (A) and domain 2 (B). β-strands are shown as arrows with residue numbers indicated. Disulfide bonds between strands are indicated by gold lines. (C) Sequence alignment of teleost fish SC showing the secondary structure from the tSC crystal structure (O. mykiss SC; top) along with the positions of CDR loops (cyan numbers) and tD1-tD2 interface residues (blue ovals). (D) Cartoon representation of tSC D1-D2 interface with putative hydrogen bonding interactions shown as sticks.
Figure 6 with 1 supplement

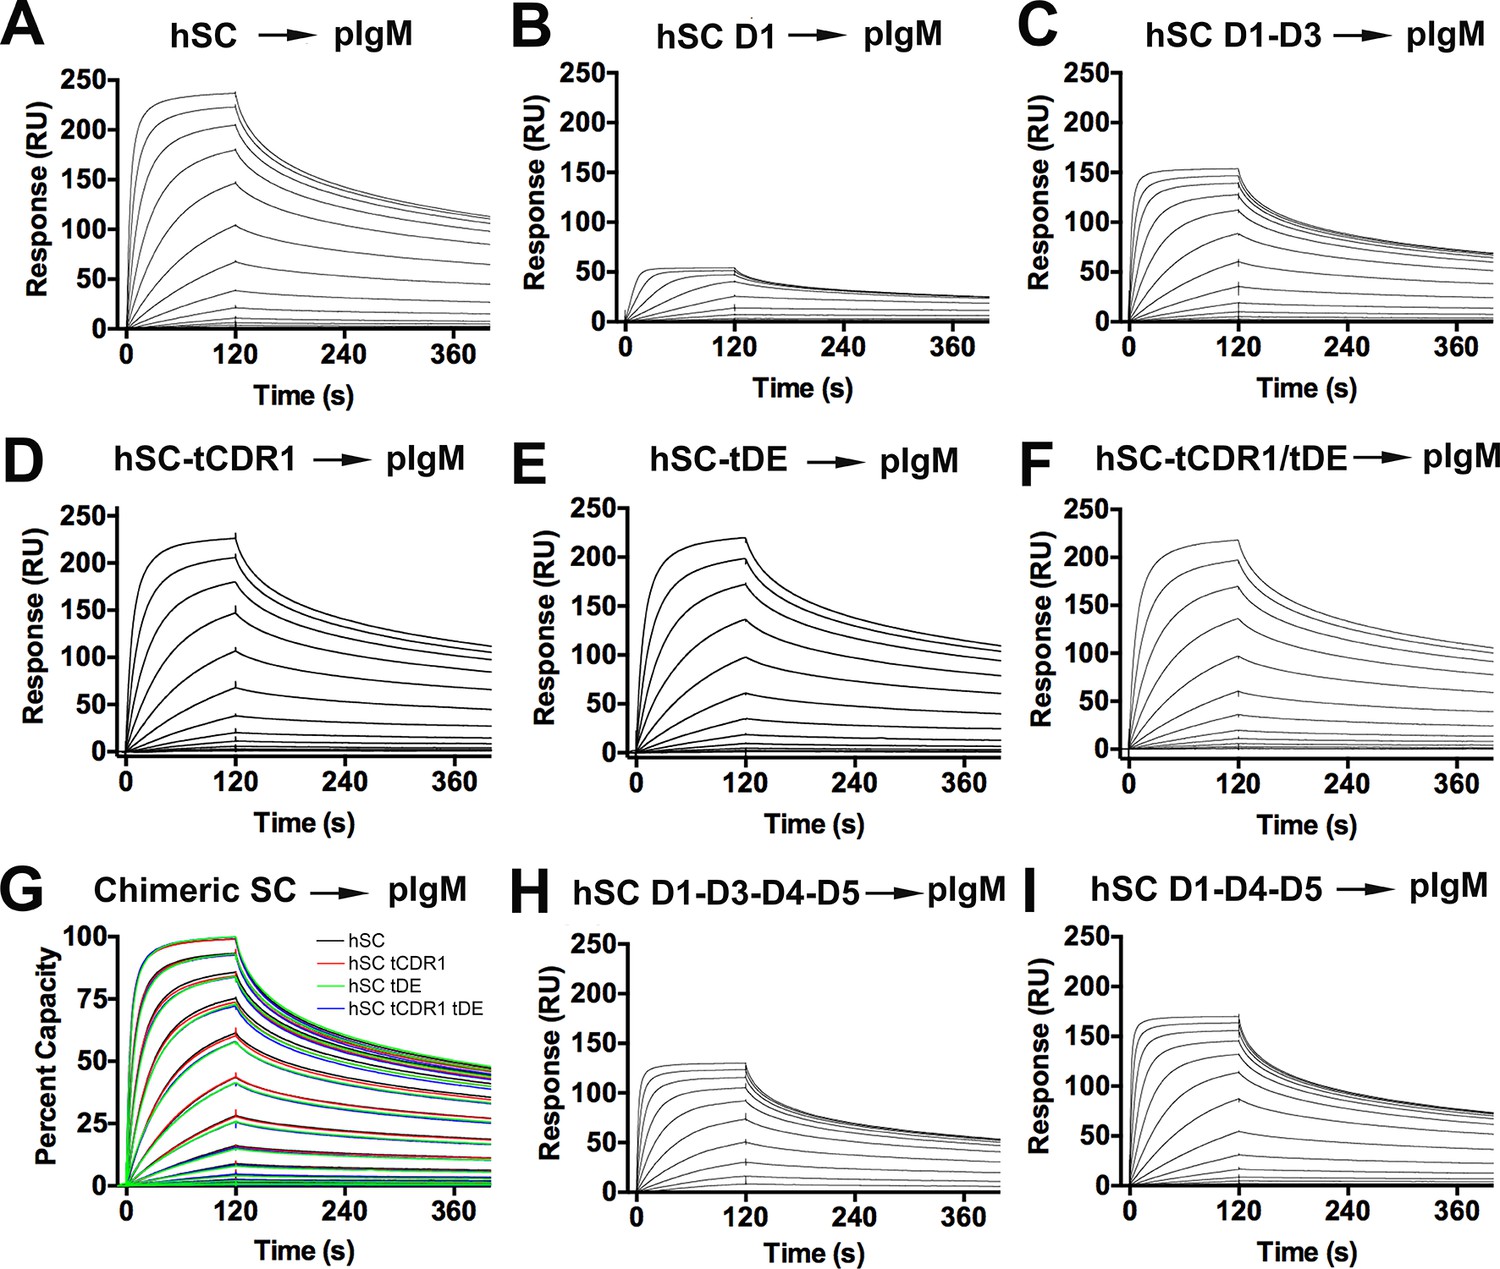
hSC and chimeric SC binding to dIgA.
(A-C) Sensorgrams showing hSC, D1, and D1-D3 binding to dIgA. (D) Cartoon representations and associated sequences of CDR1 and DE loop residues substituted in chimeric proteins following structural alignments and modeling. (E-G) Sensorgrams for interactions of chimeric SC proteins and dIgA. The time at which complete dissociation occurs is indicated (astrisk). (H) Equilibrium binding response versus the log of concentration for the sensorgrams in (A, E-G) and replicate experiments (not shown). Average KD values for two replicates for each SC variant were: hSC (63+/-4nM), hSC tCDR1 (82+/-1nM), hSC tDE (65+/-3nM), hSC tCDR1/tDE (140+/-7nM). (I-J) Sensorgrams showing hSC D1-D3-D4-D5 and D1-D4-D5 binding to dIgA. See also Figure 6—figure supplement 1.
Figure 6—figure supplement 1
hSC and chimeric SC binding to pIgM.
(A-F) Sensorgrams showing the responses of hSC D1-D5, D1, D1-D3 and chimeric SCs binding to pIgM. (G) Overlay of sensorgrams showing normalized response of D1-D5 and chimeric SC binding to pIgM. (H-I) Sensorgrams showing the response of D1-D3-D4-D5 and D1-D4-D5 binding to pIgM. All results were consistent among independent replicate experiments (not shown). Highest concentrations for hSC D1-D5, D1-D3, D1-D3-D4-D5 D1-D4-D5, tCDR1, tDE, tCDR1/tDE were 256nM. Highest concentration for D1 was 16nM.
Figure 7
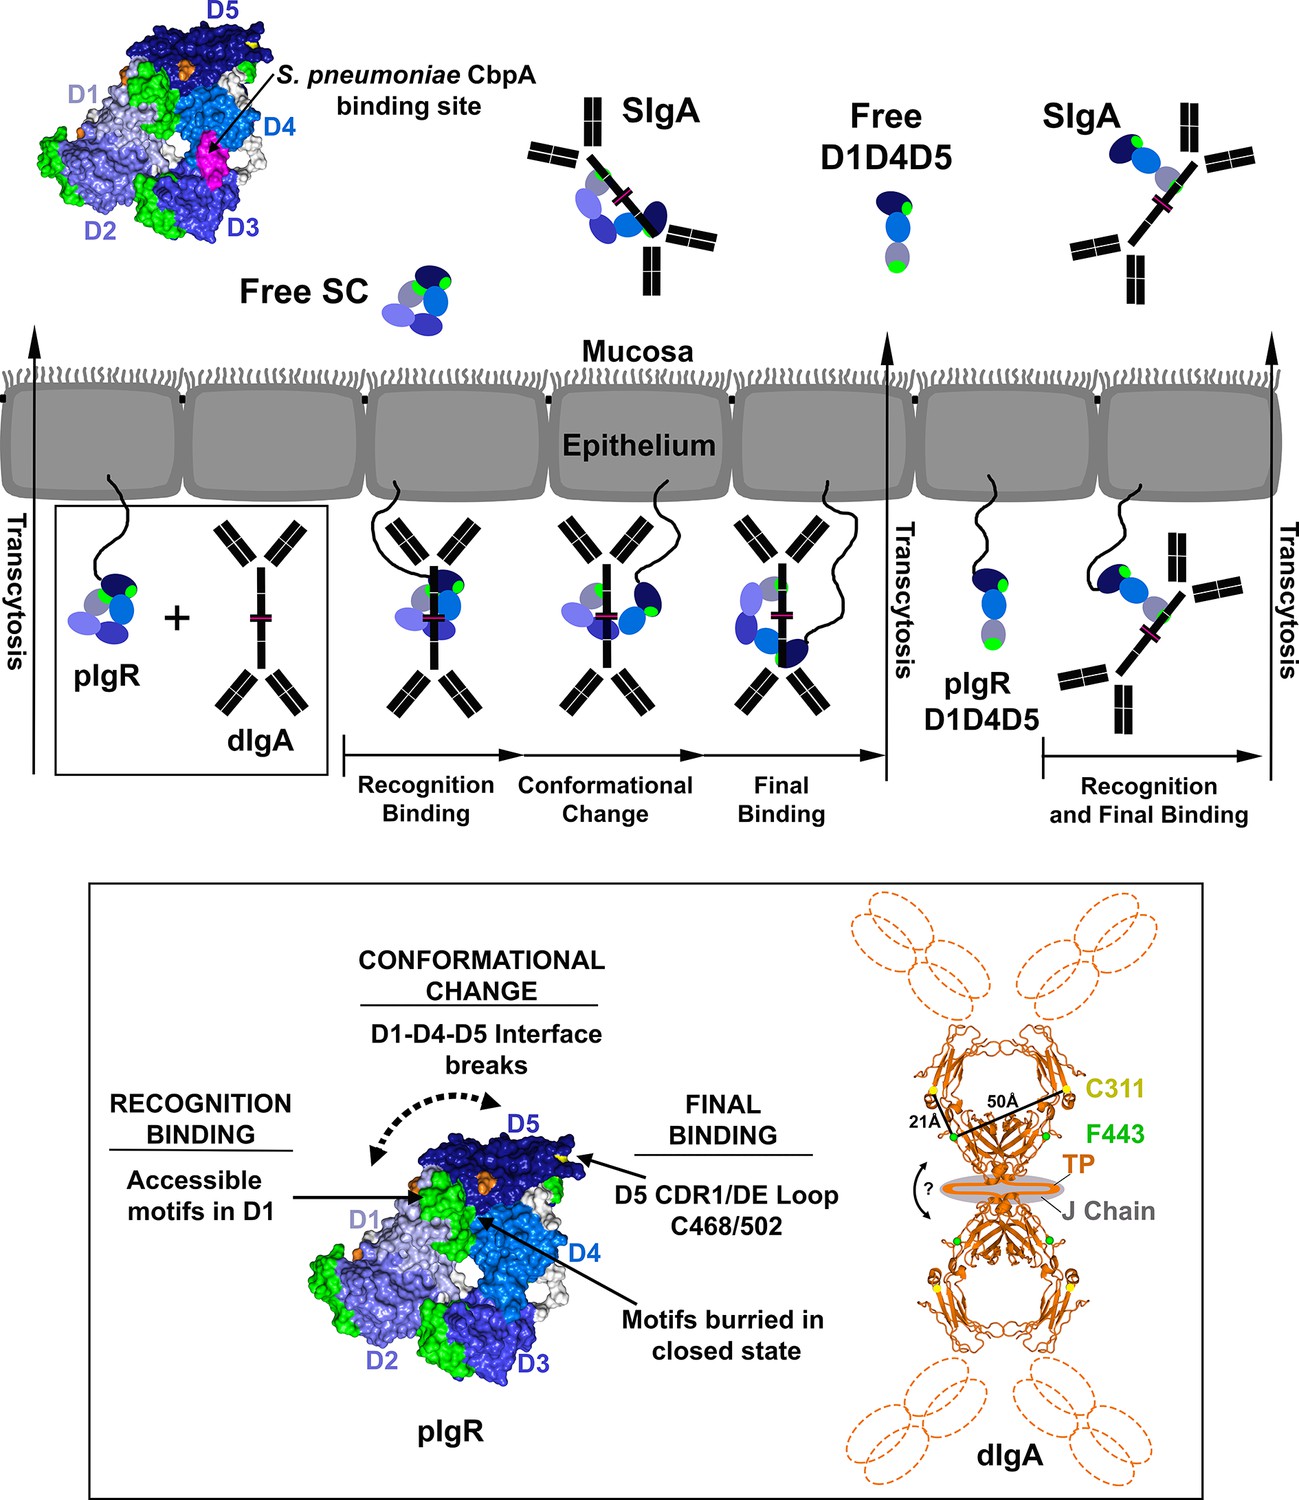
Model for pIgR transcytosis, ligand binding and release of free SC and SIgA.
Schematic model depicting a mammalian epithelial barrier with membrane-bound SC (pIgR) shown on the basolateral side in its closed, unliganded conformation. The pIgR D1-D5 binding to dIgA is depicted as a three-step mechanism whereas pIgR D1-D4-D5 splice variant binding to dIgA is depicted as a one-step mechanism. pIgR binding to pIgM is not shown but occurs via a mechanism related to dIgA binding. The boxed region (pIgR D1-D5 and dIgA) is enlarged and associated atomic resolution models shown (inset). The hSC crystal structure is colored as in Figure 1. A model for dIgA based on the Fcα crystal structure (pdb code 1OW0) is shown with the Fabs, tailpiece (TP) and J chain shown schematically, approximate distances between known SC binding sites labeled (C311 and F443), and an arrow indicating possible bending at the dimer interface. Following transcytosis, free SC and SIgA (and SIgM) are released into the mucosa. Unliganded mucosal SC is depicted as a schematic and as the hSC structure (same colors as Figure 1C) with residues 349–375, the putative D4 S. pneumonia CbpA binding site, colored magenta.
Additional files
-
Supplementary file 1
Crystallographic data collection and refinement statistics.
Values in parenthesis refer to the highest-resolution shell. aR-meas, redundancy-independent merging R-factor (Diederichs and Karplus, 1997). bCC1/2, correlation of one half of the reflections to the other half. cCC*, CC1/2 modification showing the correlation of the observed data to unknown true intensities (Karplus and Diederichs, 2012). dRcryst = (Σ Fobs-Fcalc)/(Σ Fobs) and Rfree = Rcryst calculated for 5–10% of reflections from each structure that were excluded from refinement. eRMS = Root mean square deviation from ideal value. fDetermined by Molprobity (Chen et al., 2010).
- https://doi.org/10.7554/eLife.10640.016
-
Supplementary file 2
Expression constructs used in this study.
Table listing the name, residue numbers, mutation(s) (endogenous sequence -> mutated sequence) and mature protein sequence for all protein expression constructs used in this study. Residue numbering is based on the mature hSC and tSC sequences and abbreviations used are: SP (Signal peptide), 6HIS (hexahistidine affinity tag), Strep II (Strep II affinity tag), C->A (C468A; C502A mutation).
- https://doi.org/10.7554/eLife.10640.017
Download links
A two-part list of links to download the article, or parts of the article, in various formats.
Downloads (link to download the article as PDF)
Open citations (links to open the citations from this article in various online reference manager services)
Cite this article (links to download the citations from this article in formats compatible with various reference manager tools)
The structure and dynamics of secretory component and its interactions with polymeric immunoglobulins
eLife 5:e10640.
https://doi.org/10.7554/eLife.10640


