Bistability of a coupled Aurora B kinase-phosphatase system in cell division
- University of Pennsylvania, United States
- Russian Academy of Sciences, Russia
- Massachusetts Institute of Technology, United States
- Federal Research and Clinical Centre of Pediatric Hematology, Oncology and Immunology, Russia
- Moscow State University, Russia
Figures
Figure 1 with 1 supplement
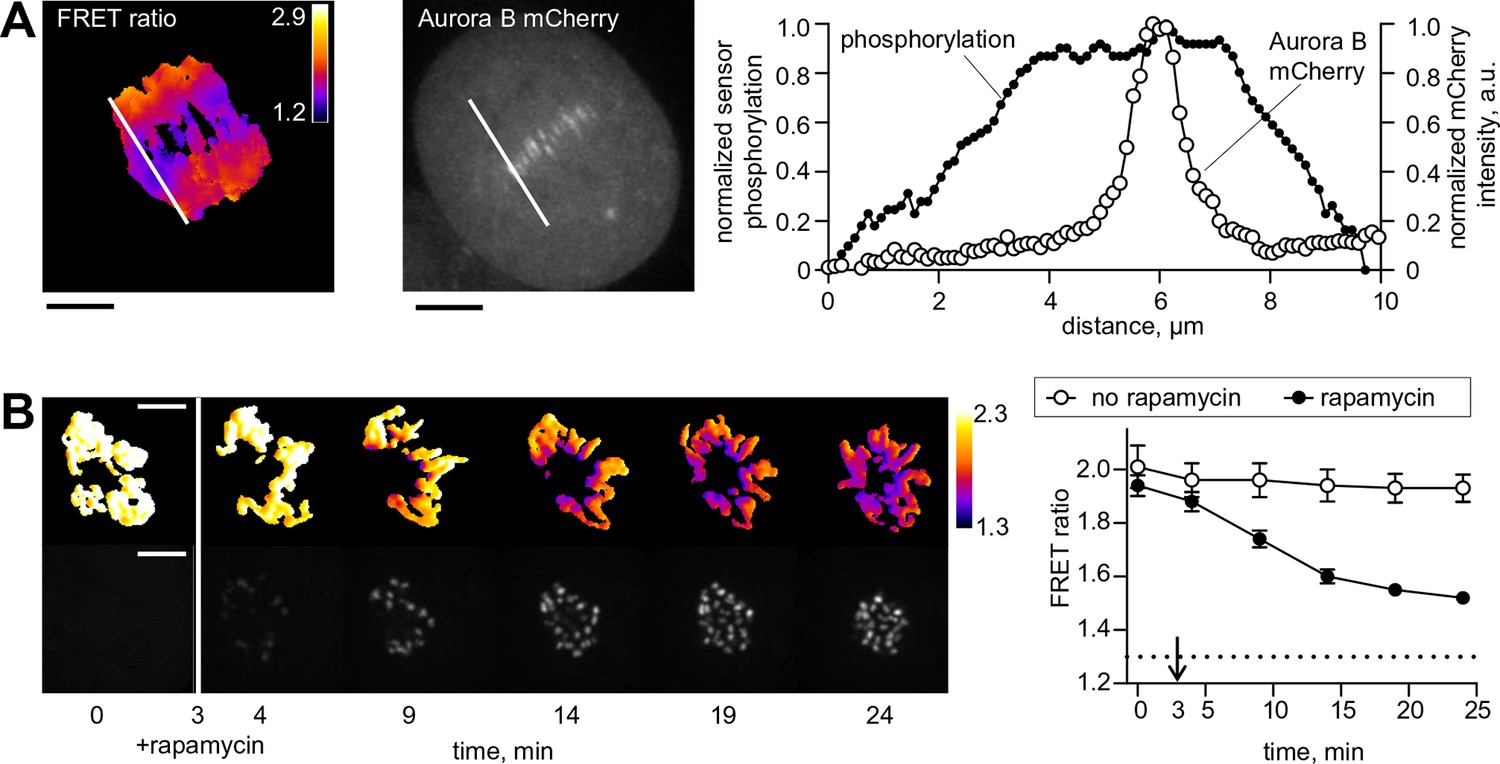
Spatial phosphorylation patterns in mitotic HeLa cells.
(A) A HeLa cell expressing the chromatin-targeted Aurora B sensor and Aurora B-mCherry was imaged in anaphase, 10 min after addition of an Mps1 inhibitor, reversin, to increase occurrence of lagging chromosomes. The FRET ratio image shows the YFP/CFP emission ratio, color-coded as indicated. Scale bar is 5 µm. The plot shows normalized sensor phosphorylation (left axis) calculated from the FRET ratio data (see Materials and methods) and Aurora B localization signal (right axis) along the white lines which were drawn along the spindle axis in images on the left. (B) HeLa cells expressing CENP-B-FKBP, mCherry-INbox-FRB and miRNAs to deplete endogenous FKBP and INCENP, and the chromatin-targeted Aurora B sensor. Cells were treated with the kinesin-5 inhibitor STLC to generate monopolar spindles, then imaged live during rapamycin addition to induce INbox and Aurora B recruitment to centromeres. Images show INbox recruitment (bottom panels) and the YFP/CFP emission ratio (top panels) for one cell. Graph shows the FRET emission ratio averaged over chromatin in multiple cells (n≥10) treated at 3 min (arrow) with or without rapamycin. FRET ratio = 1.3 (horizontal dotted line) represents maximal Aurora B activity in cells with no INCENP depletion. The experiment was repeated three times with similar results.
Figure 1—figure supplement 1
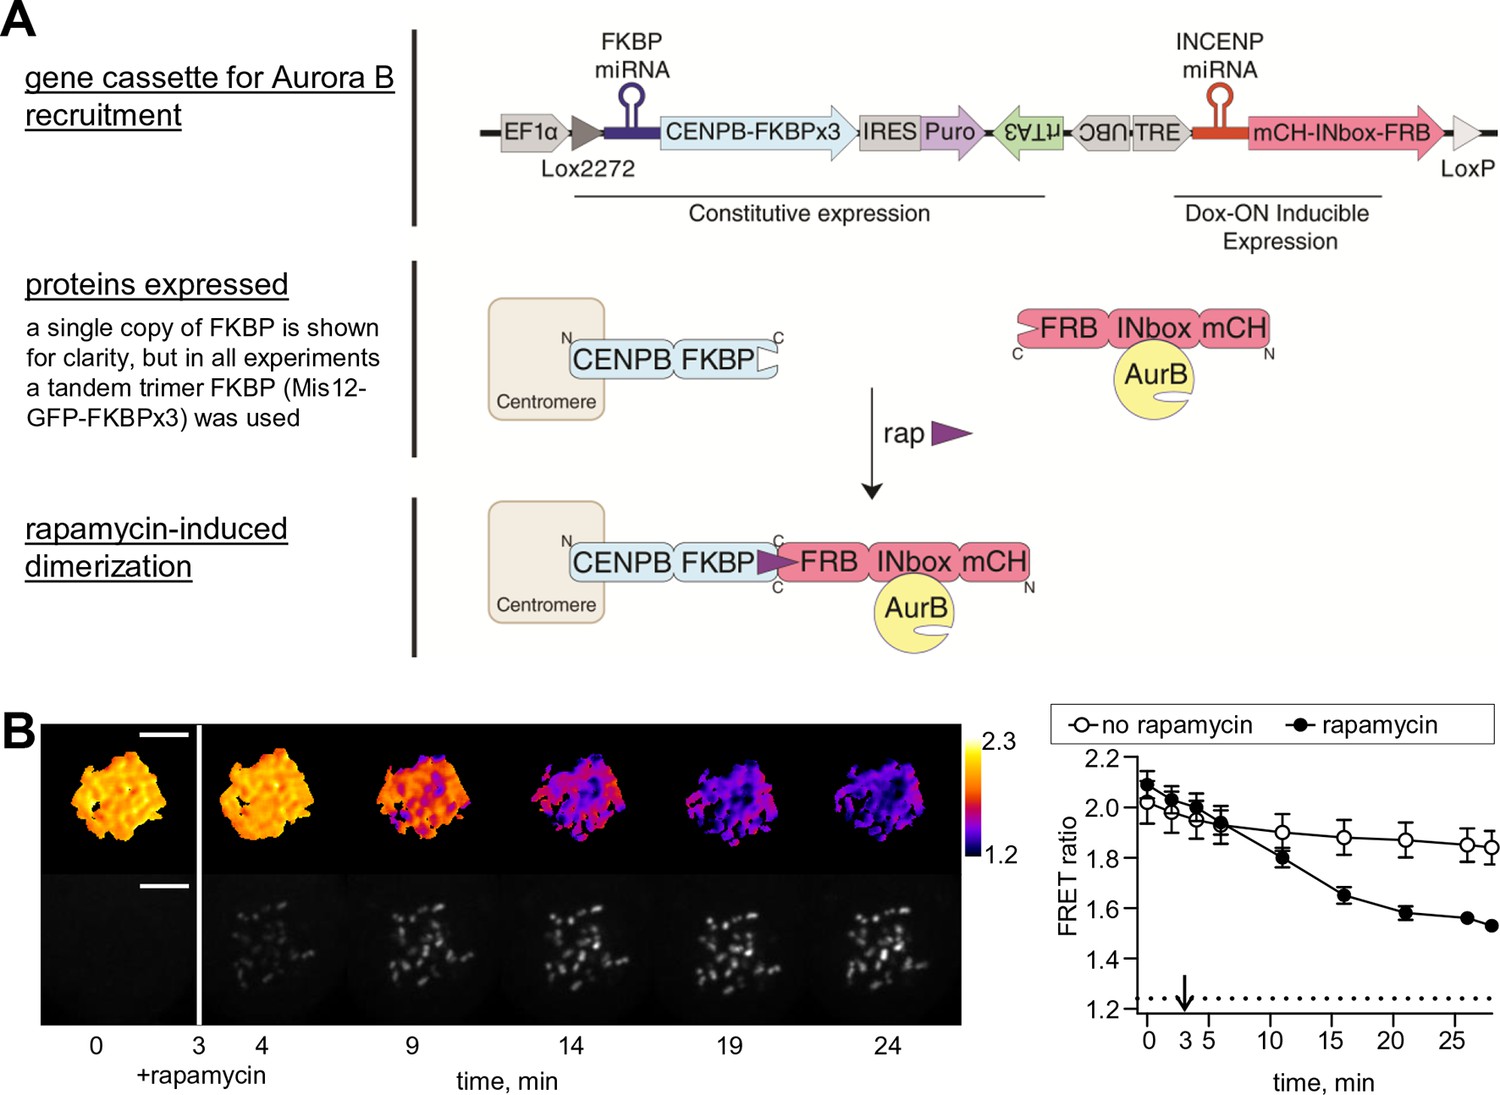
Phosphorylation of the chromatin-targeted Aurora B sensor after INbox recruitment to centromeres.
(A) Schematic of the experiment in which the Aurora B-INbox complex labeled with mCherry (mCH) is recruited to centromeres by addition of rapamycin; see Materials and methods for details. (B) Cells were treated as in Figure 1B, but arrested with nocodozole instead of STLC; scale bar is 5 µm. Graph on the right shows FRET emission ratio averaged over chromatin in n≥11 cells, N = 3 independent experiments. FRET ratio = 1.24 (horizontal dotted line) represents maximal Aurora B activity in cells with no INCENP depletion.
Figure 2 with 3 supplements
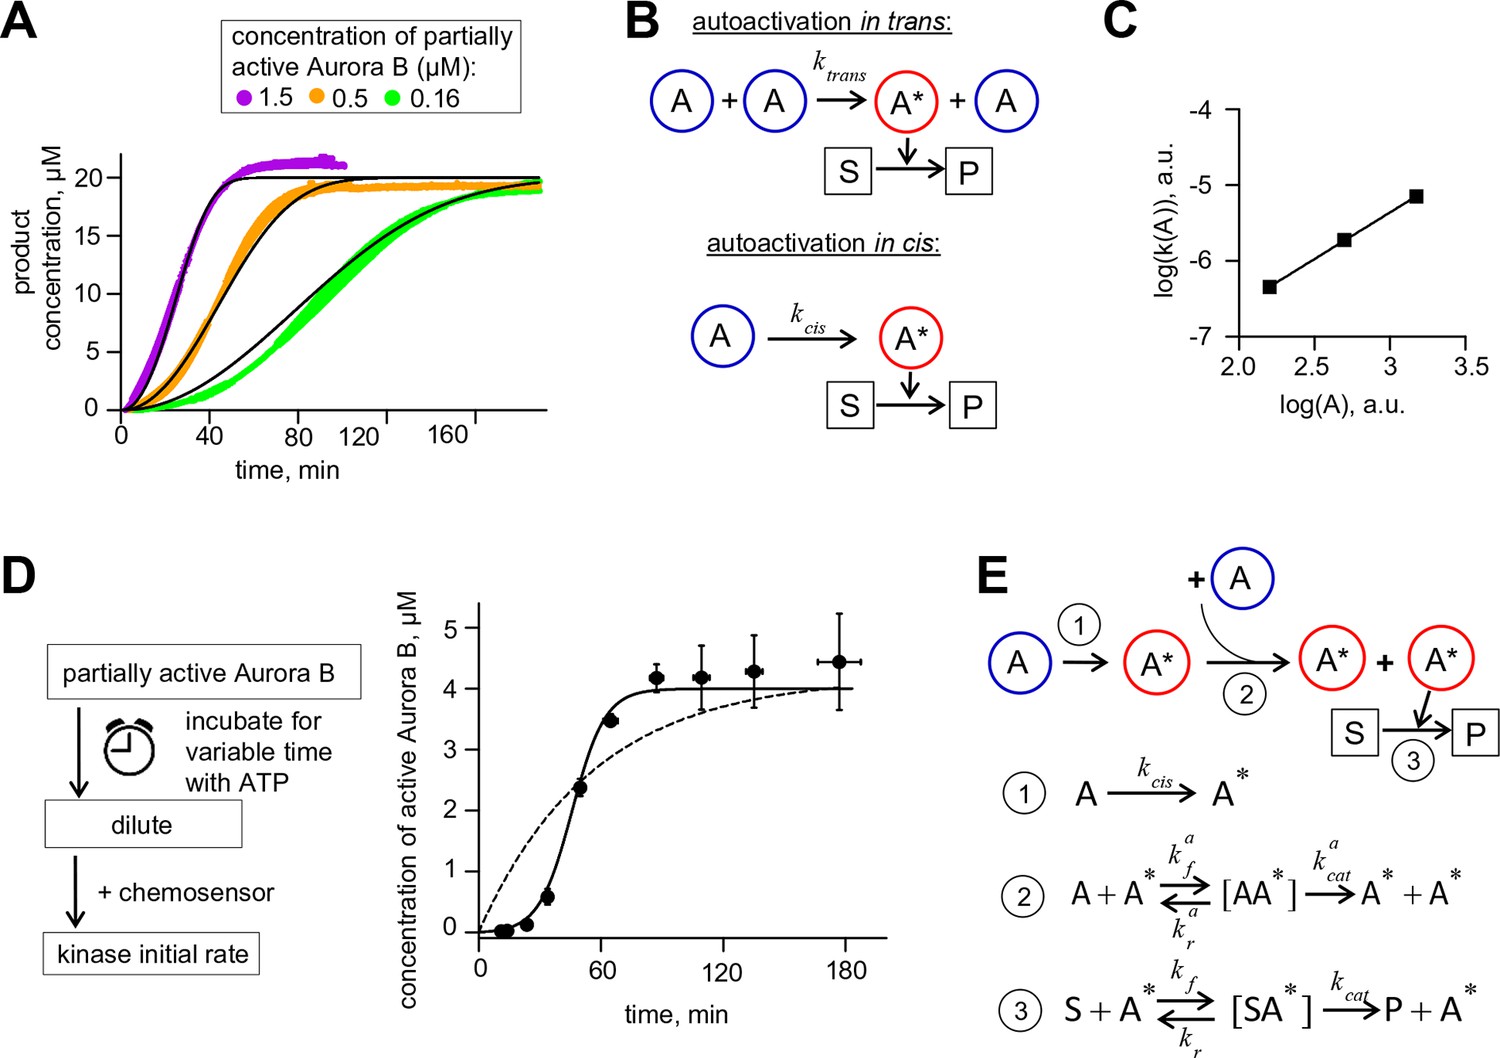
Aurora B kinase autoactivation in vitro.
(A) Phosphorylation of 20 µM chemosensor by the indicated concentrations of partially active Aurora B kinase. Data are averages of N = 2 experiments for each kinase concentration; error bars are SEMs. Black lines are theoretical fittings with the reaction scheme in panel E. (B) Molecular scheme for Aurora B autoactivation in trans or in cis. A and A* denote partially active (dephosphorylated) and active kinase; S and P indicate substrate and product (unphosphorylated and phosphorylated chemosensors, respectively). (C) Coefficient k for the quadratic phase of chemosensor phosphorylation by partially active Aurora B kinase vs. kinase concentration (A) plotted on a log-log scale. Line is linear fit. (D) Diagram of the experimental procedure to evaluate Aurora B autoactivation at high kinase concentration (4 µM). Experimental graph on the right shows changes in concentration of active Aurora B, calculated as described in Materials and methods. Data points are mean ± SEM for N≥4 experiments. Solid line is theoretical fitting with the reaction scheme in panel E. Dashed line is theoretical fit using the analytical solution for A*(t) for the reaction scheme with only in cis activation of Aurora B. (E) Molecular scheme for the Aurora B kinase two component autoactivation in the presence of chemosensor and the corresponding reactions, see system equation 2 in Materials and methods. All other symbols are listed in Tables 1 and 2.
Figure 2—figure supplement 1
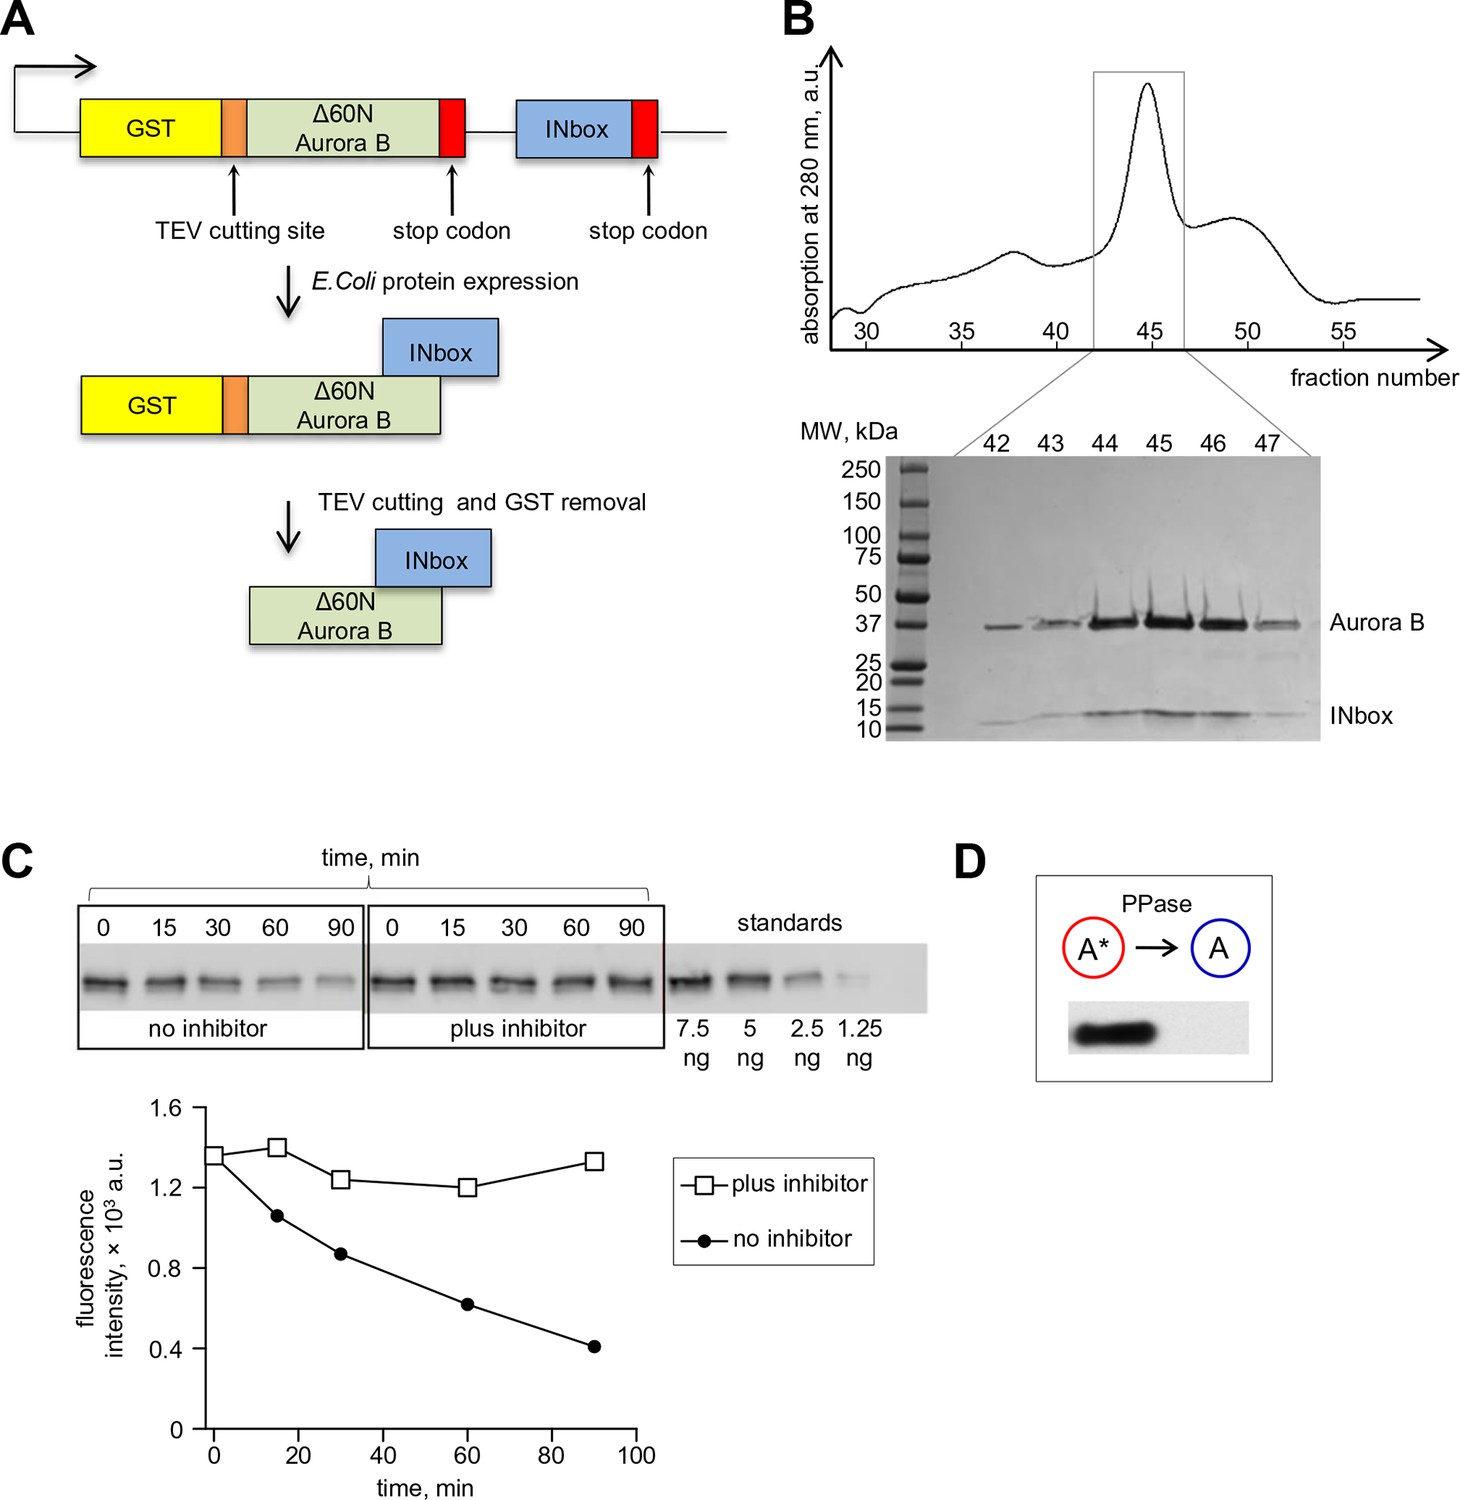
Bicistronic construct of Aurora B-INbox and its dephosphorylation.
(A) Schematic of a bicistronic DNA construct for the Aurora B-INbox complex (top) and the expected protein product. (B) Elution profile from size-exclusion chromatography and SDS gel (below) show that Delta60N Aurora B and INbox co-purify. Predicted molecular weights for Delta60N Aurora B and INbox are 36 and 7 kDa, respectively. (C) Dephosphorylation of purified Aurora B-INbox complex by Lambda protein phosphatase (25 nM) added at time 0; phosphatase was inhibited by 10 mM phosphonoacetic acid. A phospho-specific antibody to INCENP (Salimian et al., 2011) was used for western blots; dilutions of purified Aurora B-INbox complex with no phosphatase were used to confirm linearity of the detection procedure. Fluorescent signals were quantified as described in Materials and methods. (D) Western blot using the phospho-specific antibody to INCENP was done for 8 µM Aurora B before and after treatment with 0.2 µM phosphatase for 90 min at 30°C.
Figure 2—figure supplement 2
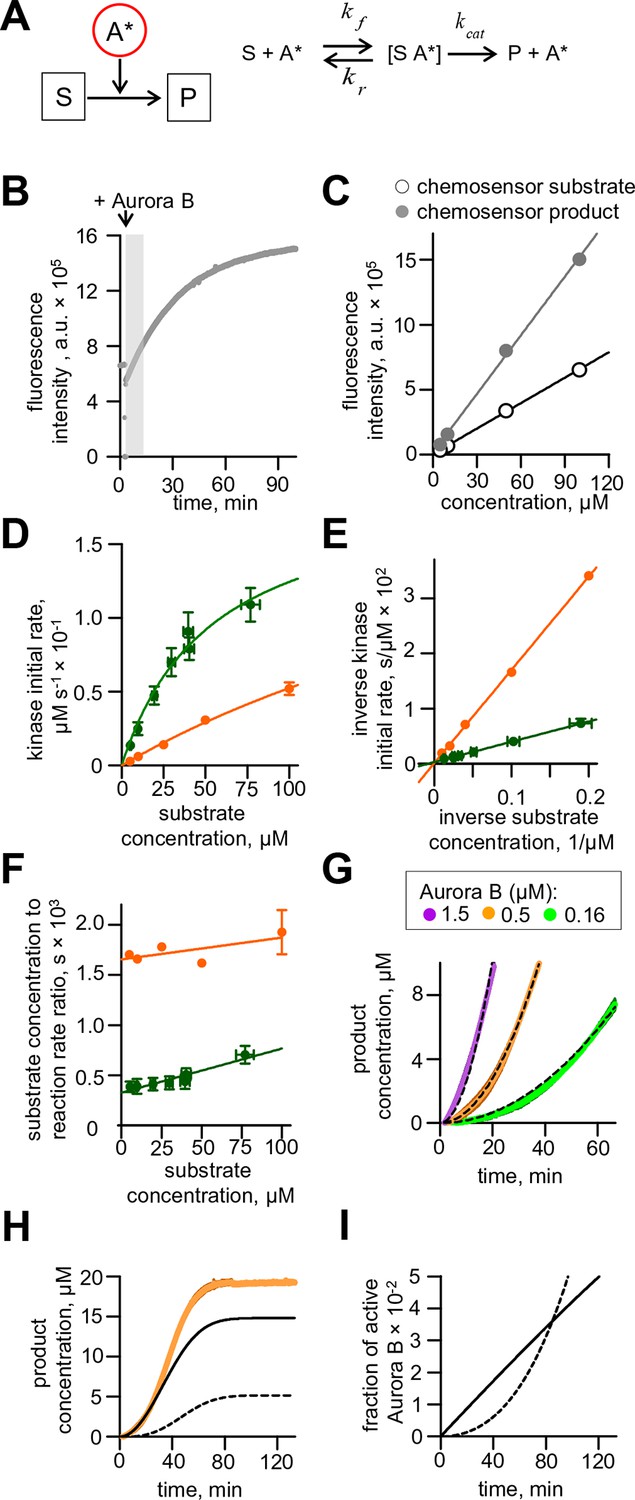
Aurora B activity towards chemosensor.
(A) Molecular scheme for the reaction of chemosensor phosphorylation by Aurora B kinase; see Table 1 and 2 and legend to Figure 2 for details. (B) Example trace for phosphorylation of commercial Omnia sensor. Recording is interrupted when Aurora B kinase is added; shaded area shows time interval with a roughly linear slope, from which the initial rate was calculated. (C) Standard curves for chemosensor substrate and product florescence. Lines are linear fits. (D) Initial rate of chemosensor phosphorylation by Aurora B kinase as a function of chemosensor concentration. Solid lines are Michaelis-Menten fittings. Here and in panels (E) and (F), green color depicts data for the commercial Omnia chemosensor, and orange is our synthesized chemosensor. Graphs represent data from 2 independent experiments; error bars are SEM. (E) Lineweaver–Burk plot of the inverse phosphorylation rate as a function of the inverse chemosensor concentration. Solid lines are linear fits. (F) Hanes–Woolf plot of the ratio of substrate to the reaction rate as a function of substrate concentration. Solid lines are linear fits. (G) Enlargement of the initial stage for chemosensor phosphorylation curves from Figure 2A. Dashed lines are best fits with quadratic functions, yielding coefficient k plotted in Figure 2C. (H) Phosphorylation of 20 µM chemosensor by 0.5 µM partially active Aurora B kinase. Orange line – experimental data from Figure 2A, solid black line – calculated concentration of the chemosensor product phosphorylated by Aurora B activated in cis, dashed black line - by Aurora B activated in trans. (I) Time course for the fraction of active Aurora B kinase; initial concentration of partially active Aurora 0.5 µM. Solid line – fraction of Aurora B phosphorylated in cis, dashed line – autoactivation in trans.
Figure 2—figure supplement 3
Results for Aurora B two sites phosphorylation model.
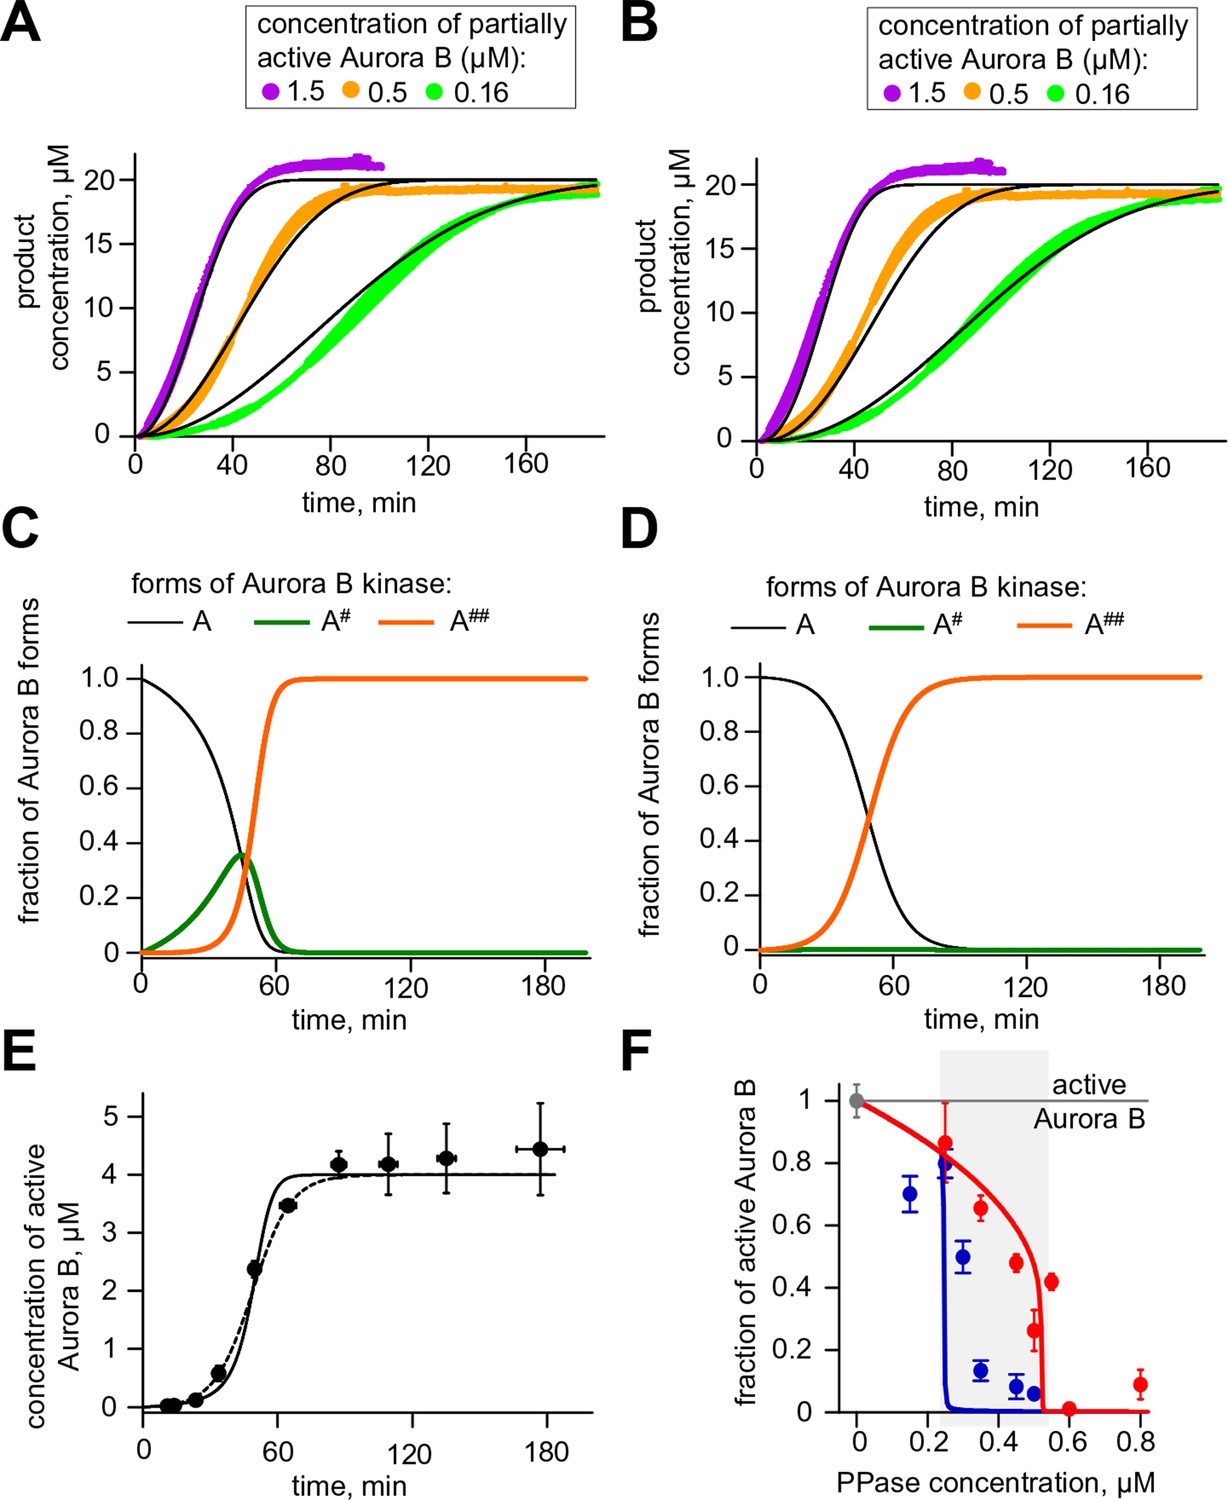
(A) Results of the unconstrained fitting for chemosensor phosphorylation curves; experimental data same as in Figure 2A. (B) Same experimental data as in panel (A) but fitted using limiting case model parameters for the rapid conversion of kinase A#. (C) Changes in concentrations of three Aurora B forms during autoactivation at 4 µM total Aurora B concentration using unconstrained fitted parameters. (D) Same calculation as in panel (C) but using limiting case parameter values. (E) Fitting of the experimental data from Figure 2D. Solid line - unconstrained fitting, dashed line – limiting case values. (F) Fitting of the experimental data from Figure 4C. Solid lines - unconstrained fitting with two site model.
Figure 3 with 1 supplement
Theoretical analysis of the coupled Aurora B kinase-phosphatase system.
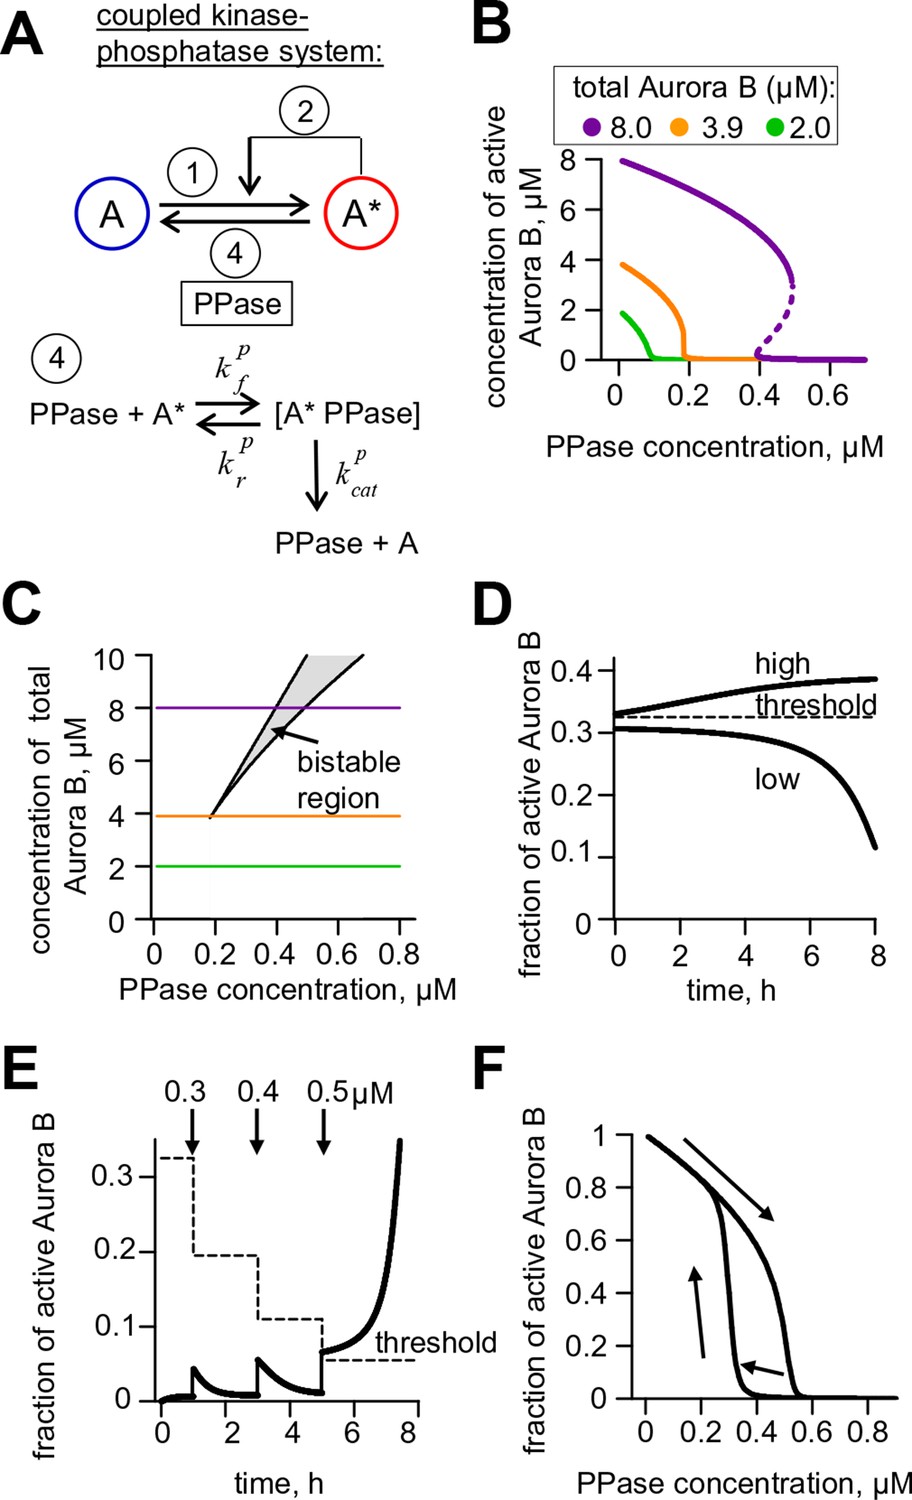
(A) Molecular scheme for the coupled system and the corresponding reactions. For reactions 1 and 2 see Figure 2E; see Table 1 and 2 for more details. (B) Steady-state solutions for concentration of active Aurora B kinase as a function of phosphatase concentration (Equation 4 in Materials and methods). For 8 µM Aurora B, three steady states can co-exist: two stable states with high and low activities and one unstable state (dashed line), corresponding to the region of bistability. (C) Bistability region in the parametric plane of phosphatase and total (phosphorylated and not) Aurora B kinase concentrations. In this region the model has two coexisting stable steady-state solutions, while enzymatic concentrations outside this region lead to only one steady state. Colored lines correspond to the solutions shown in panel B for active kinase. (D) Theoretical predictions for the changes in concentration of active Aurora B kinase, plotted as a fraction of total kinase concentration, for two different initial conditions. The initial concentration slightly higher than the threshold (horizontal line) has a steady-state solution with a larger fraction of active kinase (high state). The fraction of active Aurora B kinase declines when its initial concentration is below the threshold (low state). Calculations were done for 8 µM total Aurora B kinase and 0.47 µM phosphatase. (E) Simulation of perturbations to reaction with 0.47 µM phosphatase and 8 µM total Aurora B kinase. Active kinase is added 3 times as indicated (vertical arrows). The system returns to the steady state with low Aurora B kinase activity until the threshold is exceeded. (F) Hysteresis loop in the kinase-phosphatase system with 8 µM kinase. Phosphatase concentration was initially low, so almost all Aurora B kinase was active. As the phosphatase concentration was gradually increased up to 0.8 µM, the steady-state concentration of active Aurora B kinase decreased (top line with downward arrow). Different solutions were obtained when phosphatase concentration was decreased gradually back to 0 µM (lower line with two upward arrows).
Figure 3—figure supplement 1
Aurora B hysteresis dependency on phosphatase.
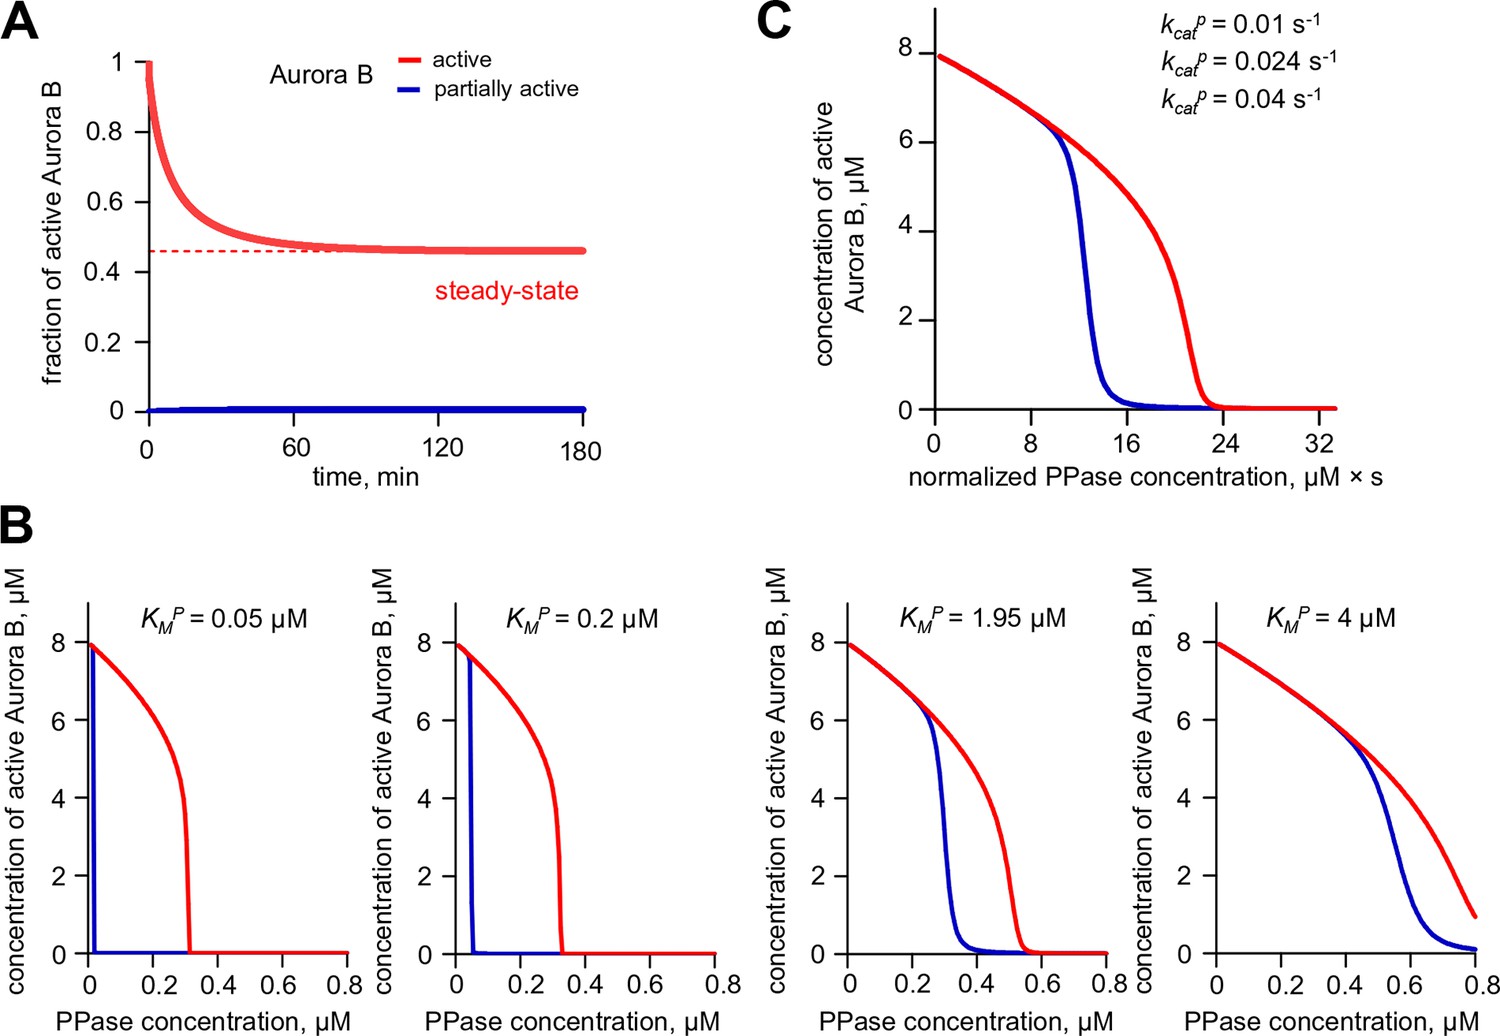
(A) Kinetics of the fraction of active Aurora B kinase in simulations to study hysteresis. Horizontal dashed line shows the steady-state level for active Aurora B; results are for total Aurora B concentration 8 µM and phosphatase 0.45 µM. (B) Hysteresis loop was calculated for four different Michaelis constants KMP for phosphatase (PPase). Hysteresis is observed for all tested parameters but it requires slightly lower PPase concentration for smaller KMP. (C) Hysteresis loops for three different PPase catalytic rate constants kcatP plotted vs. normalized PPase concentration (PPase concentration divided by kcatP); three curves overlap completely, illustrating that hysteresis in this coupled system does not depend on the catalytic rate of phosphatase.
Figure 4
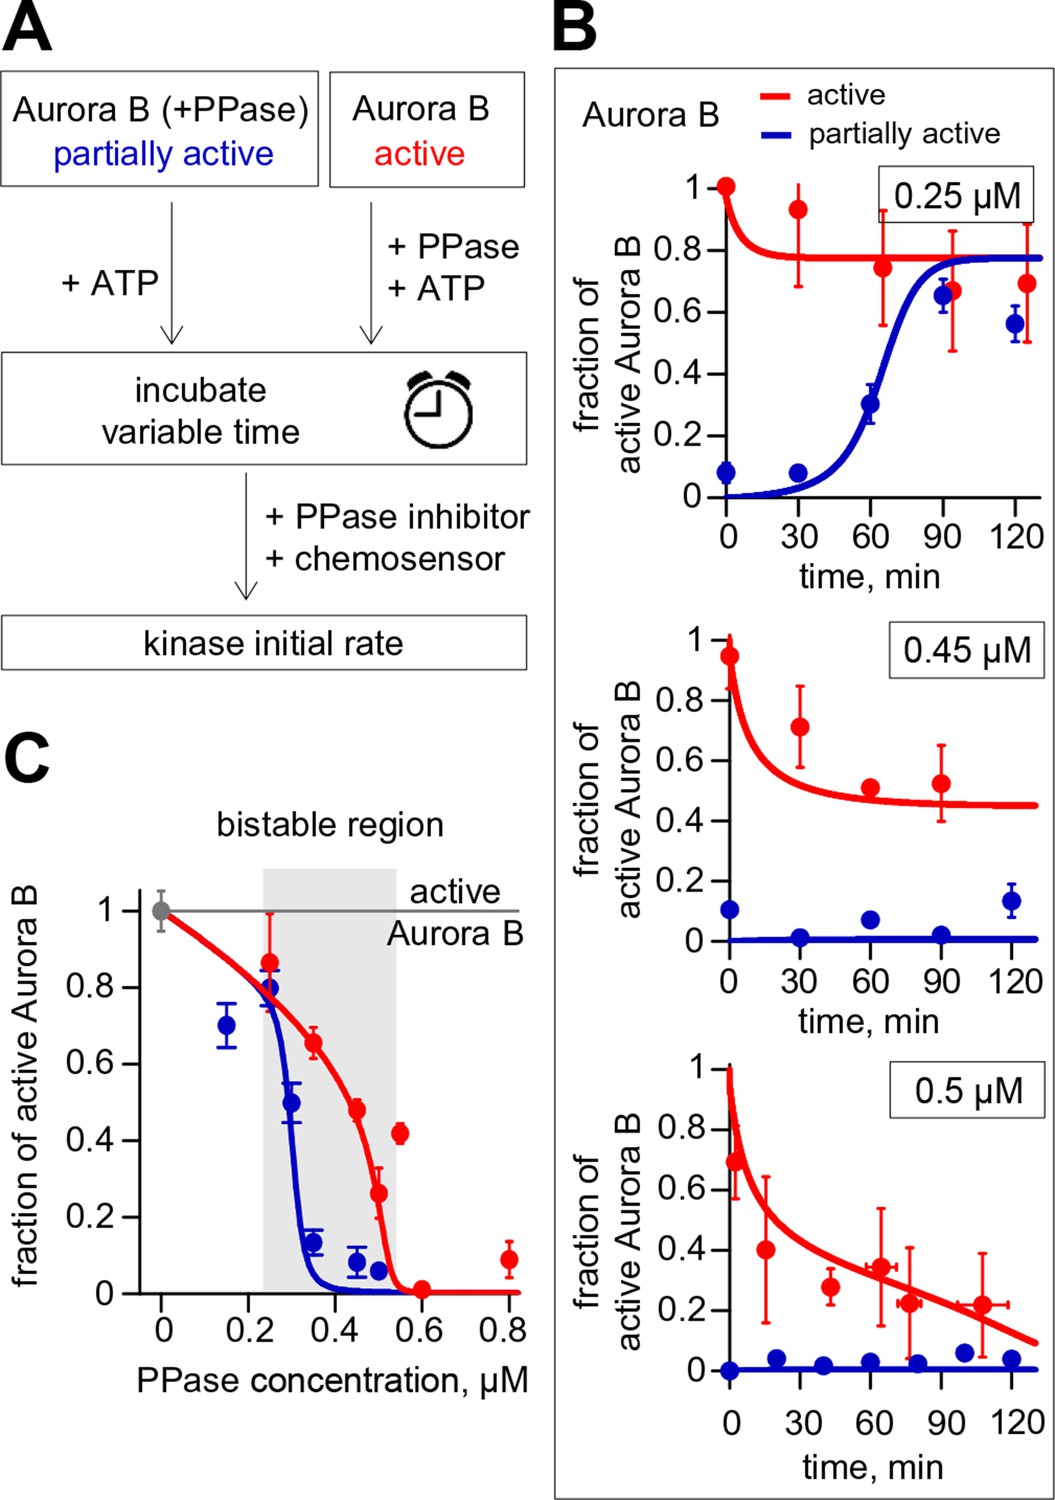
Reconstitution of the coupled Aurora B kinase-phosphatase system in vitro.
(A) Diagram of the experimental procedure to study bistability and hysteresis. Active kinase was preincubated with phosphatase (PPase) in the absence of ATP to generate partially active kinase, and ATP was added at time = 0 ('initially low' experiment). In a parallel experiment, the same reagents were used but active kinase, phosphatase and ATP were mixed together at time = 0 ('initially high' experiment). Samples were taken to analyze kinase activity until the corresponding steady states were reached. (B) Experimental results (dots) for changes in kinase activity vs. incubation time for 8 µM kinase and 0.25, 0.45 or 0.5 µM phosphatase, as indicated. Each point shows mean ± SEM (N≥2) for experiments with active (red) or partially active (blue) Aurora B kinase. (C) Fraction of active kinase at steady state as a function of phosphatase concentration. Points are mean ± SEM for N≥4 independent experiments. These data are in close agreement with the model built using our experimentally determined kinetic constants (solid lines in panels B and C).
Figure 5 with 1 supplement
Bistability and hysteresis of Aurora B kinase in dividing cells.
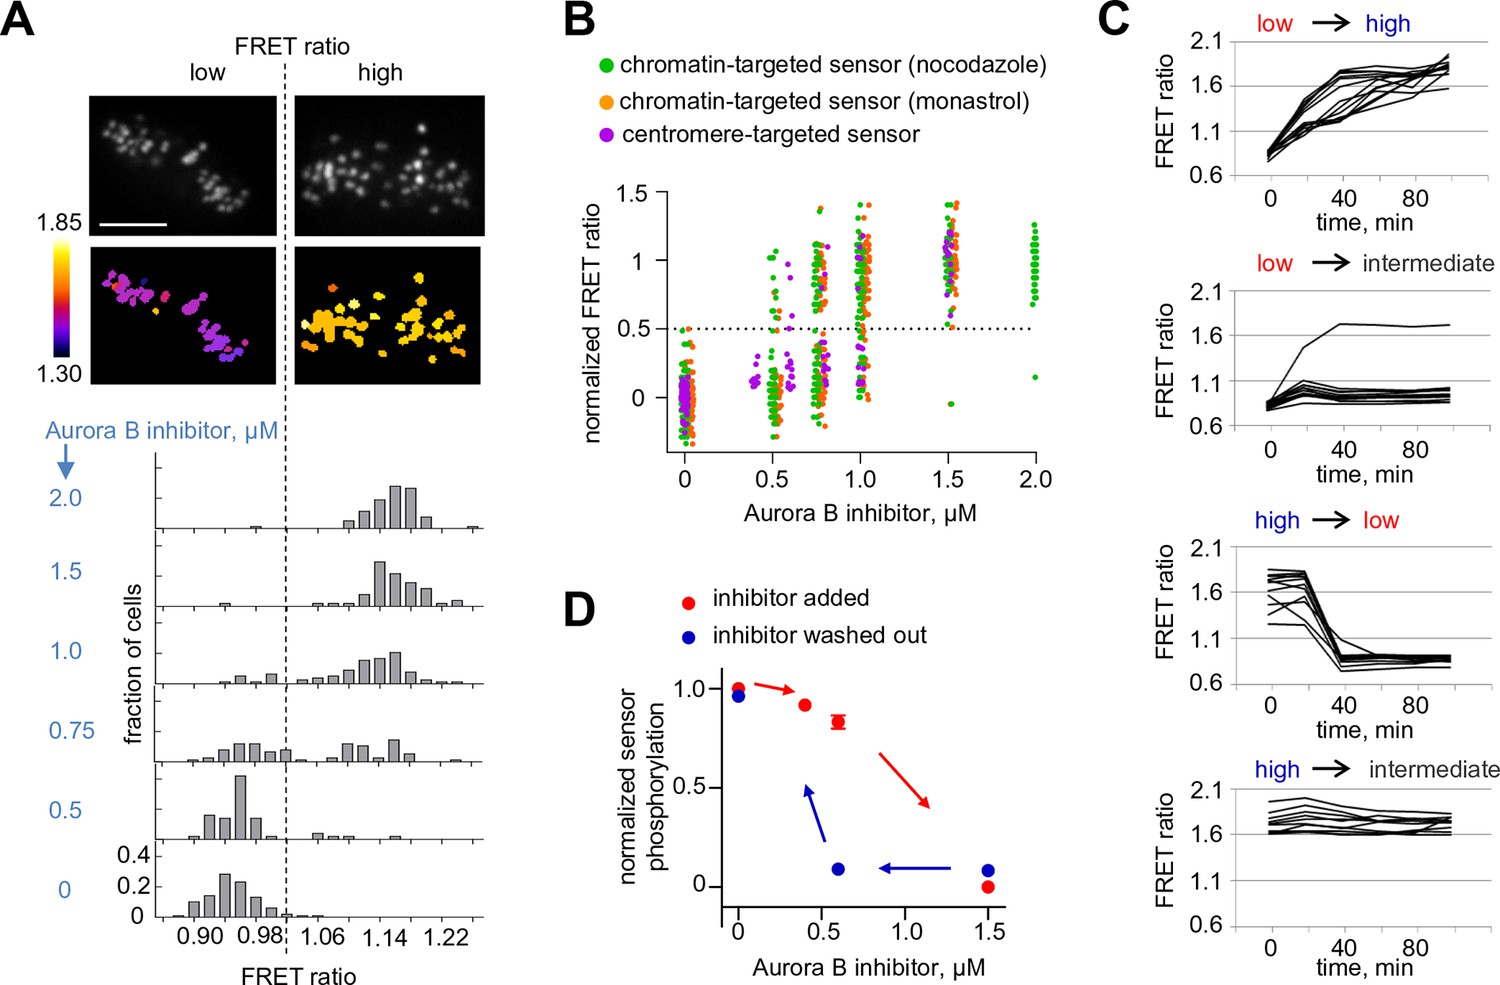
(A) Cells expressing the centromere-targeted Aurora B sensor were arrested in mitosis with the proteasome inhibitor MG132 and incubated with various concentrations of the Aurora B inhibitor ZM447439, then imaged live. Images show representative cells at 0.75 µM of Aurora B inhibitor: top images CFP emission, bottom images YFP/CFP emission ratio. Histograms below show fraction of cells with the indicated FRET ratio (average YFP/CFP over a single cell), N > 50 cells for each Aurora B inhibitor concentration. (B) Data from (A) are plotted together with similar experiments for cells expressing the chromatin-targeted sensor, arrested in mitosis with either nocodazole or monastrol and incubated with different ZM447439 concentrations. Each data point represents the FRET ratio for one cell normalized as described in Materials and Methods. (C) HeLa cells expressing the chromatin-targeted Aurora B sensor were arrested in mitosis with nocodazole and treated with either 0 or 1.5 µM ZM447439 for 100 min. Then, cells were imaged live and ZM447439 concentration was changed as indicated at t = 0. Results of a single experiment are plotted with each line representing an individual cell; 'low', 'intermediate' and 'high' correspond to ZM447439 concentrations 0, 0.6 and 1.5 µM, respectively. (D) Normalized steady-state sensor phosphorylation as a function of ZM447439 concentration. Each data point (mean ± SEM) is calculated from the average of final FRET ratios for cells imaged as in panel (C) (see Materials and methods). When the final FRET ratio is at a minimum (as in 0 µM inhibitor), the normalized sensor phosphorylation is maximal because phosphorylation decreases FRET in this biosensor. Data were averaged over two independent experiments, N>9 cells per condition in each experiment.
Figure 5—figure supplement 1
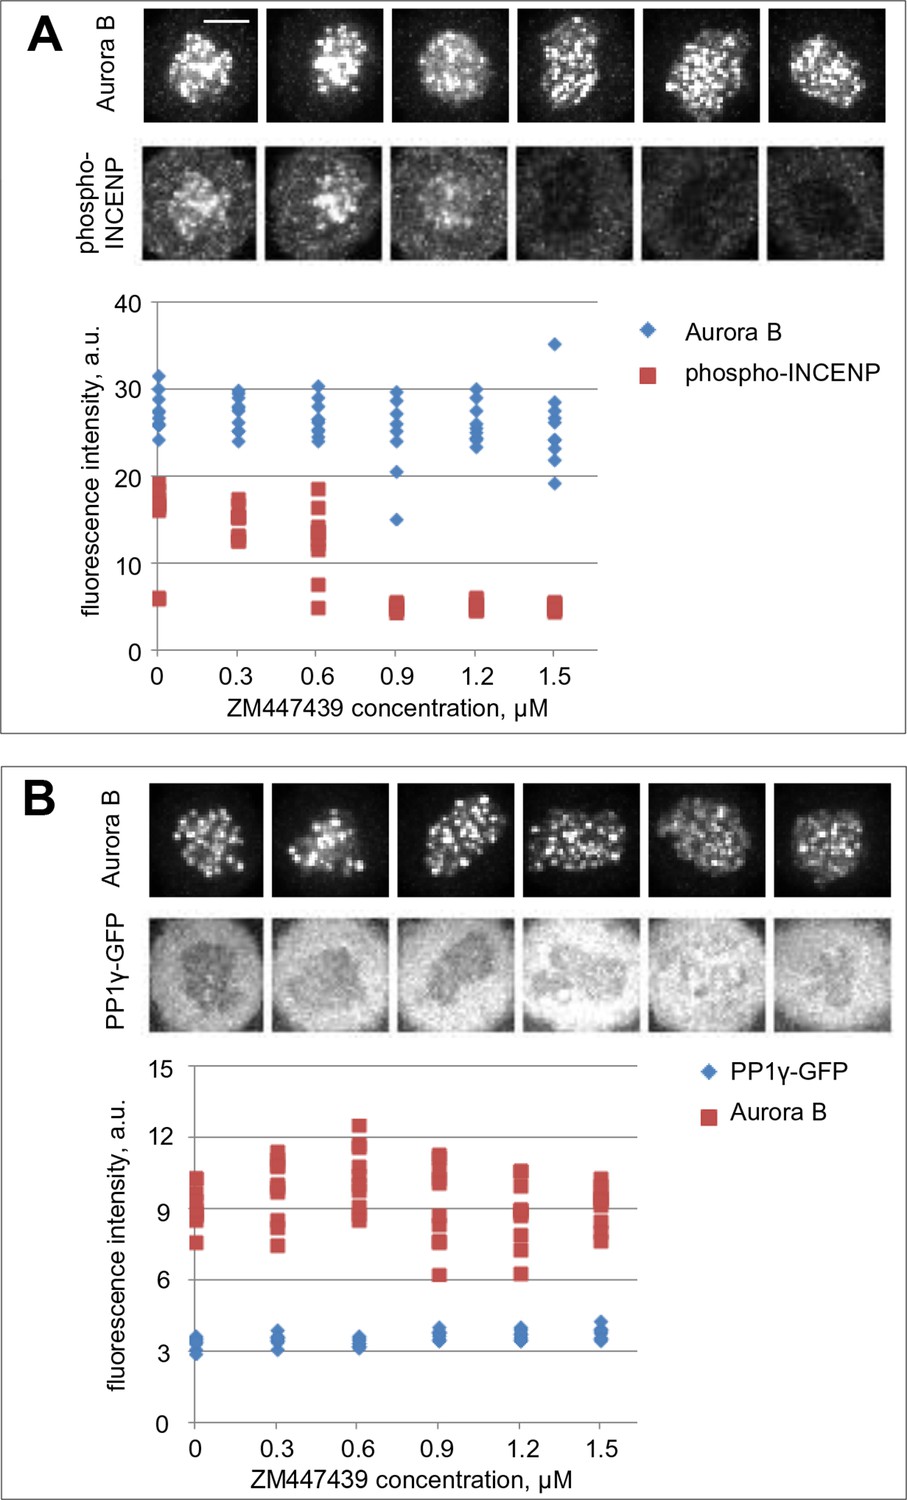
Aurora B and PP1γ localizations are not affected by Aurora B inhibition.
(A) Cells were incubated for 2 hr with nocodazole and the indicated concentrations of ZM447439 to mimic conditions of the in vivo bistability and hysteresis experiments (Figure 5B,C). Cells were then fixed and stained for Aurora B and phospho-INCENP. Intensity of the phospho-INCENP, but not Aurora B, signal decreases in response to adding the inhibitor in an abrupt manner, consistent with bistability of the Aurora B kinase activity, but not its localization. (B) Cells expressing PP1γ-GFP were treated as in (A) and stained for Aurora B.
Figure 6 with 1 supplement
Spatial model of Aurora B activity in the cell.
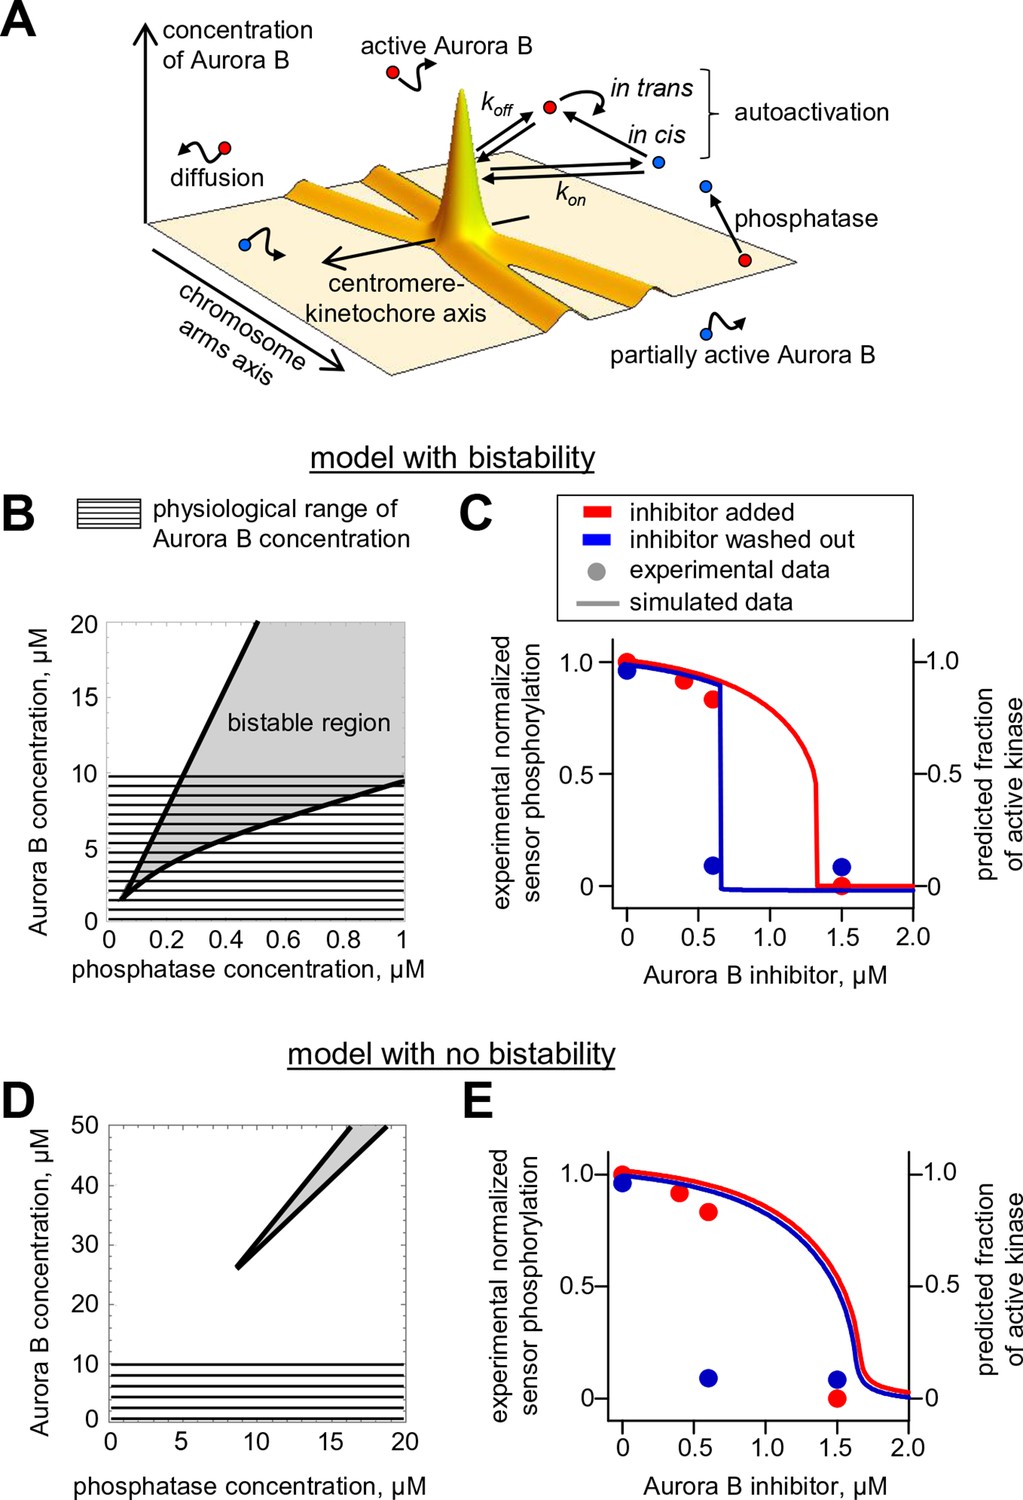
(A) Schematics of the essential features of our spatial model, see Materials and methods for details. (B) Parametric plane of phosphatase and total Aurora B kinase concentrations analogous to the plot in Figure 3C but calculated using the spatial model. Grey area shows region of bistability; KPM = 0.16 µM. (C) Simulated (right axis) and experimental (left axis) results for the hysteresis experiment in cells (data points reproduced from Figure 5D). Calculations are for KPM = 0.16 µM, phosphatase concentration 0.1 µM. (D,E) These plots are analogous to those in panels (B,C), but they were calculated for kcis = 7.3 · 10–4 s-1, all other model parameters were not changed. With this autoactivation constant, the model predicts no bistability in the physiological range of kinase concentrations (D), and, the kinase activity vs. inhibitor concentration curve does not depend on the system’s history (E), blue and red curves are slightly offset for clarity).
Figure 6—figure supplement 1
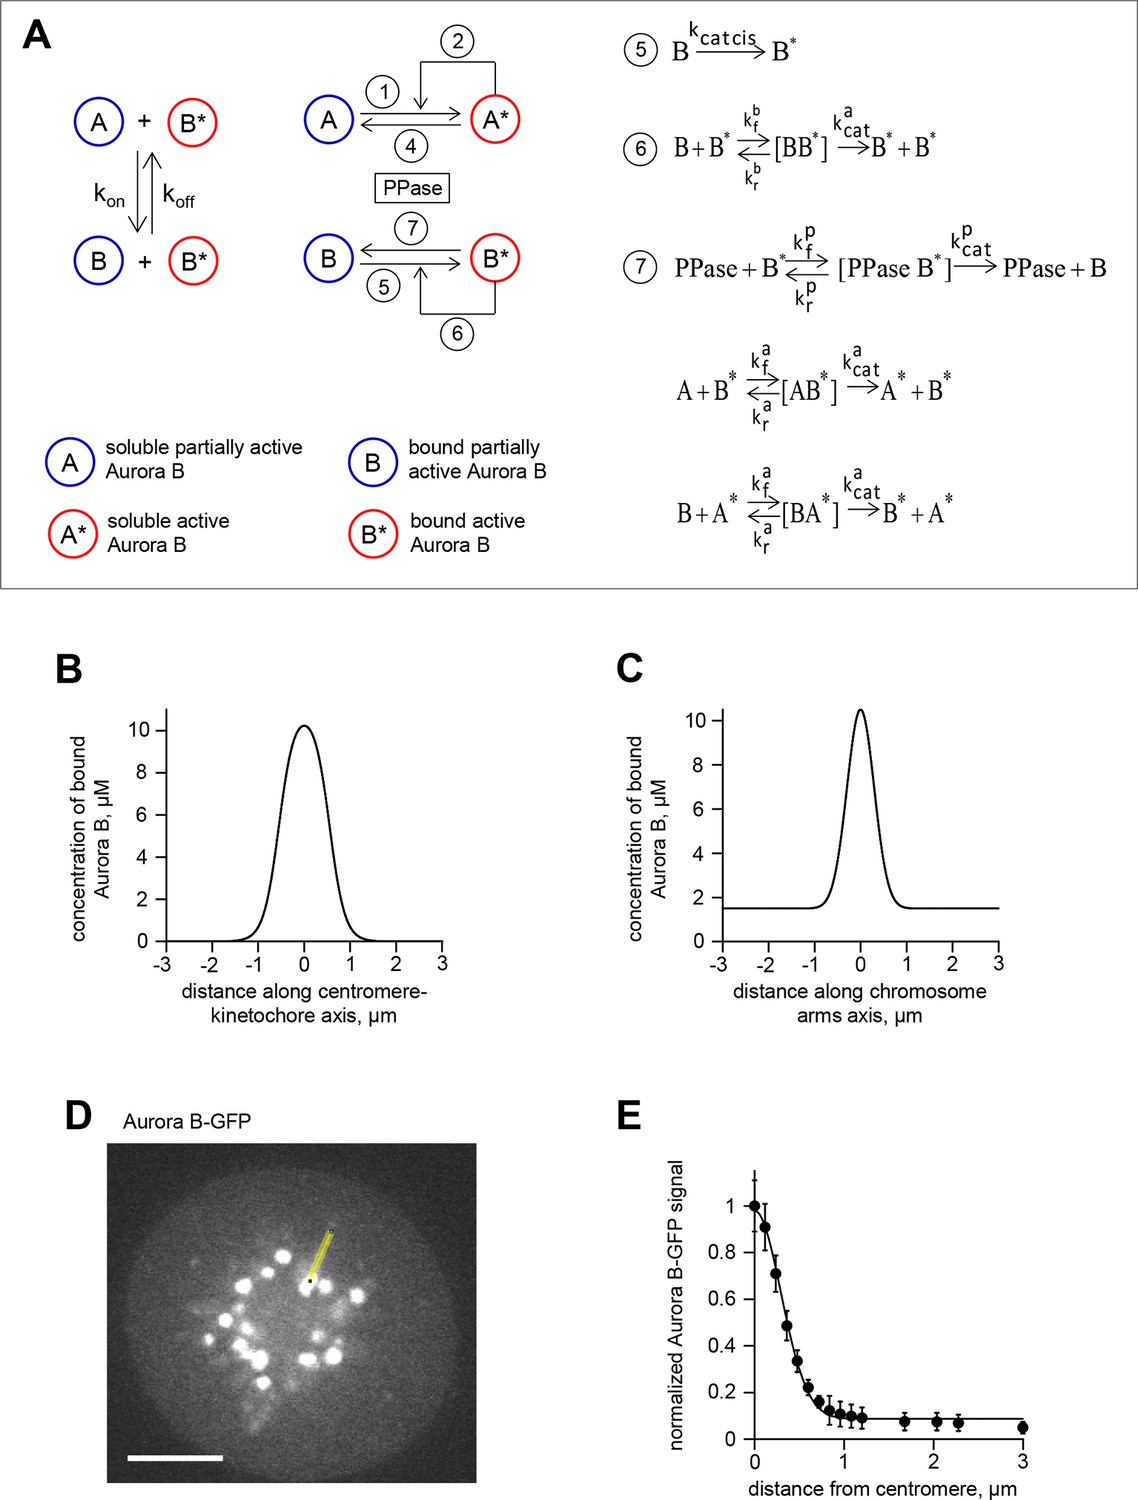
Theoretical model for spatial regulation of Aurora B kinase phosphorylation.
(A) Molecular and biochemical reactions in the spatial model of Aurora B kinase phosphorylation, see Table 1,2 and Materials and methods for details. (B) Estimated Aurora B kinase concentration profile along the axis connecting sister kinetochores. Origin corresponds to centroid, i.e., the midpoint between sister kinetochores. (C) Estimated Aurora B kinase concentration profile along the chromosome arm. Origin corresponds to centroid, i.e., the midpoint between sister kinetochores. (D) GFP image of a HeLa cell expressing GFP-Aurora B kinase and arrested with monastrol. Scale bar 5 µm. (E) GFP-Aurora B signal along chromosome arms averaged over N>16 chromosomes that were aligned at their centromere positions (distance = 0) and normalized to maximal Aurora B signal at centromeres; points are mean ± SEM.
Figure 7
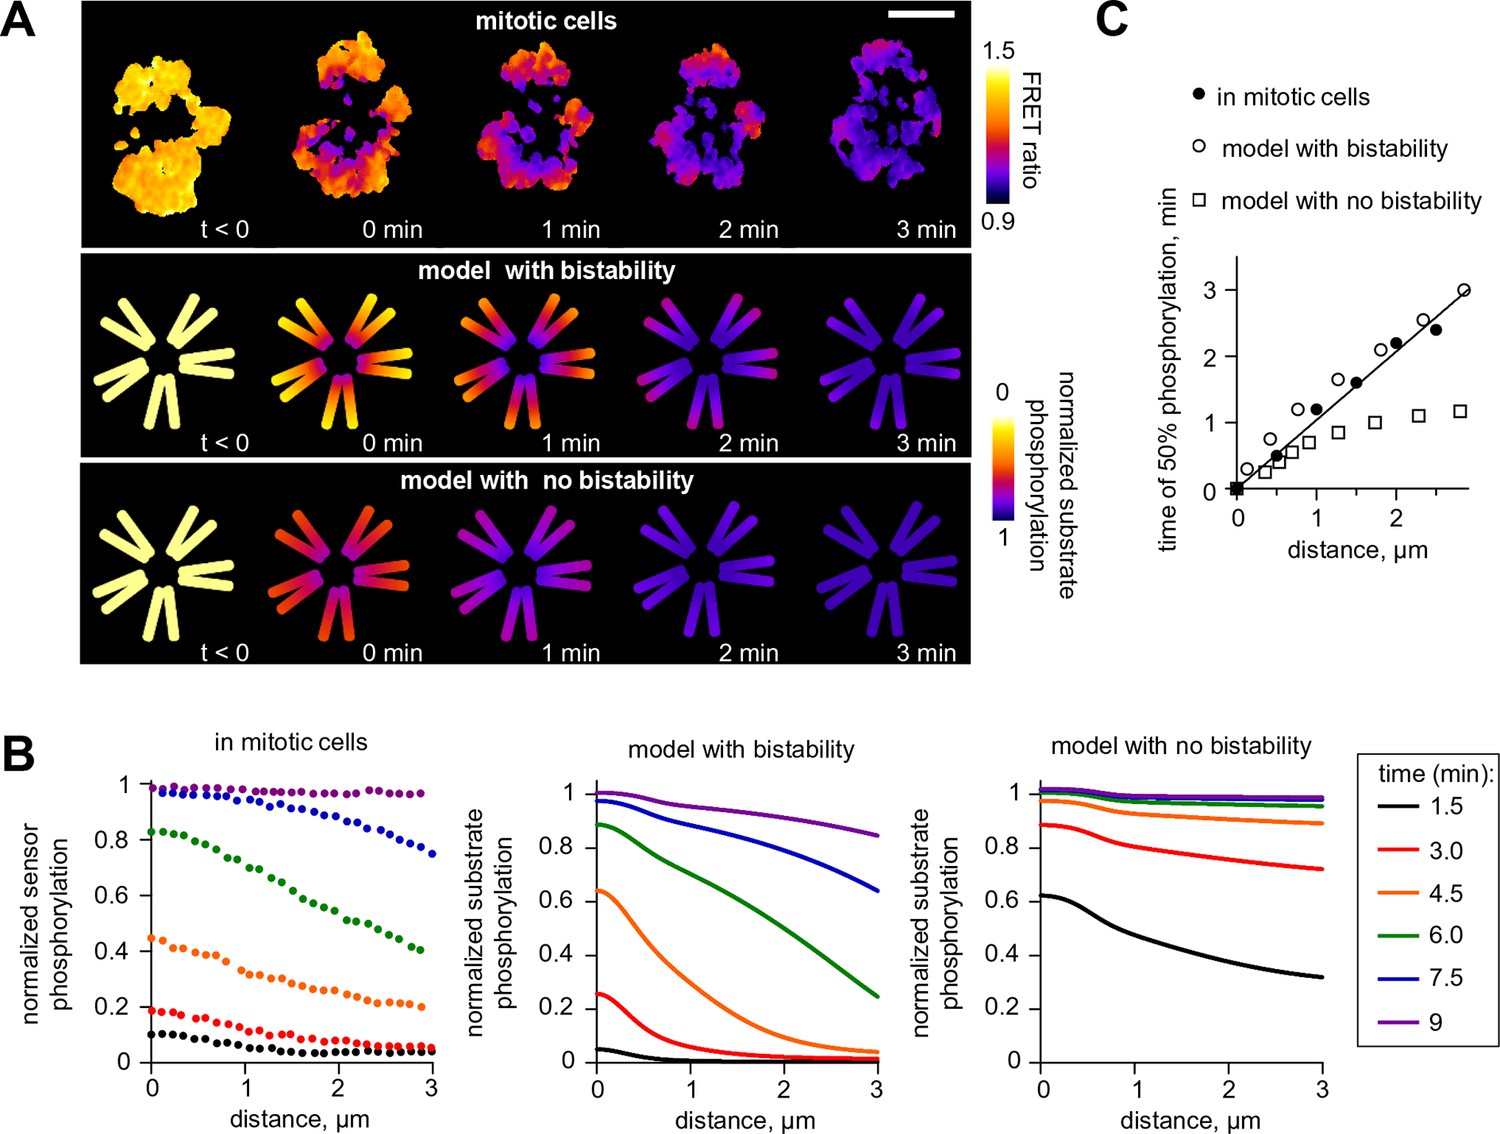
Wave propagation of Aurora B activity.
(A) Color-coded plots showing spatial patterns of Aurora B phosphorylation. Top row: HeLa cell expressing the chromatin-targeted FRET sensor and arrested with monastrol is shown before (t<0) and after Aurora B inhibitor washout. Time 0 min corresponds to FRET signal reaching half of its maximum level at the centromere. Lower FRET signal corresponds to higher sensor phosphorylation. Other two rows: color-coded substrate phosphorylation calculated in the models with and without bistability. Scale bar, 5 µm. (B) Profiles of average substrate phosphorylation along chromosome arms in cells observed at different time after inhibitor washout and analogous model predictions. Signals were normalized to maximum level of substrate phosphorylation. (C) Time of 50% sensor phosphorylation as a function of distance along chromosome arms. Closed symbols: experimental data with a linear fit. Open symbols correspond to model solutions with and without bistability.
Figure 8 with 1 supplement
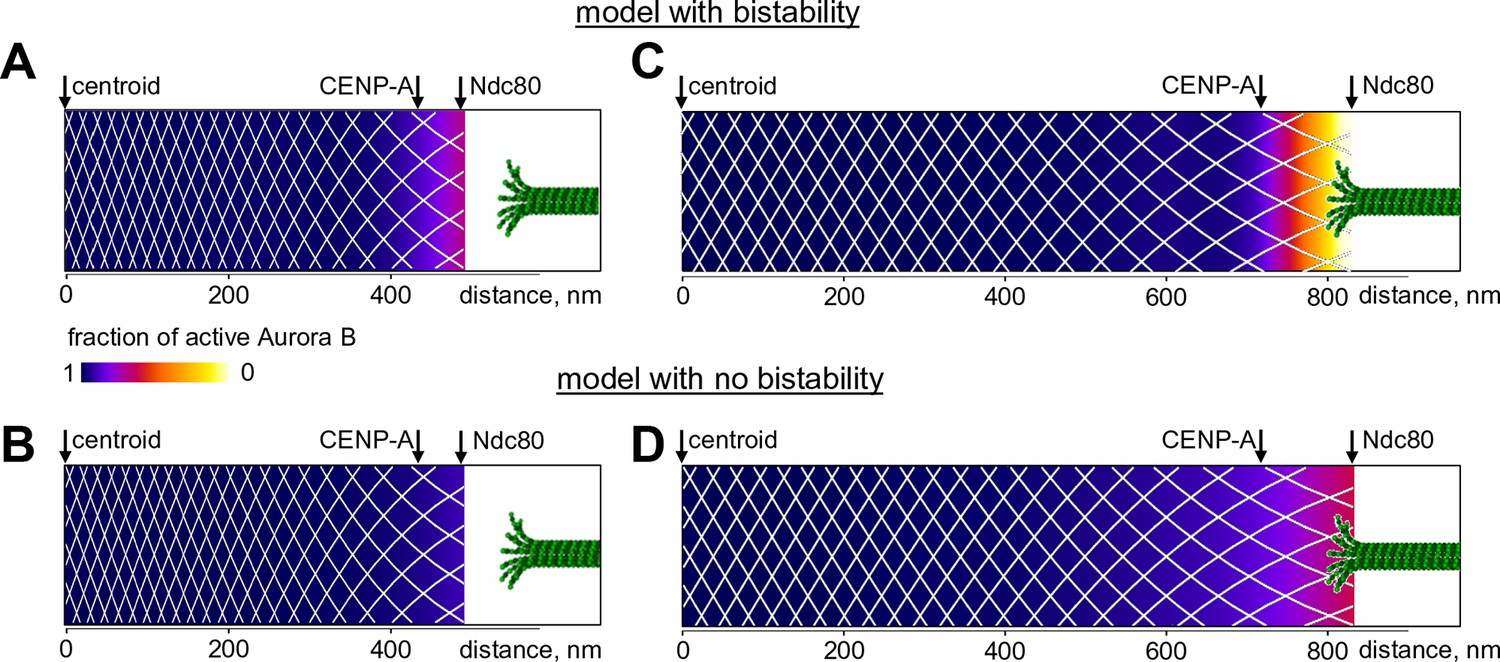
Predicted gradient of Aurora B kinase activity at kinetochores during prometaphase (left) and metaphase (right).
Color-coded plots of the profile of Aurora B kinase activity along the axis connecting the centromere centroid (midway between the sister kinetochores) and the outer kinetochore. Arrow for Ndc80 corresponds to the location of the N-terminus of Hec1 (Wan et al., 2009). Density of the white mesh indicates concentration of Aurora B kinase; local Aurora B concentration is lower when mesh holes are larger. (A) and (B) show model predictions for prometaphase kinetochores that are not under tension (smaller centroid to Ndc80 distance). In metaphase (C and D) this distance increases due to forces generated by the end-on attached kinetochore microtubules. In the model without bistability (B–D), the fraction of active Aurora B kinase simply reflects the total Aurora B kinase concentration.
Figure 8—figure supplement 1
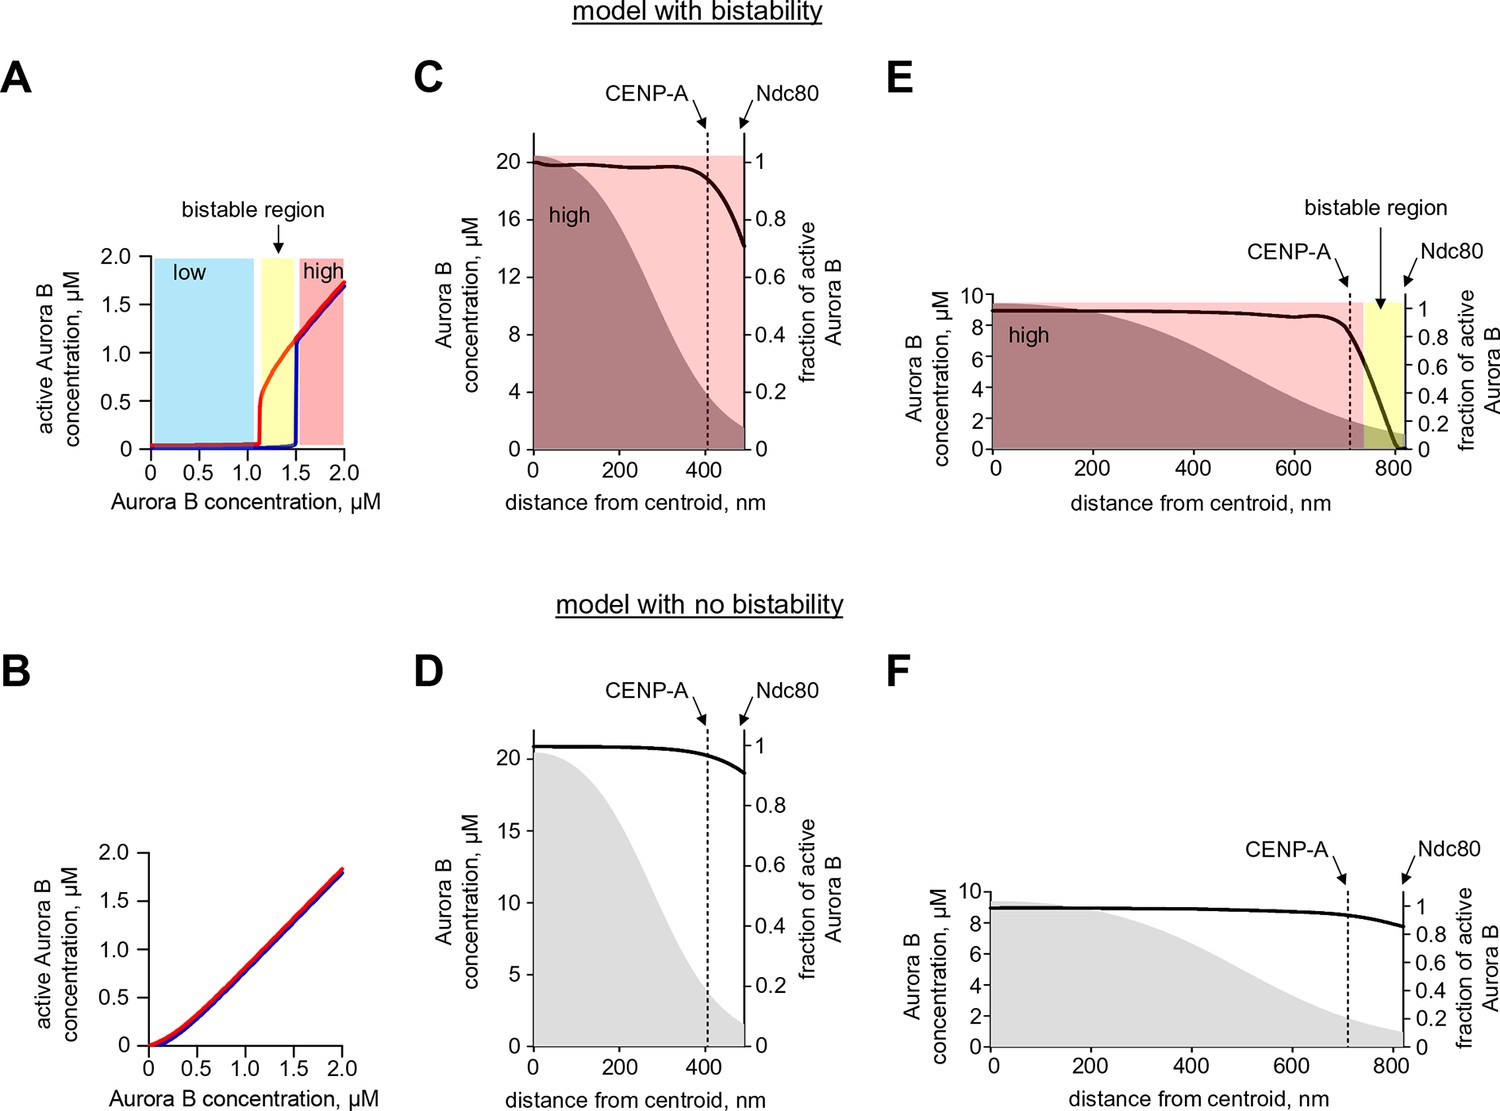
Quantification of Aurora B activity gradient during mitosis.
(A,B) Calculated concentration of active Aurora B as a function of total Aurora B concentration in the model with and without bistability. Red and blue curves correspond to the initially active and partially active Aurora B, correspondingly. In the model with bistability (A), Aurora B kinase remains largely inactive ('low' state) until total kinase concentration reaches ~1.2 µM. With higher kinase concentration, the active kinase increases roughly proportionally to the total concentration, but in the range of 1.2–1.5 µM both 'low' and 'high' activity states are possible (bistable region). In the model with no bistability (B), kinase activity increases roughly proportionally to total kinase concentration and the curves for different initial conditions overlap completely (shown with slight offset for better visualization). (C–F). Graphs show the calculated fraction of total Aurora B kinase that is active (black solid lines, right axes) as a function of distance along the centromere-kinetochore axis. Shown in grey (left axes) is estimated total concentration of Aurora B kinase. In the model with bistability (C,E), different concentration areas are colored as in panel (A), indicating predicted activity states. Graphs for the less stretched centromere (C,D) correspond to distances observed at the microtubule-free kinetochores in prometaphase. Since total Aurora B (grey areas) is constant during prometaphase and metaphase, centromere stretching (E,F) reduces Aurora B concentration everywhere, and bistability becomes possible at the outer kinetochore (E, yellow-colored area), where active Aurora B concentration drops below threshold. In the spatial region with bistability, a steep gradient of Aurora B activity can form.
Tables
Table 1
Glossary of symbols used in this work. Unless stated otherwise, symbols refer to concentrations of enzymes or enzyme-substrate complexes (µM).
| Symbol | Description |
|---|---|
| A | partially active Aurora B kinase |
| A* | active Aurora B kinase |
| PPase | phosphatase |
| [A*PPase] | enzyme-substrate complex for the phosphatase and active Aurora B kinase |
| [AA*] | enzyme-substrate complex for the active and partially active Aurora B kinase molecules |
| S | chemosensor (substrate) |
| P | phosphorylated chemosensor (product) |
| [SA*] | enzyme-substrate complex for the active Aurora B kinase and chemosensor |
Table 2
Enzyme kinetic constants used in this work. Values in brackets correspond to measurements with the custom made chemosensor.
| Symbol | Description | Value | Units | Source |
|---|---|---|---|---|
| catalytic rate constant for active Aurora B kinase towards chemosensor | 19 (19) | s-1 | Figure 2—figure supplement 2D | |
| catalytic efficiency of active Aurora B towards chemosensor | 6 × 10⁻² (3 × 10⁻¹) | s-1µM-1 | Figure 2—figure supplement 2E | |
| Michaelis constant of active Aurora B kinase towards chemosensor | 320 (55) | µM | this work | |
| rate constant for the formation of the enzyme-substrate complex of active Aurora B kinase and chemosensor | 50 | µM-1 s-1 | estimated based on Wassaf et al., 2006; Schreiber et al., 2009 | |
| rate constant for the formation of the enzyme-substrate complex of active and partially active Aurora B kinase molecules | 0.1 | µM-1 s-1 | estimated based on Schlosshauer and Baker, 2004; Schreiber et al., 2009 | |
| Michaelis constant of active Aurora B kinase towards partially active Aurora B kinase | 51 | µM | fitting (Figure 2A,D) | |
| catalytic rate constant for active Aurora B kinase towards the partially active Aurora B kinase | 2.7 × 10⁻² | s-1 | fitting (Figure 2A,D) | |
| rate constant for Aurora B kinase activation by cis mechanism | 7.29 × 10⁻⁶ | s-1 | fitting (Figure 2A,D) | |
| rate constant for the formation of the enzyme-substrate complex of λ protein phosphatase and active Aurora B kinase | 0.6 | µM-1 s-1 | estimated based on Schlosshauer and Baker, 2004; Schreiber et al., 2009 | |
| Michaelis constant of the λ protein phosphatase towards active Aurora B kinase | 1.95 | µM | Figure 4C | |
| catalytic rate constant for λ protein phosphatase towards active Aurora B kinase | 2.4 × 10⁻² | s-1 | Figure 4C |
Table 3
Aurora B autoactivation model with two phosphorylation sites. Fitted values were obtained using unconstrained fitting, limiting case values correspond to the model in which Aurora B kinase with one phosphosite is converted rapidly into the fully phosphorylated Aurora B form.
| Reaction | Rate constants | Fitted values (µM-1 s-1; s-1; s-1) | Limiting case values (µM-1 s-1; s-1; s-1) |
|---|---|---|---|
| A → A# | 6.0 × 10⁻⁵ | 7.29 × 10⁻⁶ | |
| A+A# ⇄ [AA#] → A+A# | ; ; | 0.1; 10; 1.1 × 10⁻² | 0.1; 5.1; 3.9 × 10⁻³ |
| A#+A# ⇄ [A#A#] → A##+A# | ; ; | 0.1; 10; 1.1 × 10⁻² | 50; 5.1; 1.95 |
| A+A## ⇄ [AA##] → A#+A## | ; ; | 0.1; 9.8; 8.0 × 10⁻² | 0.1; 5.1; 2.7 × 10⁻² |
| A#+A## ⇄ [A#A##] → A##+A## | ; ; | 0.1; 9.8; 8.0 × 10⁻² | 0.1; 5.1; 2.7 × 10⁻² |
| S+A# ⇄ [SA#] → P+A# | ; ; | 50; 1.6 × 10⁴; 4.7 | 50; 1.6 × 10⁴; 4.7 |
| S+A## ⇄ [SA##] → P+A## | ; ; | 50; 1.6 × 10⁴; 19 | 50; 1.6 × 10⁴; 19 |
Download links
A two-part list of links to download the article, or parts of the article, in various formats.
Downloads (link to download the article as PDF)
Open citations (links to open the citations from this article in various online reference manager services)
Cite this article (links to download the citations from this article in formats compatible with various reference manager tools)
Bistability of a coupled Aurora B kinase-phosphatase system in cell division
eLife 5:e10644.
https://doi.org/10.7554/eLife.10644


