A novel SUN1-ALLAN complex coordinates segregation of the bipartite MTOC across the nuclear envelope during rapid closed mitosis in Plasmodium berghei
- University of Nottingham, School of Life Sciences, United Kingdom
- Oxford Brookes University, Department of Biological and Medical Sciences, United Kingdom
- Department of Molecular, Cell and Systems Biology, University of California, Riverside, United States
- Apicolipid Team, Institute for Advanced Biosciences, CNRS UMR5309, Université Grenoble Alpes, France
- School of Life Sciences, Gibbet Hill Campus, University of Warwick, United Kingdom
- Malaria Parasitology Laboratory, The Francis Crick Institute, United Kingdom
- Cell Biochemistry, Groningen Biomolecular Sciences and Biotechnology Institute, Faculty of Science and Engineering, University of Groningen, Netherlands
Figures
Figure 1
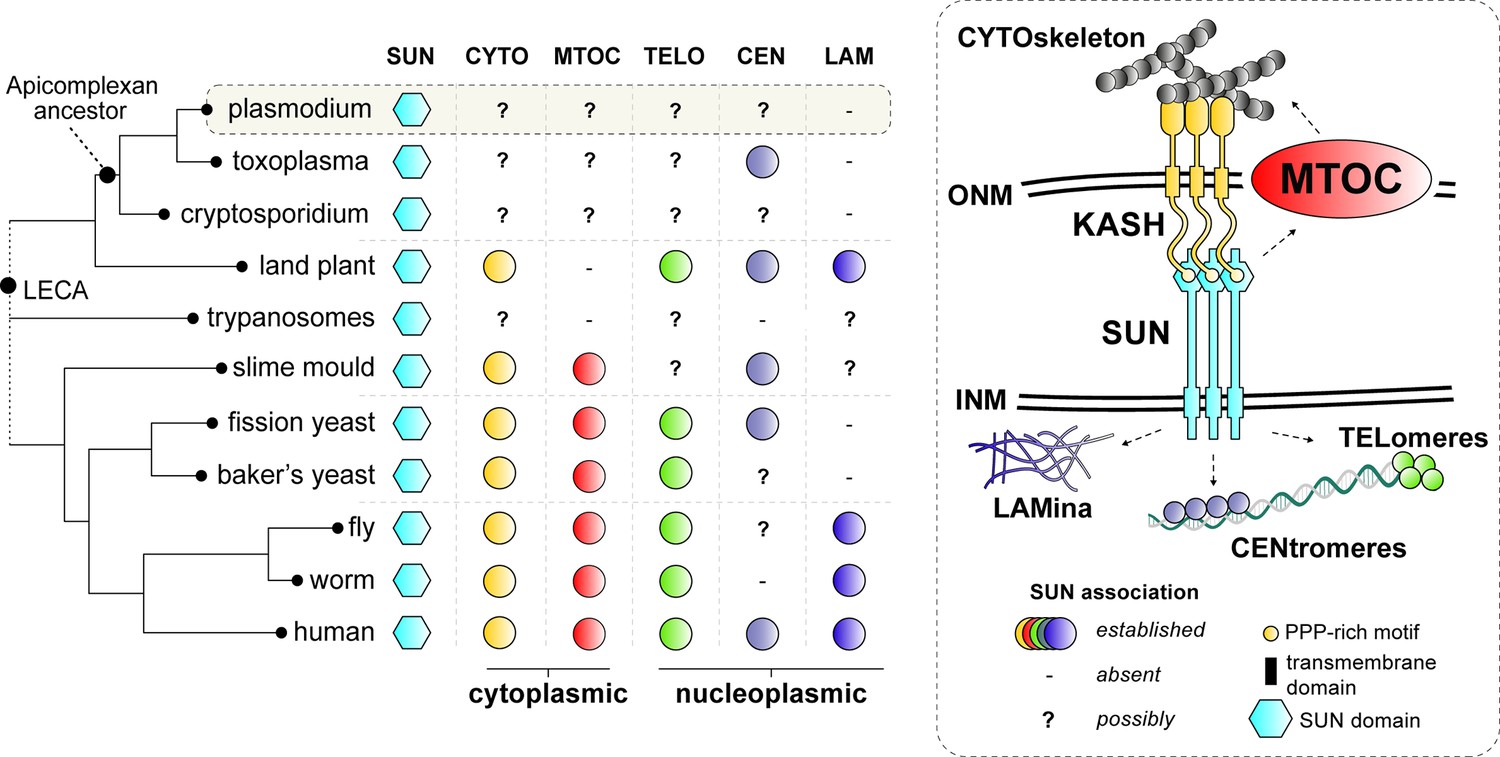
Comparative analysis of SUN protein functions in common eukaryotic model systems.
SUN proteins bridge the outer (ONM) and inner (INM) membranes of the nuclear envelope (NE) to link the cytoskeleton (i.e. actin, microtubules and its organising centres) to various heterochromatic domains (i.e. centromere, telomeres) and the nuclear lamina (five different functions with a unique colour). Established roles of SUN proteins in common model organisms are depicted by coloured circles. ‘-‘ no functional connection for SUN was found and/or structures are not present. ‘?’ denotes possible roles for SUN proteins as NE connections with such structures have been established in these lineages. LECA: Last Eukayotic Common Ancestor.
Figure 2 with 4 supplements

Location of SUN1 during male gametogenesis.
(A) The upper panel schematic illustrates the process of male gametogenesis. N, genome ploidy. Live cell images show the location of SUN1-GFP (green) at different time points (1–8 min) during male gametogenesis. DNA (blue) was stained with Hoechst. White arrows indicate the loop/folds. Representative images of more than 50 cells with more than three biological replicates. Scale bar: 5 μm. (B) Serial block face-scanning electron microscopy (SBF-SEM) data slice of a gametocyte highlighting the complex morphology of the nucleus (cyan). Representative of more than 10 cells. Scale bar: 1 μm. (C) Two 3D models of gametocyte nuclei showing their contorted and irregular morphology. Representative of more than 10 cells. Scale bar: 1 μm. (D) SIM images of SUN1-GFP male gametocytes activated for 8 min and fixed with paraformaldehyde. Arrows indicate the SUN1-GFP signals with high intensity after fixation. Representative image of more than 10 cells from more than two biological replicates. Scale: 1 µm. (E) SIM images of SUN1-GFP male gametocytes activated for 8 min and fixed with methanol. Arrows indicate the SUN1-GFP signals with high intensity after fixation. Representative image of more than 10 cells from more than two biological replicates. Scale bar: 1 µm. (F) Expansion microscopy (ExM) images showing location of SUN1 (green) detected with anti-GFP antibody and BB/MTOC stained with NHS ester (grey). Hoechst was used to stain DNA. Scale bar: 5 µm. Inset is the area marked with the red box around the BB/MTOC highlighted by NHS-ester staining. Scale bar: 1 µm. Representative images of more than 10 cells from two biological replicates. (G) ExM images showing location of SUN1 (green) and α- tubulin (magenta) detected with anti-GFP and anti-tubulin antibodies, respectively. Hoechst was used to stain DNA (blue). N=Nucleus; S=Spindle; A=Axoneme. Scale bar: 5 µm. Inset is the area marked with the white box on Figure 1E middle panel around the BB/MTOC. Scale bar: 1 µm. Representative images of more than 10 cells from two biological replicates. (H) Live cell imaging showing location of SUN1-GFP (green) in relation to the BB and axoneme marker, kinesin-8B-mCherry (magenta) at different time points (1–5 min) during gametogenesis. Blue in merged image is DNA stained with Hoechst. Representative images of more than 20 cells from more than three biological replicates. White arrows indicate the loops/folds labelled with SUN1 where BB/axonemes are assembled outside the nuclear membrane. Scale bar: 5 µm. (I) Live cell imaging showing location of SUN1-GFP (green) in relation to the spindle marker, EB1-mCherry (magenta) at different time points during gametogenesis. Blue in merged image is DNA stained with Hoechst. White arrows indicate the loops/folds labelled with SUN1. Representative images of more than 20 cells from more than three biological replicates. Scale bar: 5 µm. (J) Live cell imaging showing location of SUN1-GFP (green) in relation to the kinetochore marker, NDC80-mCherry (magenta) at different time points during gametogenesis. Blue in merged image is DNA stained with Hoechst. White arrows indicate the loops/folds labelled with SUN1. Representative images of more than 20 cells with more than three biological replicates. Scale bar: 5 µm.
Figure 2—figure supplement 1
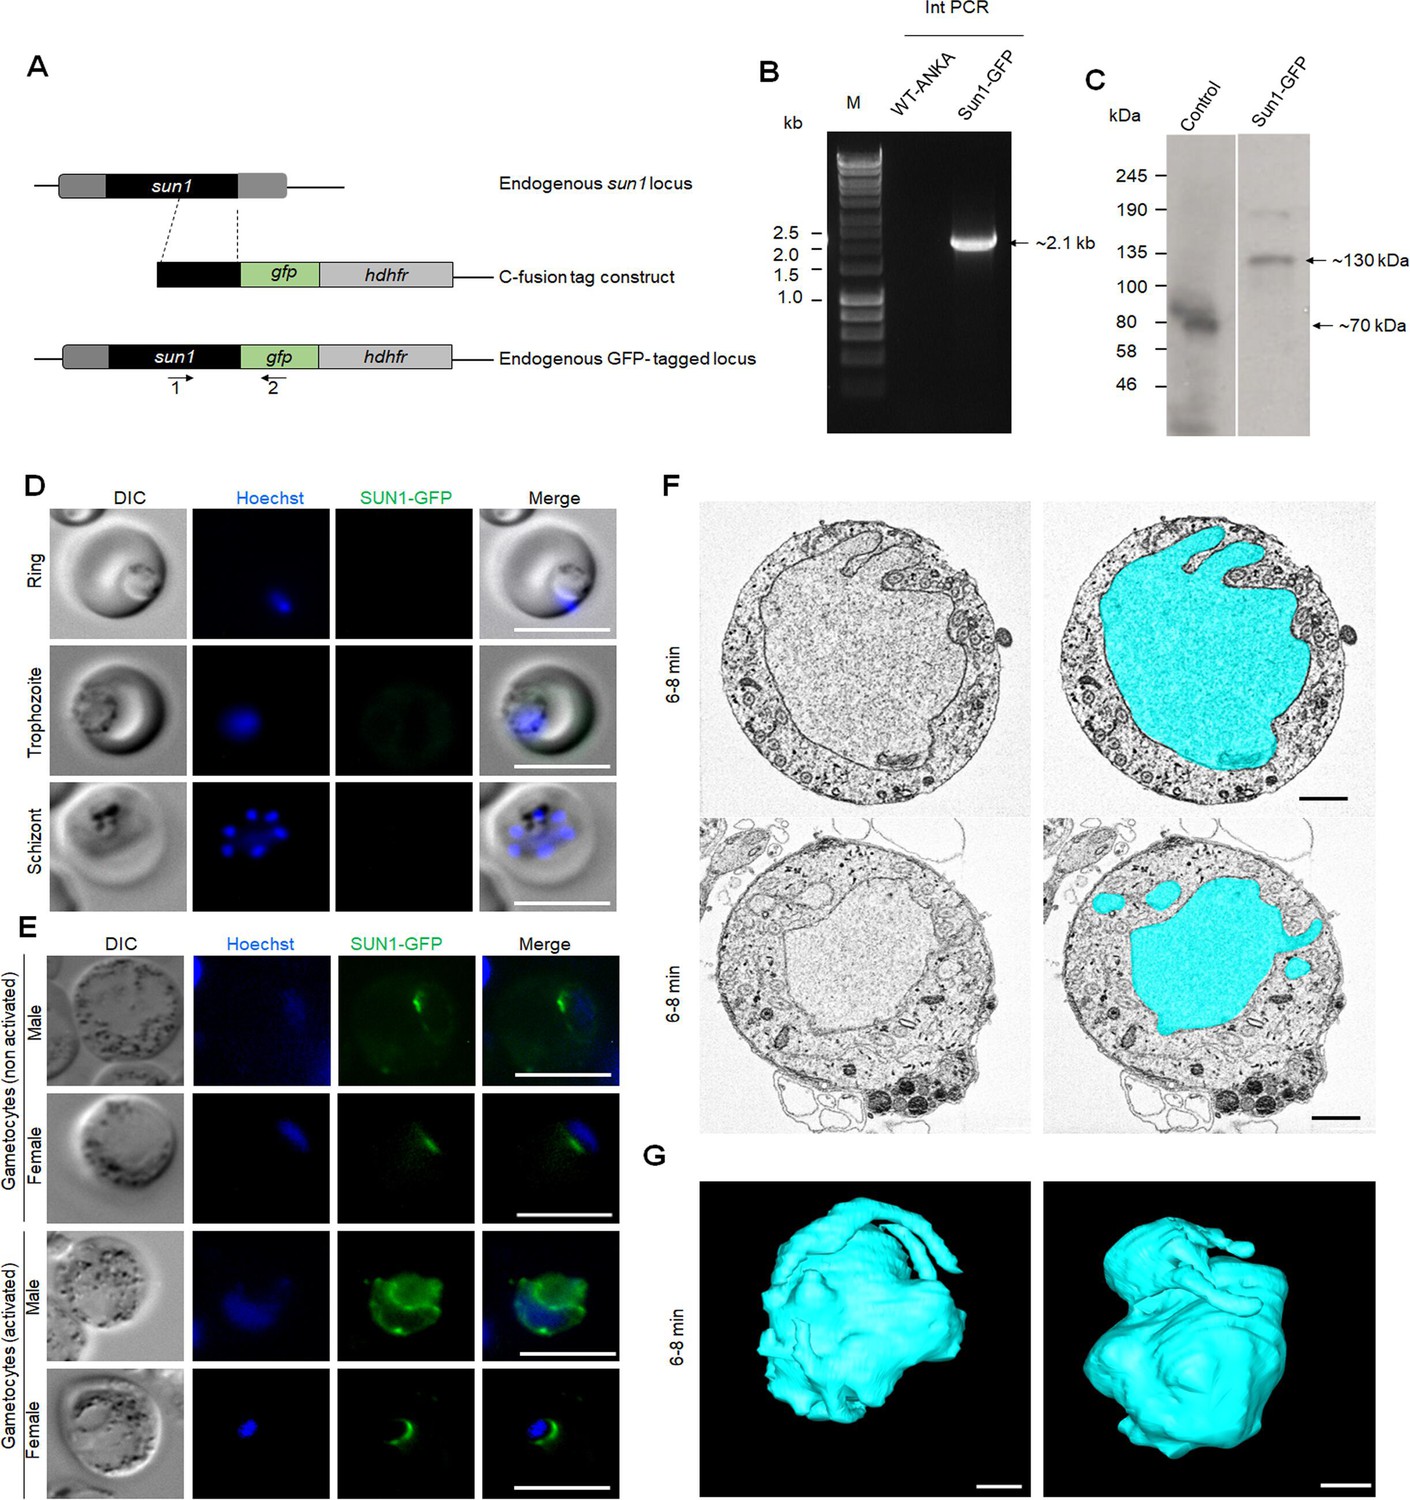
Generation of PbSUN1-GFP/ parasites and analysis of subcellular location of SUN1-GFP during blood schizogony and gametogenesis.
(A) Schematic representation of the endogenous sun1 locus, the GFP- and mCherry-tagging construct, and the recombined sun1 locus following single homologous recombination. Arrows 1 and 2 indicate the position of PCR primers used to confirm successful integration of the construct. (B) Diagnostic PCR of sun1-GFP and WT parasites using primers: integration primer (1) and ol492 (2). The band of expected size for amplified DNA fragment is indicated with an arrow. (C) Western blot showing expected size of SUN1-GFP fusion protein using anti-GFP antibody. The bands of expected size for the control and Sun1-GFP are indicated with arrows. (D) Live cell images of SUN1-GFP during blood schizogony showing no detectable expression. DNA is stained with Hoechst dye (blue). Representative images of more than 50 cells with more than three biological replicates. Scale bar: 5 μm. (E) Live cell images of SUN1-GFP in male and female gametocytes before and after activation. DNA is stained with Hoechst dye (blue). Representative images of more than 50 cells with more than three biological replicates. Scale bar: 5 μm. (F) Serial block-face scanning electron microscopy (SBF-SEM) data slices of a gametocyte highlighting the complex structure of the nucleus (cyan). Scale bar: 1μm. (G) Two 3D models of gametocyte nuclei showing a contorted and irregular morphology. Scale bar: 1μm. I. Structured illumination microscopy (SIM) images of SUN1-GFP male gametocytes activated for different times and fixed with paraformaldehyde. Representative images of more than 10 cells with more than two biological replicates. Scale bar: 1 μm.
-
Figure 2—figure supplement 1—source data 1
Tiff file of the original gel for Figure 2—figure supplement 1B, indicating the relevant band.
- https://cdn.elifesciences.org/articles/106537/elife-106537-fig2-figsupp1-data1-v1.zip
-
Figure 2—figure supplement 1—source data 2
Tiff file of the original gel for Figure 2—figure supplement 1B.
- https://cdn.elifesciences.org/articles/106537/elife-106537-fig2-figsupp1-data2-v1.zip
-
Figure 2—figure supplement 1—source data 3
Tiff file of the original gel for Figure 2—figure supplement 1C, indicating the relevant band.
- https://cdn.elifesciences.org/articles/106537/elife-106537-fig2-figsupp1-data3-v1.zip
-
Figure 2—figure supplement 1—source data 4
Tiff file of the original gel for Figure 2—figure supplement 1C.
- https://cdn.elifesciences.org/articles/106537/elife-106537-fig2-figsupp1-data4-v1.zip
Figure 2—figure supplement 2
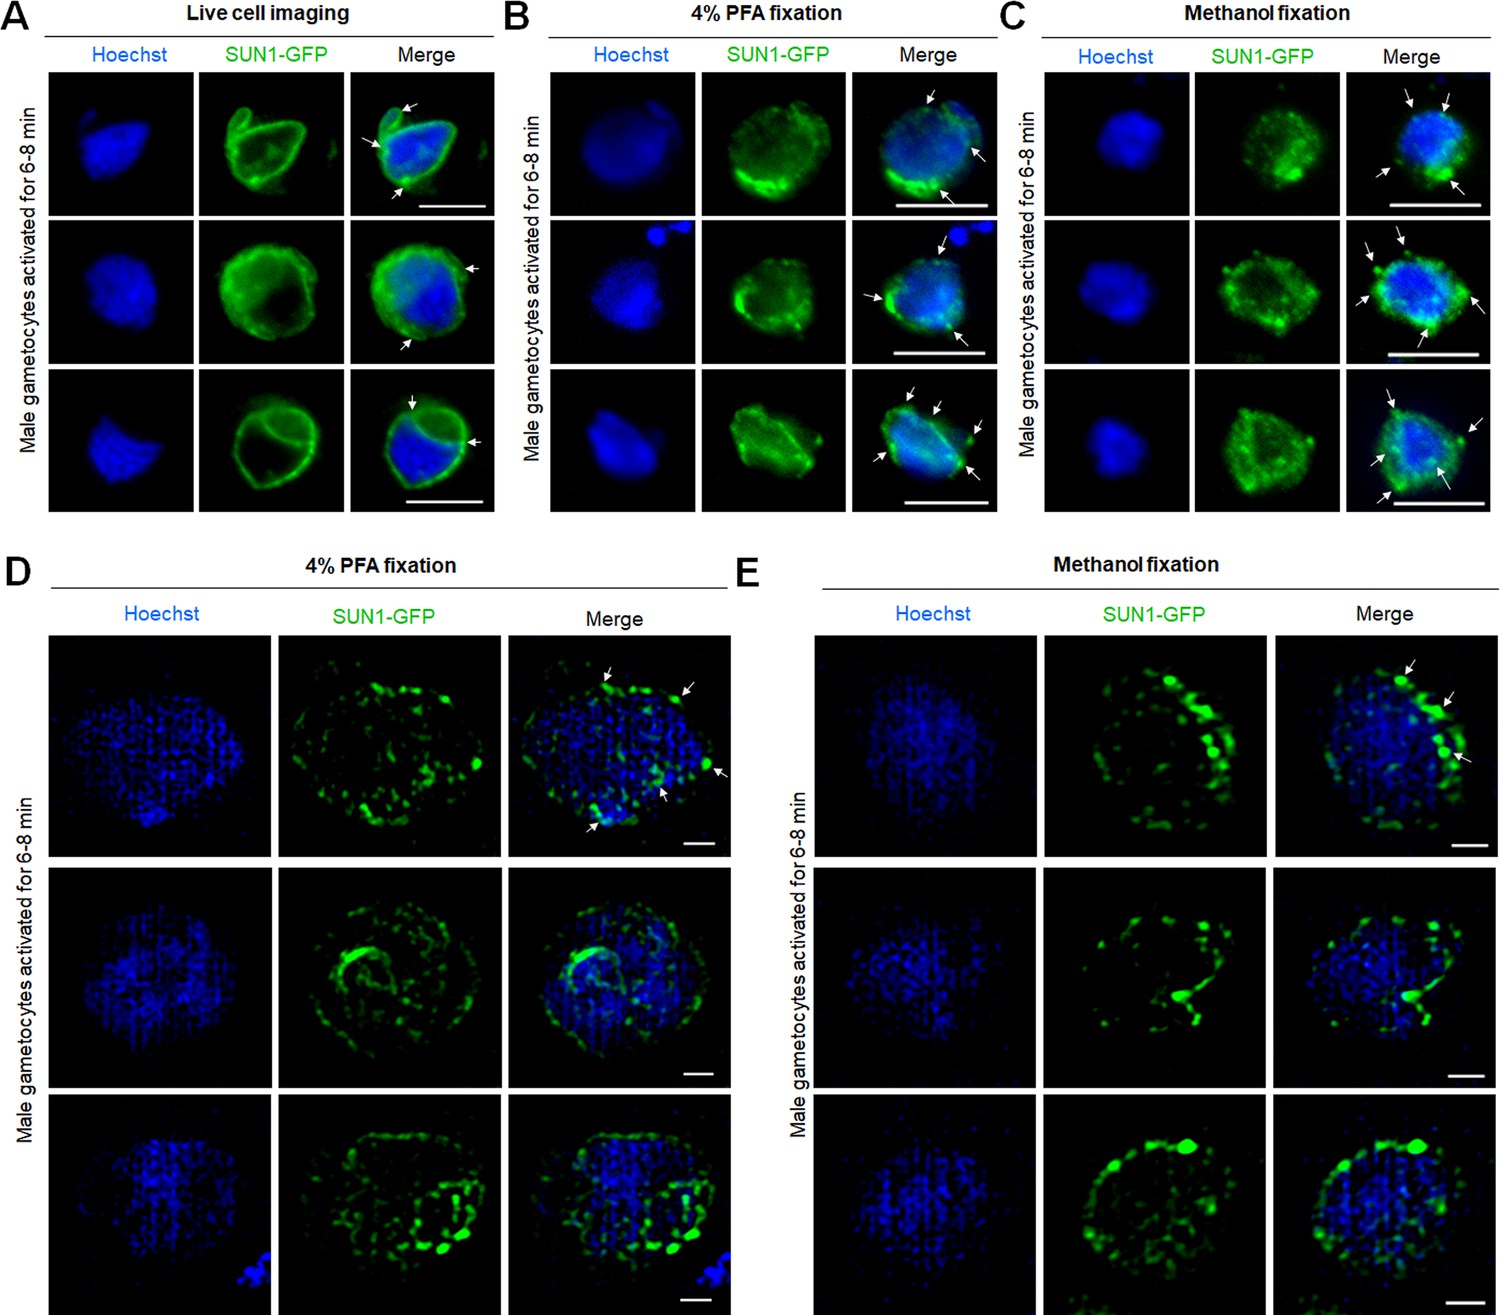
Localisation of SUN1-GFP in live and fixed male gametocytes.
(A) Widefield micrographs showing the location of SUN1-GFP (green) before fixation (live cells) in gametocytes at 8 min post activation. DNA was stained with Hoechst. White arrows indicate the loops/folds. Representative images of more than 30 cells with more than three biological replicates. Scale bar: 5 μm. (B, C) Widefield micrographs showing the location of SUN1-GFP (green) after fixation with paraformaldehyde (B) and methanol (C) in gametocytes at 8 min post activation. DNA was stained with Hoechst. White arrows indicate the SUN1-GFP puncta. Representative images of more than 30 cells with more than three biological replicates. Scale bar: 5 μm. (D, E) SIM images of SUN1-GFP male gametocytes activated for 8 min and fixed with paraformaldehyde (D) and methanol (E). Representative images of more than 10 cells with more than two biological replicates. Scale bar: 1 μm.
Figure 2—figure supplement 3
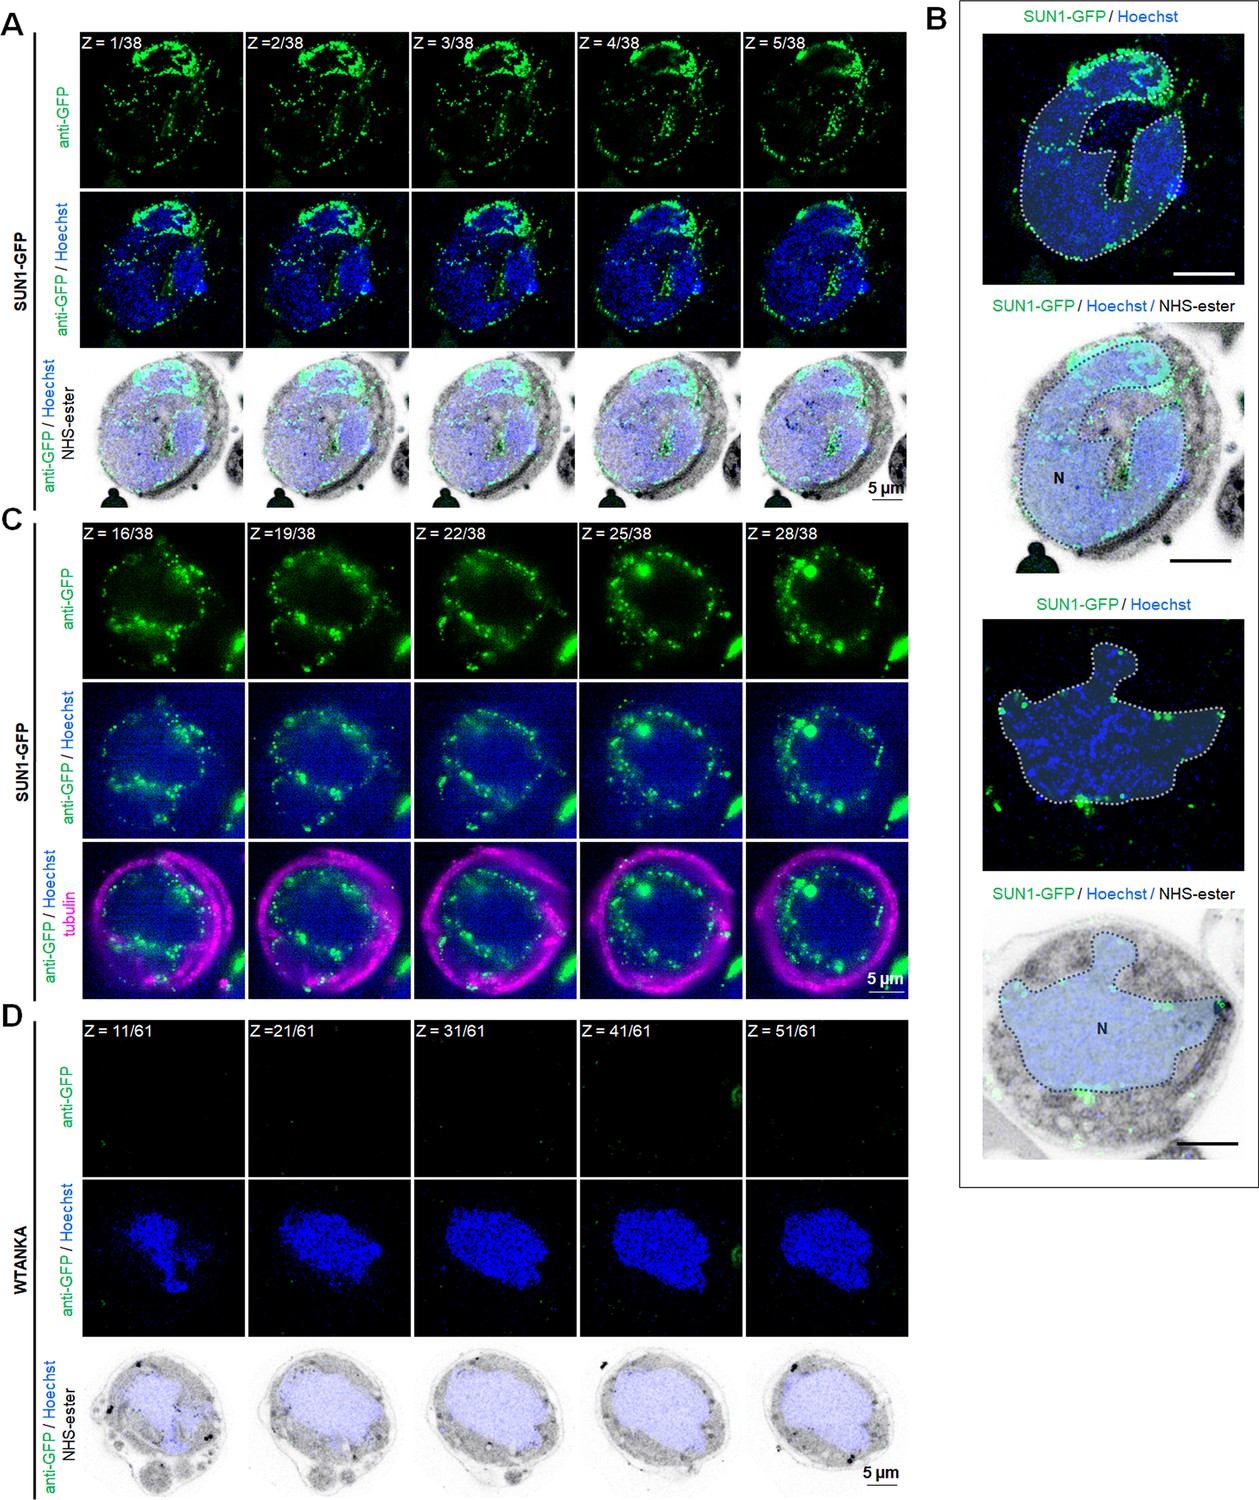
Expansion microscopy (ExM) reveals the SUN1-GFP location along with nuclear envelope (NE) and showing puncta at nuclear microtubule-organising centre (MTOC).
(A) ExM images in different Z-stacks showing location of SUN1 (green) detected with anti-GFP antibody and basal bodies (BB)/MTOC stained with NHS ester (grey) in SUN1-GFP gametocytes activated for 8 min. Hoechst was used to stain DNA. Scale bar: 5 µm. (B) ExM images showing NE traces according to NHS-ester signal showing alignment with GFP signal in SUN1-GFP gametocytes activated for 8 min. Scale bar: 5 µm. (C) ExM images in different Z-stacks showing location of SUN1 (green) and α-tubulin (magenta) detected with anti-GFP and anti-tubulin antibodies, respectively in SUN1-GFP gametocytes activated for 8 min. Hoechst was used to stain DNA. N=Nucleus; S=Spindle; A=Axoneme. Scale bar: 5 µm. (D) ExM images in different Z-stacks showing no signal using anti-GFP with WT-ANKA gametocytes activated for 8 min. Hoechst was used to stain DNA. Scale bar: 5 µm.
Figure 2—figure supplement 4
Localisation of SUN1-GFP during various stages of parasite development.
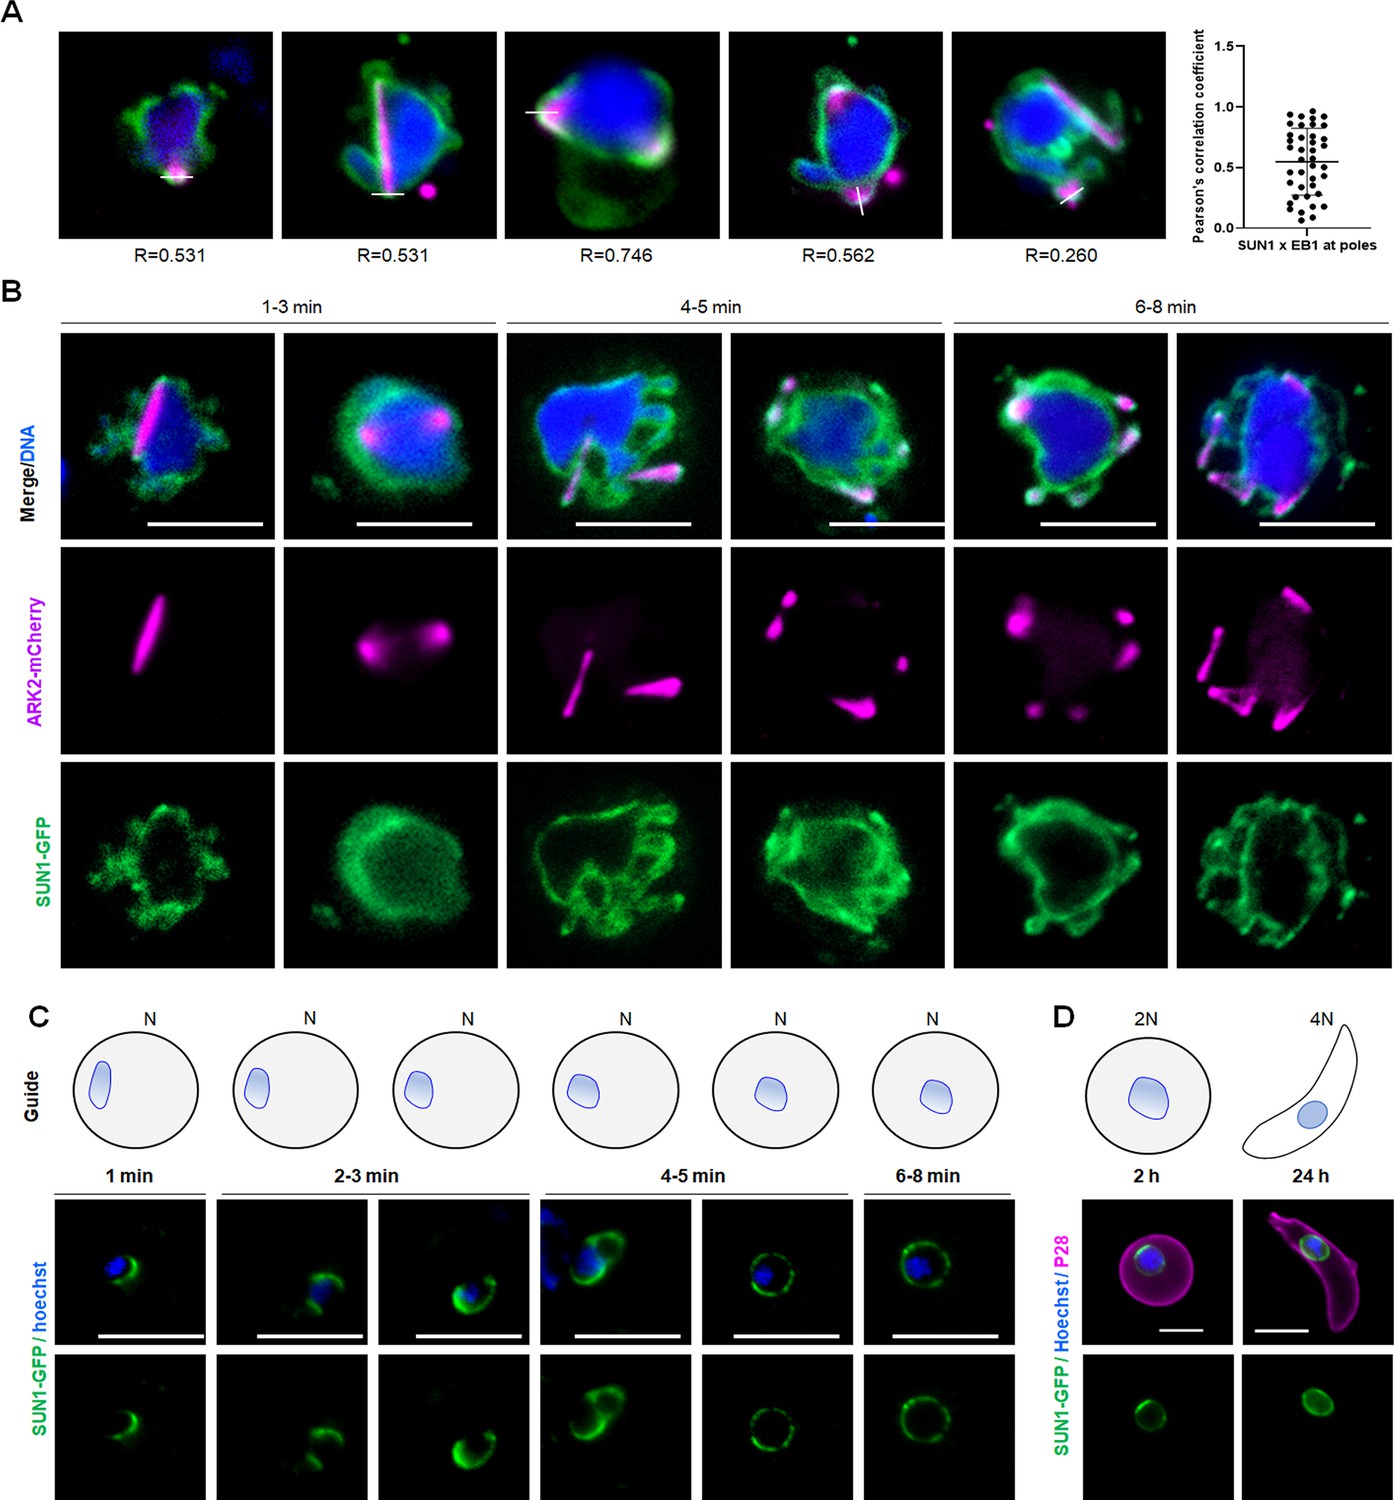
(A) Representative images with an overlap analysis of SUN1 and EB1 at spindle poles (Left). More than 30 cells were scored for the overlap analysis in three different experiments (right). Scale bar: 5 µm. (B) Live cell imaging showing location of SUN1-GFP (green) in relation to the spindle marker, ARK2-mCherry (magenta) at different time points during male gametogenesis. DNA is stained with Hoechst dye (blue). Representative images of more than 20 cells with more than three biological replicates. Scale bar: 5 µm. (C) Live cell imaging showing location of SUN1-GFP (green) at different time points during female gametogenesis. DNA is stained with Hoechst dye (blue). Representative images of more than 20 cells with more than three biological replicates. Scale bar: 5 µm. (D) Live cell images showing location of SUN1-GFP (green) in zygote and ookinete stages. A cy3-conjugated antibody, 13.1, recognising the P28 protein on the surface of zygotes and ookinetes, was used to label these stages (magenta). DNA is stained with Hoechst dye (blue). Representative images of more than 20 cells with more than three biological replicates. Scale bar: 5 µm.
Figure 3 with 2 supplements
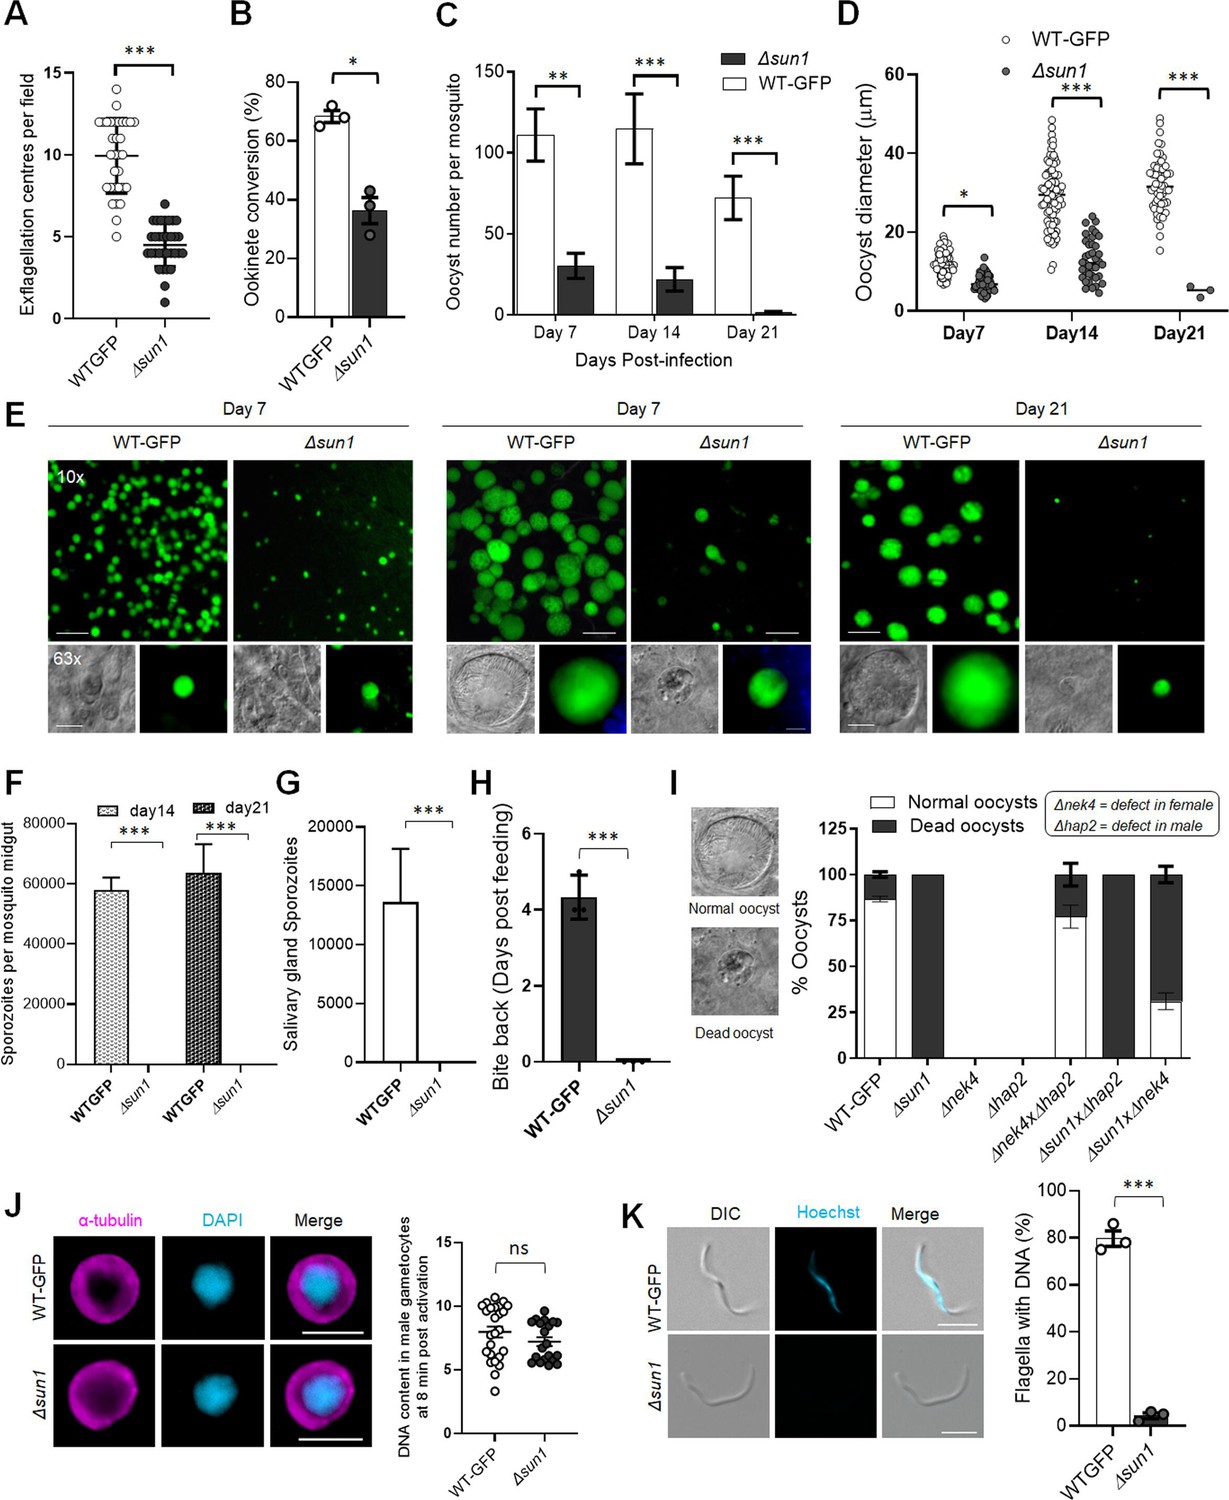
Deletion of sun1 affects male gamete formation and blocks parasite transmission.
(A) Exflagellation centres per field at 15 min post-activation. n=3 independent experiments (>10 fields per experiment). Error bar ± SEM. (B) Percentage ookinete conversion from zygote. n=3 independent experiments (>100 cells). Error bar ± SEM. (C) Total number of GFP-positive oocysts per infected mosquito in Δsun1 compared to WT-GFP parasites at 7-, 14-, and 21 d post-infection. Mean ± SEM. n=3 independent experiments. (D) The diameter of GFP-positive oocysts in Δsun1 compared to WT-GFP parasites at 7-, 14-, and 21 d post-infection. Mean ± SEM. n=3 independent experiments. The same WT-GFP data was used to analyse the Δallan mentioned in Figure 7—figure supplement 1D. (E) Mid guts at 10 x and 63 x magnification showing oocysts of Δsun1 and WT-GFP lines at 7-, 14-, and 21 d post-infection. Scale bar: 50 μm in 10 x and 20 μm in 63 x. (F) Total number of midguts sporozoites per infected mosquito in Δsun1 compared to WT-GFP parasites at 14- and 21 d post-infection. Mean ± SEM. n=3 independent experiments. (G) Total number of salivary gland sporozoites per infected mosquito in Δsun1 compared to WT-GFP parasites at 21 d post-infection. Mean ± SEM. n=3 independent experiments. (H) Bite back experiments showing no transmission of Δsun1, while WT-GFP parasites show successful transmission from mosquito to mouse. Mean ± SEM. n=3 independent experiments. (I) Rescue experiment showing Δsun1 phenotype is due to defect in male sun1 allele. Mean ± SEM. n=3 independent experiments. (J) Representative images of male gametocytes at 8 min post activation stained with DAPI and tubulin (left). Fluorometric analyses of DNA content (N) after DAPI nuclear staining (right). The mean DNA content (and SEM) of >30 nuclei per sample are shown. Values are expressed relative to the average fluorescence intensity of 10 haploid ring-stage parasites from the same slide. The same WT-GFP data was used to analyse the Δallan mentioned in Figure 7—figure supplement 1F. (K) Representative images of flagellum (male gamete) stained with Hoechst for DNA (left). The presence or absence of Hoechst fluorescence was scored in at least 30 microgametes per replicate. Mean ± SEM. n=3 independent experiments. The same WT-GFP data was used to analyse the Δallan mentioned in Figure 7—figure supplement 1G. Student’s t-test and/or a two-way ANOVA test were employed to assess differences between control and experimental groups. Statistical significance is indicated as *P < 0.05, **P < 0.01, ***P < 0.001, or ns for not significant.
Figure 3—figure supplement 1
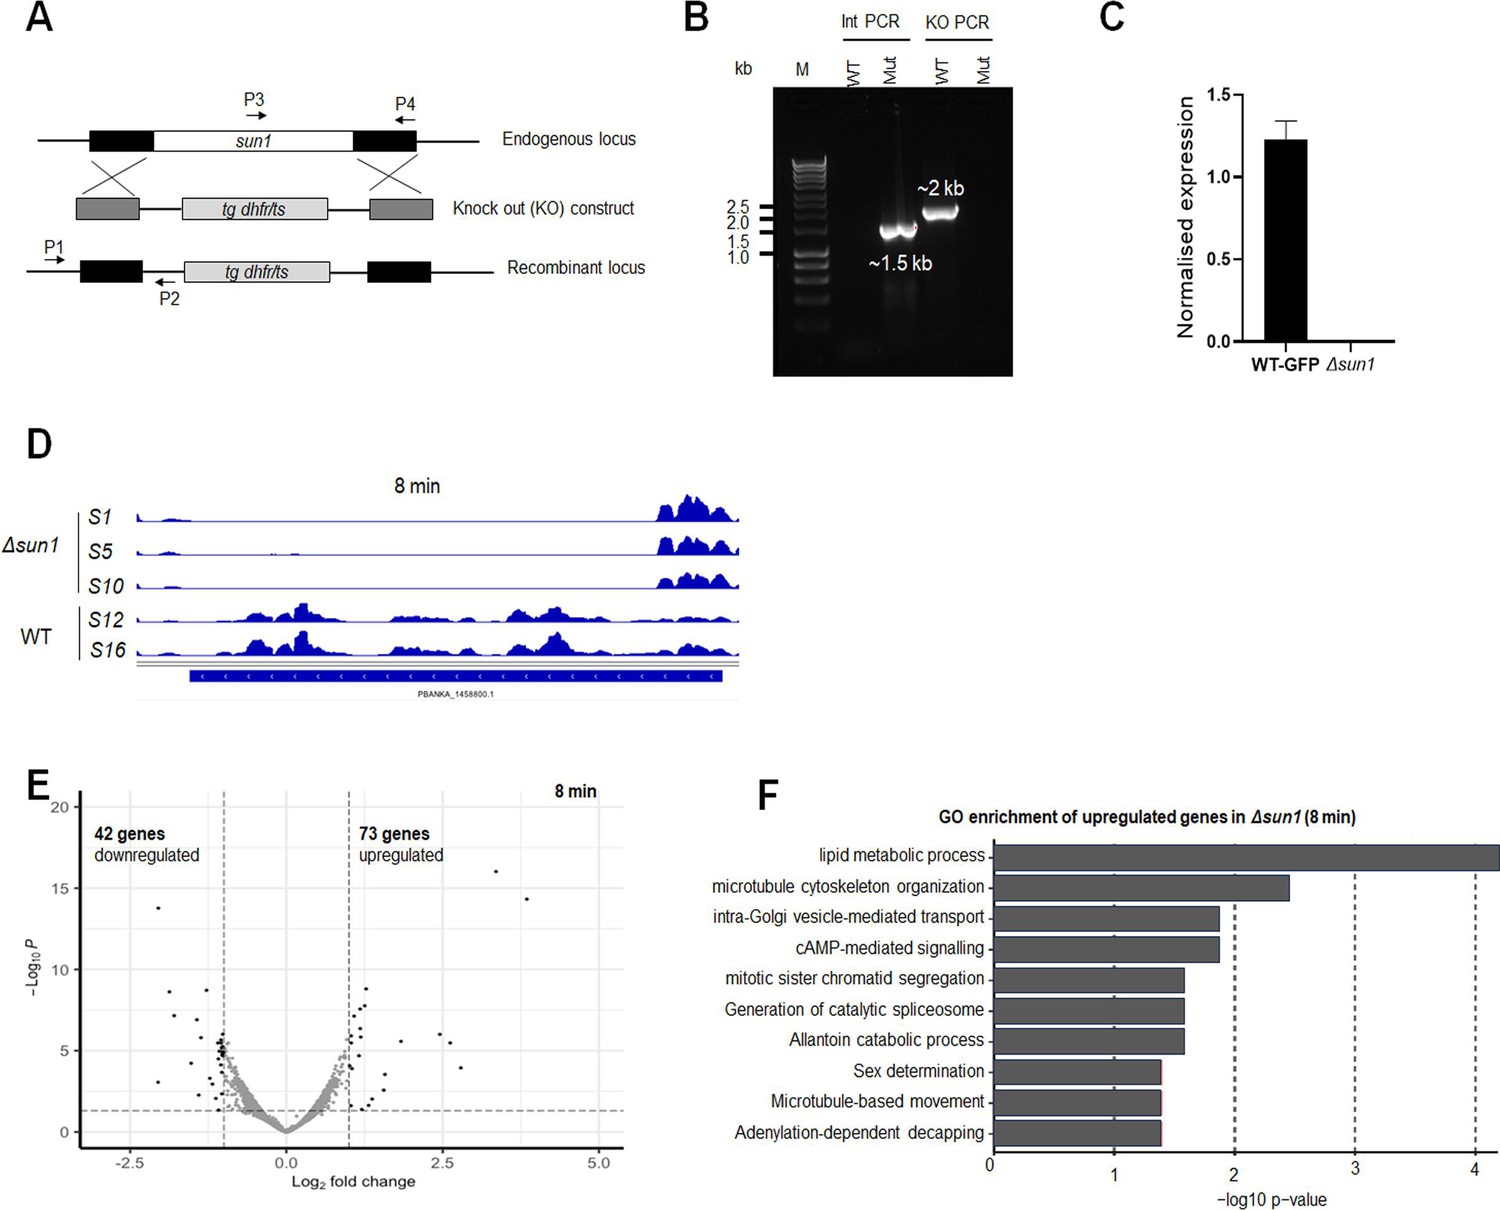
Generation and genotype analysis of sun1-knockout (Δsun1) parasites.
(A) Schematic representation of the endogenous sun1 locus, the targeting knockout construct, and the recombined sun1 locus following double homologous crossover recombination. Arrows 1 (P1) and 2 (P2) indicate PCR primers used to confirm successful integration in the sun1 locus following recombination, and arrows 3 (P3) and 4 (P4) indicate PCR primers used to show deletion of the sun1 gene. (B) Integration PCR of the sun1 locus in WT-GFP (WT) and knockout (Mut) parasites using primers: integration primer (P1) and ol248 (P2). Integration of the targeting construct gives the expected size band for each gene. (C) qRT-PCR analysis showing deletion of sun1 gene in Δsun1 parasites compared to WT-GFP. Mean ± SEM, n=3 independent experiments. (D) RNA-seq analysis showing deletion of sun1 transcript in Δsun1 gametocytes activated for 8 min. (E) Gene expression profile analysis using a volcano plot to highlight up- and downregulated genes in Δsun1 compared to WT-GFP gametocytes activated for 8 min with adjusted p-value cutoff of 0.05. (F) Gene ontology enrichment analysis for upregulated genes in Δsun1 compared to WT-GFP gametocytes, activated for 8 min.
-
Figure 3—figure supplement 1—source data 1
Tiff file of the original gel for Figure 2—figure supplement 1B, indicating the relevant band.
- https://cdn.elifesciences.org/articles/106537/elife-106537-fig3-figsupp1-data1-v1.zip
-
Figure 3—figure supplement 1—source data 2
Tiff file of the original gel for Figure 2—figure supplement 1B.
- https://cdn.elifesciences.org/articles/106537/elife-106537-fig3-figsupp1-data2-v1.zip
-
Figure 3—figure supplement 1—source data 3
List of genes differentially expressed between Δsun1 vs WT-GFP gametocytes activated for 8 min.
- https://cdn.elifesciences.org/articles/106537/elife-106537-fig3-figsupp1-data3-v1.xlsx
Figure 3—figure supplement 2
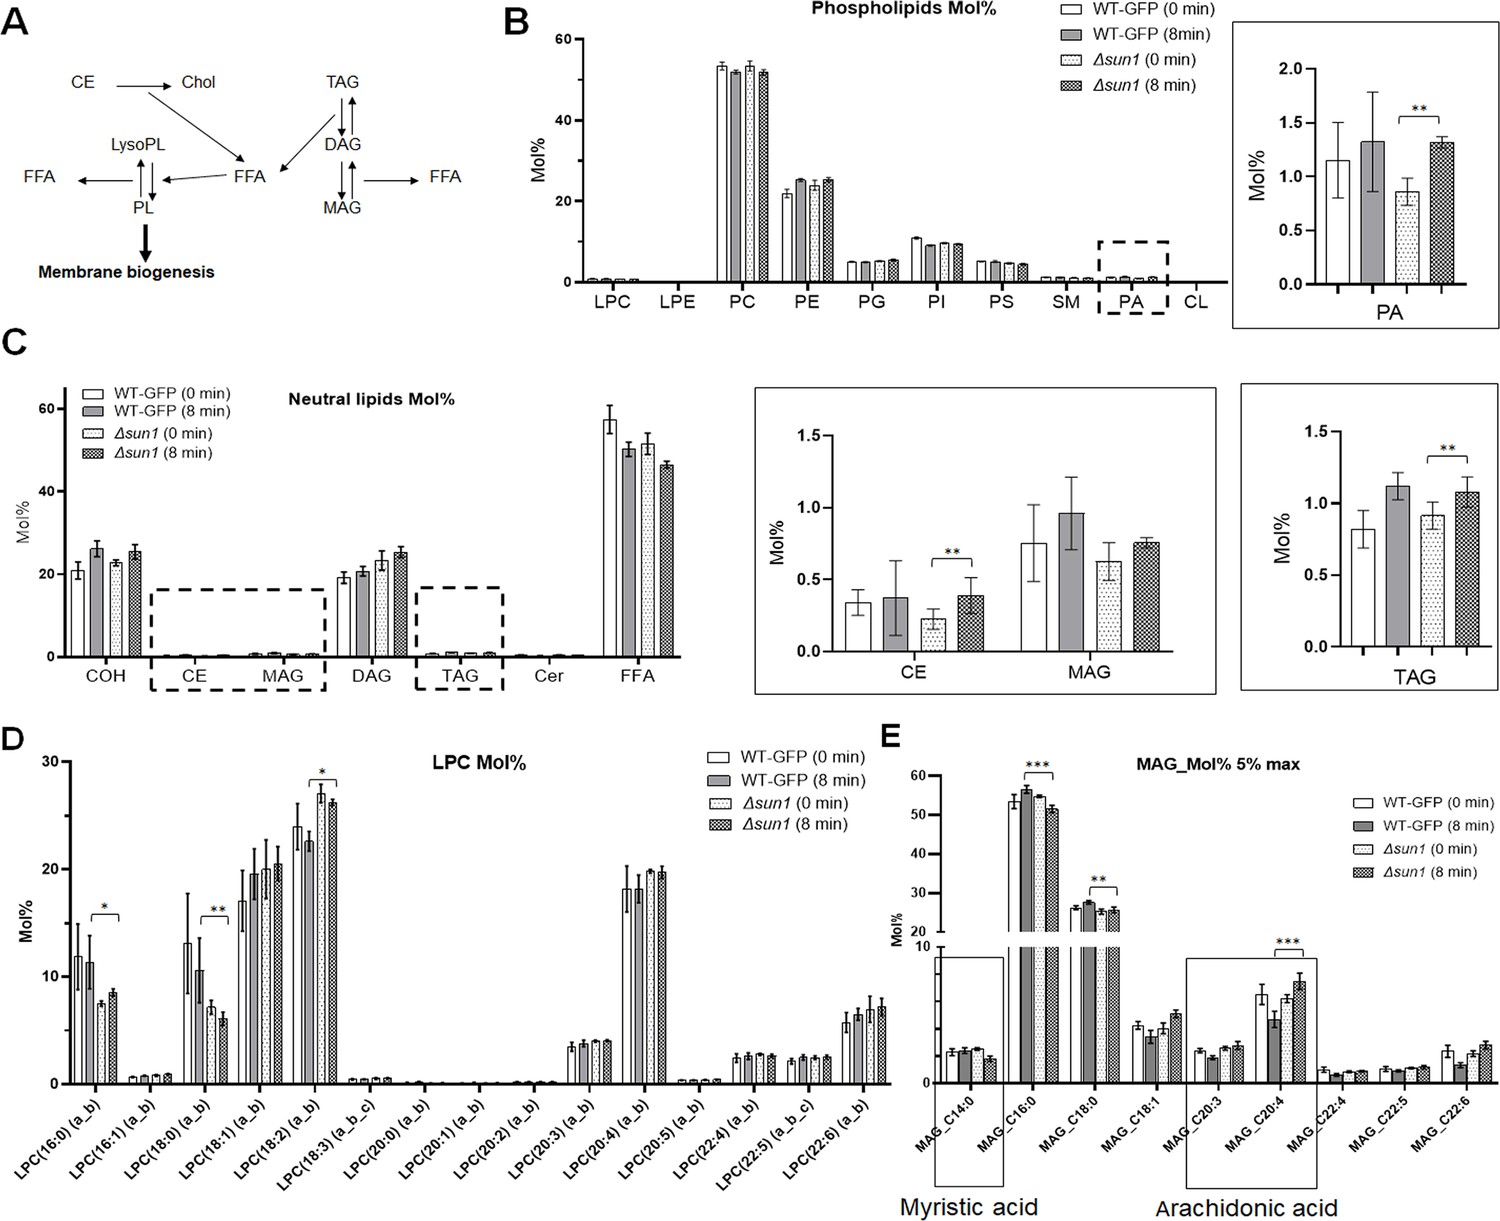
Lipidomic analysis of sun1-knockout (Δsun1) and WT-GFP parasites.
(A) Schematic representation of lipid metabolism and membrane biogenesis. (B) Comparative phospholipid profile of WT-GFP and Δsun1 gametocytes activated for 0 min and 8 min. The level of phosphatidic acid (PA) was significantly increased at 8 min post activation. (C) Neutral lipid profiling highlighting the changes in CE, MAG, and TAG. (D) Comparative lysophosphatidylcholine (LPC) profile of WT-GFP and Δsun1 gametocytes activated for 0 min and 8 min. (E) Comparative monoacylglycerol (MAG) profile of WT-GFP and Δsun1 gametocytes activated for 0 min and 8 min highlighting myristic acid (C14:0) and arachidonic acid (C20:3 and C20:4). Multiple comparison t test (non-parametric) were employed to assess differences between control and experimental groups. Statistical significance is indicated as *P < 0.05, **P < 0.01, ***P < 0.001.
Figure 4 with 2 supplements
Ultrastructural analysis of Δsun1 gametocytes showing defect in spindle formation and BB segregation.
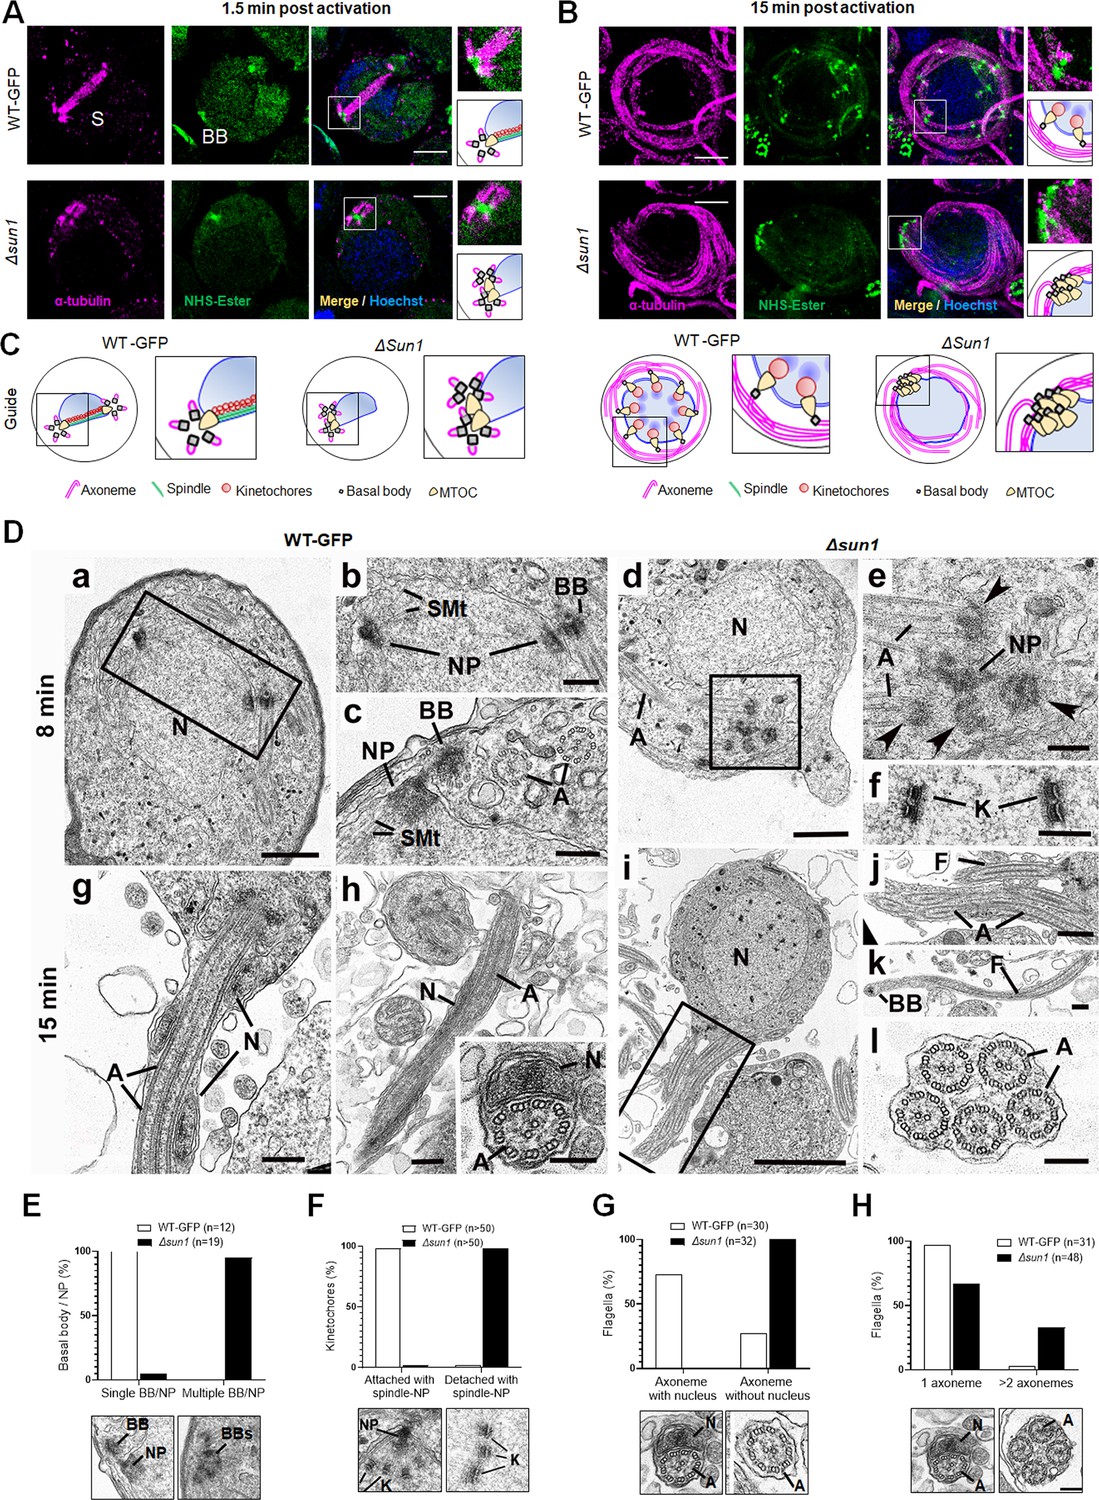
(A) Deletion of sun1 blocks first spindle formation as observed by expansion microscopy (ExM) of gametocytes activated for 1.5 min. α -tubulin: magenta, amine groups/NHS-ester reactive: green. Basal Bodies: BB; spindle: S. Insets represent the zoomed area marked by the white boxes shown around BB/microtubule-organising centre (MTOC) highlighted by NHS-ester and tubulin staining. Scale bar: 5 µm. (B) ExM images showing defect in BB/MTOC segregation in Δsun1 gametocytes activated for 15 min. α -tubulin: magenta, amine groups/NHS-ester reactive: green. Basal Bodies: BB; Insets represent the zoomed area shown around BB/MTOC highlighted by NHS-ester and tubulin staining. More than 30 images were analysed in more than three different experiments. Scale bar: 5 µm. (C) The schematic illustrates structures associated with mitosis and axoneme formation showing the first spindle is not formed, and BB are not separated in Δsun1 gametocytes. (D) Electron micrographs of WT-GFP microgametocytes (male) at 8 min (a–c) and 15 min (g, h) plus Δsun1 gametocytes at 8 min (d-f) and 15 min (i–l). Bars represent 1 µm (a, d, i), and 100 nm (b, c, e, f, g, h, insert, j, k, l).(a) Low power magnification of WT-GFP microgametocyte showing the central nucleus (N) with two nuclear poles (NP) with a basal body (BB) adjacent to one. The cytoplasm contains several axonemes (A). (b) Enlargement of enclosed area (box) in (a) showing the BB adjacent to one NP. (c) Detail showing the close relationship between the NP and the BB. Note the cross-sectioned axonemes (A) showing the 9+2 microtubular arrangement. (d) Low power magnification of Δsun1 cell showing a cluster of electron dense basal structures (enclosed area) in the cytoplasm adjacent to the nucleus (N). A – axonemes. (e) Detail from the cytoplasm (boxed area in d) shows a cluster of four basal bodies (arrowheads) and portions of axonemes (A) around a central electron dense structure of NP material. (f) Detail from a nucleus showing kinetochores (K) with no attached microtubules. (g) Periphery of a flagellating microgamete showing the flagellum and nucleus protruding from the microgametocyte. (h) Detail of a longitudinal section of a microgamete showing the spiral relationship between the axoneme (A) and nucleus (N). Insert. Cross-section of a microgamete showing 9+2 axoneme and adjacent nucleus (N). (i) Section through a microgametocyte with a central nucleus (N) undergoing exflagellation. (j) Enlargement of the enclosed area (box) in (i) showing one cytoplasmic protrusion containing a single axoneme forming a flagellum (F), while the other has multiple axonemes (A). (k) Longitudinal section through a flagellum (F) with a basal body (B) at the anterior end but note the absence of a nucleus. (l) Cross-section showing a cytoplasmic process contain five axonemes (A) but no associated nucleus. (E–H) Quantification of Δsun1 phenotypes compared to WT-GFP during male gametogenesis. N=Nucleus; BB = Basal Body; NP = Nuclear pole; A=Axonemes.
Figure 4—figure supplement 1
Expansion Microscopy (ExM) shows defect in spindle formation and BB/microtubule-organising centre (MTOC) segregation during male gametogenesis in Δsun1 parasites.
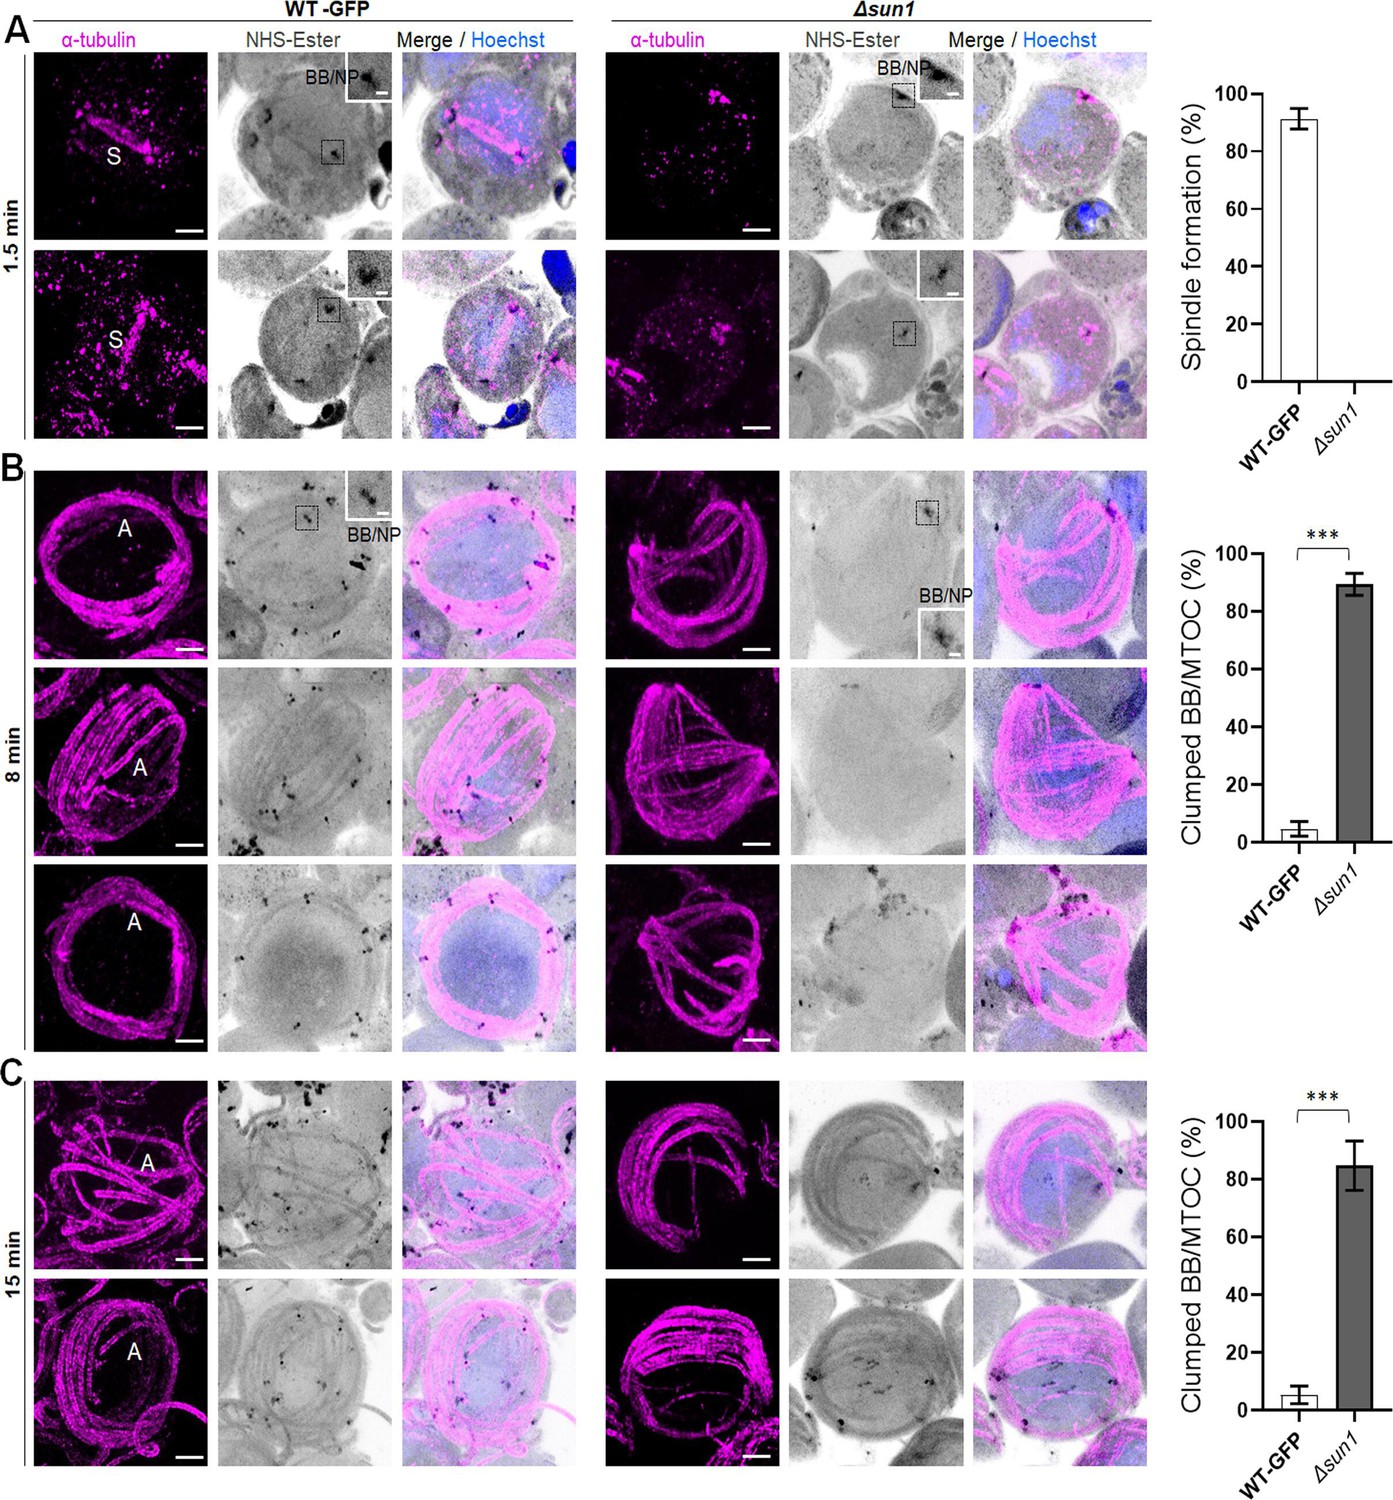
(A) Representative ExM images showing first spindle formation in WT-GFP and Δsun1 gametocytes activated for 1.5 min (left). α -tubulin: magenta, amine groups/NHS-ester reactive: grey. Basal Bodies: BB; spindle: S. Scale bar: 5 µm. Insets show the zoom in areas of BBs. Scale bar: 200 nm. The graph shows the quantification data for spindle formation. Mean ± SEM. n=3 independent experiments. (B) Representative ExM images showing defect in BB/MTOC segregation in Δsun1 compared to WT-GFP gametocytes activated for 8 min (Left). α-tubulin: magenta, amine groups/NHS-ester reactive: grey. Basal Bodies: BB; Axoneme: A. Scale bar: 5 µm. Insets show the zoom in areas of the BBs. Scale bar: 200 nm. The graph shows the quantification data for spindle formation. Mean ± SEM. n=3 independent experiments. (C) Representative ExM images showing defect in basal body/MTOC segregation in Δsun1 compared to WT-GFP gametocytes activated for 15 min (left). α-tubulin: magenta, amine groups/NHS-ester reactive: grey. Basal Bodies: BB; Axoneme: A. Scale bar: 5 µm. The graph shows the quantification data for spindle formation. Mean ± SEM. n=3 independent experiments. Student’s t-test was employed to assess differences between control and experimental groups. Statistical significance is indicated as ***P < 0.001.
Figure 4—figure supplement 2
Transmission Electron Microscopy (TEM) reveals defect in BB/microtubule-organising centre (MTOC) segregation and kinetochore attachment to spindle during male gametogenesis resulting in anucleate gamete formation in Δsun1 parasites.
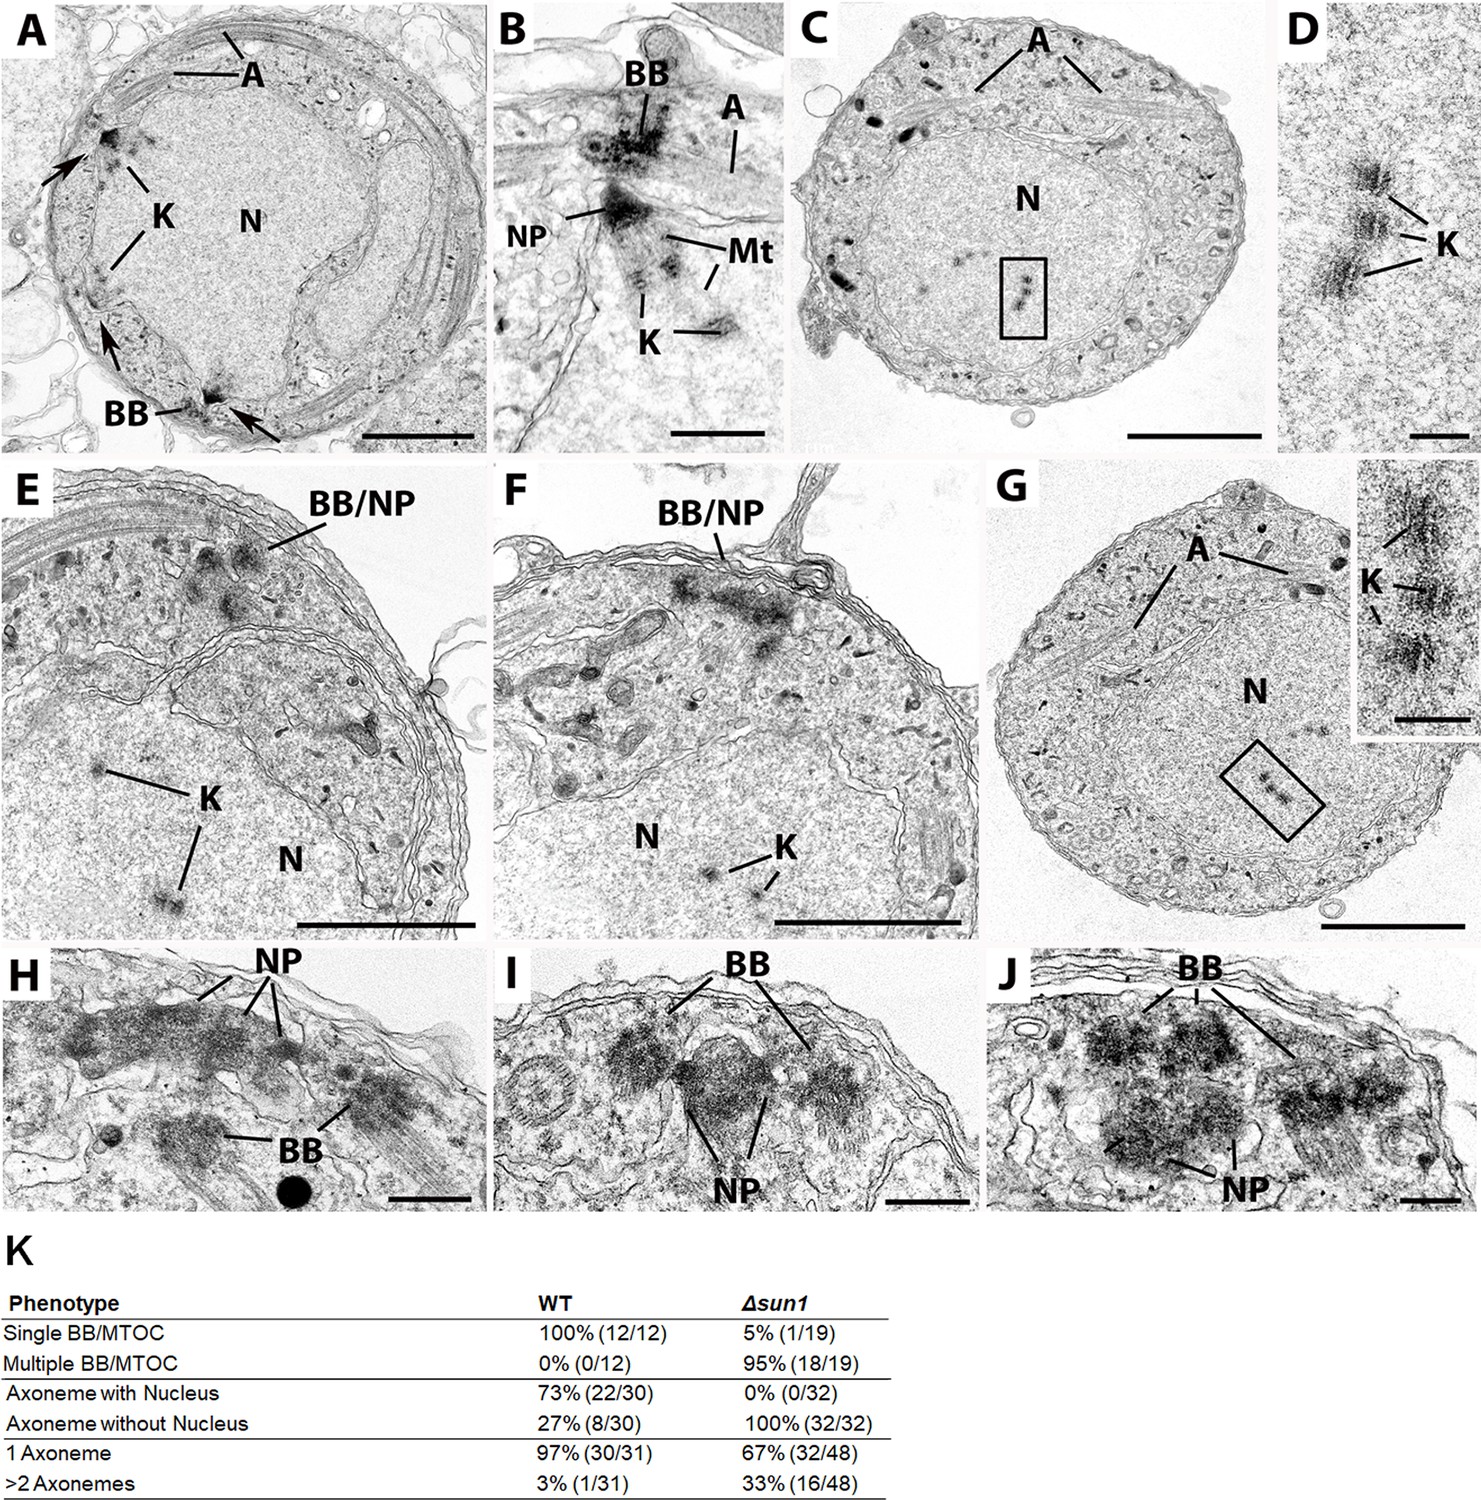
Electron micrographs of WT-GFP (A & B) and Δsun1 (C–J). Scale bar: 1 µm for panels (A, C, E, F & G) and 100 nm for other panels. (A) Low power of a section through mid-stage microgametocyte showing three nuclear poles (arrows) with radiating microtubules with kinetochores (K) attached. Basal bodies (BB) and axonemes (A) are present in the cytoplasm. (B) Enlargement of the periphery of nucleus showing the nuclear pole (NP) and spindle microtubules (Mt) extending between the nuclear poles and the kinetochores (K). Note the BB with attached axoneme (A) closely associated with the nuclear pole. (C) Mid-stage Δsun1 mutant cell showing the nucleus (N) with a number of centrally located kinetochores with no evidence of spindle microtubules. A: axoneme. (D) Detail of the enclosed area showing the substructure of the kinetochores (K). (E and F) Two examples of mid-stage gametocytes showing clumps of basal bodies/ nuclear pole (BB/NP) in the cytoplasm. Note the absence of nuclear spindles but the presence of naked kinetochores (K) within the nuclei (N). (G) Similar stage to that in panel C showing naked kinetochores within the nucleus (N). Insert: Enlargement of the enclosed area showing the kinetochores (K). (H, I and J) Three examples showing the complex interactions between the BB and NP. (K) Quantitative data for different phenotypes in Δsun1 parasites compared to WT-GFP during male gametogenesis.
Figure 5

Reciprocal co-immunoprecipitation of PbSUN1-GFP and ALLAN-GFP during male gametogony.
(A) Projection of the first two components of a principal component analysis (PCA) of unique peptides derived from two SUN1-GFP (and WT-GFP) immunoprecipitations with GFP-trap (peptide values: Figure 5—source data 1). A subset of proteins is highlighted on the map based on relevant functional categories. (B) Similar to panel A, but now for the allantoicase-like protein ALLAN (PBANKA_1304400). (C) Selected proteins, their size and corresponding gene ID and representation by the number of peptides in either WT-GFP, PbSUN1-GFP, or ALLAN-GFP precipitates.
-
Figure 5—source data 1
List of proteins and numbers of unique peptides identified by proteomic analysis of GFP-trap-immunoprecipitates.
Spreadsheet (excel) file with unique peptide values for precipitates from lysates of gametocytes 8 min after activation for WT-GFP, SUN1-GFP, and ALLAN-GFP parasites.
- https://cdn.elifesciences.org/articles/106537/elife-106537-fig5-data1-v1.xlsx
Figure 6 with 1 supplement

Location of ALLAN-GFP during male gametogenesis.
(A) The schematic on the upper panel illustrates the process of male gametogenesis. N, ploidy of nucleus. Live cell images showing the location of ALLAN-GFP (green) at different time points (1–15 min) during male gametogenesis. Representative images of more than 50 cells with more than three biological replicates. Scale bar: 5 µm. (B) ExM images showing location of ALLAN-GFP (green) detected by anti-GFP antibody compared to nuclear pole (NP)/MTOC and BB stained with NHS ester (grey) in gametocytes activated for 8 min. Scale bar: 5 µm. Representative images of more than 20 cells from two biological replicates. Insets represent the zoomed area shown around NP/MTOC and BB highlighted by NHS-ester. Scale bar: 1 µm. (C) ExM images showing the location of ALLAN-GFP (green) compared to spindle and axonemes (magenta) detected by anti-GFP and anti-tubulin staining, respectively, in gametocytes activated for 8 min. Representative images of more than 20 cells from two biological replicates. Scale: 5 µm. Insets represent the zoomed area shown around spindle/axonemes highlighted by tubulin and GFP staining. Basal Bodies: BB; Spindle: S; Axonemes: A; Nucleus: N. Scale bar: 1 µm. (D, E, F) Live cell imaging showing location of ALLAN-GFP (green) in relation to the BB and axoneme marker, kinesin-8B-mCherry (magenta) (D); spindle marker, EB1-mCherry (magenta) (E); and kinetochore marker, NDC80-mCherry (magenta) (F) during first mitotic division (1–3 min) of male gametogenesis. Arrows indicate the focal points of ALLAN-GFP. Representative images of more than 20 cells with three biological replicates. Scale bar: 5 µm.
Figure 6—figure supplement 1
Generation of PbALLAN-GFP parasites and analysis of subcellular location of PbALLAN-GFP during various stages of parasite life cycle.
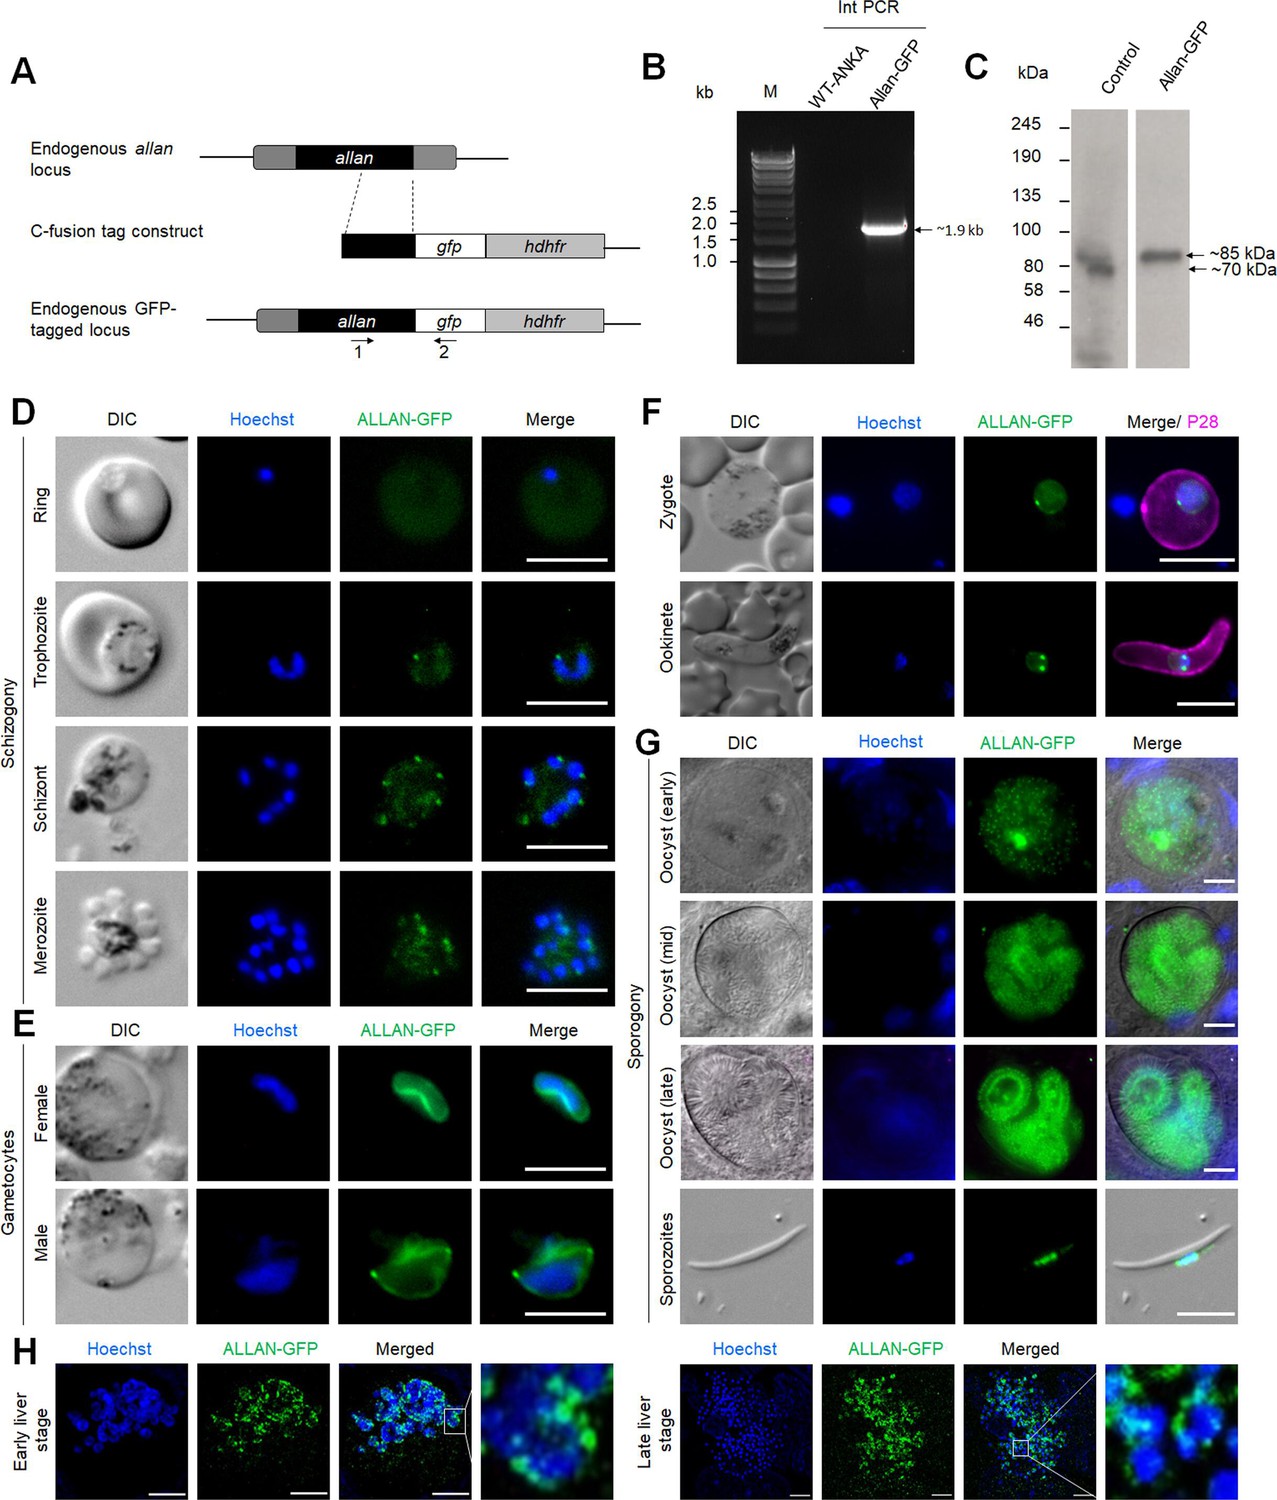
(A) Schematic representation of the endogenous allan locus, the GFP-tagging construct, and the recombined allan locus following single homologous recombination. Arrows 1 and 2 indicate the position of PCR primers used to confirm successful integration of the construct. (B) Diagnostic PCR of ALLAN-GFP and WT parasites using primers: integration primer (1) and ol492 (2). The band of expected size for the amplified DNA fragment is indicated with an arrow. (C) Western blot showing expected size of ALLAN-GFP fusion protein using anti-GFP antibody. The bands of expected size for control and ALLAN-GFP are indicated with arrows (uncropped blot in supplementary data 1). (D) Live cell images of ALLAN-GFP (green) during different stages of blood schizogony. Representative images of more than 50 cells with more than three biological replicates. Scale bar: 5 µm. (E) Live cell images of ALLAN-GFP (green) in activated gametocytes. Representative images of more than 50 cells with more than three biological replicates. Scale bar: 5 µm. (F) Live cell images of ALLAN-GFP (green) in zygote and ookinete. Representative images of more than 50 cells with more than three biological replicates. Scale bar: 5 µm. (G) Live cell images of ALLAN-GFP (green) during oocyst development and in sporozoite. Representative images of more than 50 cells with more than three biological replicates. Scale bar: 5 µm. (H) Live cell images of ALLAN-GFP (green) during liver stages. Representative images of more than 10 cells in two biological replicates Scale bar: 5 µm.
-
Figure 6—figure supplement 1—source data 1
Tiff file of the original gel for Figure 6—figure supplement 1B, indicating the relevant band.
- https://cdn.elifesciences.org/articles/106537/elife-106537-fig6-figsupp1-data1-v1.zip
-
Figure 6—figure supplement 1—source data 2
Tiff file of the original gel for Figure 6—figure supplement 1B.
- https://cdn.elifesciences.org/articles/106537/elife-106537-fig6-figsupp1-data2-v1.zip
-
Figure 6—figure supplement 1—source data 3
Tiff file of the original gel for Figure 6—figure supplement 1C, indicating the relevant band.
- https://cdn.elifesciences.org/articles/106537/elife-106537-fig6-figsupp1-data3-v1.zip
-
Figure 6—figure supplement 1—source data 4
Tiff file of the original gel for Figure 6—figure supplement 1C.
- https://cdn.elifesciences.org/articles/106537/elife-106537-fig6-figsupp1-data4-v1.zip
Figure 7 with 2 supplements
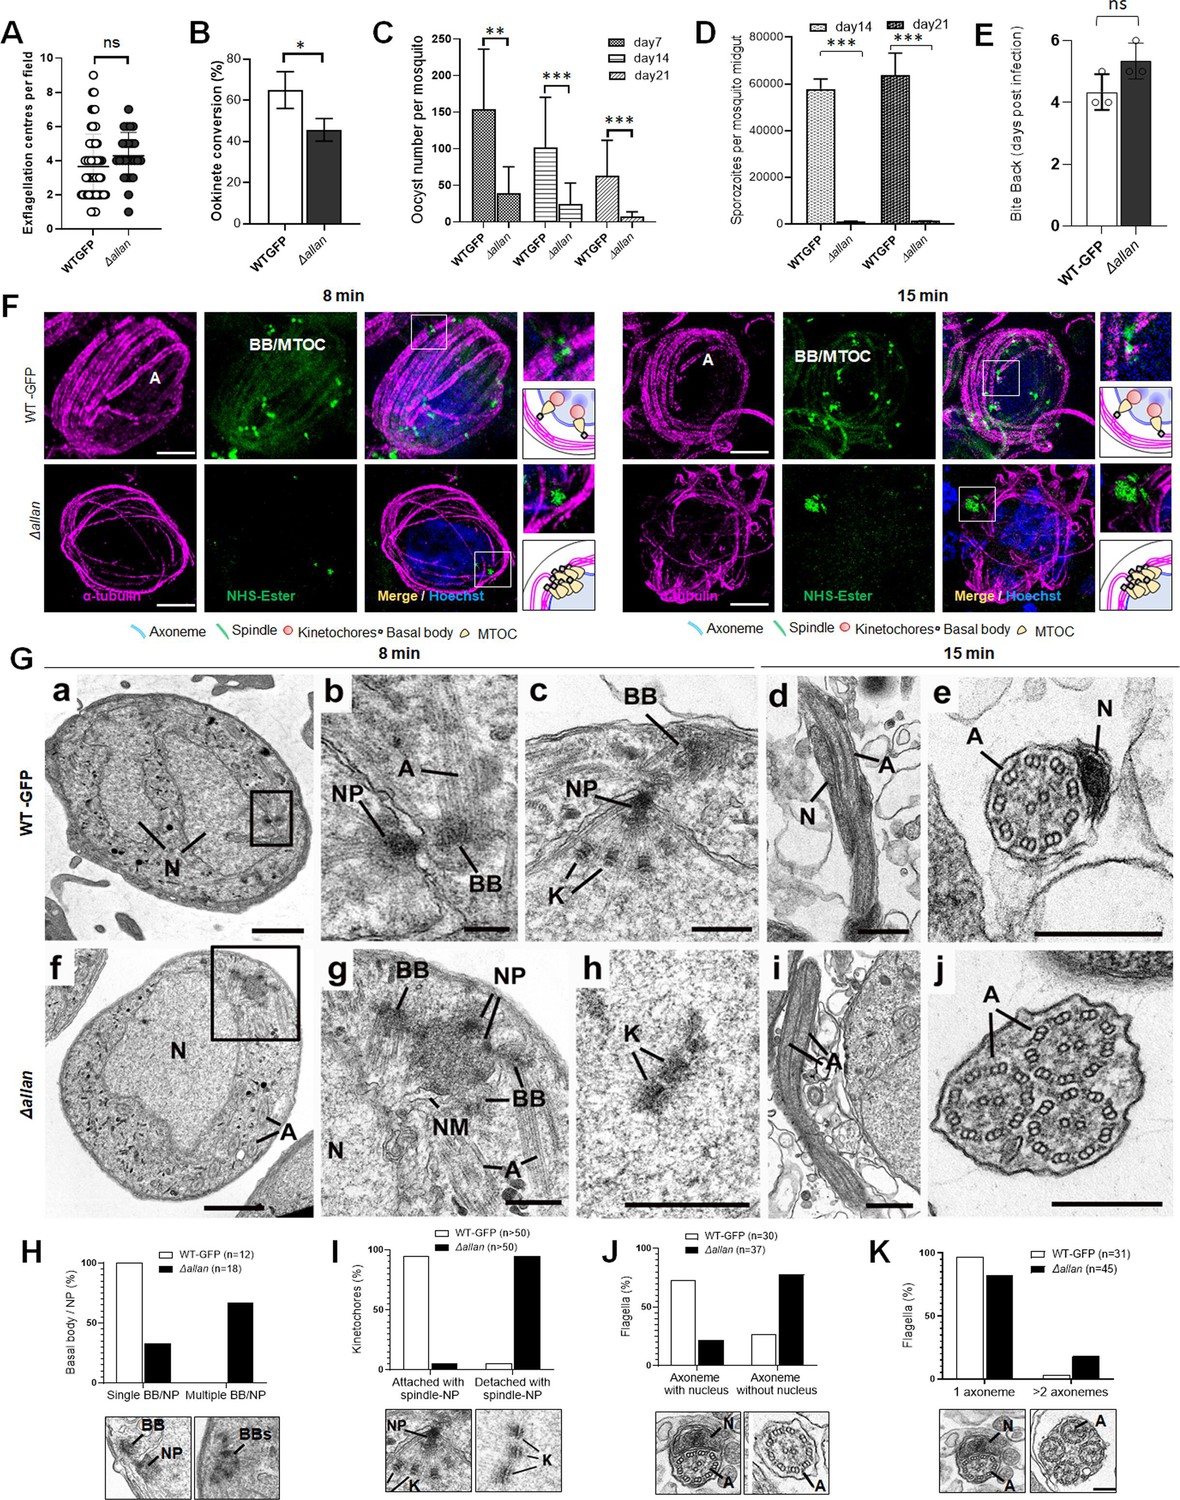
Deletion of ALLAN impairs male gametogenesis by blocking BB segregation.
(A) Exflagellation centres per field at 15 min post-activation in Δallan compared to WT-GFP parasites. n≥3 independent experiments (>10 fields per experiment). Error bar ± SEM. (B) Percentage ookinete conversion from zygote. n≥3 independent experiments (>100 cells). Error bar ± SEM. (C) Total number of GFP-positive oocysts per infected mosquito in Δallan compared to WT-GFP parasites at 7-, 14-, and 21 d post-infection. Mean ± SEM. n≥3 independent experiments. (D) Total number of sporozoites in oocysts of Δallan compared to WT-GFP parasites at 14- and 21 d post-infection. Mean ± SEM. n≥3 independent experiments. (E) Bite back experiments reveal successful transmission of Δallan and WT-GFP parasites from mosquito to mouse. Mean ± SEM. n=3 independent experiments. Student’s t-test and/or a two-way ANOVA test were employed to assess differences between control and experimental groups. Statistical significance is indicated as *P < 0.05, **P < 0.01, ***P < 0.001, or ns for not significant. (F) ExM images of gametocytes activated for 8- and 15 min showing MTOC/BB stained with NHS ester (green) and axonemes stained with anti-tubulin antibody (magenta). Axonemes: A; Basal Bodies: BB; Microtubule organising centre: MTOC. Insets represent the zoomed area shown around BB/MTOC highlighted by NHS-ester and tubulin staining. More than 30 images were analysed in more than three different experiments. Scale bar: 5 µm. (G) Electron micrographs of WT-GFP microgametocytes at 8 min (a–c) and 15 min (d, e) and the Δallan at 8 min (f–h) and 15 min (I, j). Bars represent 1 µm (a, f) and 200 nm in all other images. (a) Low power image of a microgametocyte showing the nucleus (N) with two NP complexes (arrows) consisting of the basal body, NP, and attached kinetochores. Axonemes (A) are present in the cytoplasm. (b) Enlargement showing the nuclear pole (NP), associated basal body (BB), and axonemes (A). (c) Detail of the nuclear pole (NP) showing kinetochores (K) attached to the spindle microtubules. Note the basal body (BB) adjacent to the nuclear pole (NP). (d) Longitudinal section of a microgamete showing the nucleus (N) closely associated with the axonemes (A). (e) Cross-section through a microgamete showing the nucleus (N) and axoneme (A) enclosed in plasma membrane. (f) Lower magnification of a microgametocyte showing a nucleus (N) with an adjacent clump of electron dense structures (enclosed area) and axonemes (A) in the cytoplasm. (g) Enlargement of the enclosed area in f showing multiple basal bodies (BB) and unseparated nuclear poles (NP) enclosed by portions of nuclear membrane (NM). N – nucleus. (h) Detail from a nucleus showing several kinetochores (K) with no associated spindle microtubules. (i) Longitudinal section of an exflagellating cytoplasmic process consisting of two axonemes (A) but no nucleus. (j) Cross-section through an exflagellating cytoplasmic process showing the presence of multiple axonemes (A) but the absence of any nucleus. (H to K) Quantification of Δallan phenotype compared to WT-GFP during male gametogenesis. N=Nucleus; BB = Basal Body; NP = Nuclear pole; A=Axonemes.
Figure 7—figure supplement 1
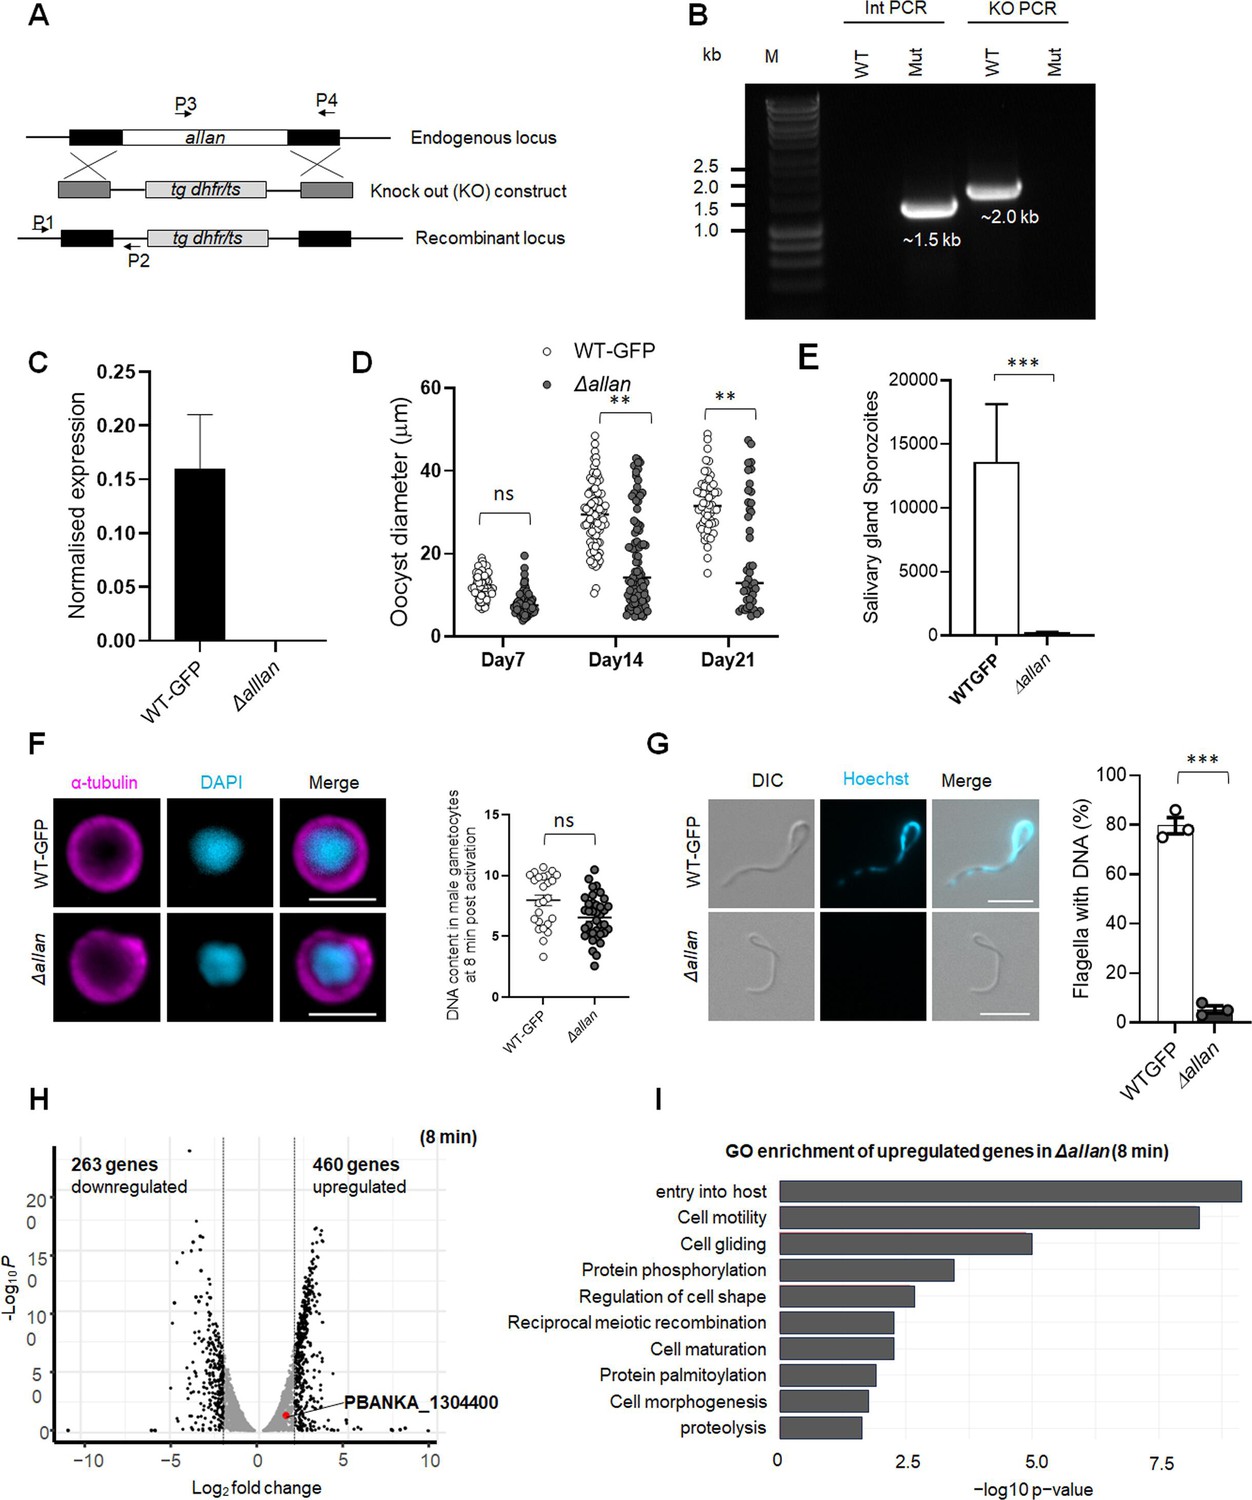
Generation and genotype analysis of Pballan-knockout (Δallan) parasites.
(A) Schematic representation of the endogenous allan locus, the targeting knockout construct, and the recombined allan locus following double homologous crossover recombination. Arrows 1 (P1) and 2 (P2) indicate PCR primers used to confirm successful integration in the allan locus following recombination, and arrows 3 (P3) and 4 (P4) indicate PCR primers used to show deletion of the allan gene. (B) Integration PCR of the allan locus in WT-GFP (WT) and knockout (Mut) parasites using primers: integration primer (P1) and ol248 (P2). Integration of the targeting construct gives expected size band for each gene. (C) qRT-PCR analysis showing deletion of allan gene in Δallan parasites compared to WTGFP. Mean ± SEM, n=3 independent experiments. (D) The diameter of GFP-positive oocysts of Δallan compared to WT-GFP parasites at 7-, 14-, and 21 d post-infection. Mean ± SEM. n=3 independent experiments. (E) Total number of sporozoites in salivary glands of Δallan compared to WT-GFP parasites at 21 d post-infection. Mean ± SEM. N=2 independent experiments. (F) Representative images of Δallan and WT-GFP male gametocytes at 8 min post activation stained with DAPI and tubulin (left). Scale: 5 µm. Fluorometric analyses of DNA content (N) after DAPI nuclear staining (right). The mean DNA content (and SEM) of >30 nuclei per sample are shown. Values are expressed relative to the average fluorescence intensity of 10 haploid ring-stage parasites from the same slide. (G) Representative images of Δallan and WT-GFP male gametes stained with Hoechst for DNA (left). The presence or absence of Hoechst fluorescence was scored in at least 30 microgametes per replicate. Mean ± SEM. n=3 independent experiments. (H) Gene expression profile analysis using a volcano plot to highlight up- and downregulated genes in Δallan compared to WT-GFP gametocytes activated for 8 min with adjusted p-value cutoff of 2.0. (I) Gene ontology enrichment analysis for upregulated genes in Δallan compared to WT-GFP gametocytes, activated for 8 min. Student’s t-test and/or a two-way ANOVA test were employed to assess differences between control and experimental groups. Statistical significance is indicated as *P < 0.05, **P < 0.01, ***P < 0.001, or ns for not significant.
-
Figure 7—figure supplement 1—source data 1
Tiff file of the original gel for Figure 7—figure supplement 1B, indicating the relevant band.
- https://cdn.elifesciences.org/articles/106537/elife-106537-fig7-figsupp1-data1-v1.zip
-
Figure 7—figure supplement 1—source data 2
Tiff file of the original gel for Figure 7—figure supplement 1B.
- https://cdn.elifesciences.org/articles/106537/elife-106537-fig7-figsupp1-data2-v1.zip
-
Figure 7—figure supplement 1—source data 3
List of genes differentially expressed between Δallan vs WT-GFP gametocytes activated for 8 min.
- https://cdn.elifesciences.org/articles/106537/elife-106537-fig7-figsupp1-data3-v1.xlsx
Figure 7—figure supplement 2

Transmission electron microscopy (TEM) reveals defect in basal body/microtubule-organising centre (MTOC) segregation and kinetochore attachment to spindle during male gametogenesis resulting in anucleate gamete formation in Δallan parasites.
Electron micrographs of Δallan parasites. Scale bar: 1 µm in panels (A, B, C, G, and H), and 100 nm in other panels. (A, B, C) Examples of mid-stages microgametocytes showing nuclei (N) with centrally located kinetochores in the absence of nuclear spindle microtubules, but axonemes (A) are present in the cytoplasm. Inserts: Details of the enclosed areas showing the structure of the naked kinetochores. (D and E) Enlargement of the peripheral cytoplasm showing the complex basal body and nuclear pole (BB/NP) interactions. N: nucleus. (A) Detail of one of the rare examples of a nuclear pole (N) with radiating microtubules (Mt) attached to kinetochores (K). (B) Late microgametocyte showing exflagellation with the formation of the flagellum (F). Note the absence of a nucleus associated with the flagellum. (H) Detail of a cross-sectioned flagella (F) showing variation in the number of axonemes (A) but both lack a microgamete nucleus. (I) Quantitative data for different phenotypes in Δallan parasites compared to WT-GFP during male gametogenesis.
Figure 8
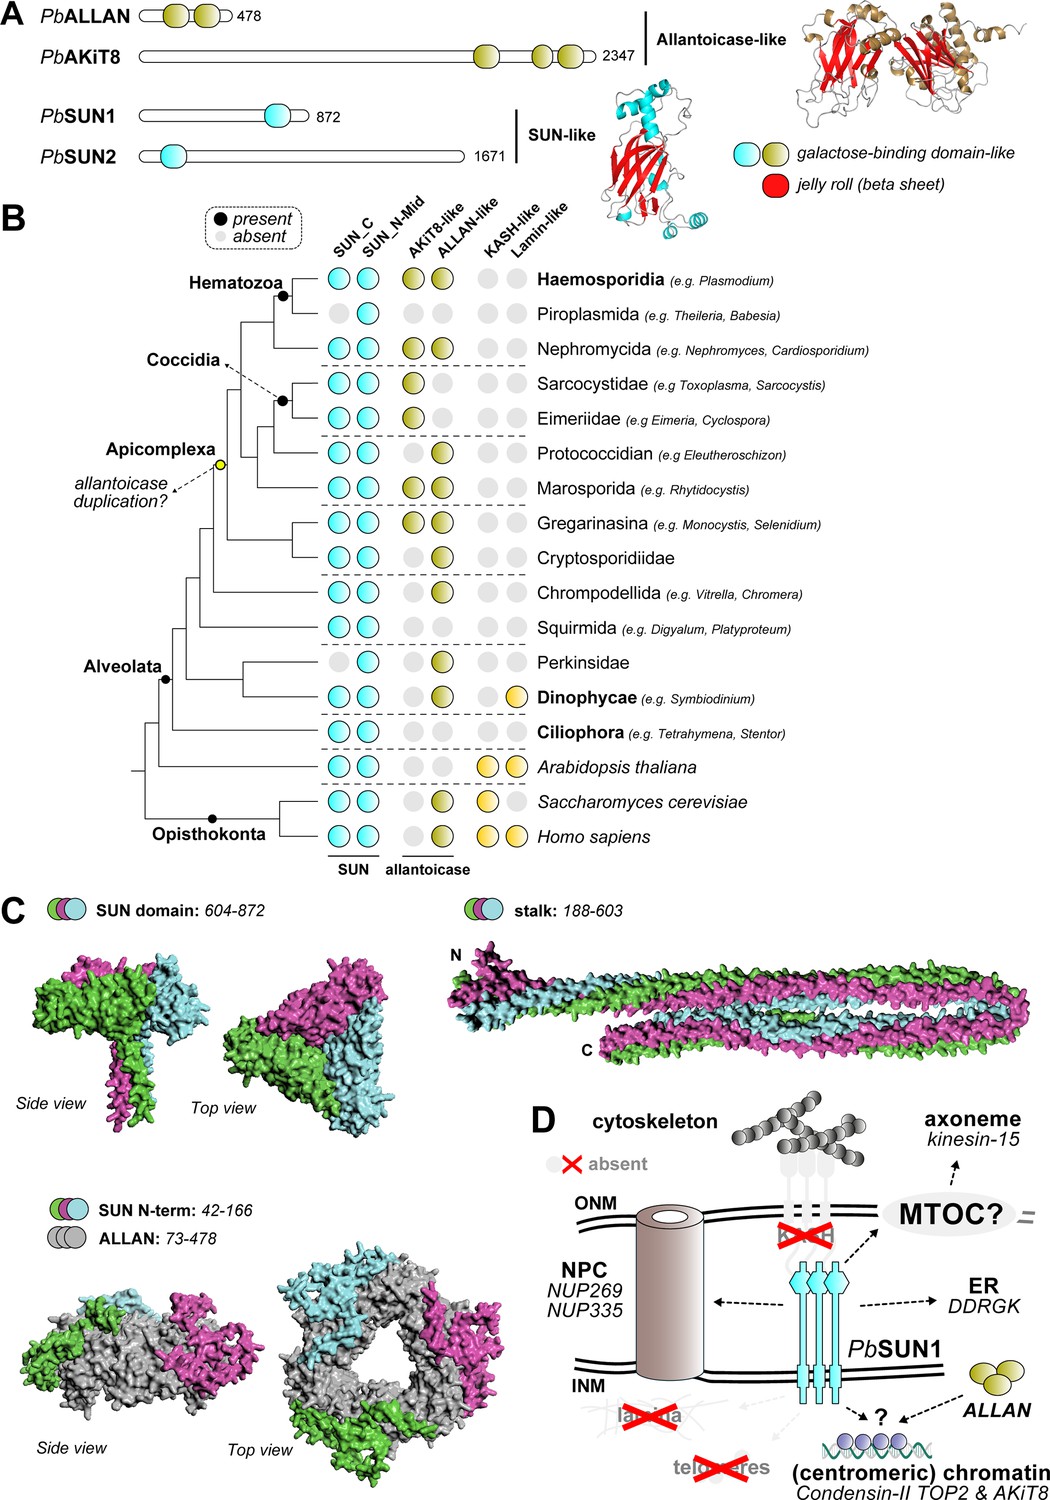
Evolution and Structure of the SUN1-ALLAN interaction.
(A) Domain analysis shows two proteins with allantoicase domain and two proteins with SUN-domain in P. berghei. The SUN domain and two domains comprising allantoicases are part of the same galactose-binding domain family, with a strikingly similar fold. (B) Phylogenetic profiles showing the presence of SUN-, ALLAN- and KASH-domain and lamin proteins in Apicomplexa and a selection of other eukaryotes, including two model species Homo sapiens and Arabidopsis thaliana. (C) AlphaFold3-modelled interaction between ALLAN and SUN1 based on separate domains (no full structure could be modelled). The SUN1 C-terminus forms a trimeric complex (pTM:0.37) similar to a trimeric ALLAN complex (grey) with the N-terminus of SUN1 interacting with ALLAN (pTM:0.55). This N-terminal domain is unique to Haemosporida. (D) Overview in similar style as Figure 1 of main interactors for putative localisation at the nuclear envelope for ALLAN and SUN1 during male gametogenesis. Structures in grey have not been found to be associated with SUN1.
-
Figure 8—source data 1
Phylogenetic analysis of SUN1, allantoicase-like, KASH, and lamin proteins in Eukaryotes with a focus on Apicomplexa with sources for genomes (hyperlinks), sequences, and IDs.
- https://cdn.elifesciences.org/articles/106537/elife-106537-fig8-data1-v1.xlsx
Author response image 1

Author response image 2

Videos
Video 1
Time-lapse video showing dynamic location SUN1-GFP in gametocytes activated for 3–4 min.
Scale: 5 µm.
Video 2
Time-lapse video showing dynamic location ALLAN-GFP in gametocytes activated for 1-2 min.
Scale: 5 µm.
Tables
Key resources table
| Reagent type (species) or resource | Designation | Source or reference | Identifiers | Additional information |
|---|---|---|---|---|
| Strain, strain background (Escherichia coli) | X2-Blue ultracompetent cells | Agilent Technologies | Cat #200150 | chemically competent cells |
| Cell line (P. berghei) | ANKA 2.34 | WT-ANKA RRID:NCBITaxon_5823 | ||
| Cell line (P. berghei) | 507cl1 | WT-GFP | ||
| Cell line (P. berghei) | SUN1-GFP | This study | Tag line | |
| Cell line (P. berghei) | ALLAN-GFP | This study | Tag line | |
| Cell line (P. berghei) | kinesin-8B-mCherry | Tag line | ||
| Cell line (P. berghei) | EB1-mCherry | Tag line | ||
| Cell line (P. berghei) | NDC80-mCherry | Tag line | ||
| Cell line (P. berghei) | ARK2-mCherry | Tag line | ||
| Cell line (P. berghei) | Δsun1 | This study | KO line | |
| Cell line (P. berghei) | Δallan | This study | KO line | |
| Cell line (P. berghei) | Δnek4 | KO line | ||
| Cell line (P. berghei) | Δhap2 | KO line | ||
| Antibody | Monoclonal Anti-α-Tubulin antibody from mouse (DM1A) | Sigma | Cat# T9026 RRID:AB_477593 | IF, UExM (1:1000) |
| Antibody | Rabbit anti-GFP Polyclonal Antibody | Thermo Fisher | Cat# A-11122 RRID:AB_221569 | WB, UExM (1:1250) |
| Antibody | Goat anti-Rabbit IgG Alexa Fluor 568 (polyclonal) | Thermo Fisher | Cat# A11036 RRID:AB_10563566 | IF, UExM (1:1000) |
| Antibody | Goat anti-Mouse IgG Alexa Fluor 568 (polyclonal) | Thermo Fisher | Cat# A-11004 RRID:AB_2534072 | IF, UExM (1:1000) |
| Antibody | Goat anti-Rabbit IgG Alexa Fluor 488 (polyclonal) | Thermo Fisher | Cat# A-11034 RRID:AB_2576217 | IF, UExM (1:1000) |
| Antibody | Cy3-conjugated mouse monoclonal antibody 13.1 | N/A | Live-cell imaging (1:1000) | |
| Chemical compound | Atto 594 NHS ester | Merck | Cat #08741 | UExM (10 μg/ml) |
Table 1
Oligonucleotides used in this study.
| Name | Sequence (5’ to 3’) | Notes |
|---|---|---|
| Primers used for GFP tag construct | ||
| T3031 (SUN1) | CCCCGGTACCGAAAGTGGTAATGTATCTGAAAC | KpnI site underlined |
| T3032 (SUN1) | CCCCGGGCCCCTTTAACTTTCTTATGCATCTTTGAC | ApaI site underlined |
| Int303 (SUN1) | CAAGAATTGTTCGATGGCATG | |
| T3071 (Allan) | CCCCGGTACCGAGGTTGTAGAAAATCCCTG | KpnI site underlined |
| T3072 (Allan) | CCCCGGGCCCAGGGGGGATTGATAAAAC | ApaI site underlined |
| Int307 (Allan) | GCATATGCCTATAGTAATTCGTG | |
| ol492 | ACGCTGAACTTGTGGCCG | |
| mCherryP | TTCAGCTTGGCGGTCTGGGT | |
| Primers used for knockout construct | ||
| N1511 (SUN1) | CCCCGGGCCCAGGGGAAAGCAACAGCATTG | ApaI site underlined |
| N1512 (SUN1) | GGGGAAGCTTCCCTTTCTGCCCTTTGGTTT | HindIII site underlined |
| N1513 (SUN1) | CCCCGAATTCACGGAAAACTATGGTGCCCC | EcoRI site underlined |
| N1514 (SUN1) | GGGGTCTAGAACGCCCTTTTACTCCTATCTACA | XbaI site underlined |
| intN151_5 (SUN1) | GCACATTTGATCGTATACATGAC | |
| N1531 (Allan) | CCCCGGGCCCGTTCGTATCTCCATAATTATTAAAGG | ApaI site underlined |
| N1532 (Allan) | GGGGAAGCTTCGTTAATATTTTTCTTCGCCG | HindIII site underlined |
| N1533 (Allan) | CCCCGAATTCGATTGGTTTCAATTACCTCCTTG | EcoRI site underlined |
| N1534 (Allan) | GGGGTCTAGACTATATATGCGCAGGGATATAC | XbaI site underlined |
| intN153_5 (Allan) | GTGTAATAGCCATCATAATTAAGC | |
| ol248 | GATGTGTTATGTGATTAATTCATACAC | |
| Primers used for qRT PCR | ||
| hsp70 FW | GTATTATTAATGAACCCACCGCT | PBANKA_081890 |
| hsp70 RV | GAAACATCAAATGTACCACCTCC | |
| arginyl-tRNA FW | TTGATTCATGTTGGATTTGGCT | PBANKA_143420 |
| arginyl-tRNA RV | ATCCTTCTTTGCCCTTTCAG | |
| Allantoicase-FW | ACCCTTGATTCCTCATGTCTTCAA | PBANKA_1304400 |
| Allantoicase-RV | TTTTTCCTGAGCCGGTTGCT | |
| SUN1-FW | GGGCTCTAGAATCATTAGGAGC | PBANKA_1430900 |
| SUN1-RV | TCTCCTGGGAAGTTTGAAGGT | |
Additional files
Download links
A two-part list of links to download the article, or parts of the article, in various formats.
Downloads (link to download the article as PDF)
Open citations (links to open the citations from this article in various online reference manager services)
Cite this article (links to download the citations from this article in formats compatible with various reference manager tools)
A novel SUN1-ALLAN complex coordinates segregation of the bipartite MTOC across the nuclear envelope during rapid closed mitosis in Plasmodium berghei
eLife 14:RP106537.
https://doi.org/10.7554/eLife.106537.2


