Structural mechanism of strand exchange by the RAD51 filament
- Department of Biochemistry, University of Cambridge, United Kingdom
Figures
Figure 1 with 6 supplements
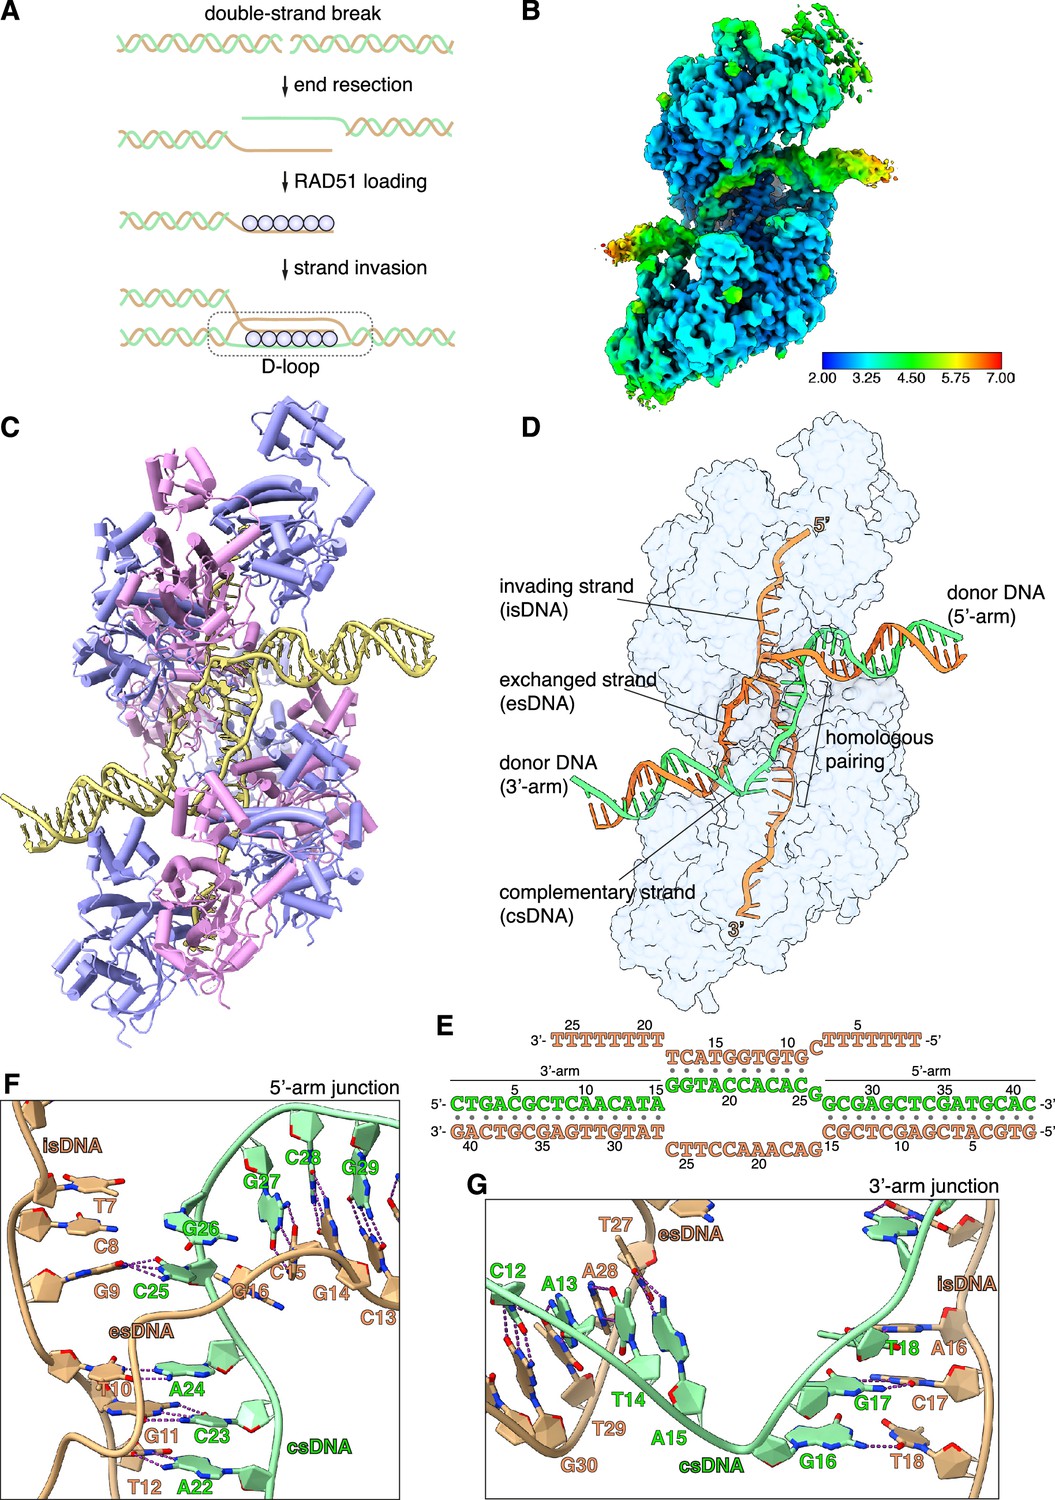
CryoEM structure of the RAD51 displacement loop (D-loop).
(A) Schematic drawing of RAD51 D-loop formation during double-strand DNA break repair by homologous recombination. (B) CryoEM map of the RAD51 D-loop, coloured according to local resolution. (C) Drawing of the RAD51 D-loop structure. The nine RAD51 protomers in the filament are shown as cylinder cartoons, coloured alternatively in lavender and pink. The DNA strands of the D-loop are represented as light yellow tubes for the phosphoribose backbone, and the nucleotides are drawn in stick representation with filled rings. (D) D-loop drawing that highlights the trajectories of the DNA strands of the donor DNA and the invading DNA. The complementary and exchanged strands of the donor DNA are coloured light green and orange; the invading strand of the filament is coloured as the exchanged strand to emphasise that they would share sequence homology in vivo. The protein filament is drawn as a transparent surface in light blue. (E) Nucleotide sequences and observed base pairing of the D-loop DNA. Sequences are coloured as in panel D. (F) Cartoon drawing of the DNA strands at the 5’-arm junction. The phosphoribose backbone is shown as a narrow tube, the nucleotide bases as filled rings. DNA strands are coloured as in panel D. The Watson-Crick hydrogen bonds between base pairs are drawn as dashed purple lines. (G) Cartoon drawing of the DNA strands at the 3’-arm junction, coloured and annotated as in panel F.
Figure 1—figure supplement 1
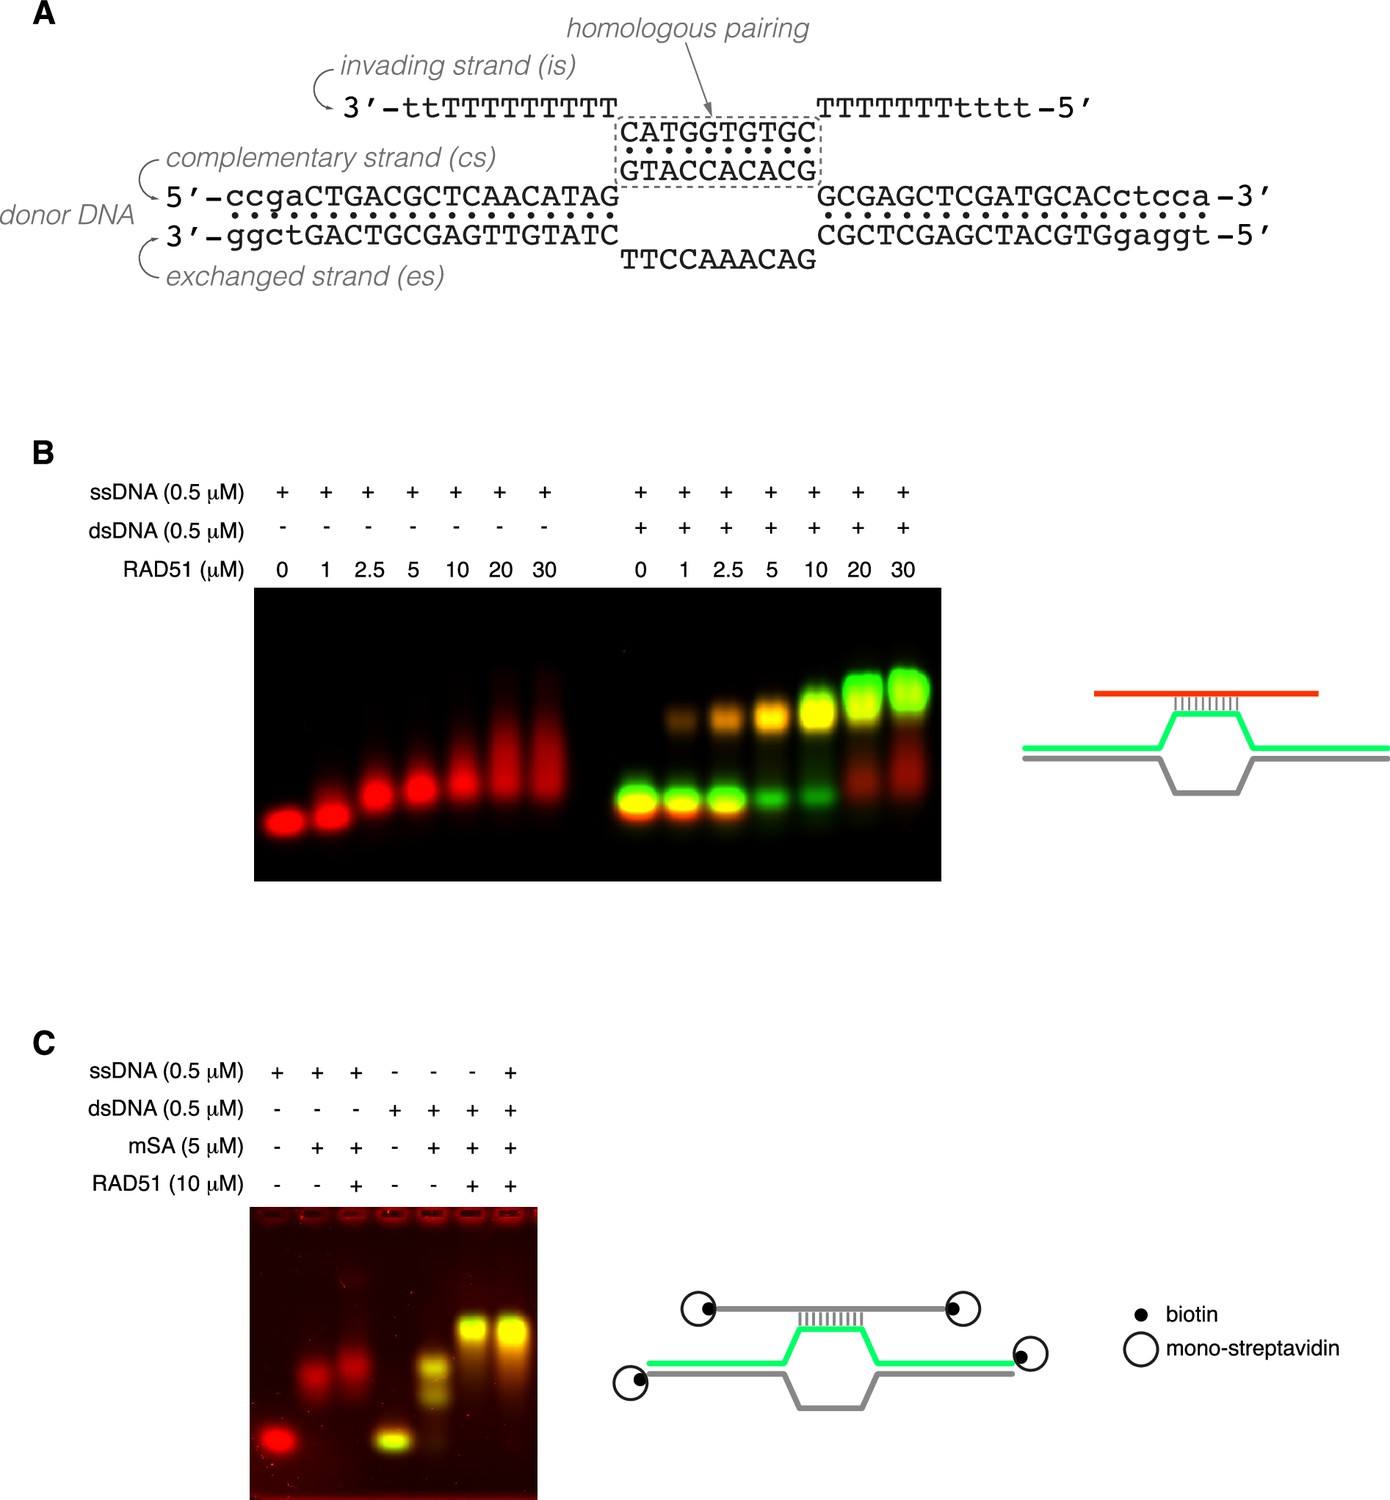
Displacement loop (D-loop) reconstitution with human RAD51.
(A) Sequences and designed base pairing of oligonucleotides used in D-loop reconstitution for cryoEM analysis. Nucleotides in lower case were not included in the final atomic model. (B, C) Electrophoretic mobility shift assays (EMSAs), shown as composite fluorescent images: the Cy5-labelled (B) or SYBR Gold-stained single-stranded DNA (ssDNA) (B) is coloured red, while the Cy3-labelled strand in double-stranded DNA (dsDNA) is green. Schematic drawings of the DNA substrates coloured according to the fluorescence label are shown above each experiment. (B) RAD51 titration on ssDNA only or ssDNA and complementary dsDNA. (C) RAD51 binding to doubly biotinylated ssDNA only or to doubly biotinylated ssDNA and complementary doubly biotinylated duplex DNA, in the presence of mono-streptavidin (mSA).
-
Figure 1—figure supplement 1—source data 1
Original gel images for Figure 1—figure supplement 1B and C.
- https://cdn.elifesciences.org/articles/107114/elife-107114-fig1-figsupp1-data1-v1.zip
-
Figure 1—figure supplement 1—source data 2
Uncropped gel images for Figure 1—figure supplement 1A and B.
- https://cdn.elifesciences.org/articles/107114/elife-107114-fig1-figsupp1-data2-v1.zip
Figure 1—figure supplement 2
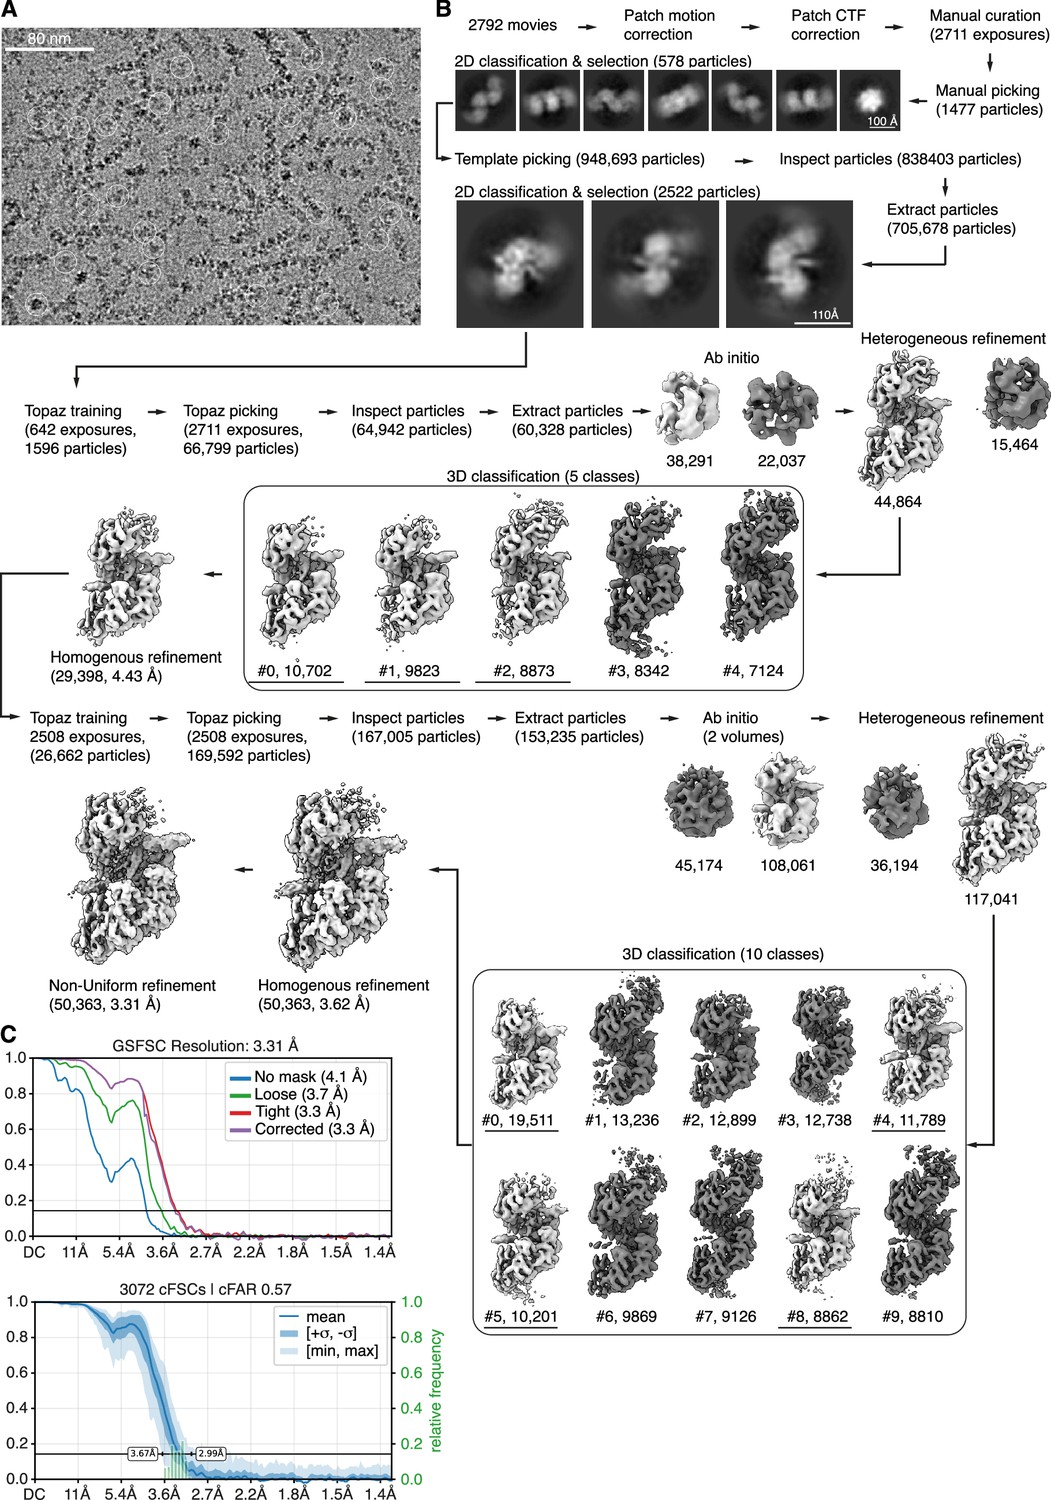
CryoEM dataset #1 (free-end DNA) processing.
3D reconstructions in light grey were used for further processing. (A) Representative micrograph with superimposed particles from final particle set. (B) Processing workflow. (C) Fourier shell correlation (FSC) curve with 0.143 threshold line (top) and conical FSC curve for directional resolution analysis (bottom).
Figure 1—figure supplement 3
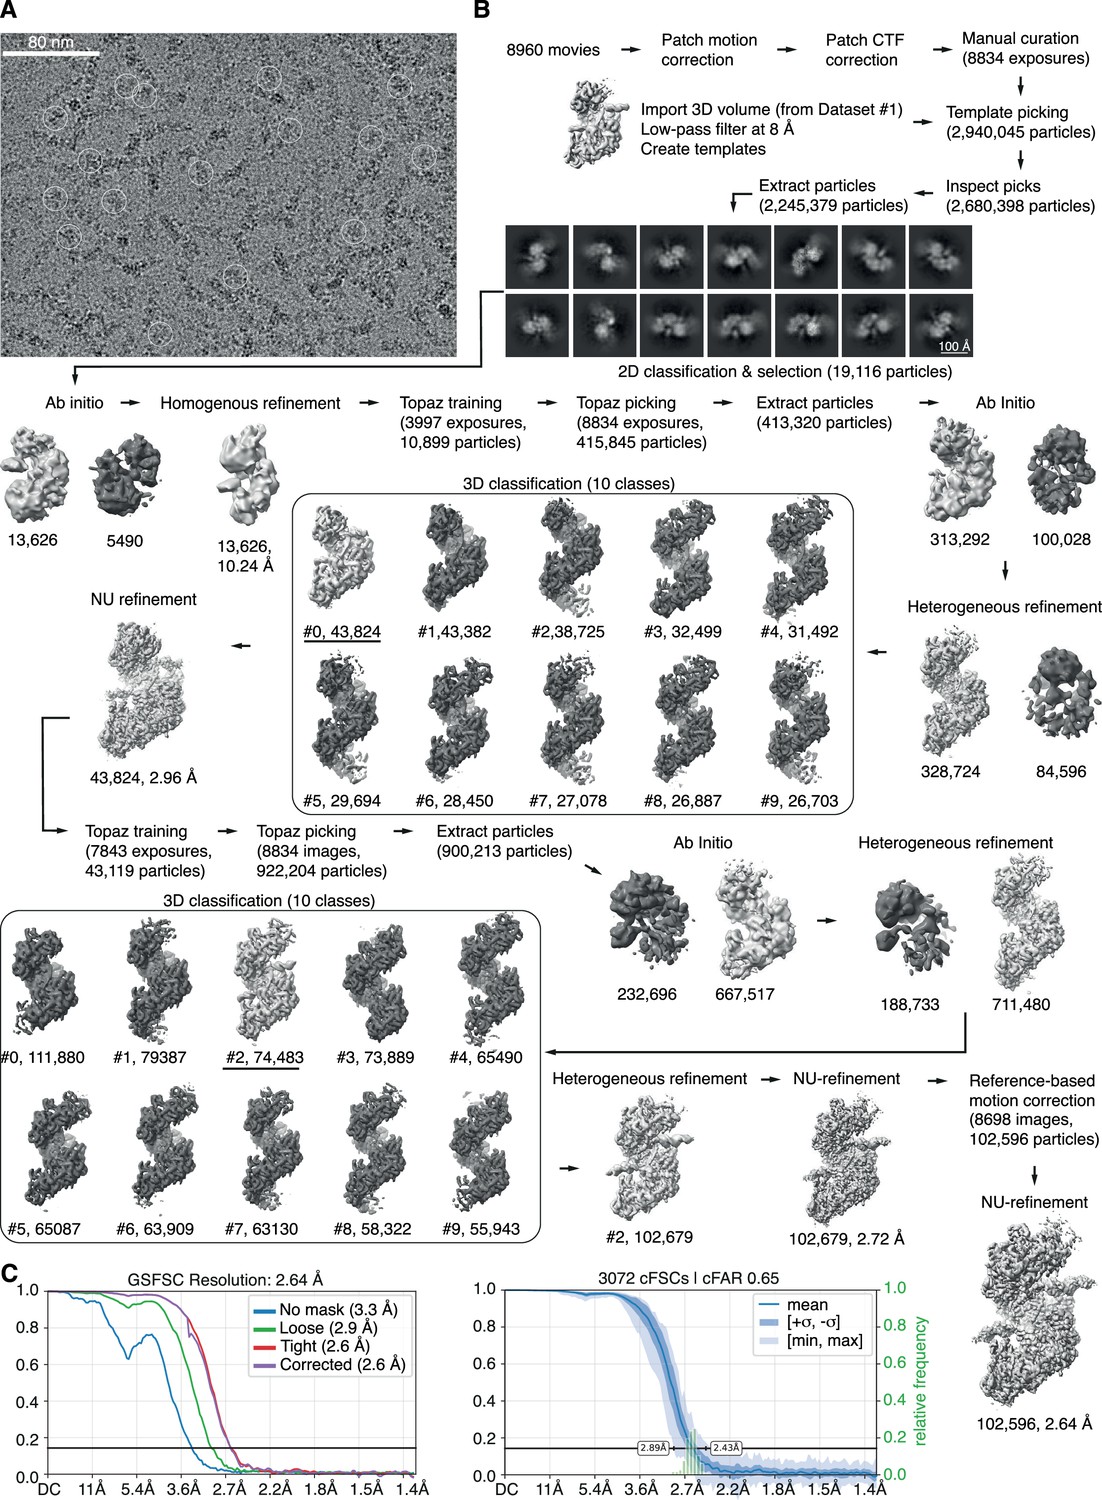
CryoEM dataset #2 (streptavidin-capped DNA) processing.
3D reconstructions in light grey were used for further processing. (A) Representative micrograph with superimposed particles from final particle set. (B) Processing workflow. (C) Fourier shell correlation (FSC) curve with 0.143 threshold line (left) and conical FSC curve for directional resolution analysis (right).
Figure 1—figure supplement 4
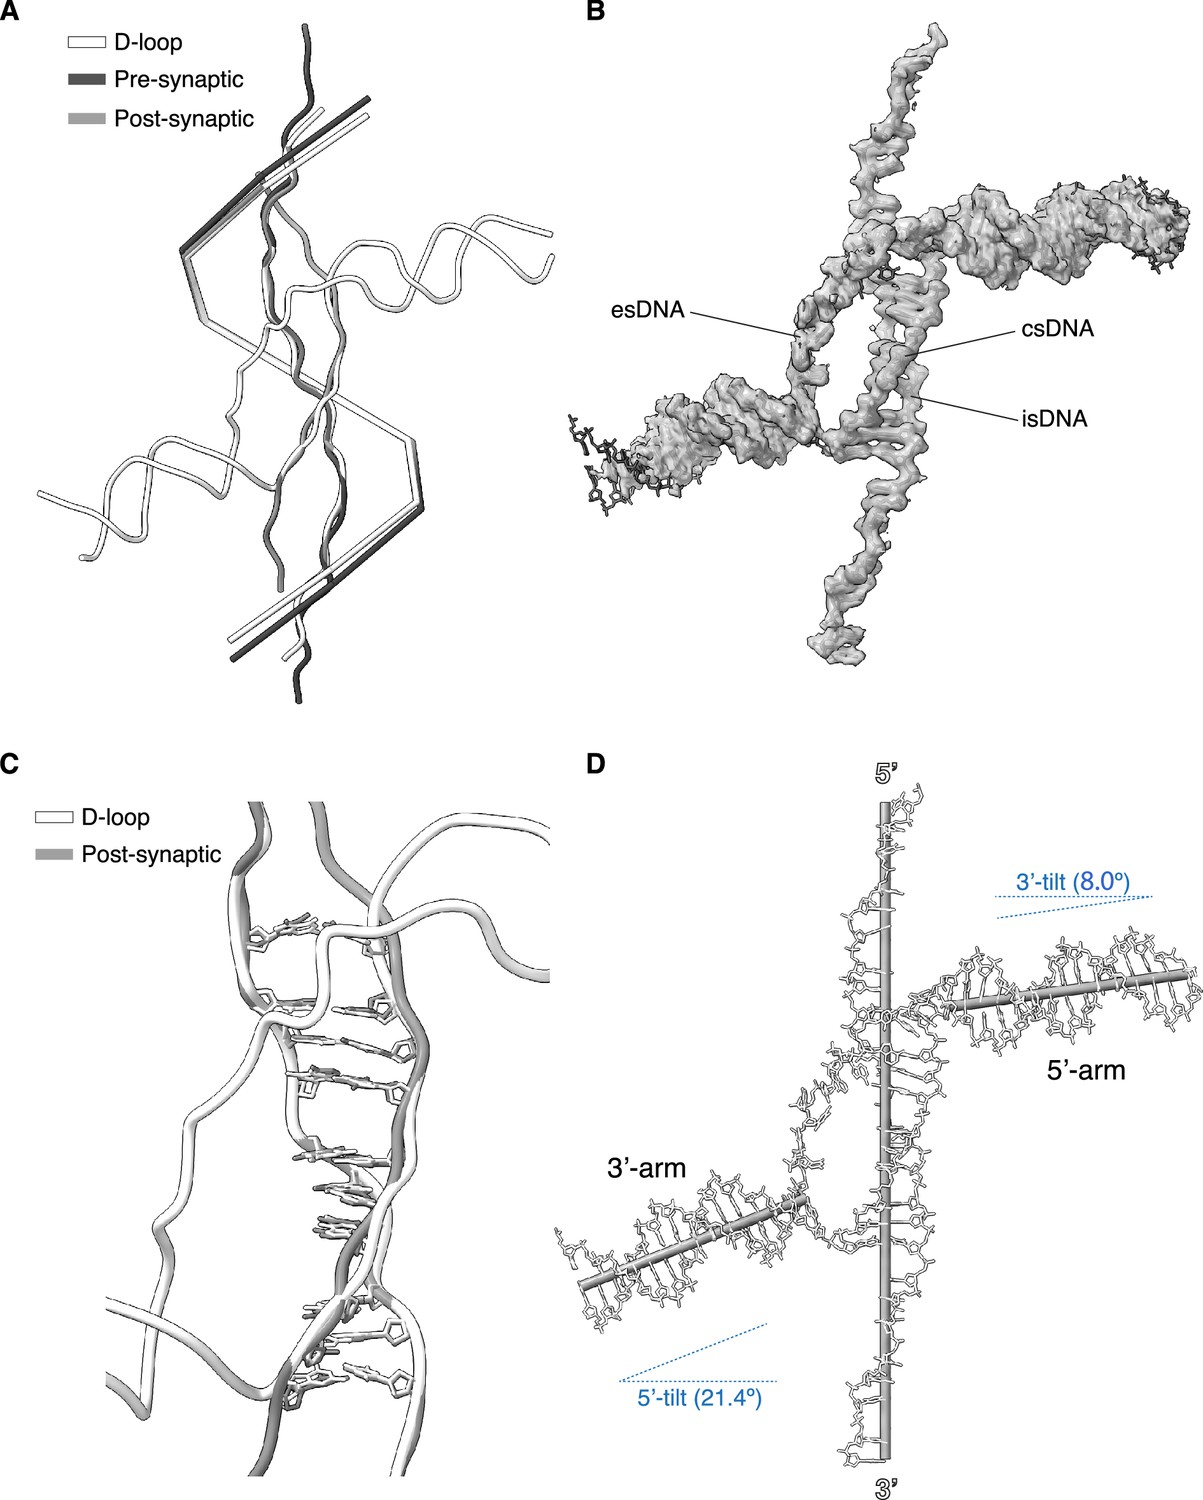
Geometric analysis of displacement loop (D-loop) DNA.
(A) Superposition of D-loop, pre-synaptic (PDB ID: 8BQ2) and post-synaptic (PDB ID: 8BR2) filament structures. Only the DNA is shown, as a tube ribbon coloured white (D-loop), grey (post-synaptic DNA), and dark grey (pre-synaptic DNA). The centroid positions of the RAD51 protomers in each structure are joined to generate a trajectory representative of the filament pitch for each structure. (B) Details of the cryoEM map for the D-loop DNA, with superimposed atomic model of the DNA strands. (C) Superposition of D-loop and post-synaptic DNA, oriented and coloured as in panel A, showing the base pairs in the homologous pairing sequence of the D-loop and post-synaptic double-stranded DNA (dsDNA). (D) Orientation of the axes of the arms of the donor dsDNA relative to the filament axis. The axes are drawn as cylinders and were fitted based on the centroid positions of the base pairs (for the donor arms) or the nucleotides of single-stranded DNA (ssDNA) in the filament. The tilt angles of the dsDNA arms relative to the filament axis are indicated.
Figure 1—figure supplement 5
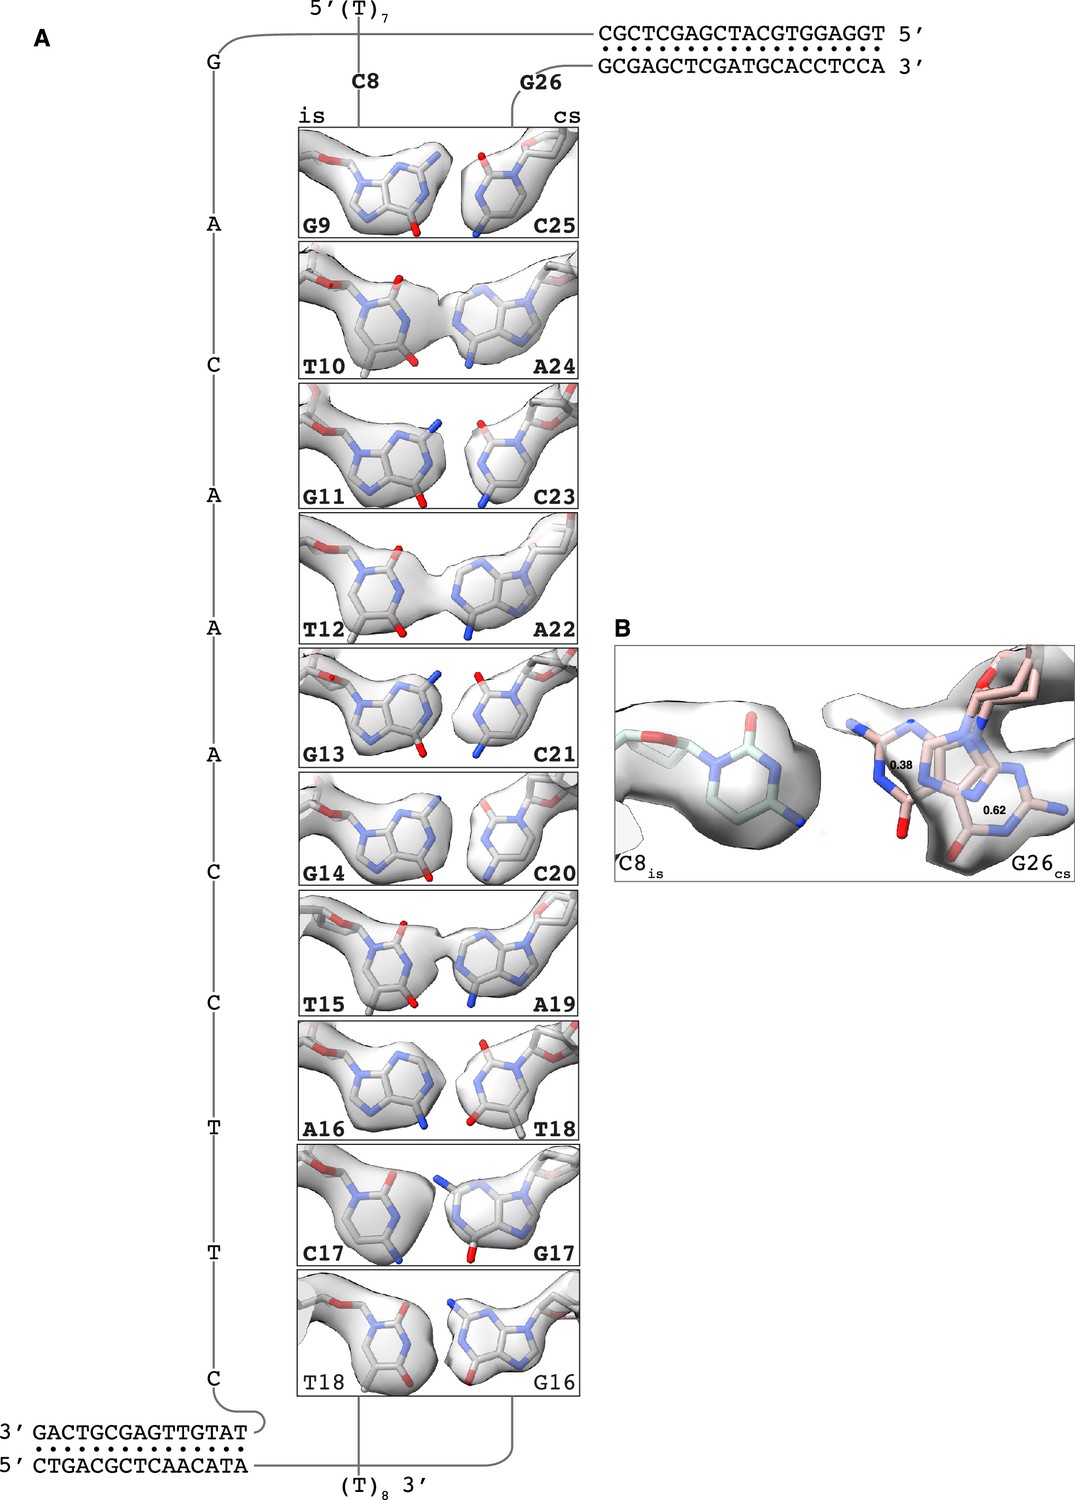
CryoEM density for homologous base pairing.
Details of the cryoEM map for the base pairs formed by the invading strand (is) of the filament DNA with the complementary strand (cs) of the donor DNA. Nucleotides designed to base pair in the displacement loop (D-loop) structure are in bold. (A) Homologous base pairing. (B) Base conformation for the designed C8is:G26cs pair. Occupancy values for the two G26 conformations are reported in the panel.
Figure 1—video 1
CryoEM structure of human RAD51 D-loop.
Figure 2
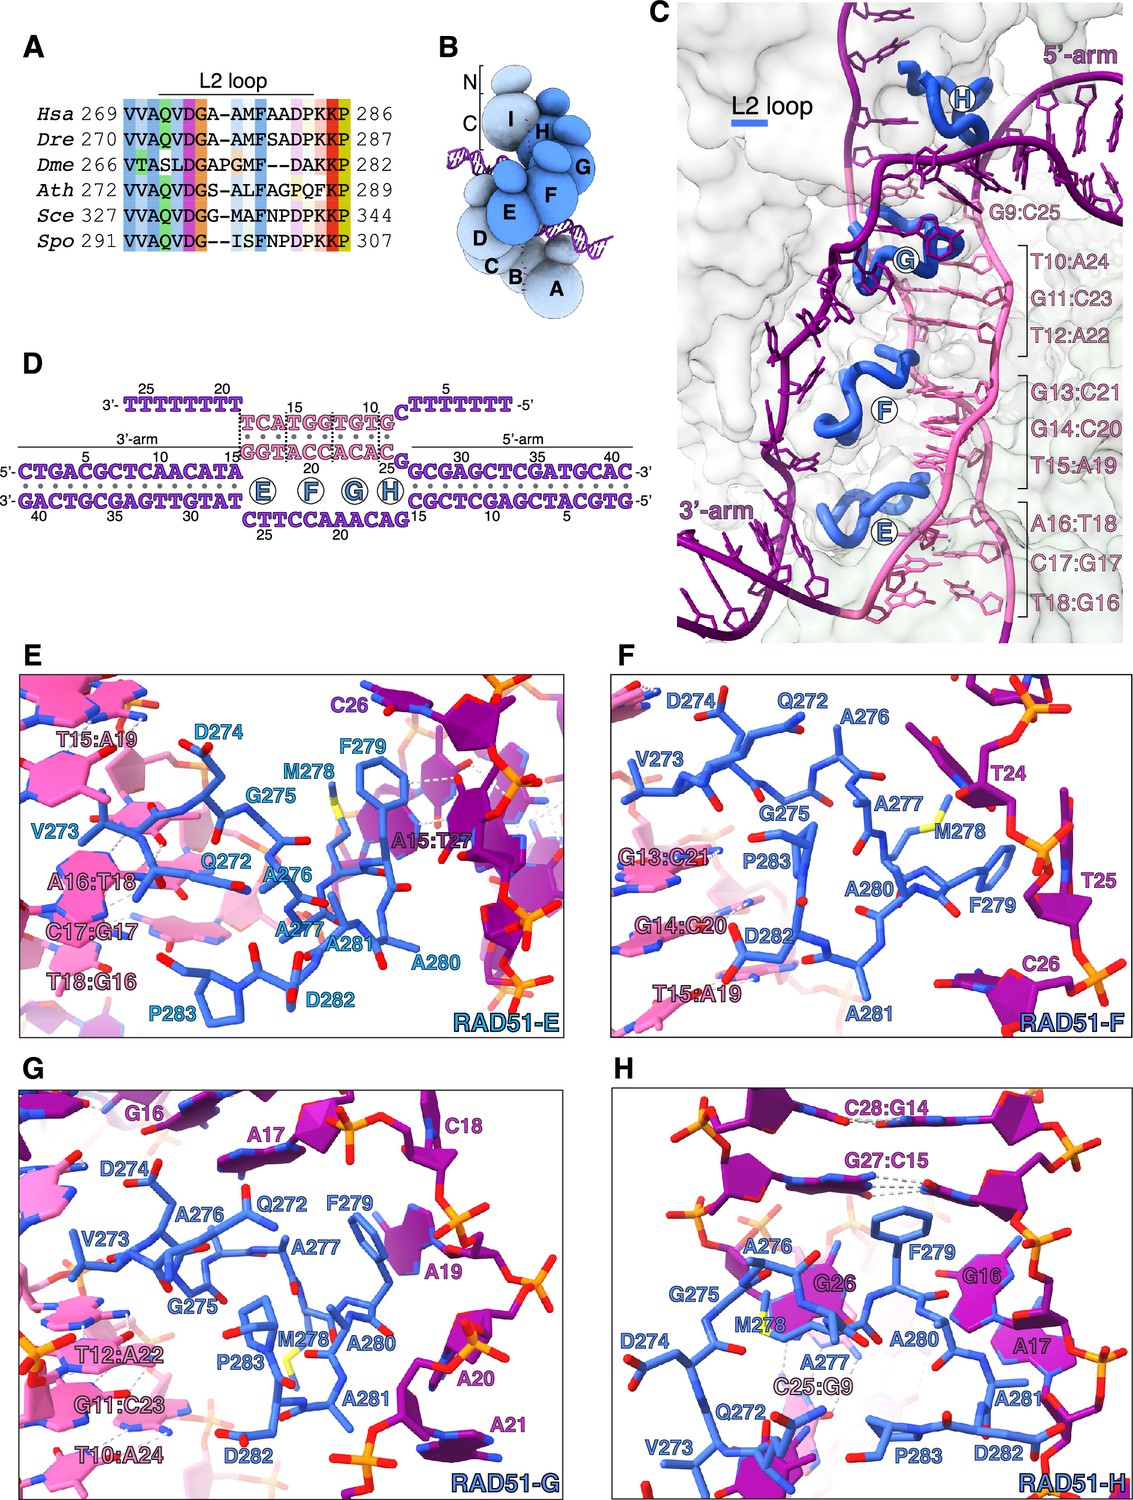
Donor DNA unwinding.
(A) Multiple sequence alignment of RAD51 L2 loop sequences, coloured according to conservation based on the Clustal scheme (Hsa: human, Dre: zebrafish, Dme: fly, Ath: arabidopsis, Sce: budding yeast, Spo: fission yeast). (B) Schematic drawing of the RAD51 displacement loop (D-loop). The N- and C-terminal domains of each RAD51 protomer are shown as spheres of size proportional to mass. RAD51 E, F, G, and H are coloured in blue, the other protomers in pale blue. (C) Ribbon drawing of the L2 loop insertion into the donor DNA for RAD51-E, F, G, and H. The L2 loops are drawn as thick blue tubes, and the rest of the RAD51 protein is represented as transparent surface. The DNA strands are drawn as narrow tubes with the nucleotides shown as sticks; the DNA strands are coloured dark magenta except for the homologous sequences of the invading and complementary strands, coloured in pink. (D) Nucleotide sequences and observed base pairing of the D-loop DNA. Sequences are coloured in dark magenta and pink as in panel C. The approximate position of the L2-loop insertion in the unwound donor DNA is marked with the name of the RAD51 protomer. Vertical dashed lines mark the extent of donor DNA unwinding for each L2 insertion. (E–H) Cartoon drawings of the interface between the L2 loop of RAD51-E (panel E), RAD51-F (panel F), RAD51-G (panel G), RAD51-H (panel H) with the donor DNA. L2-loop amino acids and DNA-strand nucleotides are drawn as sticks and carbon-coloured as in panel C. The nucleotide bases are shown as filled rings, and the Watson-Crick hydrogen bonds are drawn as dashed lines.
Figure 3
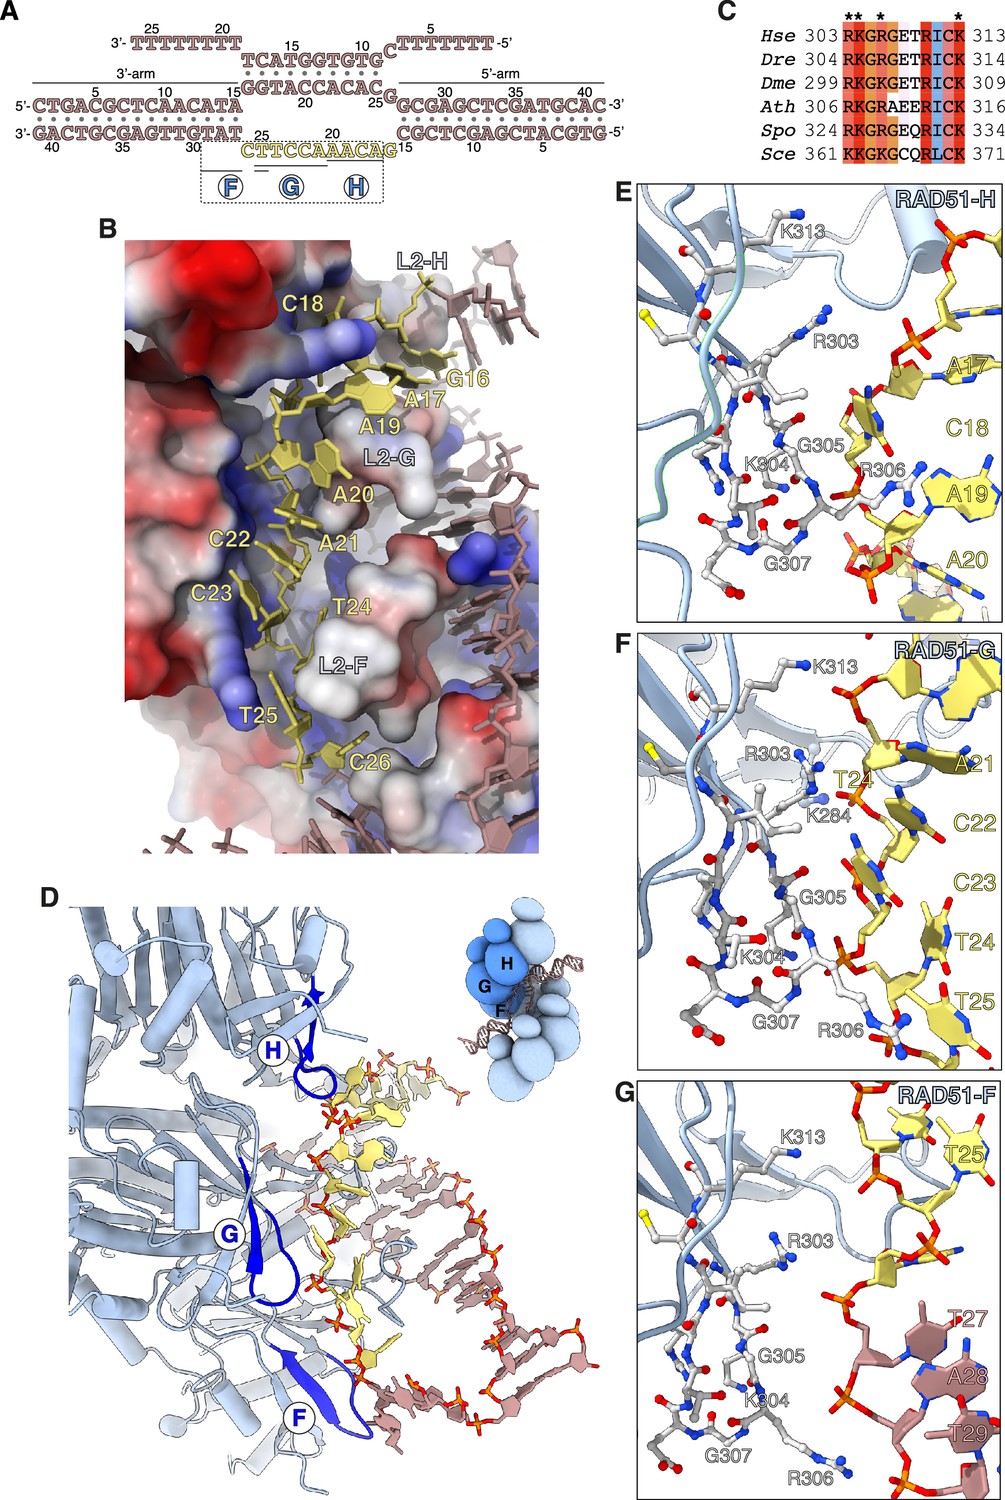
Capture of the exchanged strand.
(A) Nucleotide sequences and observed base pairing of the displacement loop (D-loop) DNA. The exchanged strand DNA (esDNA) sequence is in yellow, the rest of the D-loop DNA in light brown. The span of esDNA bound by each of RAD51-H, -G, and -F is underlined. (B) Drawing of esDNA capture in a basic channel of the filament, aligned with the filament axis. The DNA is shown as a full-atom model with filled rings for the ribose and the bases, coloured in yellow for the captured esDNA nucleotides and light brown for the rest. Filament RAD51 is shown in surface representation, coloured according to electrostatic potential from blue (basic) to red (acidic). (C) Multiple sequence alignment of RAD51 esDNA-binding sequences, coloured according to conservation based on the Clustal scheme (Hsa: human, Dre: zebrafish, Dme: fly, Ath: arabidopsis, Sce: budding yeast, Spo: fission yeast). (D) Ribbon drawing of the interface between the filament and the captured esDNA, highlighting the position of the esDNA-binding beta hairpins of RAD51-H, -G, and -F in blue. The DNA is drawn as in panel B. The inset shows a schematic cartoon of the RAD51 D-loop, drawn as in Figure 2B, to emphasise the position of RAD51-H, -G, -F in the filament. (E–G) Drawings of the interface between the beta hairpin amino acids of RAD51-H (panel E), RAD51-G (panel F), RAD51-F (panel G), and the esDNA. Beta hairpin residues and esDNA nucleotides are drawn as sticks; amino acids are coloured according to atom type, whereas esDNA nucleotides are coloured as in panel D.
Figure 4
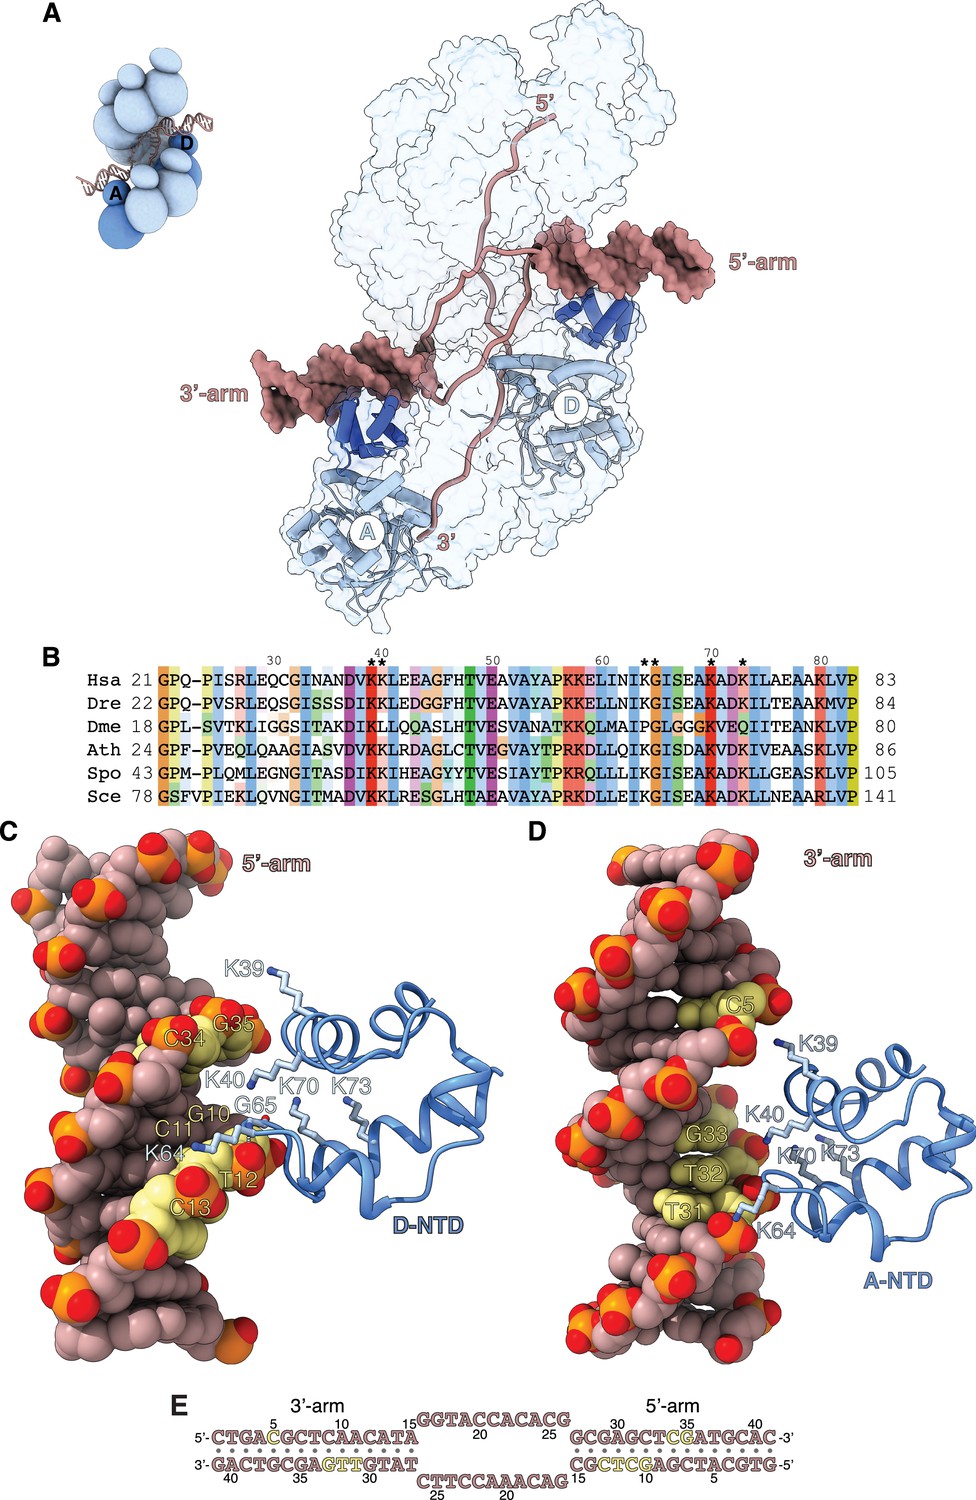
Filament engagement of the donor DNA arms.
(A) Drawing of the displacement loop (D-loop) structure that highlights the interaction of RAD51-A and -D with the 3’- and 5’-arms of the duplex donor DNA, respectively. RAD51-A and -D are drawn as cylinder cartoons in pale blue with their NTDs in blue. The donor DNA arms are shown as molecular surfaces in light brown while the rest of the DNA is drawn as narrow tubes. The filament is shown as a transparent surface. The inset shows a schematic cartoon of the D-loop structure to highlight the position of the RAD51-A and -D protomers. (B) Multiple sequence alignment of RAD51 NTD sequences, coloured according to conservation based on the Clustal scheme (Hsa: human, Dre: zebrafish, Dme: fly, Ath: arabidopsis, Sce: budding yeast, Spo: fission yeast). (C, D) The interaction of RAD51-D and -A NTD with the 5’- and 3’-arms, respectively. The protein is drawn as a ribbon, with the side chains as sticks. The hydrogen bond between the main-chain nitrogen of G65 and the phosphate group of T12 is drawn as a dashed line. The DNA is in spacefill representation; the nucleotides contacted by the NTD are coloured yellow, and the rest of the DNA is light brown. (E) Nucleotide sequence of the donor DNA, coloured as in panels C and D.
Figure 5 with 5 supplements
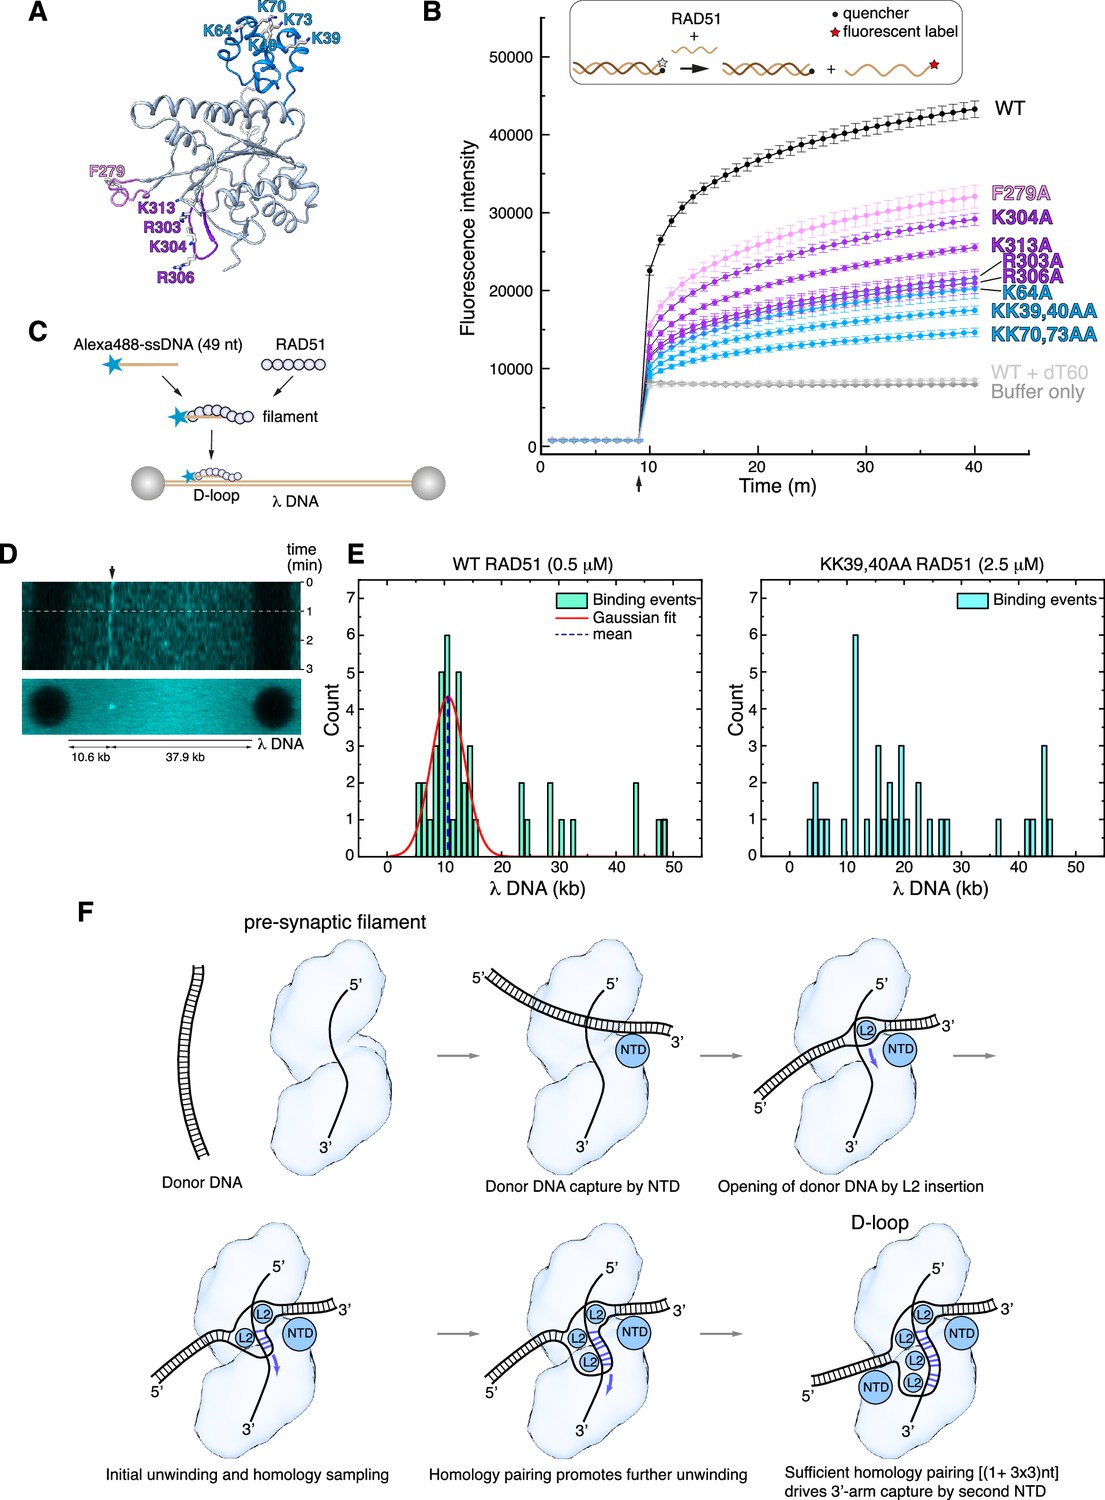
Structure-based mutagenesis of the RAD51 displacement loop (D-loop).
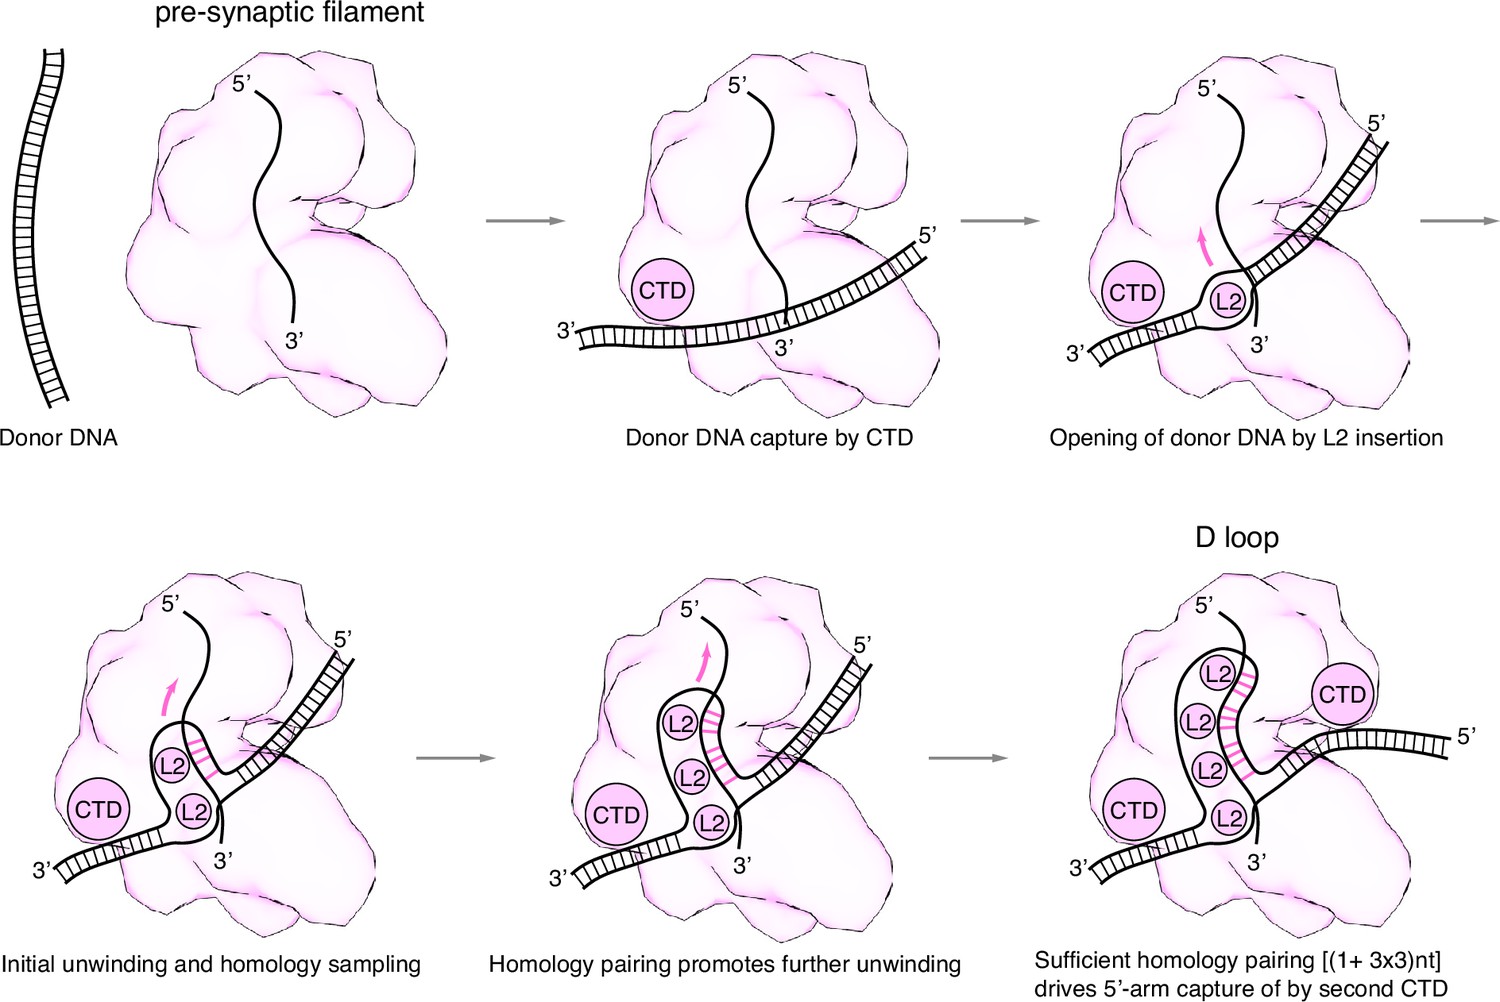
(A) Ribbon drawing of RAD51, highlighting residues targeted for alanine mutagenesis, colour-coded according to their role in D-loop formation (F279 in pink; R303, K304, R306, K313 in magenta; K39, K40, K64, K70, K73 in light blue). (B) Strand-exchange assay showing the change in fluorescence for each RAD51 mutant following injection of the complementary strand after 9 min, with traces coloured according to amino acid as in panel A. Error bars denote the standard deviation of three independent replicates. The upper panel shows a diagrammatic representation of the assay, with DNA shown as light or dark brown lines and the fluorophore and quencher represented as in the key. (C) Schematic drawing of the experimental setup for single molecule analysis of RAD51 D-loop formation. (D) Kymograph of a representative D-loop formation event. The upper panel shows a time-lapse fluorescence intensity scan of the λ DNA, with a stable binding event at the expected target site (10.6 kb, indicated by the arrow). The white dashed line marks the first 60 s interval that was used in frame acquisition. The lower panel shows a summed projection of the fluorescence signal over the acquisition time. (E) Quantification of RAD51 filament binding events. The left-side histogram displays the binding profile of wild-type RAD51 (0.5 μM), showing a Gaussian distribution of binding events centred on the expected position of the complementary sequence (~10.6 kb), consistent with specific single-stranded DNA (ssDNA) pairing and D-loop formation. The right-side histogram shows the binding profile of the KK39,40AA RAD51 double mutant (2.5 μM). (F) Mechanism of D-loop formation by RAD51 nucleoprotein filaments.
Figure 5—figure supplement 1
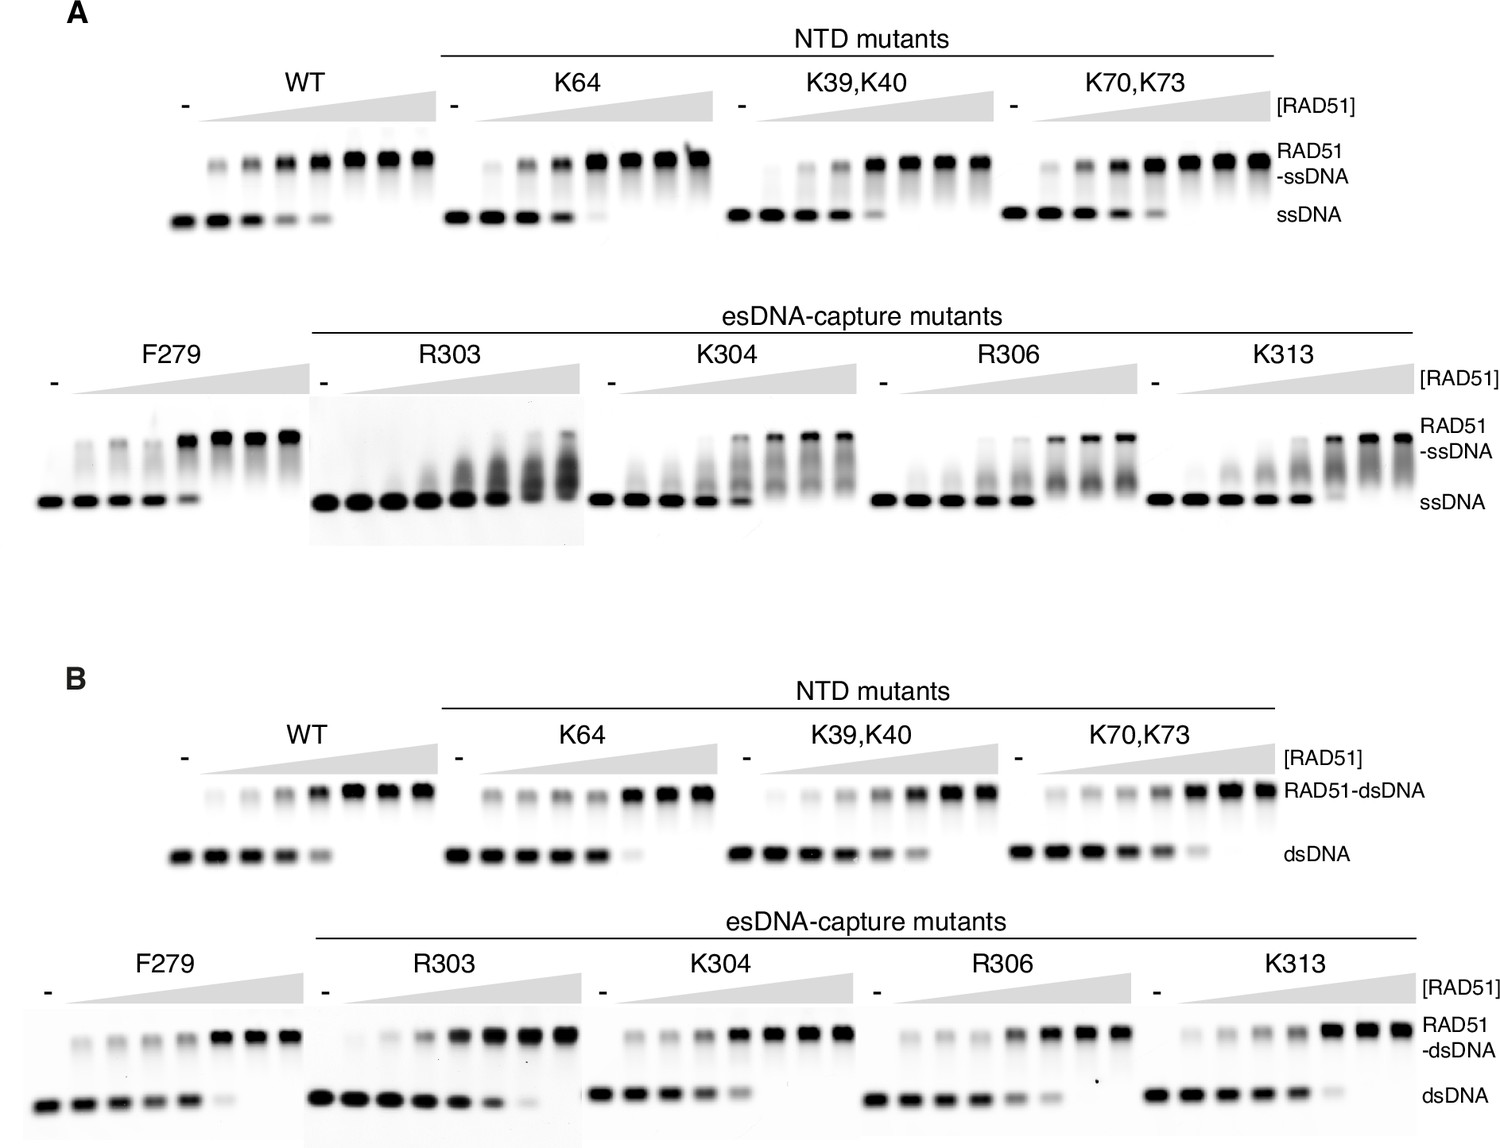
Electrophoretic mobility shift assay for the interaction of RAD51 mutants with single-stranded DNA (ssDNA) (A) and double-stranded DNA (dsDNA) (B).
For each mutant, increasing protein concentrations (0.5, 1, 2, 4, 6, 8, 10 µM) were titrated against a fixed amount of DNA (0.5 µM).
-
Figure 5—figure supplement 1—source data 1
Original gel images for Figure 5—figure supplement 1A and B.
- https://cdn.elifesciences.org/articles/107114/elife-107114-fig5-figsupp1-data1-v1.zip
-
Figure 5—figure supplement 1—source data 2
Uncropped gel images for Figure 5—figure supplement 1A and B.
- https://cdn.elifesciences.org/articles/107114/elife-107114-fig5-figsupp1-data2-v1.zip
Figure 5—figure supplement 2
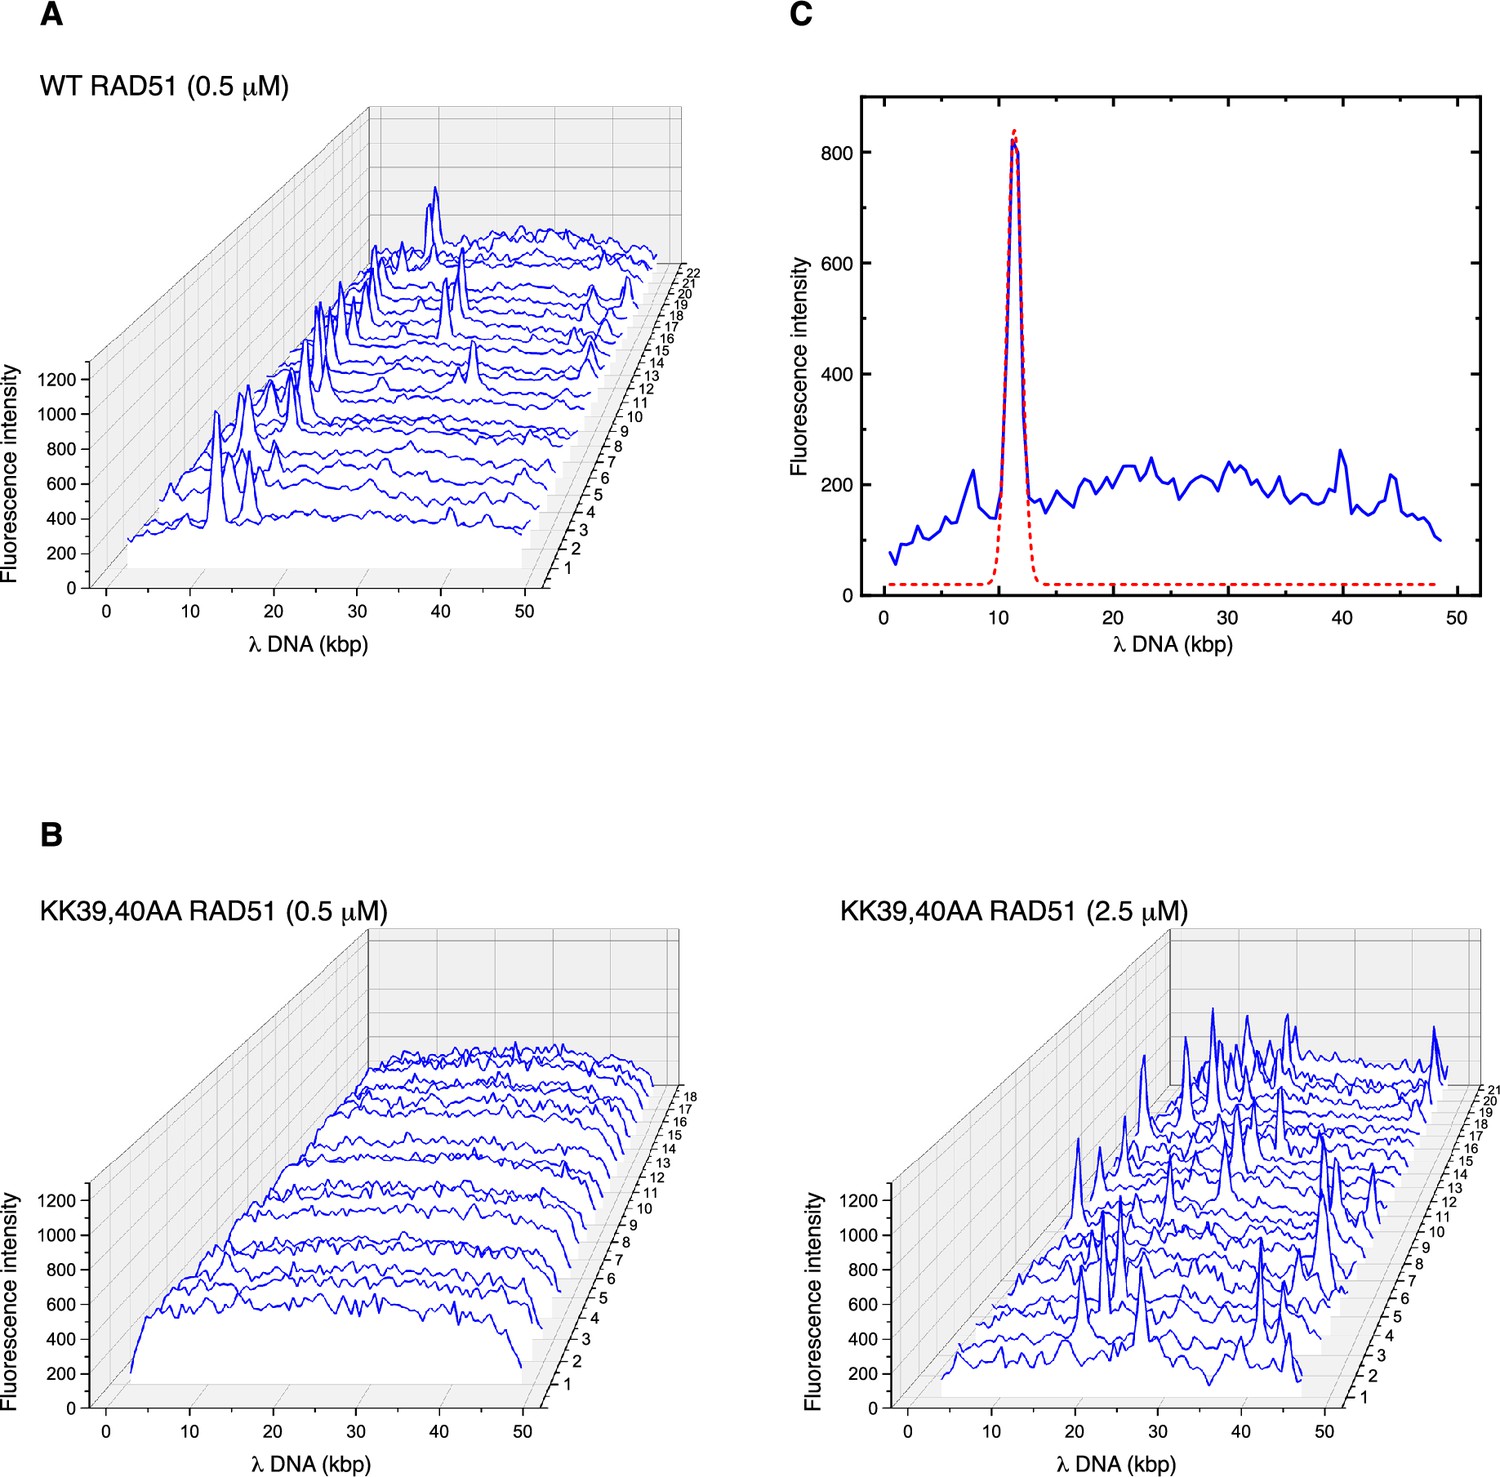
Fluorescence intensity traces extracted from 2D scans of trapped DNA molecules.
(A) Traces for the wild-type RAD51 filaments. (B) Traces for KK39,40AA RAD51 mutant filaments, at 0.5 mM (left) and 2.5 mM (right). (C) Gaussian peak fitting for a representative trace of wild-type RAD51.
Figure 5—figure supplement 3
Mechanism of displacement loop (D-loop) formation by the RecA nucleoprotein filament.
Figure 5—figure supplement 4
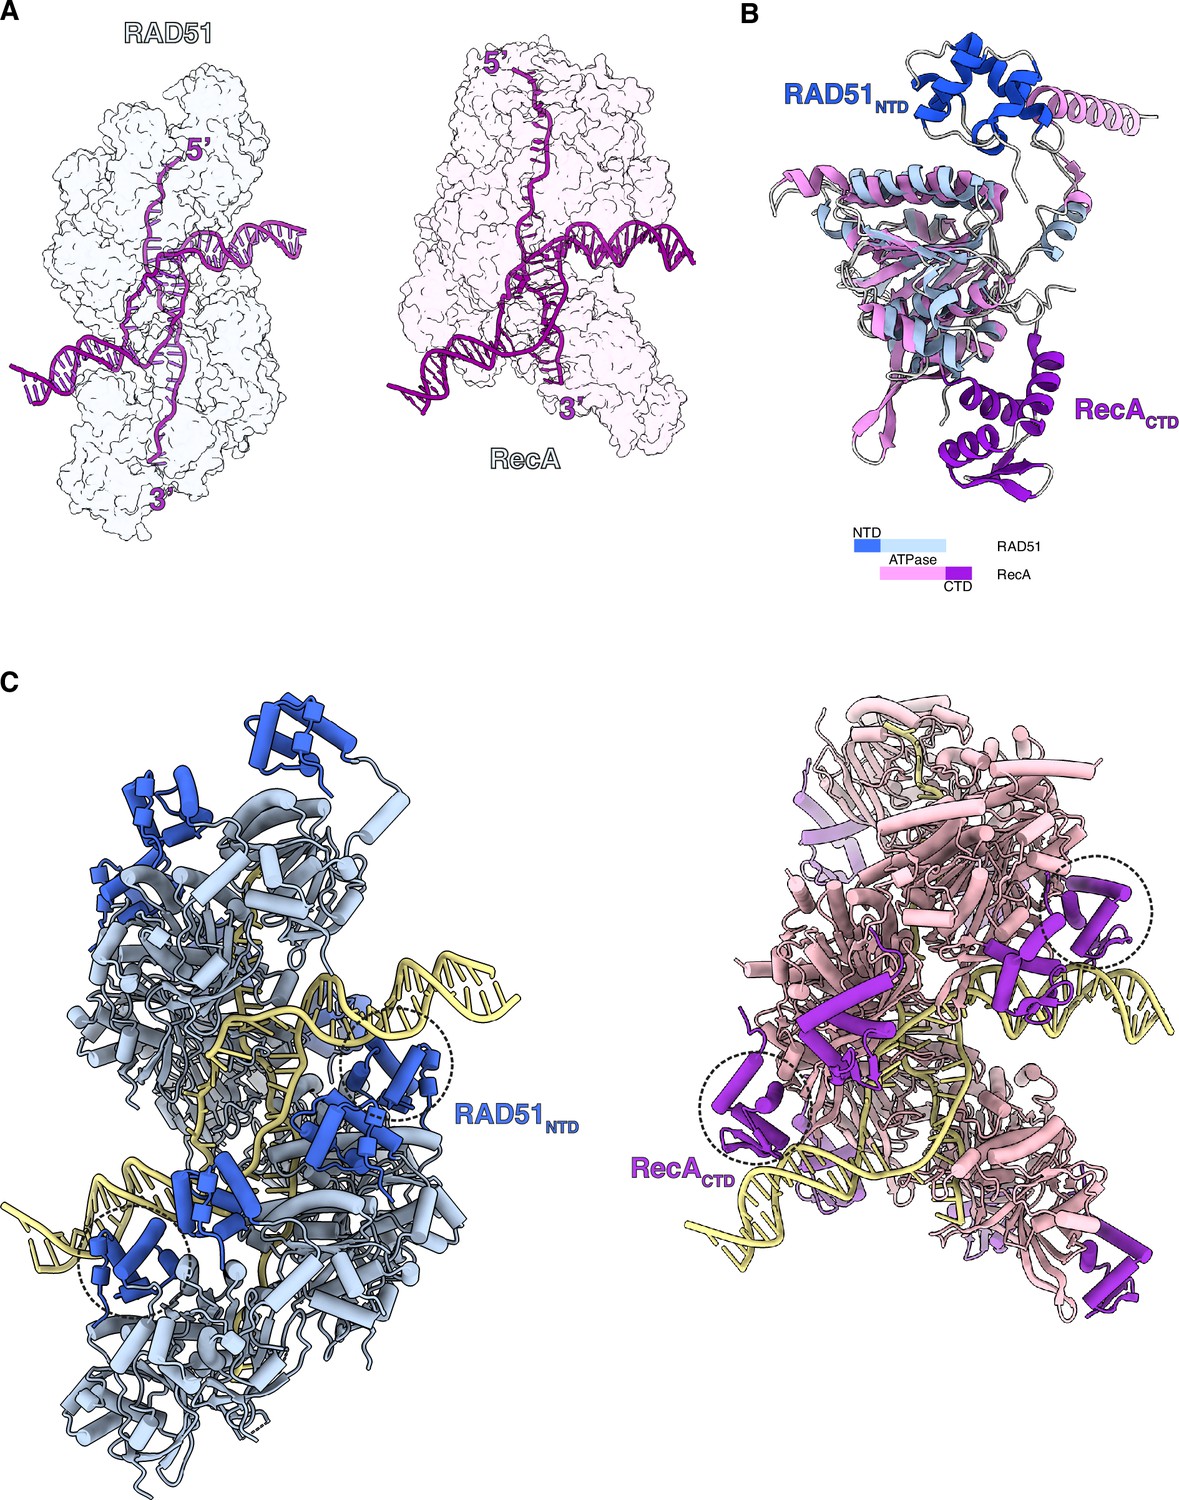
Comparison of RAD51 and RecA displacement loop (D-loop) structures.
(A) Side-by-side transparent surface representation of RAD51 (left, in light blue) and RecA (right, in light pink) D-loops, with DNA strands drawn as purple tubes. (B) Superposition of RAD51 and RecA protomers, coloured according to the colour key. (C) Side-by-side cylinder representation of RAD51 (left) and RecA (right) D-loops. The DNA-binding RAD51-NTD and RecA-CTD are coloured blue and magenta, respectively. The RAD51-NTD and RecA-CTD that contact the DNA are highlighted with dashed circles. The PDB accession code for the RecA D-loop is 7JY9.
Figure 5—figure supplement 5
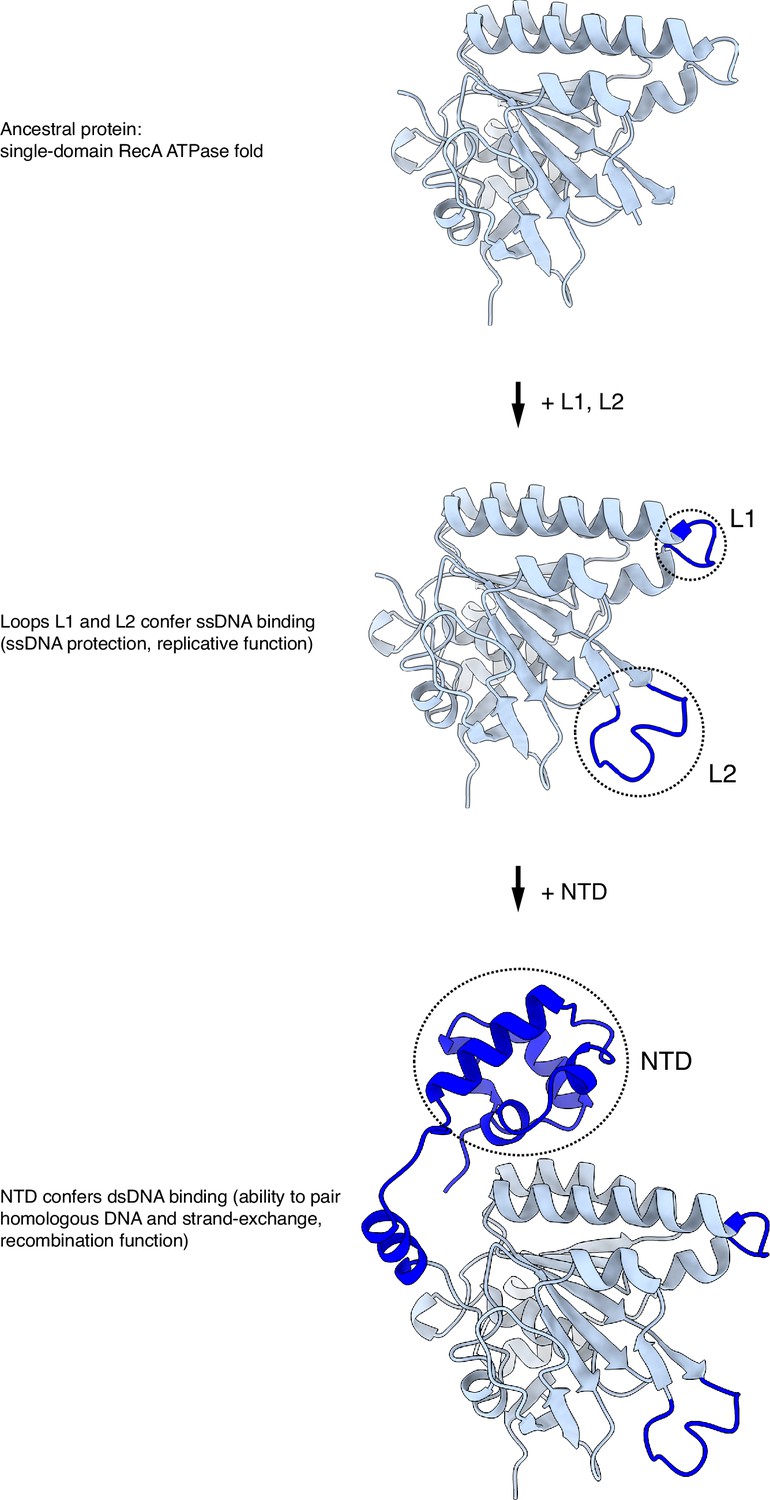
Proposed steps in the functional evolution of the RecA/RAD51 recombinases.
Additional files
-
Supplementary file 1
Oligonucleotide sequence, size, and labelling.
- https://cdn.elifesciences.org/articles/107114/elife-107114-supp1-v1.docx
-
Supplementary file 2
CryoEM data collection and real-space refinement.
- https://cdn.elifesciences.org/articles/107114/elife-107114-supp2-v1.docx
-
MDAR checklist
- https://cdn.elifesciences.org/articles/107114/elife-107114-mdarchecklist1-v1.docx
Download links
A two-part list of links to download the article, or parts of the article, in various formats.
Downloads (link to download the article as PDF)
Open citations (links to open the citations from this article in various online reference manager services)
Cite this article (links to download the citations from this article in formats compatible with various reference manager tools)
Structural mechanism of strand exchange by the RAD51 filament
eLife 14:RP107114.
https://doi.org/10.7554/eLife.107114.3


