A new class of cyclin dependent kinase in Chlamydomonas is required for coupling cell size to cell division
- The Salk Institute for Biological Studies, United States
- University of Florida, United States
- Donald Danforth Plant Science Center, United States
Figures
Figure 1 with 1 supplement
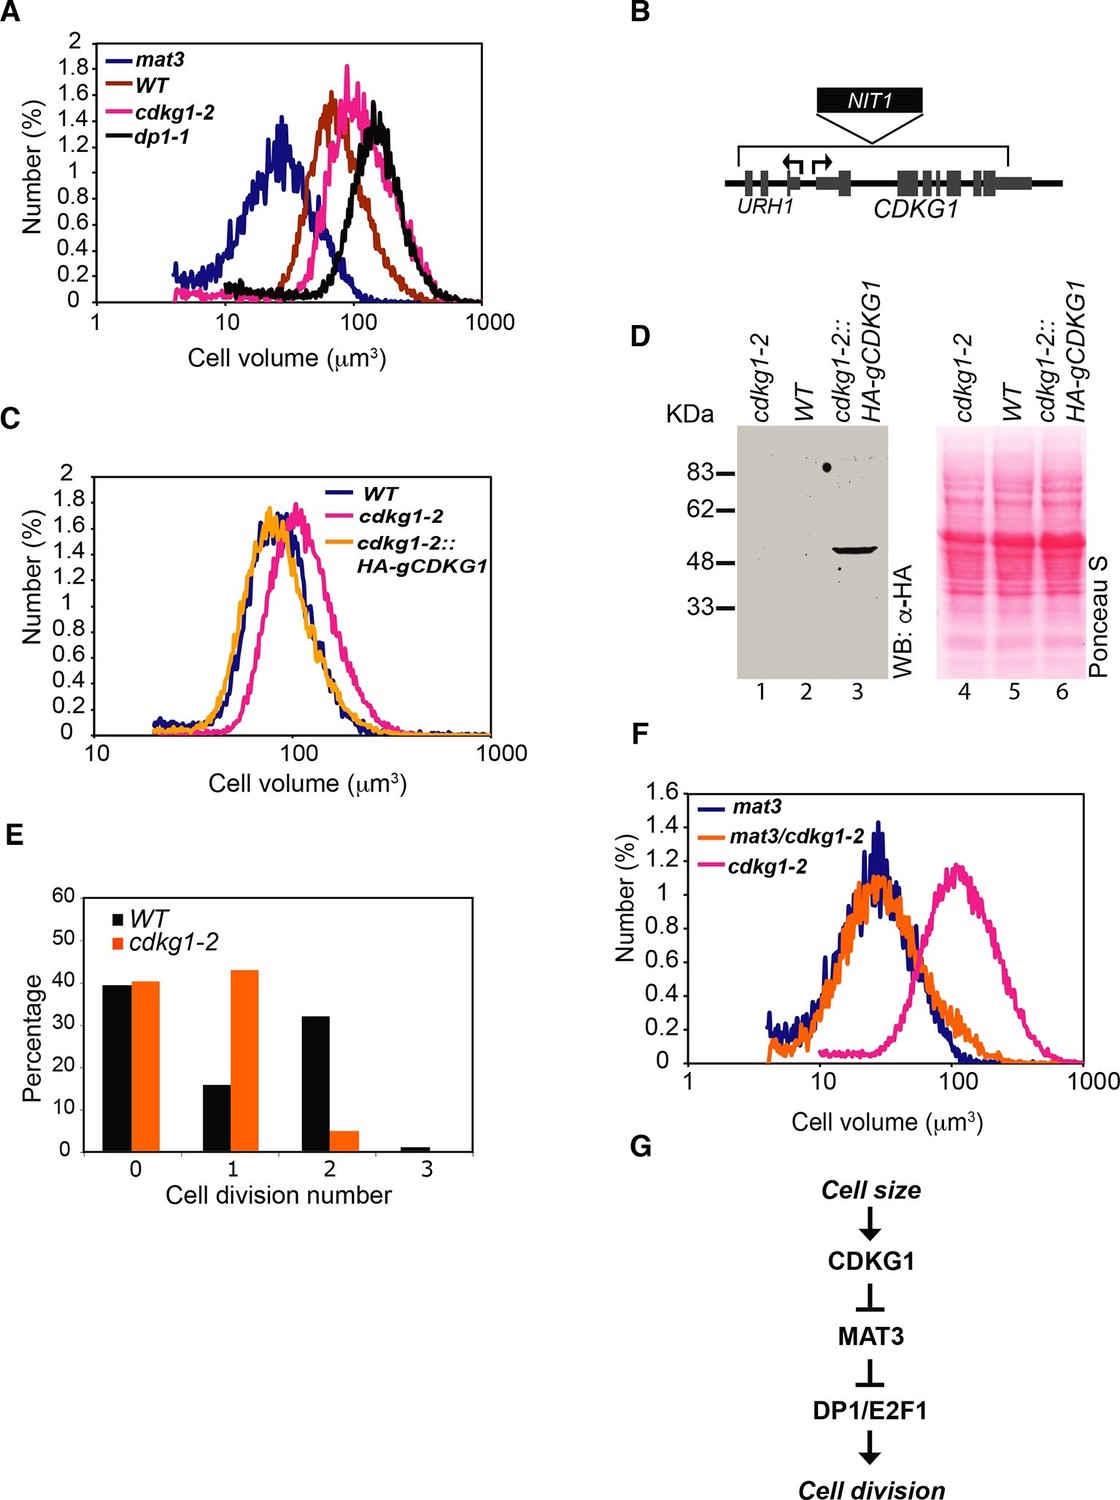
CDKG1 functions in size control upstream of MAT3/RBR.
(A) Size distributions of daughter cells from indicated strains. (B) Schematic of CDKG1 locus and cdkg1-2 mutation that has a partial genomic deletion (in brackets) and insertion of the NIT1 marker (shown in black). Tall gray bars, exons; narrow gray bars, untranslated regions; narrow black bars, introns and intergenic regions of CDKG1 and URH1. Black arrows indicate transcription starts for CDKG1 and URH1. (C) Size distributions of daughter cells from wild type (WT), cdkg1-2 and complemented cdkg1-2::HA-gCDKG1 strains. (D) Lanes 1–3, Western blot with anti-HA antibodies of total protein from cdkg1-2 (lane 1), wild type (lane 2) and complemented cdkg1-2::HA-CDKG1 (lane 3) strains using anti-HA antibodies. A single band at the predicted mass for HA-CDKG1 (~50kDa) is in Lane 3. Lanes 4–6, blot stained with Ponceau S to visualize total loaded protein. (E) Unsynchronized wild type and cdkg1-2 cells were plated on HSM agar in the dark and division numbers were scored by percentage in each category: 0—no division (pre-Commitment), 1—one division (two daughters), 2—two divisions (four daughters), and 3—three divisions (eight daughters). (F) Size distributions of daughter cells from mat3-4, mat3-4 cdkg1-2, and cdkg1-2 strains. (G) Epistasis hierarchy of size control mutants in Chlamydomonas.
Figure 1—figure supplement 1
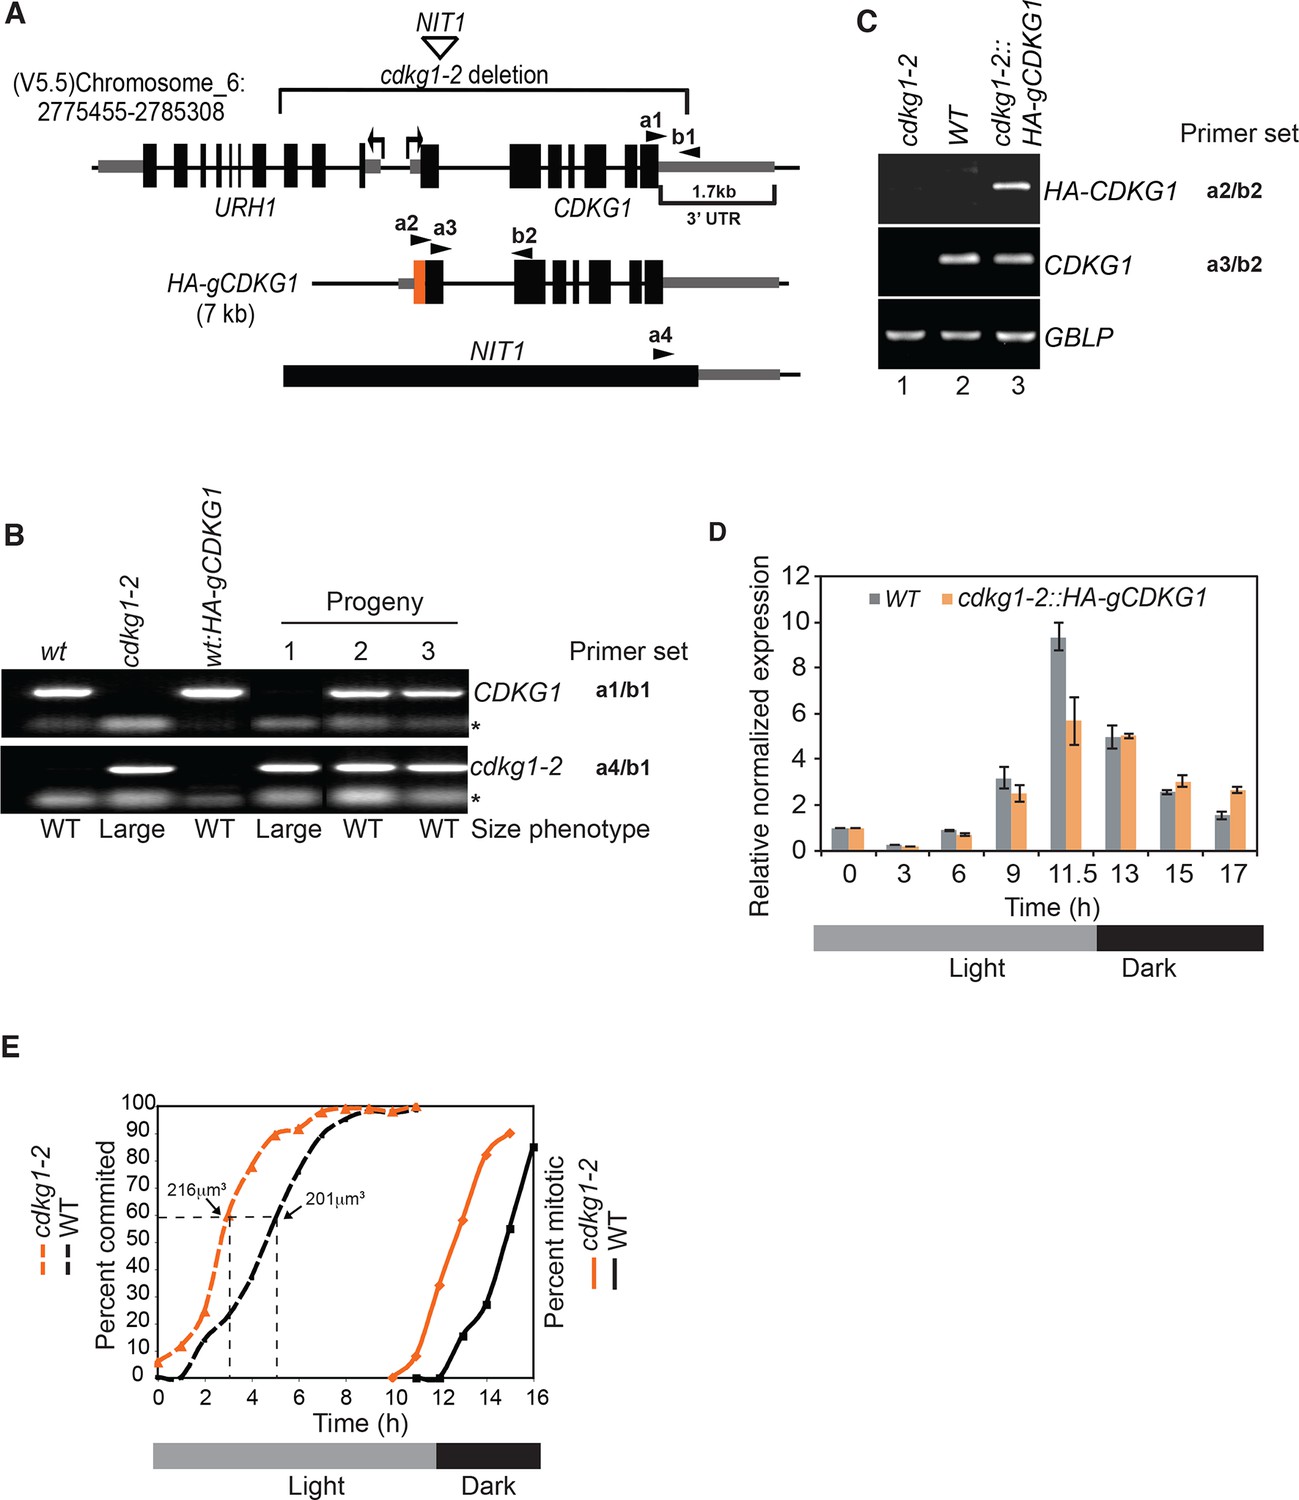
Cell cycle progression and complementation of cdkg1-2.
(A) Schematic representation of the CDKG1 locus and cdkg1-2 allele caused by insertion of a NIT1 plasmid and accompanying deletion (upper bracketed region). Coordinates are from genome assembly V5.5 taken from Phytozome (http://phytozome.jgi.doe.gov). Tall black rectangles represent exons and medium rectangles represent untranslated regions (UTR). Thin lines represent introns and intergenic regions. The lower bracketed region marks the 1.7kb 3’ UTR of CDKG1. Arrows represent the transcriptional starts and direction of transcription for URH1 and CDKG1. Arrowheads mark binding sites for PCR primers used for genotyping: a1/b1 for CDKG1 last exon and adjacent 3’ UTR region, a4/b1 for NIT1 and CDKG1 3’ UTR junction (see Supplementary file 2 for detailed information). The 7 kb genomic region of the CDKG1 locus that was used to generate the HA-gCDKG1 complementation construct is shown below. The orange rectangle indicates the 3xHA tag located just downstream of the start codon. Primer sets a2/b2 and a3/b2 were used in RT-PCR experiments to amplify only HA-CDKG1 (a2/b2) or both endogenous and HA-CDKG1 cDNAs (a3/b2). (B) Ethidium bromide stained agarose gel showing genotyping PCR results for indicated strains. wt, wild-type; cdkg1-2, CDKG1 mutant strain; wt:HA-gCDKG1, transgenic line expressing HA-gCDKG1;. Results from representative non-complemented (1) and complemented (2, 3) progeny from a cross between cdkg1-2 and wt::HA-gCDKG1 are shown. Gene specific primer sets are shown on the right. Size phenotypes (large or wild type (WT)) are shown below. * Primer dimer. (C) Ethidium bromide stained agarose gel of RT-PCR products showing expression of HA-CDKG1 in a complemented cdkg1-2::HA-gCDKG1 strain. Strain genotypes are as described in panel (B). Gene specific amplicons and primer sets described in panel (A) are indicated to the right of each gel image. GBLP is an internal control. (D) Quantitative RT-PCR showing CDKG1 mRNA levels in synchronized wild-type (WT) or cdkg1-2::HA-gCDKG1 strains. All data were normalized to expression of internal control gene GBLP. Relative expression levels are shown based on values at time 0 hr that were set to 1. Error bars: S.D. of three replicates. (E) 12 hr light/12 hr dark synchronized wild type (black lines) and cdkg1-2 (orange lines) strains were monitored for passage through commitment (dashed lines), and for mitotic index (percentage in S/M phases) by light microscopy with fixed samples. The median cell size and time when the cultures had ~60% Committed cells is indicated by the dashed lines.
Figure 2 with 1 supplement
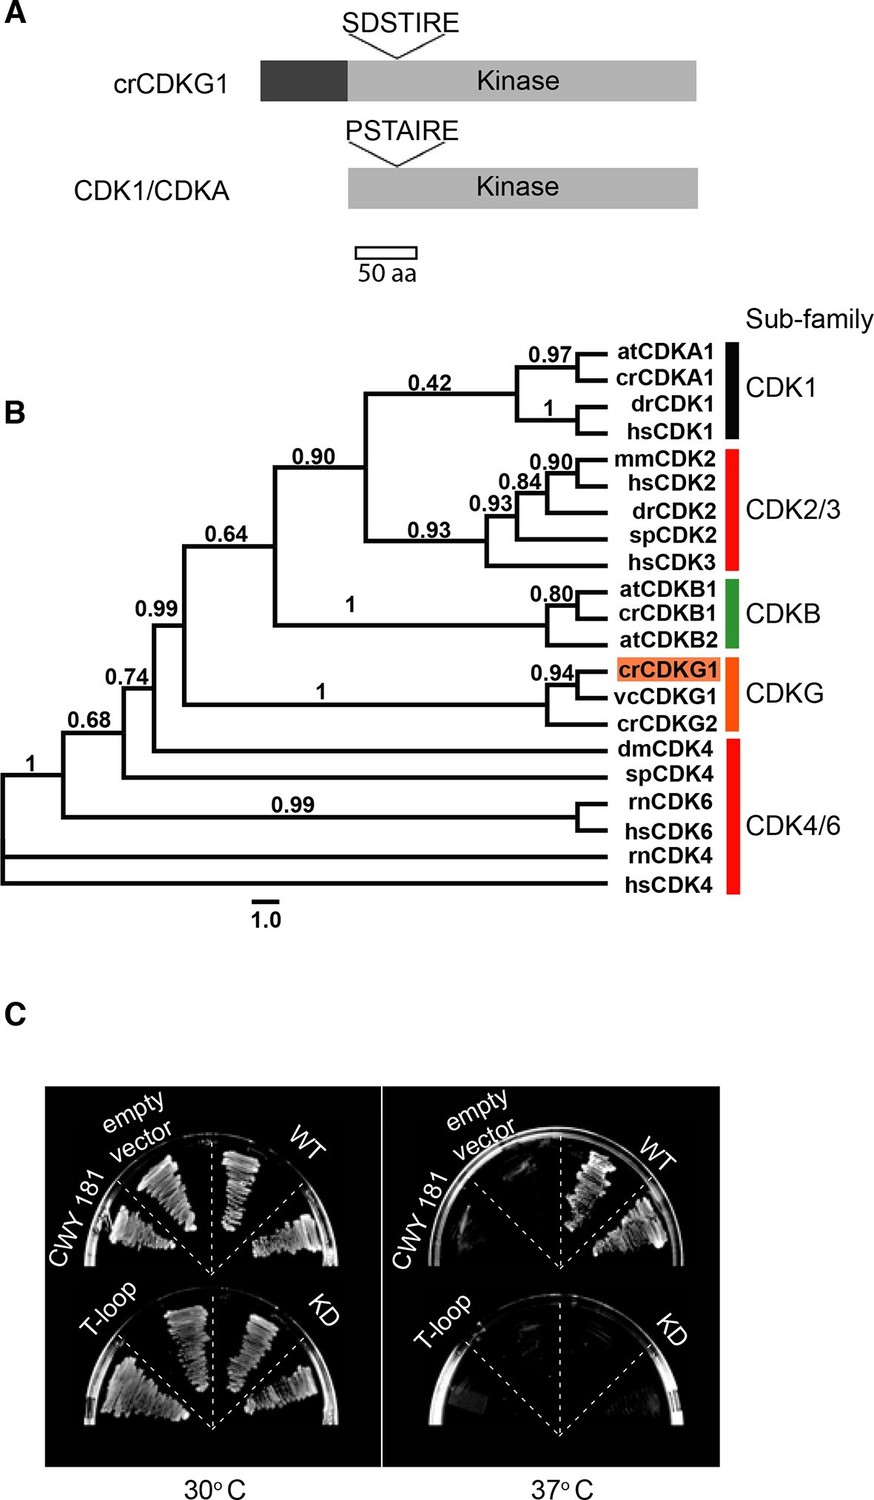
CDKG1 encodes a novel cyclin dependent kinase.
(A) Schematic representation of Chlamydomonas CDKG1 and CDK1/CDKA structures. The unique N-terminus (dark grey bar) and relative location of variant SDSTIRE motif of CDKG1 and PSTAIRE motif from CDK1/CDKA are shown. Light grey bar represents conserved kinase domain. (B) Unrooted Maximum likelihood phylogenetic tree of CDK domain alignments. Sub-families are indicated by color-coded vertical bars and labeled. Species abbreviations are: at, A. thaliana; cr, C. reinhardtii; dm, D. melanogaster; dr, D. rerio; hs, H. sapiens; mm, M. musculus; sp, S. purpuratus; rn, R. norvegicus; vc, V. carteri. Approximate likelihood ratio support is indicated for each node. (C) Growth of yeast strain CWY181 cdc28-13 and derivatives that were transformed with empty vector only, wild type CDKG1 (WT), and versions of CDKG1 containing predicted kinase inactive or T-loop mutations and grown at the permissive (30°C, left panel) or restrictive (37°C, right panel) temperatures.
Figure 2—figure supplement 1
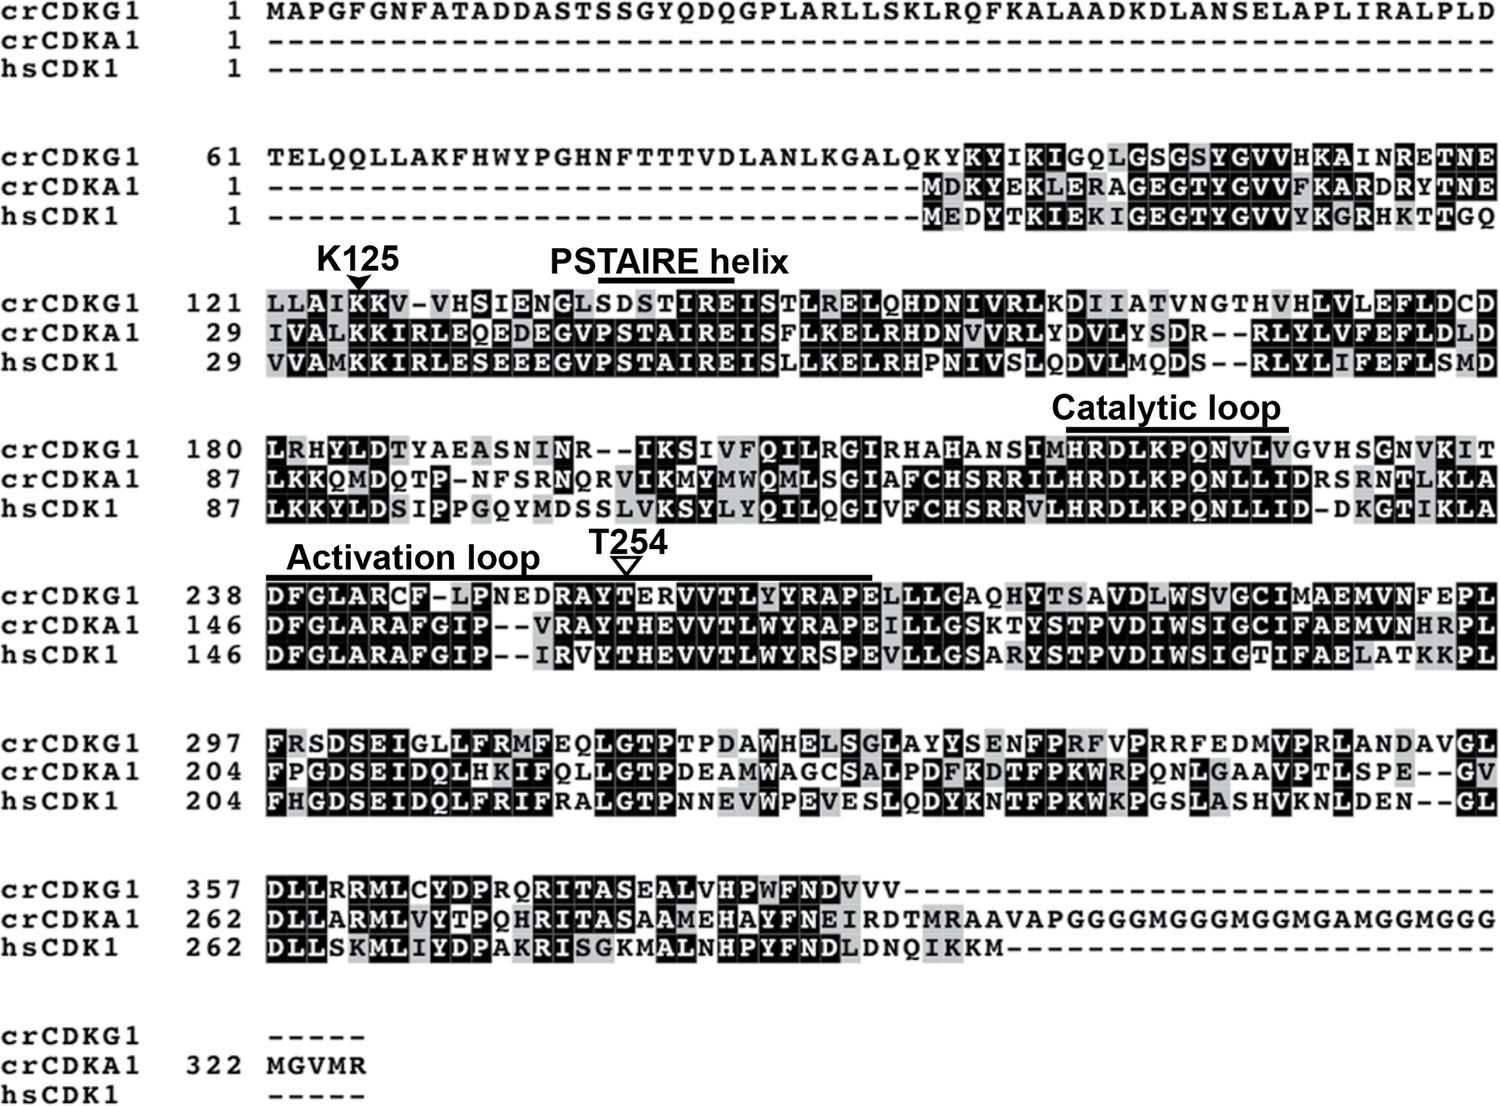
CDKG1 multiple sequence alignment and sequence features Multiple sequence alignment of Chlamydomonas CDKG1 (crCDKG1), CDKA1 (crCDKA1) and human CDK1 (hsCDK1).
Location of a conserved lysine (K125) that was mutated to arginine (K125R) to generate a kinase dead allele and of kinase activation loop region (T-loop) threonine T254 that was mutated to alanine to make a non-activatable kinase allele (T154A) are shown along with location of the PSTAIRE helix motif.
Figure 3 with 2 supplements

CDKG1 interacts with D cyclins and phosphorylates the Chlamydomonas RBR protein MAT3.
(A) Yeast two hybrid (Y2H) assay with Gal4 activation domain (AD) fusions (prey) and Gal4-DNA binding domain (DB) fusions (bait) indicated in the first two columns. Empty indicates vector only. Growth of two independent co-transformants is shown, and the relative strength of interaction is indicated by -, no interaction, +, weak interaction, ++, strong interaction, and +++, very strong interaction. (B) Co-immunoprecipitation (Co-IP) of in vitro translated (IVT) myc-tagged CYCD2 (upper panel) or CYCD3 (lower panel) incubated with HA-tagged CDKG1, anti-HA beads only (mock), or HA-CDKG1kd (kinase dead mutation). Western blots were done using anti-myc antibodies with input samples (lanes 1,8), IP pellets (P, lanes 2, 4, 6, 9, 11, 13) and IP supernatants (S, lanes 3, 5, 7, 10, 12, 14). (C) Anti-HA Western blot of in vitro translated (IVT) proteins bound to GST or GST-MAT3. HA-CDKG1 (HA-G1, lanes 1, 2), HA-CDKG1 kinase domain only (HA-G1∆N, lanes 3, 4), HA-CYCD3 (HA-D3, lanes 5, 6), HA-CYCD2 (HA-D2, lanes 7, 8) and HA-G1∆N+HA-CYCD2 (lane 9). Schematic structures of IVT proteins are shown on the left with the HA tag indicated by an ellipse. (D) In vitro kinase assay using IVT full length HA-CDKG1 (lanes 2, 4, 6, 8) or a predicted kinase dead version (HA-CDKG1kd, lanes 1, 3, 5, 7) co-immunoprecipitated with (+CYCD3) or without (–CYCD3) IVT CYCD3. Left panel, autoradiograph of proteins separated by SDS-PAGE after the kinase assay (lanes 1–4); right panel, Coomassie blue stained bands corresponding to the autoradiograph (lanes 5–8). Substrate proteins used are labeled on the left. (E) Western blots of anti-HA IP pellets from Chlamydomonas strain mat3-4 complemented with a HA-MAT3 construct (Olson et al., 2010) and synchronized in a 14 hr light/10 hr dark cycle. Anti-HA (top panel) and anti-CDKG1 (bottom panel) blots prepared with extracts from daughter cells (0 hr light), pre-Commitment cells (4 hr light), post-Commitment cells (10 hr light) and S/M phase cells (1 hr dark). (F) Kinase assay using immunoprecipitated HA-CDKG1 or HA-CDKG1kd from Chlamydomonas strain cdkg1-2::HA-gCDKG1 or HA-CDKG1kd. Upper panel, Western blots of total input and IP products. Lower panel, autoradiograph of proteins separated with SDS-PAGE (lane 1 and 2) and coomassie blue stained bands corresponding to the autoradiograph (lane 3 and 4).
Figure 3—figure supplement 1
Expression profiles and interactions between D cyclins, CDKG1 and MAT3/RBR during the cell cycle.
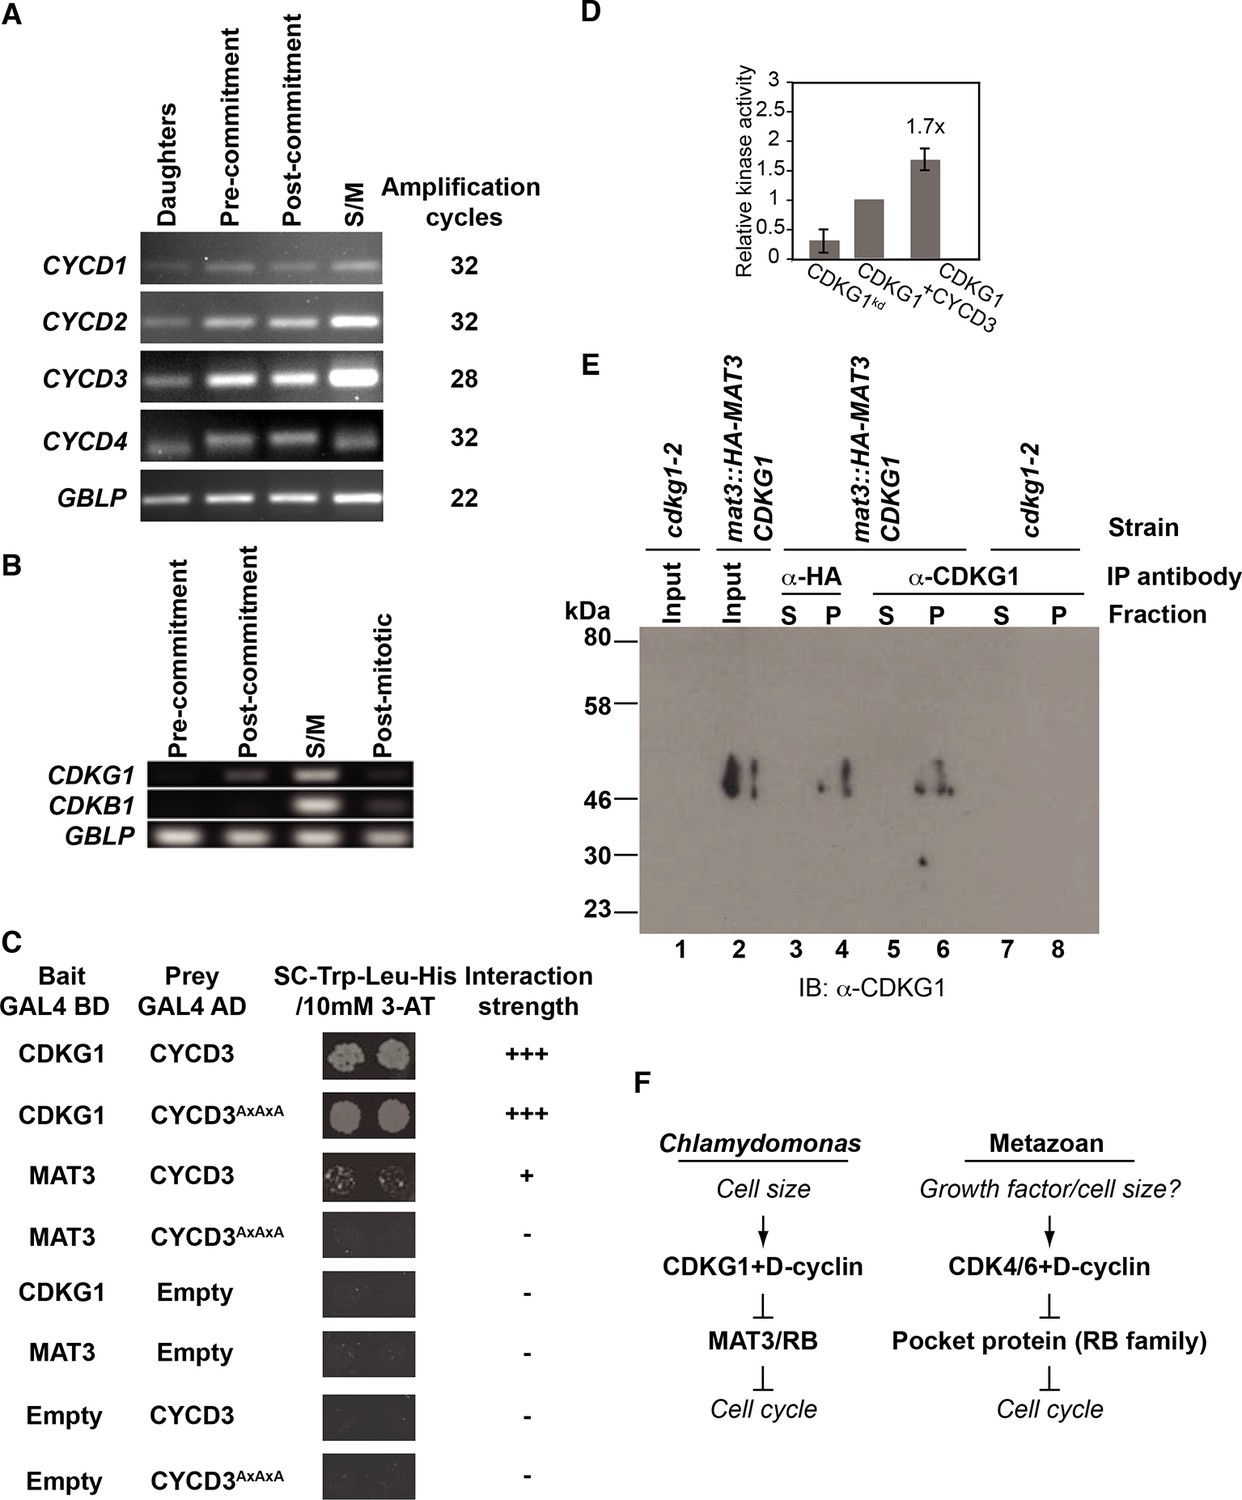
(A) Ethidium bromide stained agarose gels showing amplification of cDNAs made with RNA samples taken from synchronized cultures in a 14 hr light/10 hr dark cycle at four stages: daughter cells (1 hr light), post-commitment cells (10 hr light), S/M phase cells (1 hr dark) and post-mitotic cells (4 hr dark). Primers used are listed in Supplementary file 2 and the number of PCR amplification cycles used for each reaction is displayed on the right. GBLP is an internal control. (B) Profiles of CDKG1, CDKB1 and GBLP mRNAs as described in (A), except the pre-commitment sample was from 4 hr light. (C) Interaction of CYCD3AxAxA mutant with CDKG1 and MAT3. Mutated CYCD3 (LxCxE→AxAxA) was fused to the Gal4 activation domain (AD) and tested in an Y2H assay with MAT3/RBR and CDKG1. Empty indicates vector-only with no fusion protein. Growth of two independent co-transformants is shown, and the relative strength of interaction is indicated by -, no interaction, +, weak interaction, and +++, very strong interaction. (D) Bar graph shows relative kinase activity of IVT CDKG1, CDKG1kd and CDKG1+CYCD3 using GST-MAT3 as a substrate. The amount of 32P-labeled GST-MAT3 from each reaction was normalized to the value from lane 2. Data are expressed as the mean of three independent experiments. Error bar: S.D. (E) Immunoprecipitation (IP) from whole cell extracts, fractionation by SDS-PAGE and detection of CDKG1 by Western blotting using polyclonal antisera raised against full length CDGK1. All strains used were synchronized in S/M phase. Lanes 1,2 are concentrated input fractions prior to IP from indicated strains. Anti-HA (lanes 3,4) or anti-CDKG1 (lanes 5–8) antibodies were used for IPs as indicated and the supernatant (lanes 3,5,7) or pellet (lanes 4,6,8) fractions probed using anti-CDKG1. The anti-CDKG1 antibody detects a single band near the predicted molecular weight of 44 kDa that is not present in cdkg1-2 mutants. (F) Schematic of the regulatory hierarchy for the Chlamydomonas mitotic sizer pathway (left side) and the metazoan G1 control pathway (right side). Both pathways integrate internal and/or external signals for cell cycle progression through D-cyclin dependent CDKs that phosphorylate RB-related proteins.
Figure 3—figure supplement 2
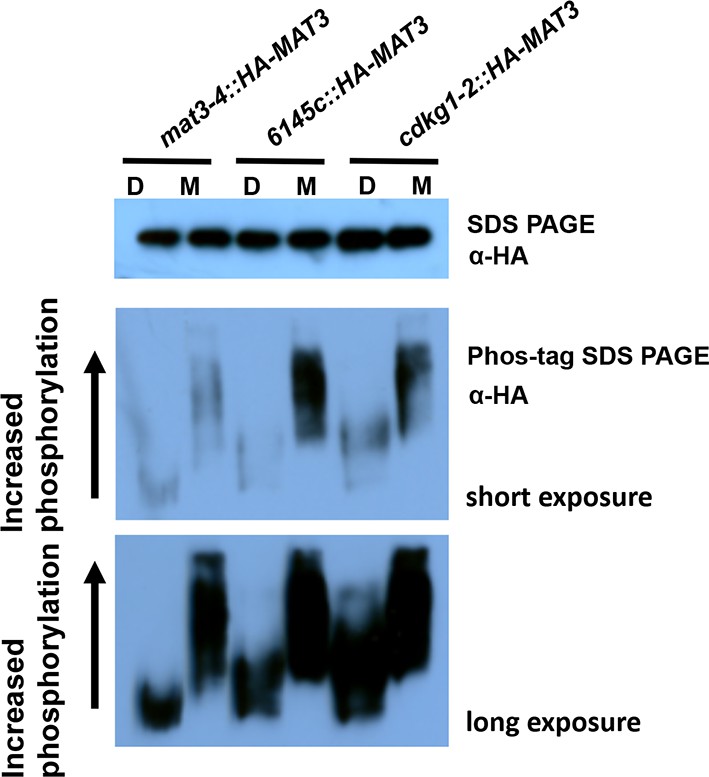
HA-MAT3 phosphorylation in cdkg1-2 cells Total protein extracts from indicated strains at daughter (D) or S/M stage (M) were separated with SDS-PAGE or phos-tag SDS PAGE gels, followed by western blotting with anti-HA to detect HA-MAT3.
https://doi.org/10.7554/eLife.10767.010
Figure 4 with 2 supplements

CDKG1 protein accumulation is cell-cycle and cell-size regulated.
(A) Anti-HA Western blot of total protein extracts from synchronized cdkg1-2::HA-gCDKG1 grown under a 14 hr light/10 hr dark regime. The open bar represents the light period and the black bar represents the dark period. Samples for immunoblotting were collected at indicated time above each lane. Upper two panels, Western blot and Coomassie staining with equal amount of total protein per lane; lower two panels, Western blot and Coomassie staining with equal cell number per lane. The fractions of cells that were past commitment and had completed mitosis at each time point are shown under each lane at the bottom. (B) Luciferase activity (RLU) was normalized to biomass and plotted from synchronous wild type cells expressing AR:luc:RBCS either or AR:luc:G1. (C) Quantitative RT-PCR of mRNAs from strains in panel (B) and ofendogenous CDKG1. Expression is normalized to 1 at the first time point. (D) Schematic representation of the method to generate different-sized mother cells. A synchronized cdkg1-2::HA-gCDKG1 culture was entrained to a 14 hr light/10 hr dark regime. Cells passed commitment at ~5 hr as marked. At three hours in the light the culture was split into three parts, the first of which was dark shifted immediately to produce a population of pre-Commitment cells (I), the second of which was dark-shifted at 7 hr to produce a population of small mother cells (II), and the third of which stayed in the light for 14 hr to produce a population of large mother cells (III). The black curve and dashed lines show cell sizes in each of the three samples. Black inverted triangles mark time points for dark-shift of sub-cultures I and II. (E) Cell size distributions of populations described in panel (D) taken at 13 hr. (F) Bar graph of cell division numbers from populations described in panel (D). (G) Anti-HA Western blot and Coomassie staining of total protein extracts from populations I, II and III at 13 hr (pre-mitotic, lanes 3 and 5) and 15 hr (mitotic, lanes 4 and 6). Samples from culture (I) were used as a non-dividing control (lanes 1 and 2). Upper and lower panels were loaded as described for panel (A).
Figure 4—figure supplement 1
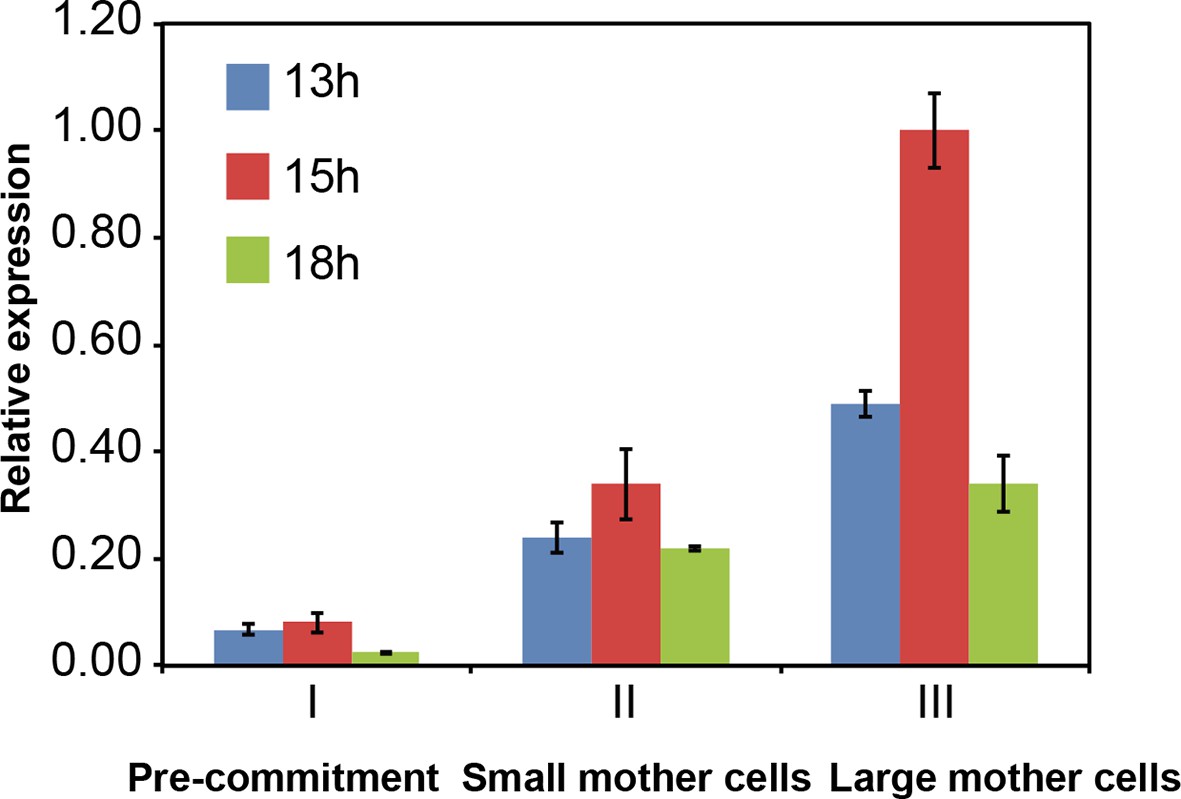
Control of CDKG1 mRNA abundance by mother cell size Bar graph shows CDKG1 mRNA levels from synchronized cultures covering the time period of S/M (13 hr to 15 hr), plus a post-mitotic sample (18 hr).
Data were normalized using 18S rRNA signal and calibrated to a scale with a maximum value of 1.0. Error bars: S.E.M. of three biological replicates.
Figure 4—figure supplement 2
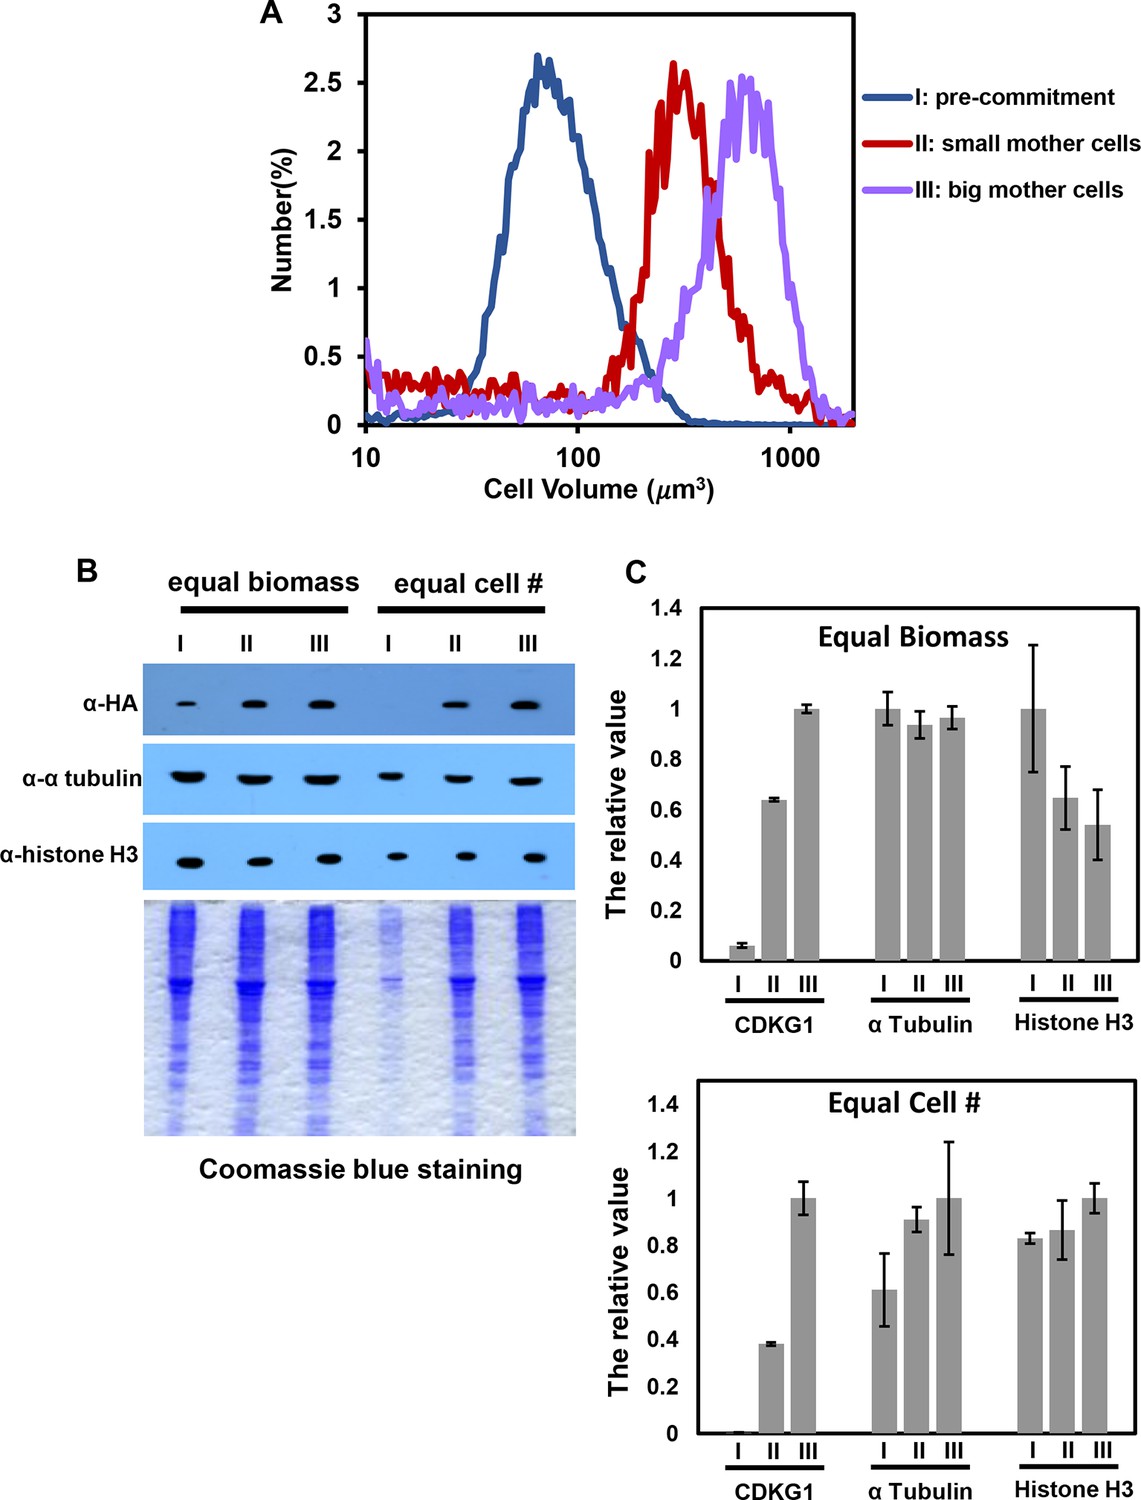
Quantitation of HA-CDKG1, histone H3 and alpha-tubulin from mother cells of different sizes.
(A) Cell size distributions of populations similar to those in Figure 4D and E used for quantitative western blotting. Lysates from Pre-commitment cells (I, median cell size ~80 um3), small mother cells (II, median cell size ~350 um3) and large mother cells (III, median cell size ~600um3) were used for quantitation. (B) Anti-HA, anti-α tubulin, and anti-histone H3 Western blot and the corresponding Coomassie staining of total protein extracts from populations I, II and III. Gels were loaded with equal biomass per lane or with equal cell number per lane as indicated. (C) Signal quantitation from each experiment. The highest signal for each antibody was arbitrarily set as 1, and the other values were normalized against it. Error bars: S.D. from three technical replicates.
Figure 5 with 1 supplement
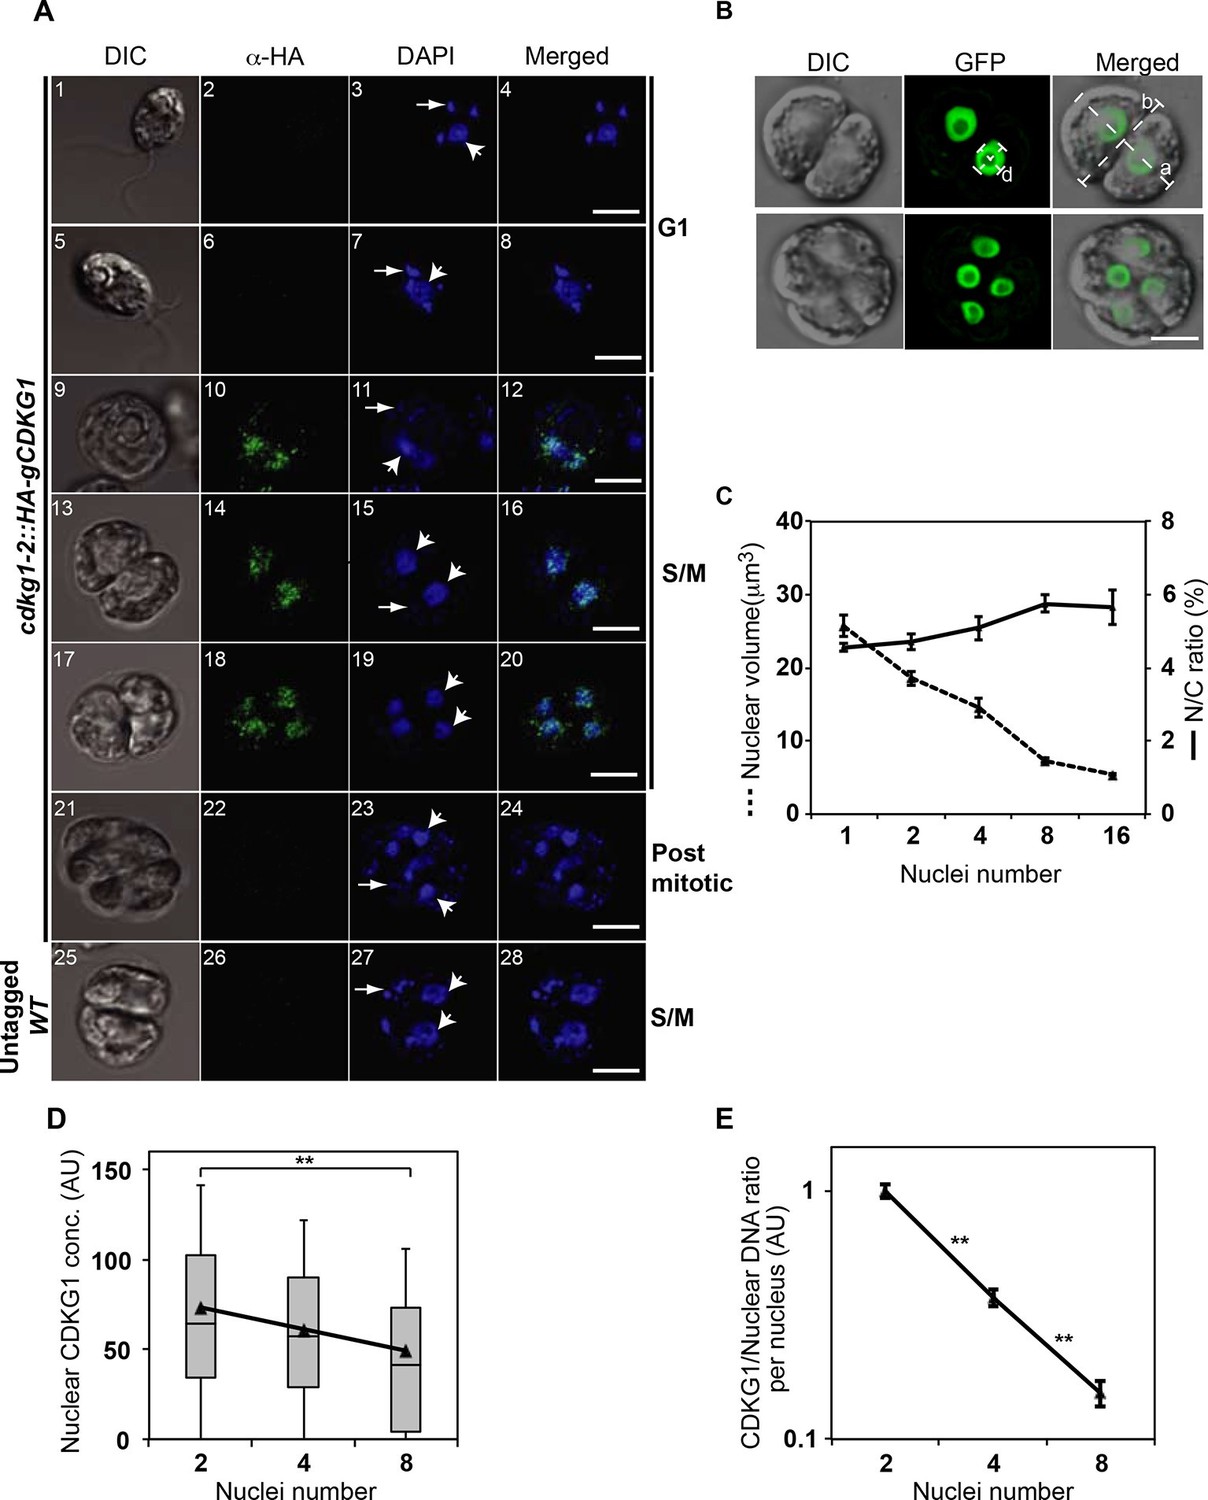
CDKG1 is nuclear localized and degraded as cells divide.
(A) DIC and confocal immunofluorescence microscopy images of cdkg1-2::HA-gCDKG1 (panels 1–24) and untagged wild type (WT) cells (panels 25–28). Synchronized cultures were fixed and immunostained for the HA epitope (green) and stained with DAPI (blue). Panels 1–8 are G1 phase cells, 9–20 are S/M phase cells, and 21–24 are post mitotic cells. Panels 25–28 are S/M phase cells from an untagged control strain. Wide arrows mark representative nuclei; thin arrows mark representative chloroplast nucleoids; Scale bar = 5 µm. Also see Figure 5—figure supplement 1. (B) Live synchronized S/M phase ble-GFP expressing cells were imaged by DIC or with a maximum-projection of Z stacks from the GFP channel. The diameter of a representative nucleus (d) and major (a) or minor (b) axes of the mother cell body are marked as white dashed lines. Scale bar = 6 µm. (C) Graph of nuclear volume and mean N/C ratio per daughter cell at different division stages plotted against nuclear number. Data are from at least 24 cells per group, except for the 16-cell stage (n=11). Error bars: S.E.M. No significant differences on N/C ratio were detected among groups using a one-way ANOVA test (p=0.09879, d=4). (D) Box-whisker plots of nuclear concentrations of HA-CDKG1 per nucleus against nuclei number (X-axis) from dividing cells at different cycle numbers. Black triangles represent mean values of nuclear HA-CDKG1 concentration per nucleus that used for generating the linear regression (R2=0.99959). Data were collected from at least 68 cells per division stage. Error bar: S.D. **: two-tailed non-parametric t-test between cell groups with 2 and 8 nuclei (p<0.005). (E) Graph of (HA-CDKG1/nuclear DNA) from different division cycle numbers as described in (D). The ratio was calculated as total nuclear HA-CDKG1 immunofluorescence intensity per mitotic cell divided by the genome copy number within that cell cluster. The HA-CDKG1/nuclear DNA ratio in first group was set as 1 arbitrary unit (AU) and plotted against nuclear number. Error bar: S.E.M.. p values of non-parametric t test between adjacent samples are marked. **: significant difference (p<0.0001).
Figure 5—figure supplement 1
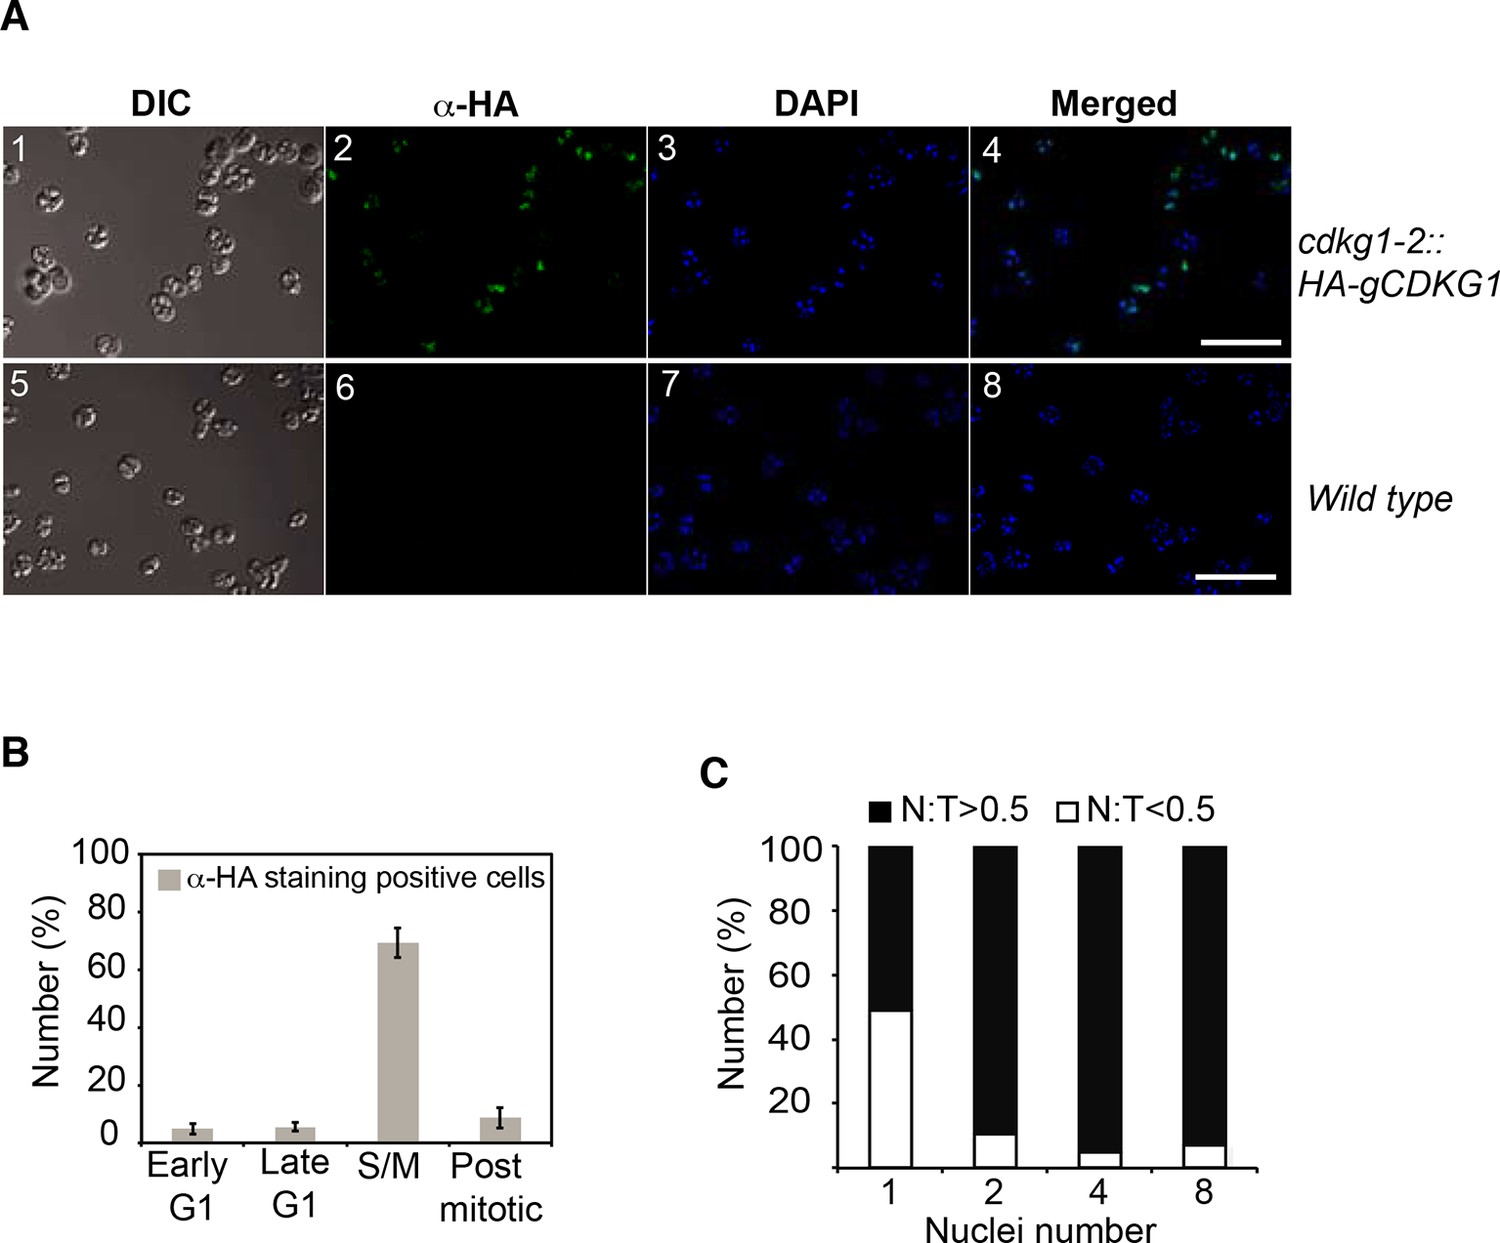
HA-CDKG1 immunolocalization.
(A) S/M phase cells from cdkg1-2::HA-gCDKG1 (panels 1–4) and wild-type (panels 5–8) were immunostained with anti-HA and Alexafluor-488 conjugated secondary antibodies. Nuclei were stained with DAPI. Maximum projection images from 20 optical sections are shown. DIC: differential interference contrast image, Green: anti-HA, Blue: DAPI, Scale bar = 20 µm. (B) Bar graph depicting percentage of HA-stained cells taken at different cell cycle phases from a synchronized cdkg1-2::HA-gCDKG1 culture as described in Figure 5A. Early G1 (4–5 hr), Late G1 (8–10 hr), S/M (13–15 hr), and post-mitotic (18–19 hr). Mean values are from three independent experiments. Error bar: S.D., n > 300 cells for each sample. (C) Bar graph depicting the fraction of HA-CDKG1 staining within the nucleus (N) compared to the total signal (T) in each cell. Open bars indicate fraction of cells with <50% of HA staining inside the nucleus; black bars indicate fraction of cells with >50% of HA staining inside the nucleus. Large dividing mother cells that had completed different numbers of divisions were scored by number of daughter nuclei within them.
Figure 6 with 2 supplements
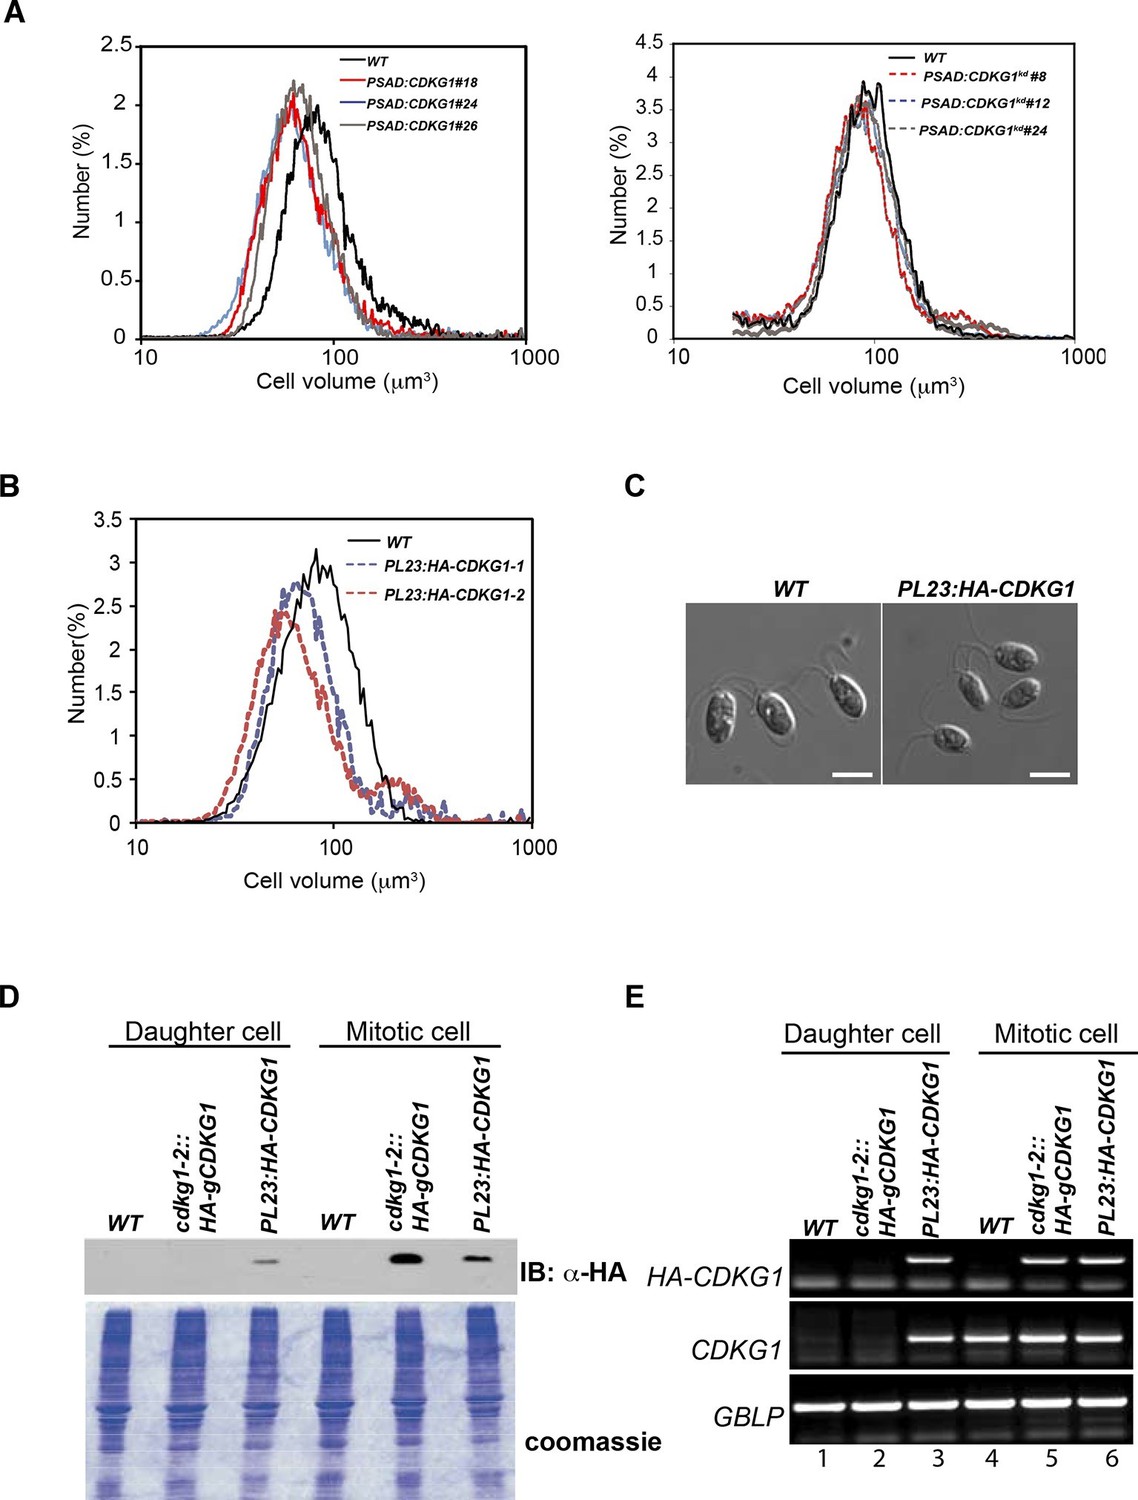
Mis-expression of CDKG1 causes a small-cell phenotype.
(A) Daughter cell size distributions of three independent PSAD:CDKG1-expressing transformants along with a wild type (WT) control (left panel); daughter cell size distributions of three independent PSAD:CDKG1kd-expressing transformants (kd: kinase dead) and a wild type (WT) control (right panel). (B) Daughter cell size distributions of two independent PL23:HA-CDKG1 transformants with wild type (WT) control. (C) DIC images of wild type (WT) daughter cells and daughters from PL23:HA-CDKG1 transformants. Scale bar=7.5 µm. (D) Anti-HA immunoblot (IB) detection of HA-CDKG1 with total protein extracts from synchronized strains as indicated (upper panel). Coomassie stained gel after membrane transfer serves as a loading control (lower panel). (E) RT-PCR detection of the HA-CDKG1 and/or endogenous CDKG1 message from indicated strains: PL23:HA-CDKG1 (lane 3 and 6), cdkg1-2::HA-gCDKG1 (lane 2 and 5) and an untransformed parental control strain (lane 1 and 4) using RNA from daughter cells or S/M phase cells. GBLP is an internal control.
Figure 6—figure supplement 1
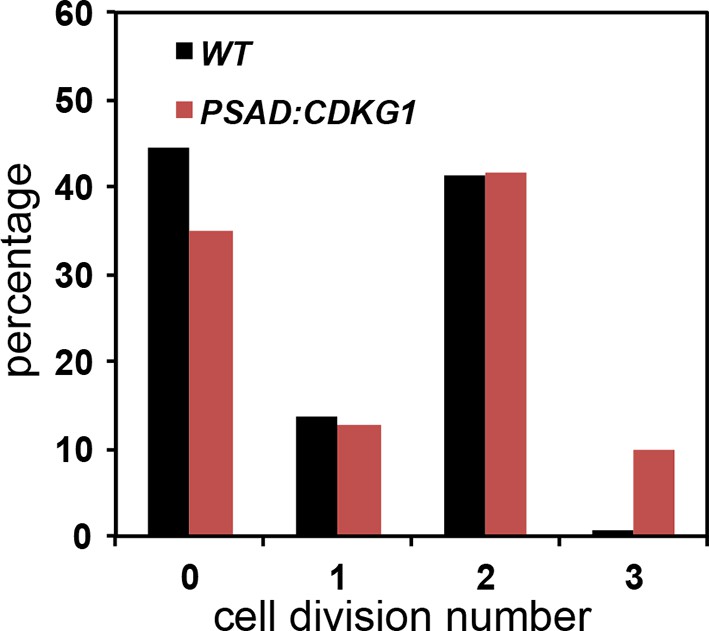
Cell division numbers of PSAD:CDKG1 expressing cells Unsynchronized wild type and isogenic PSAD:CDKG1 cells were plated on HSM agar in the dark and division numbers were scored by percentage in each category: 0—no division (pre-Commitment), 1—one division (two daughters), 2—two divisions (four daughters), and 3—three divisions (eight daughters).
https://doi.org/10.7554/eLife.10767.018
Figure 6—figure supplement 2
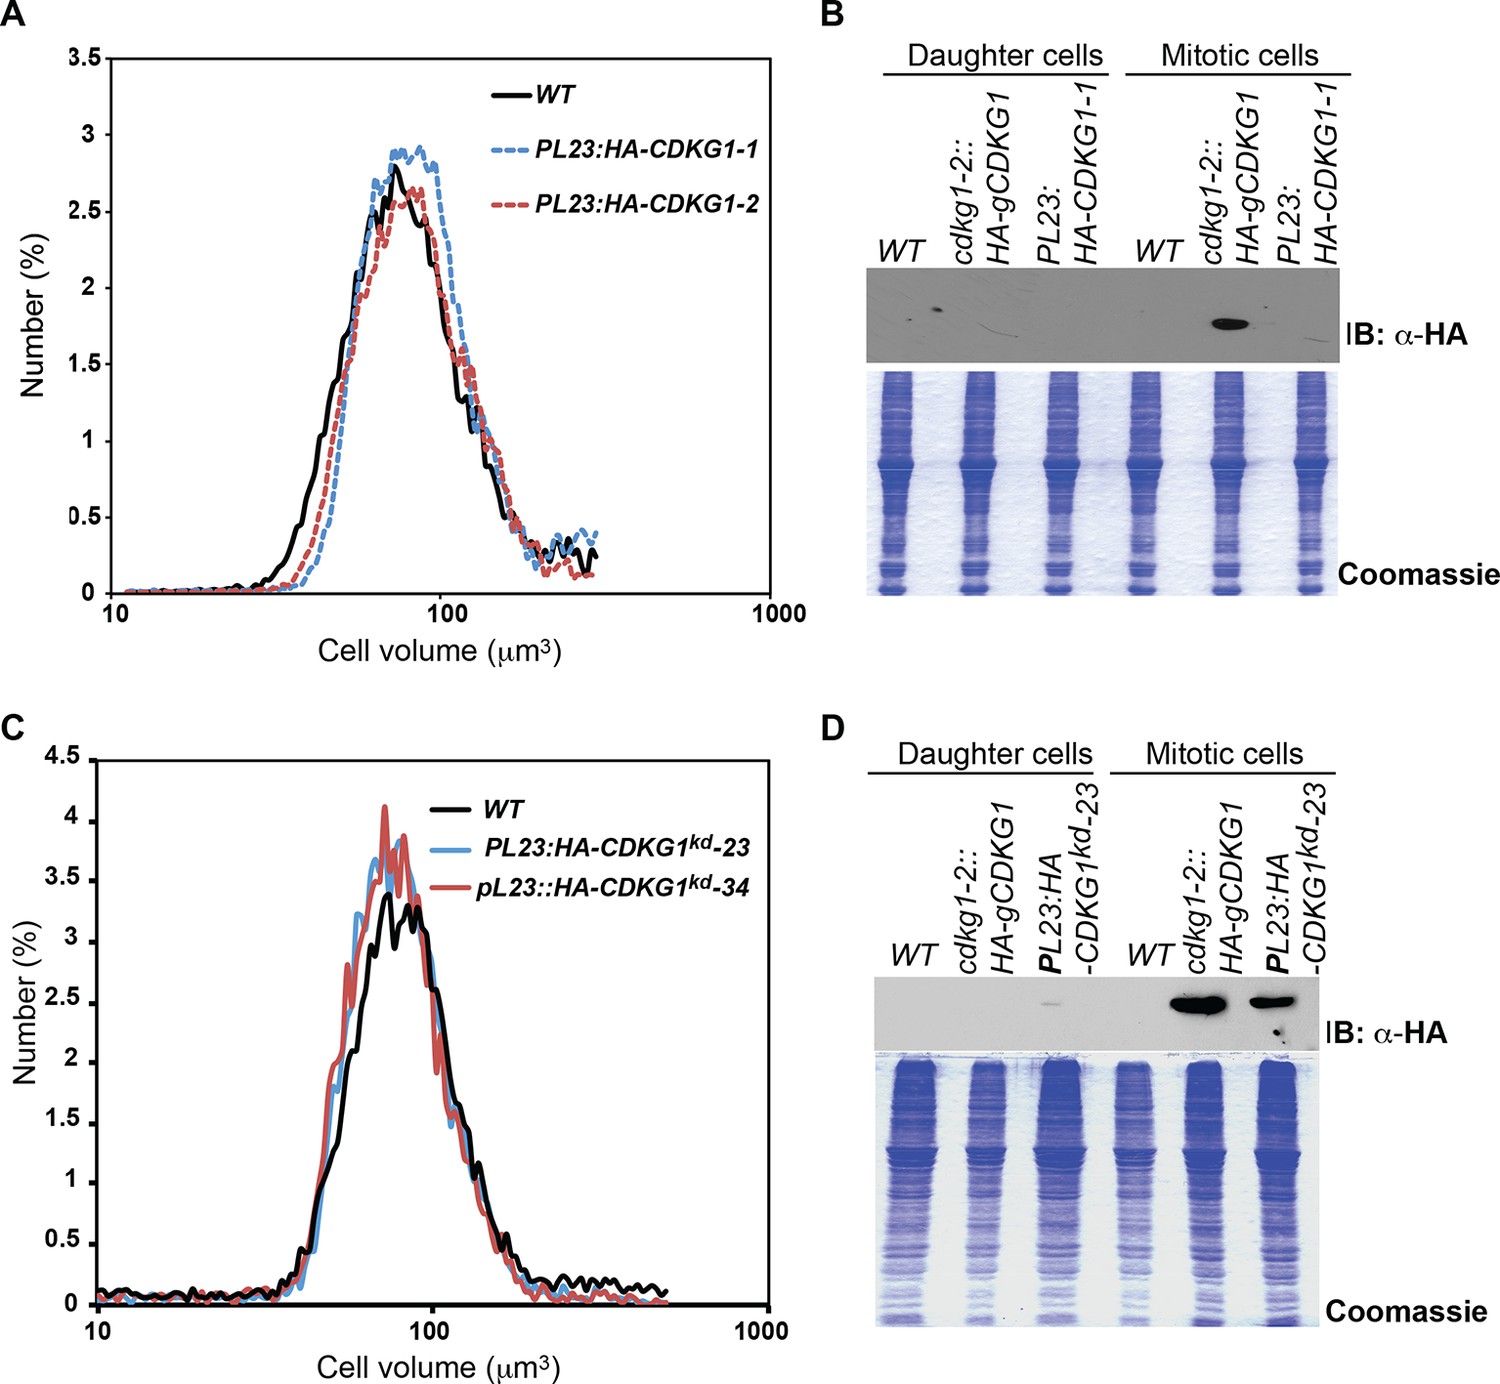
Loss of expression and size phenotypes of PL23:HA-CDKG1 strains after repeated passaging, and normal size phenotypes of strains expressing PL23:HA-CDKG1kd.
(A) The same PL23:HA-CDKG1 and wild type strains used in Figure 6 were passaged under continuous growth conditions for over one week and then assessed for daughter cell sizes compared with a control strain. (B) Upper panel. Immunoblot of total protein extract showing loss of HA-CDKG1 expression from strains in panel (A) with stably expressed cdkg1-2::HA-gCDKG1 used as a positive control. Lower panel. Coommassie blue stained SDS-PAGE gel used as loading control for immunoblot. (C) Normal-sized daughter cells in representative strains expressing PL23:HA-CDKG1kd. Expression of HA-CDKG1kd is detected in (D) but small-cell phenotypes are never observed in strains transformed with this construct. (D) Anti-HA immunoblot (upper panel) and coomassie stained gel (lower panel) of extracts from PL23:HA-CDKG1kd-23 showing expression.
Figure 7
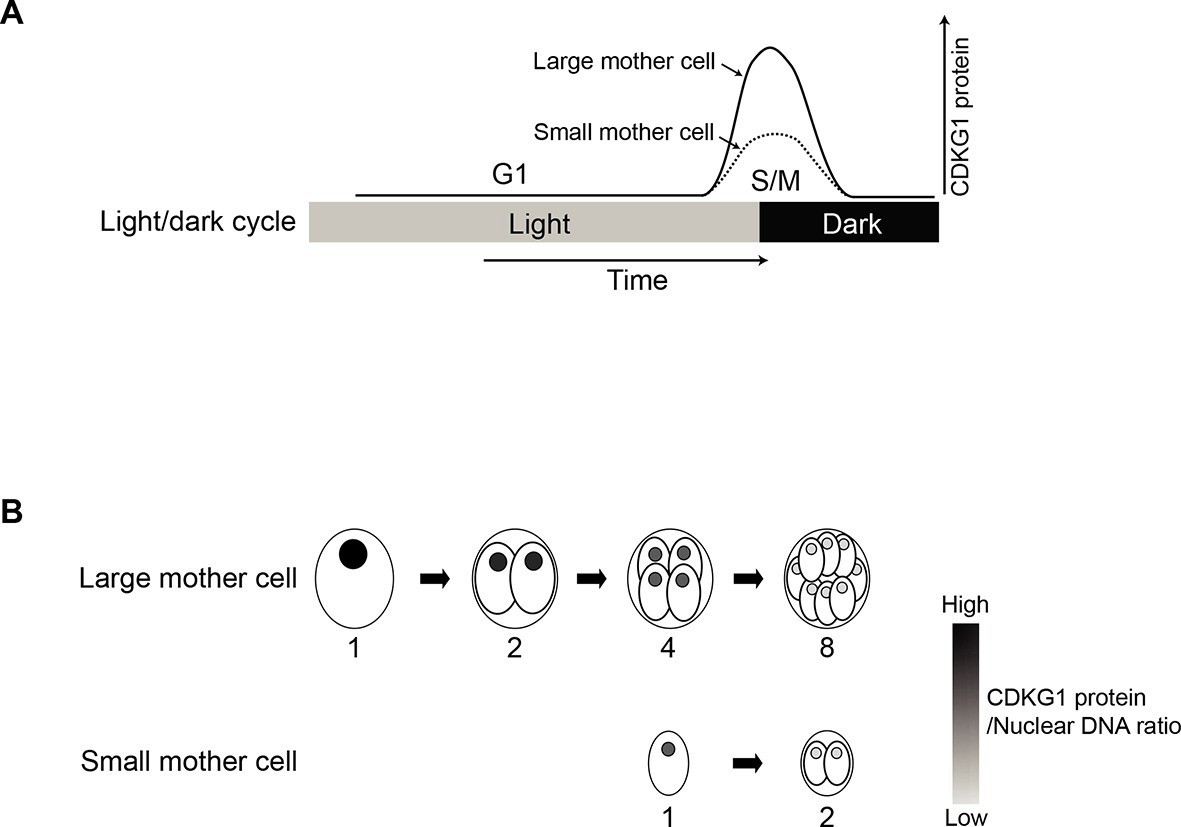
Model for CDKG1 as a limiting size regulator for cell division.
(A) Schematic of cell cycle with kinetics of CDKG1 accumulation depicted by solid or dashed curves. Large mother cells accumulate higher concentrations of CDKG1 than small mother cells. (B) Nuclear CDKG1 to nuclear DNA ratio (gray scale) may act as a titratable regulator of cell division. The nuclear concentration of CDKG1 is reduced with each division. When it falls below a critical threshold cells exit S/M.
Tables
Table 1
Daughter cell size, commitment size and growth rate for indicated strains
| Strain | Daughter cell size (µm3) | Commitment size (µm3) | Doubling time (hr) |
|---|---|---|---|
| wild type | 75 ± 3 | 195 ± 14 | 5.89 ± 0.7 |
| cdkg1-2 | 95 ± 6 | 215 ± 10 | 5.62 ± 0.7 |
| cdkg1-2::HA-gCDKG1 | 73 ± 7 | 190 ± 12 | nd |
| PSAD::CDKG1 | 56 ± 2 | 185 ± 3 | nd |
| dp1-1a | 104 ± 5 | 237 ± 4 | nd |
| mat3-4b | 25 ± 2 | 110 | nd |
-
± : Standard deviation; nd: not determined; a from (Fang et al., 2006); b from (Umen and Goodenough, 2001)
Table 2
Summary of yeast two hybrid results for CDKG1, D-cyclins and MAT3
| Prey Bait | CDKG1 | CYCD2 | CYCD3 | CYCD3AxAxA | CYCD4 | MAT3 | Empty |
|---|---|---|---|---|---|---|---|
| CDKG1 CYCD2 CYCD3 MAT3 Empty | NA ++ +++ + - | ++ NA NA + - | +++ NA NA + - | +++ NA NA - - | + NA NA NA - | + + + NA - | - - - - NA |
-
+++: Strong interaction
-
++: Medium interaction
-
+: Weak interaction
-
-: No interaction
-
NA: Not available
Additional files
-
Supplementary file 1
CDK sequences used for phylogenetic analysis
- https://doi.org/10.7554/eLife.10767.021
-
Supplementary file 2
Primers used in this study
- https://doi.org/10.7554/eLife.10767.022
Download links
A two-part list of links to download the article, or parts of the article, in various formats.
Downloads (link to download the article as PDF)
Open citations (links to open the citations from this article in various online reference manager services)
Cite this article (links to download the citations from this article in formats compatible with various reference manager tools)
A new class of cyclin dependent kinase in Chlamydomonas is required for coupling cell size to cell division
eLife 5:e10767.
https://doi.org/10.7554/eLife.10767


