Mitochondrial DNA copy number variation across human cancers
- Memorial Sloan Kettering Cancer Center, United States
- Cambridge Institute, United Kingdom
Figures
Figure 1
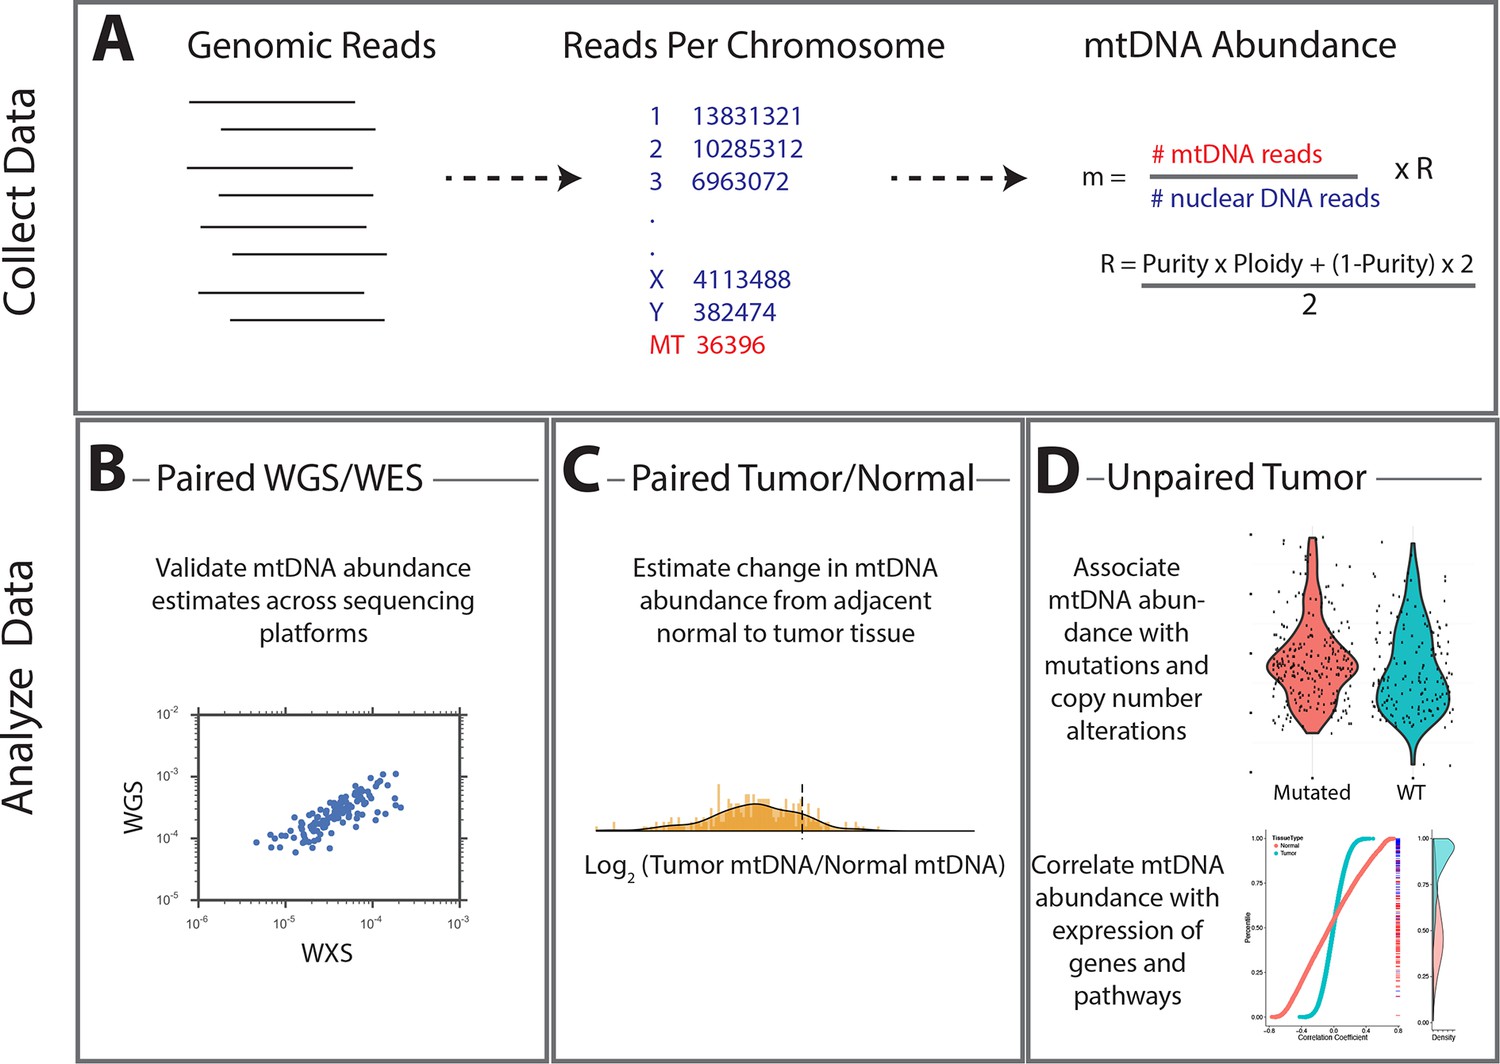
Summary of methods.
(A) Reads were analyzed to determine the number aligning to each chromosome. Relative abundance of mitochondrial DNA was calculated as the ratio of mtDNA reads to nuclear DNA reads, and corrected for tumor purity and ploidy. The results of these calculations were employed in three different types of analysis. (B) Comparisons across samples profiled by both whole exome and whole genome sequencing provided validation of mtDNA copy number estimates. (C) Pairs of matched tumor/adjacent-normal samples were compared to uncover patterns of mtDNA accumulation and depletion. (D) Using all data available (including tumor samples lacking matched normal samples), statistical associations between mtDNA copy number and (1) mutation/copy number alterations, and (2) gene expression, were calculated.
Figure 2 with 1 supplement
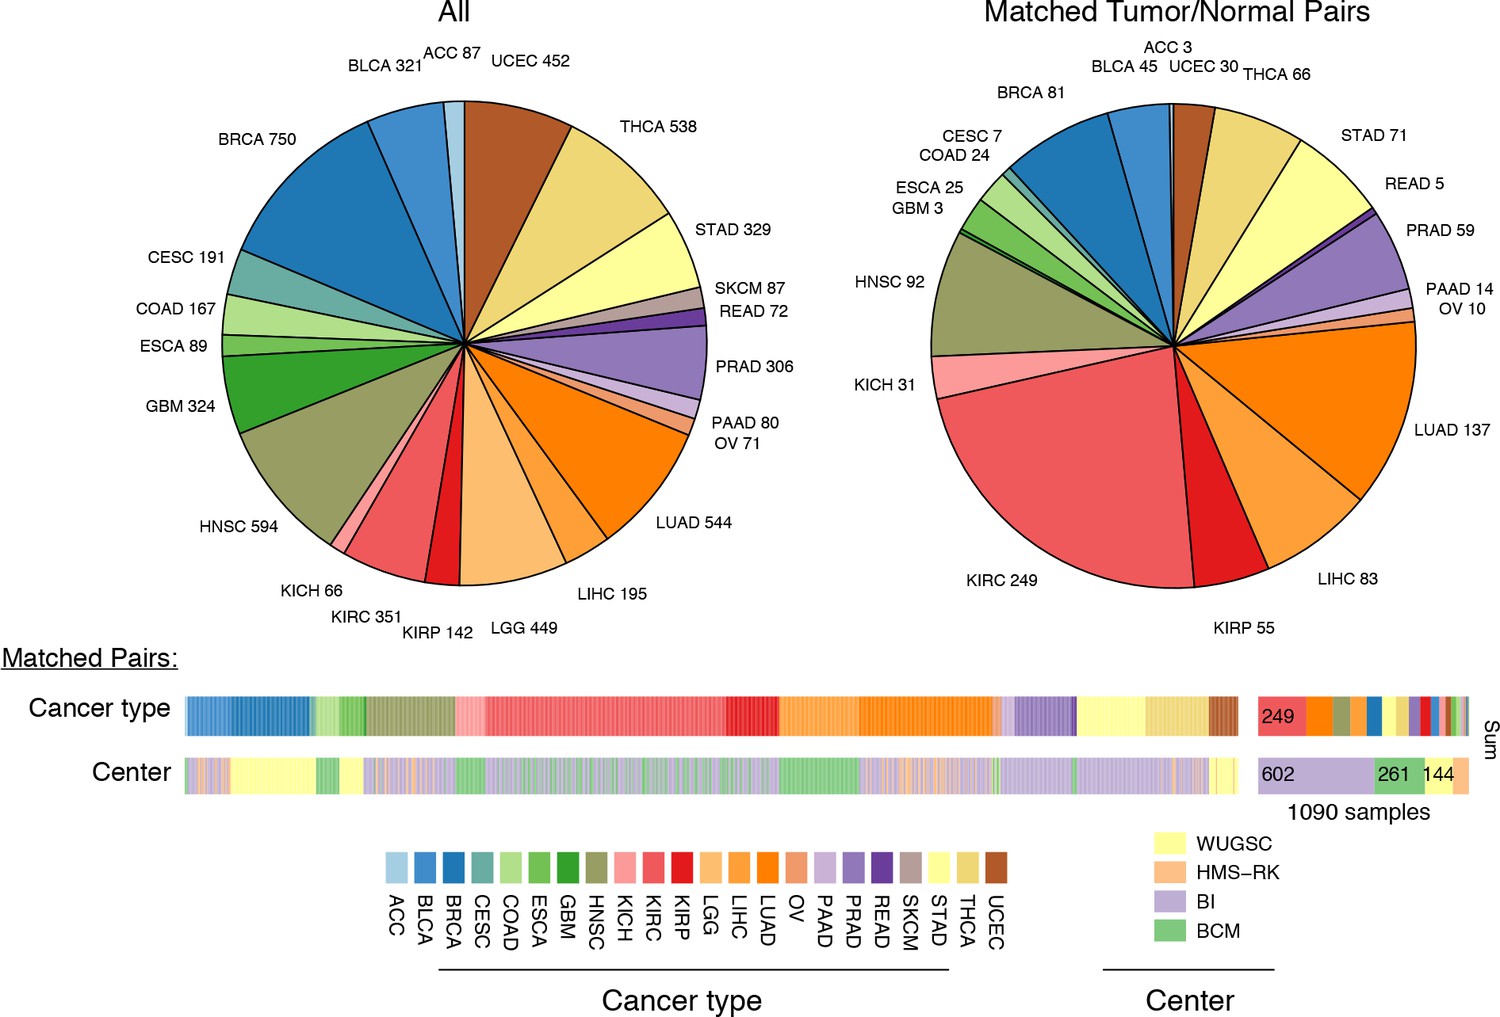
Summary of data.
Whole-exome and whole-genome sequencing data were obtained from 22 TCGA studies. Abbreviations for each cancer type follow the standard TCGA nomenclature. The data were processed at four different sequencing centers, each of which was analyzed separately. Over 1000 samples were paired instances of tumor/adjacent-normal tissue from the same patient, which were used to quantify changes in mtDNA content across tumors.
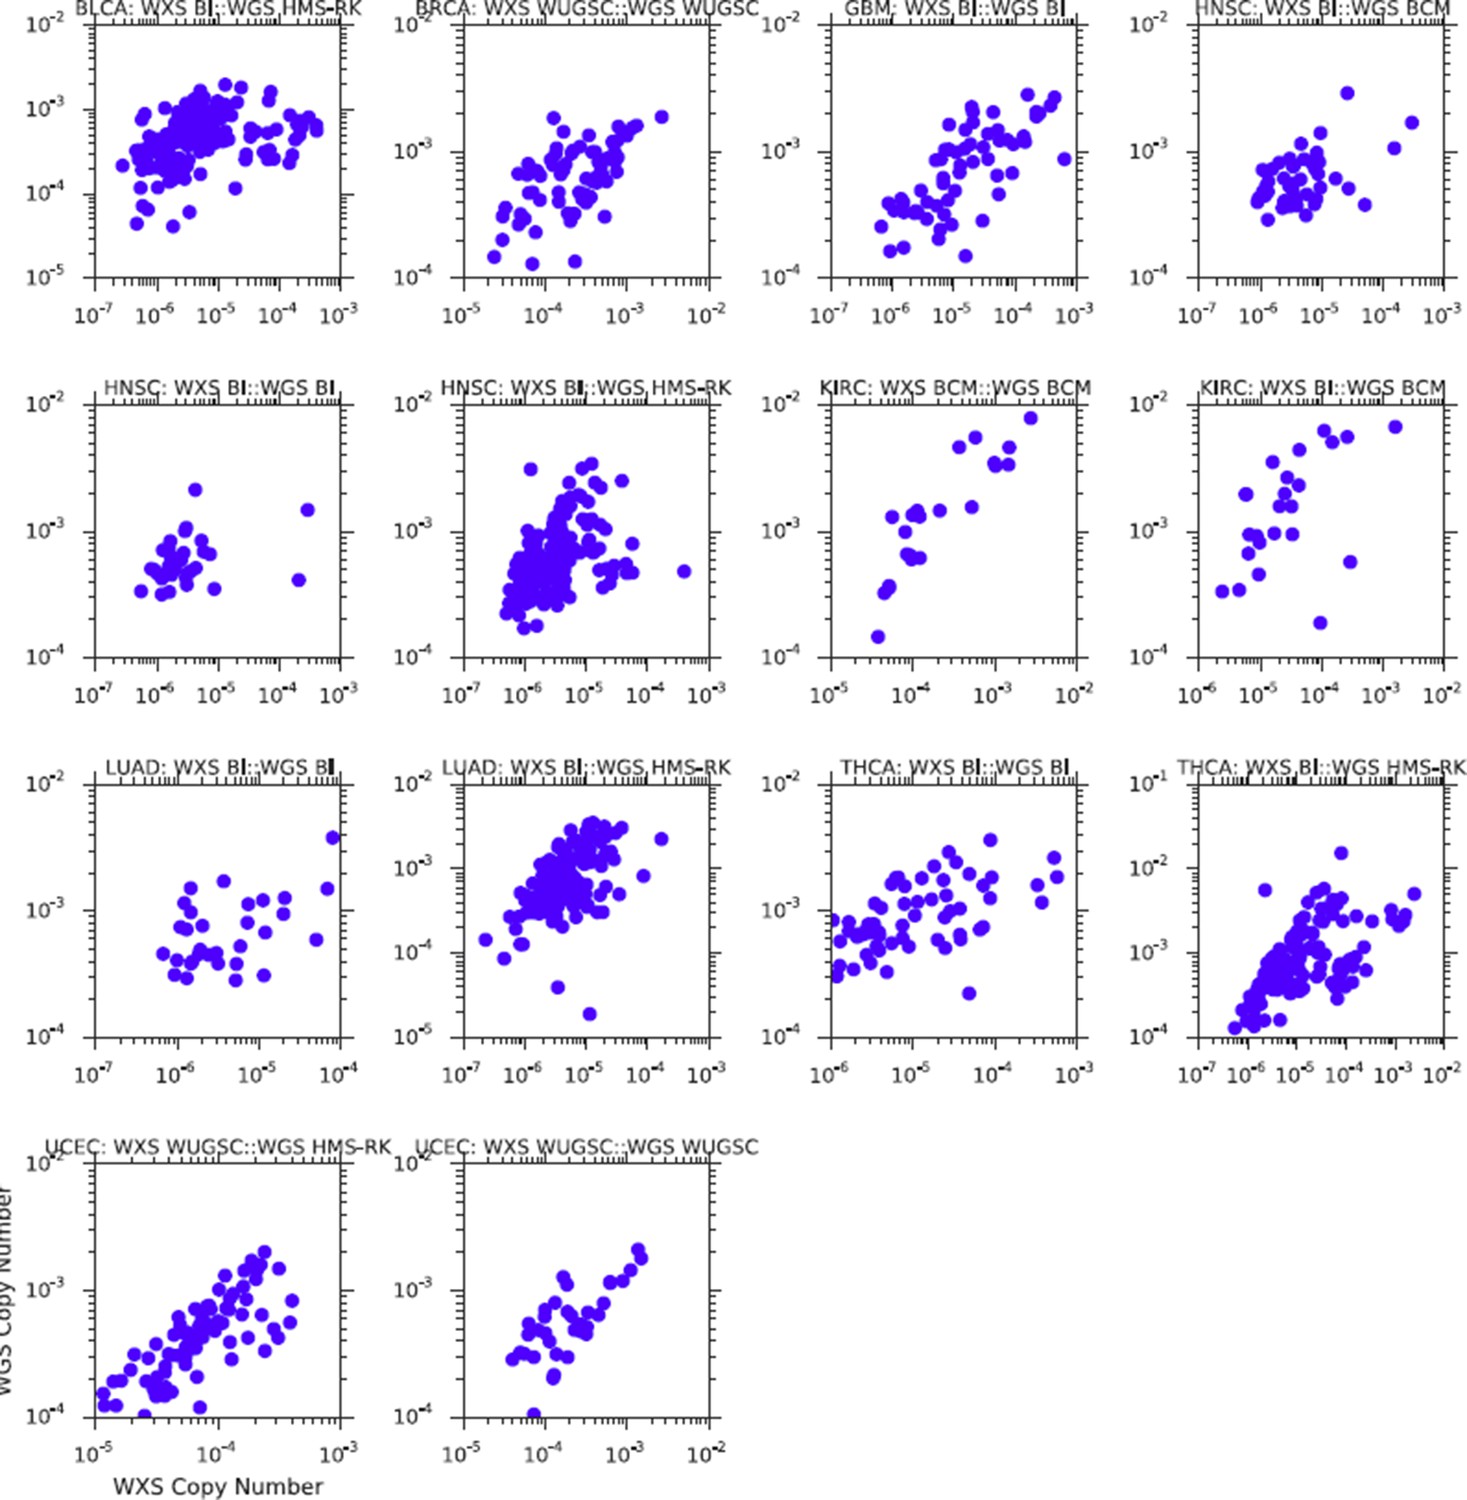
Figure 2—figure supplement 1

Comparison of mtDNA copy number estimates of samples profiled by both whole genome (WGS) and whole exome (WXS) sequencing.
Each point is one sample, X-axis indicates copy number from whole exome sequencing, Y-axis indicates copy number from whole genome sequencing. All correlations are statistically significant (Spearman p-value, BLCA: 2×10-14; BRCA: 6×10-18; GBM: 2×10-13; HNSC: 1×10-18; KIRC: 3×10-12; LUAD: 4×10⁻¹⁰; THCA: 4×10-23; UCEC: 2×10-31).
Figure 3 with 5 supplements
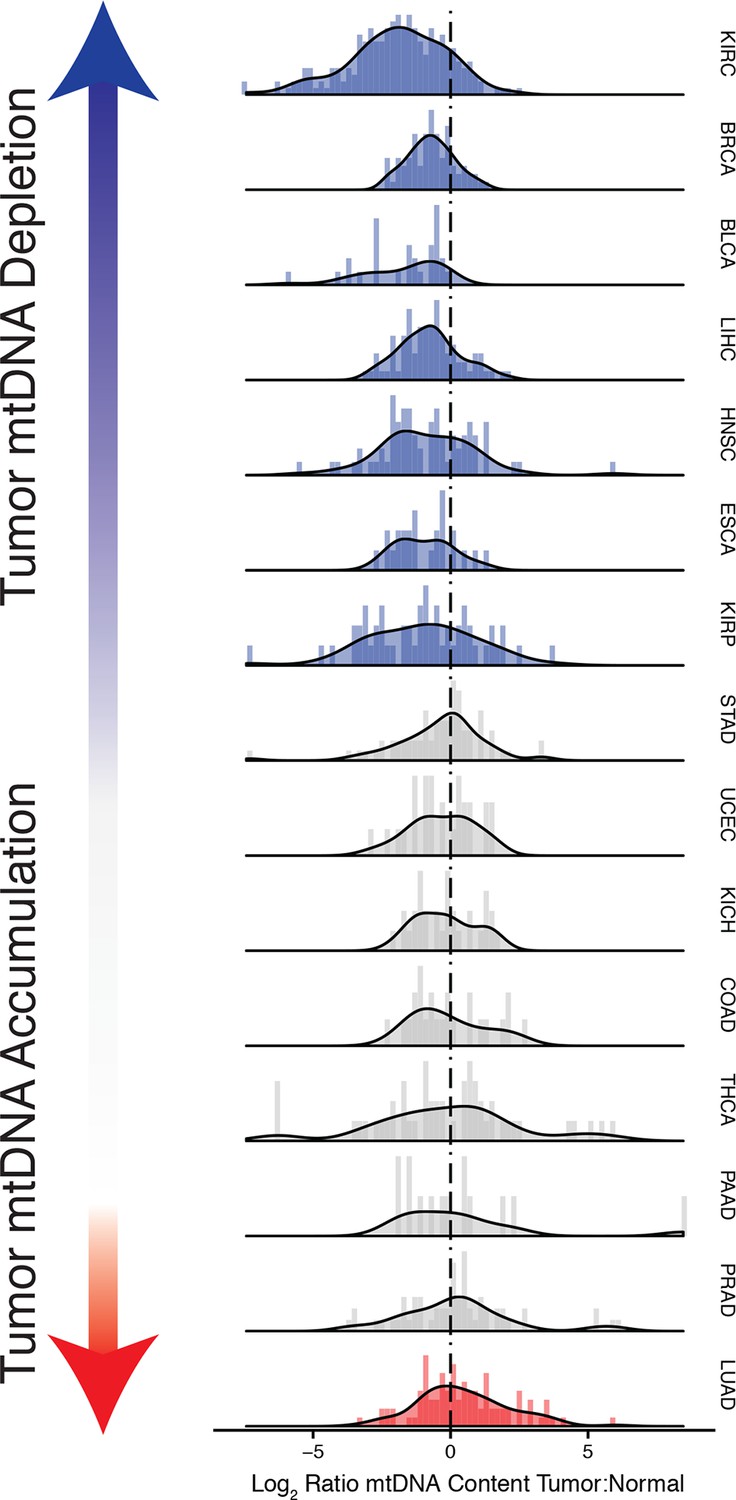
Many tumor types show depletion of mtDNA in tumor samples, relative to adjacent normal tissue.
Normalized histograms and density plots illustrate log2 ratio of mtDNA content in tumor tissue, to mtDNA content in normal tissue. Each row is a different tumor type. Statistical significance of trends is assessed using a Wilcoxon sign rank test, and p-values are corrected using the Benjamini-Hochberg procedure. Cancer types displaying significant depletion/accumulation of mtDNA are colored in blue/red. Seven of fiteen tumor types show a significant depletion of mtDNA content (a shift of the distribution to the left of the dashed line), relative to normal tissue. One tumor type, lung adenocarcinomas, shows an increase in mtDNA content, relative to normal tissue.
-
Figure 3—source data 1
Correlation of mtDNA copy number with ESTIMATE (Yoshihara et al., 2013) stromal and immune scores.
Third column indicates whether tumor mtDNA content or log ratio of tumor to normal mtDNA content was used. p-values are uncorrected for multiple hypothesis testing.
- https://doi.org/10.7554/eLife.10769.007
Figure 3—figure supplement 1
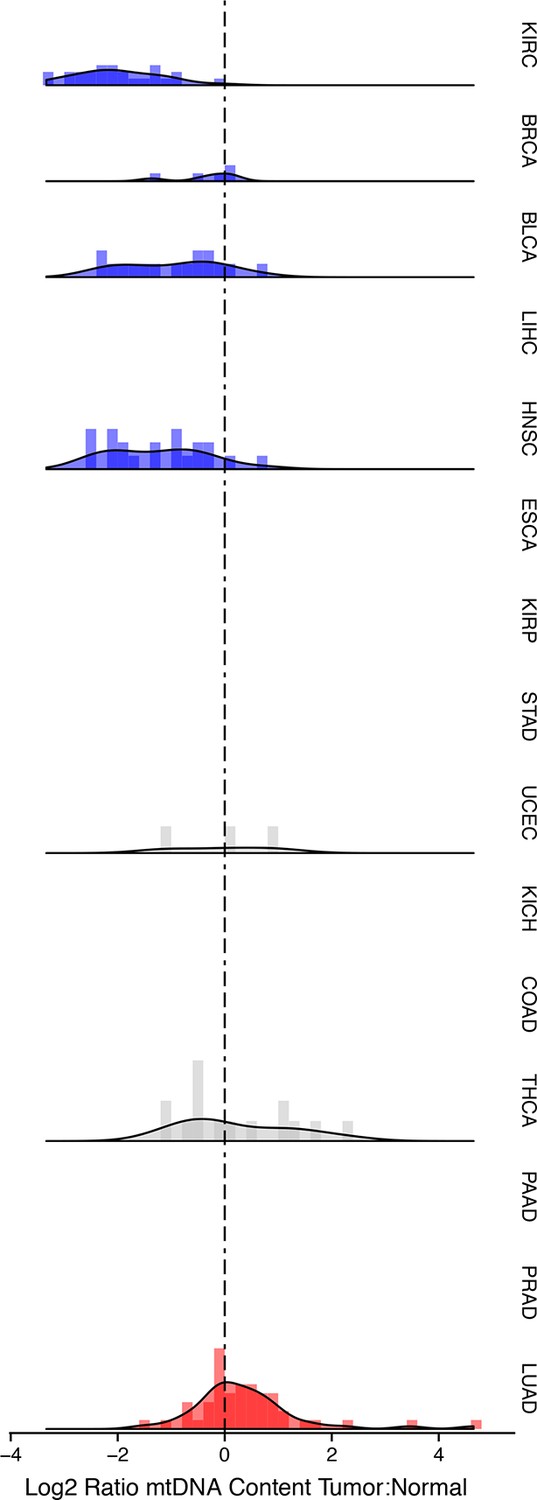
mtDNA tumor:normal copy number ratio using whole-genome sequencing (WGS) data.
Trends in WGS are in agreement with those in Figure 2 in whole exome sequencing (WXS). All data for this figure can be found in Figure 3—source data 1.
Figure 3—figure supplement 2
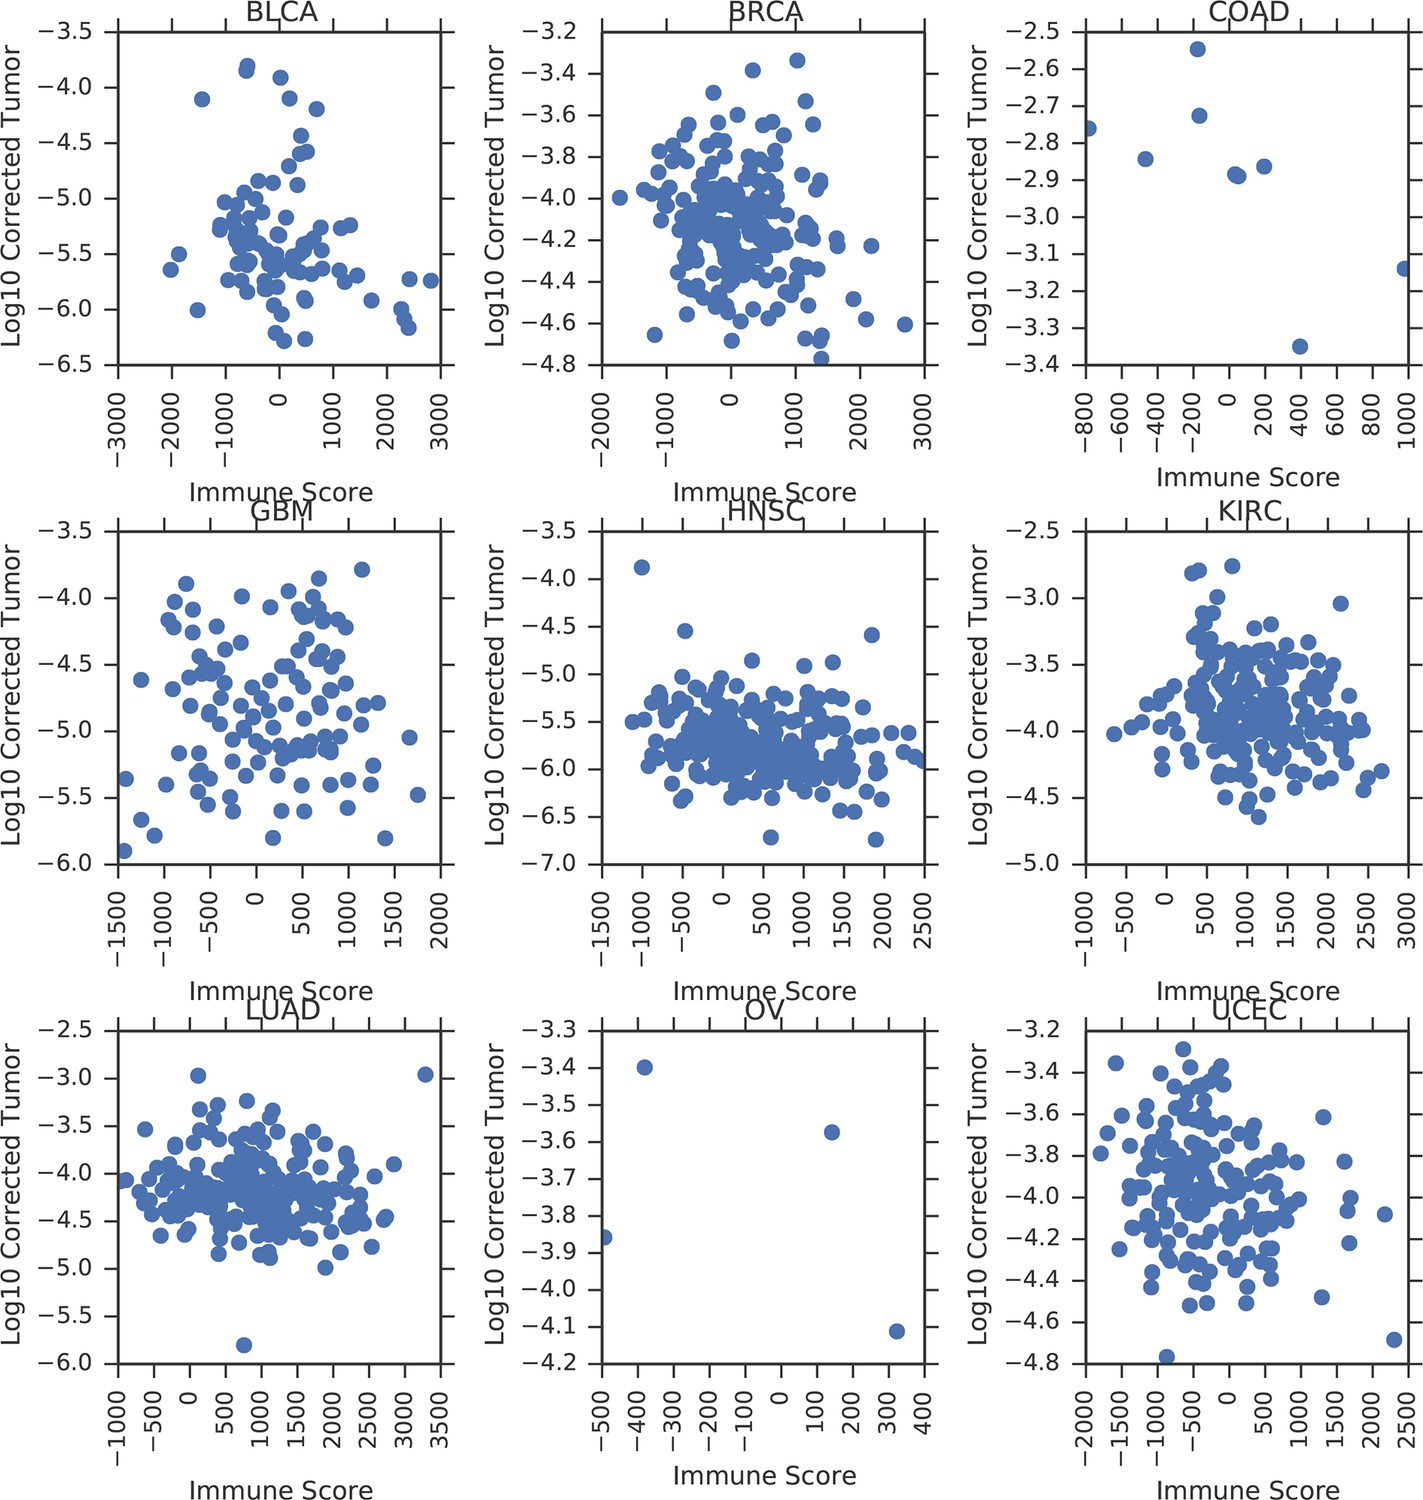
Correlation between tumor mtDNA copy number and ESTIMATE immune scores.
https://doi.org/10.7554/eLife.10769.009
Figure 3—figure supplement 3
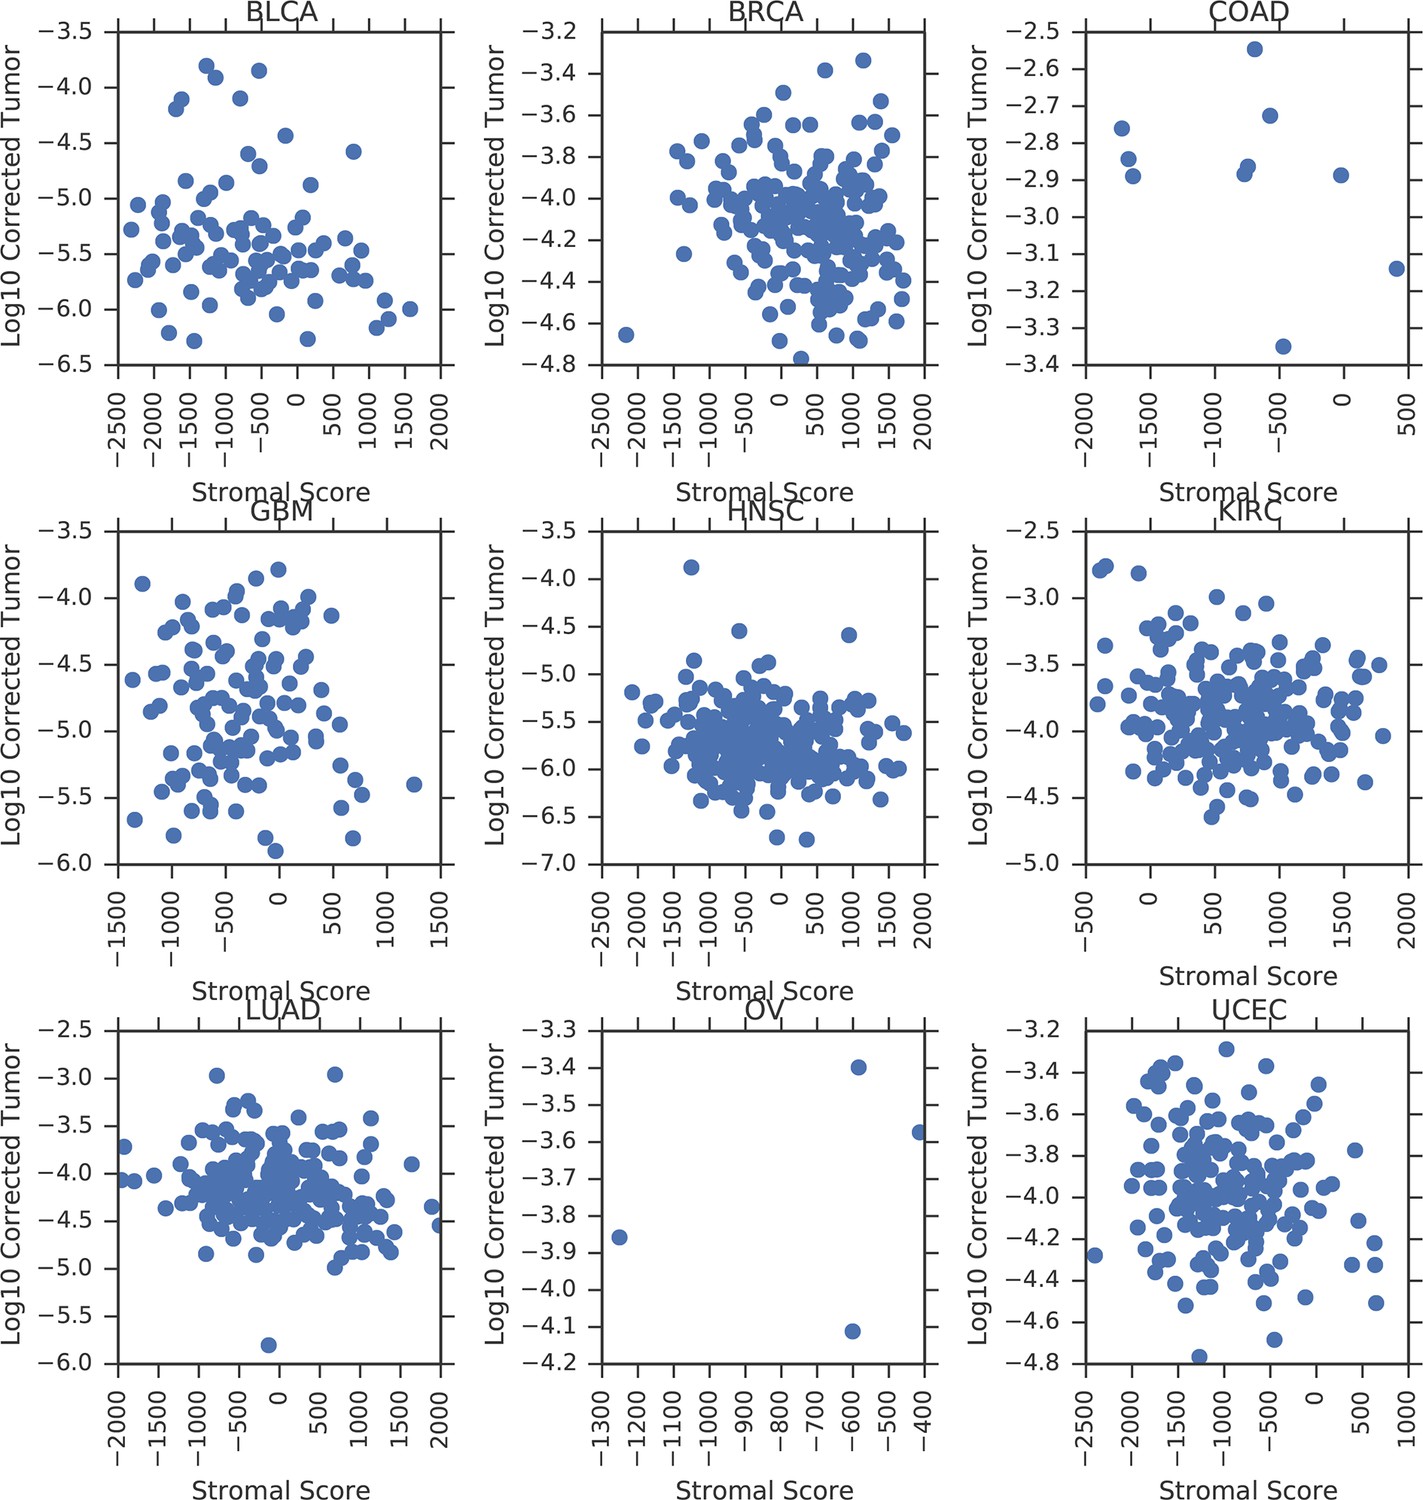
Correlation between tumor mtDNA copy number and ESTIMATE stromal scores.
https://doi.org/10.7554/eLife.10769.010
Figure 3—figure supplement 4
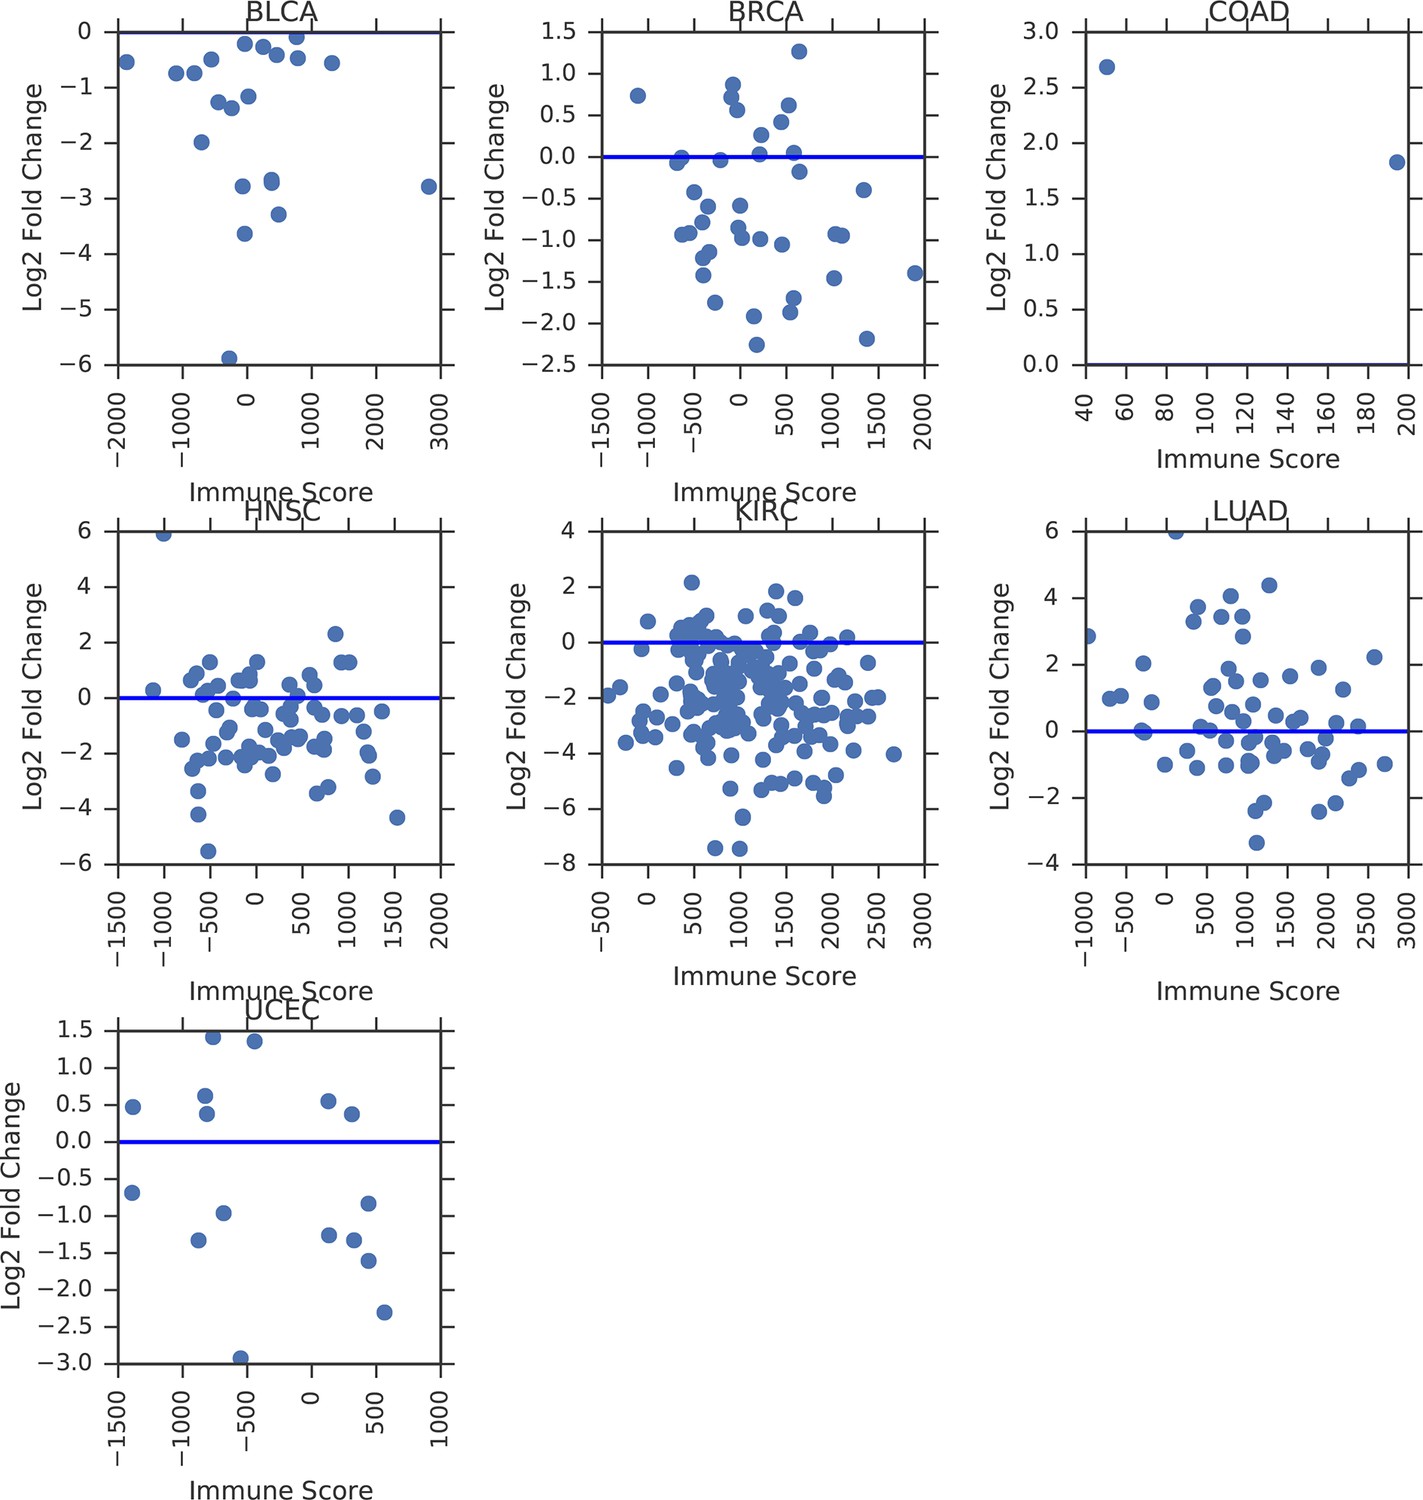
Correlation between tumor/normal mtDNA copy number ratio and ESTIMATE immune scores.
Horizontal line indicates a log ratio of zero (i.e., tumor and normal tissue have identical copy number).
Figure 3—figure supplement 5
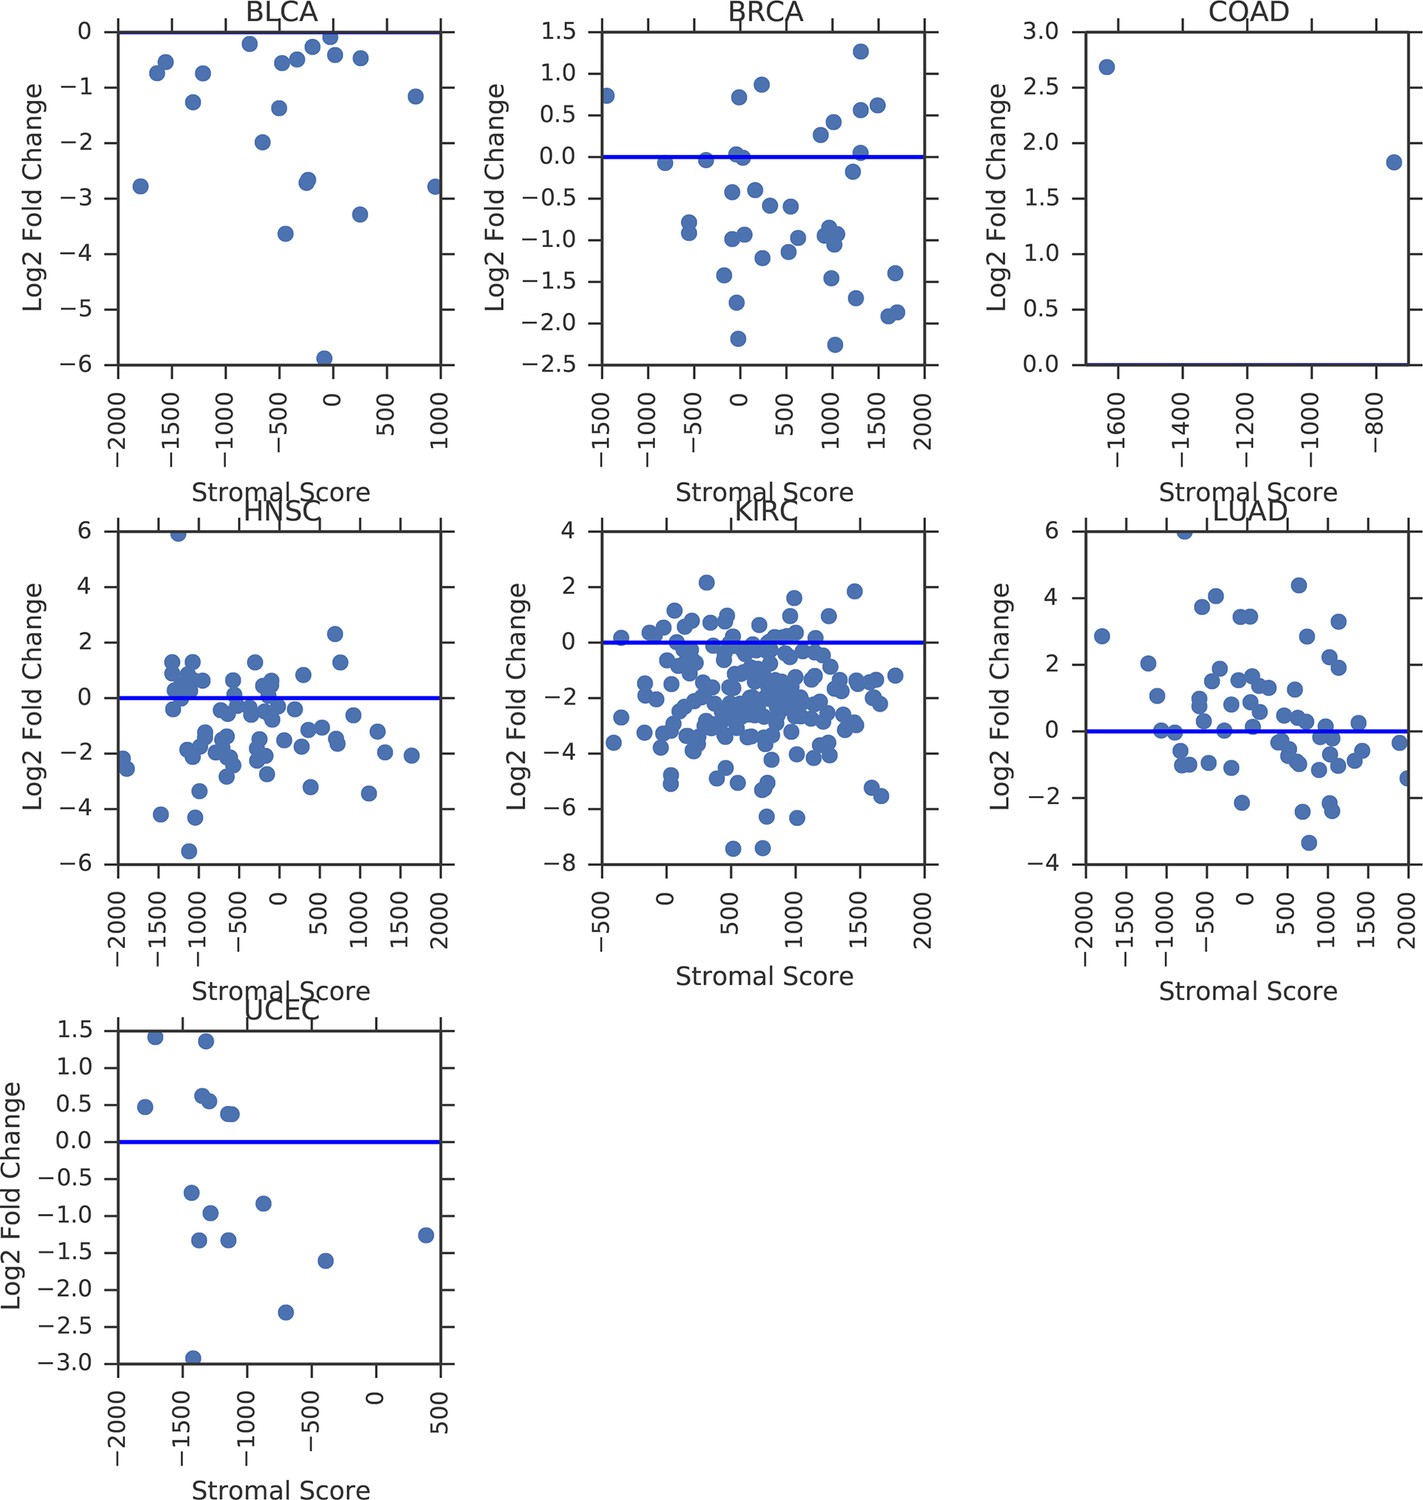
Correlation between tumor/normal mtDNA copy number ratio and ESTIMATE stromal scores.
Horizontal line indicates a log ratio of zero (i.e., tumor and normal tissue have identical copy number).
Figure 4
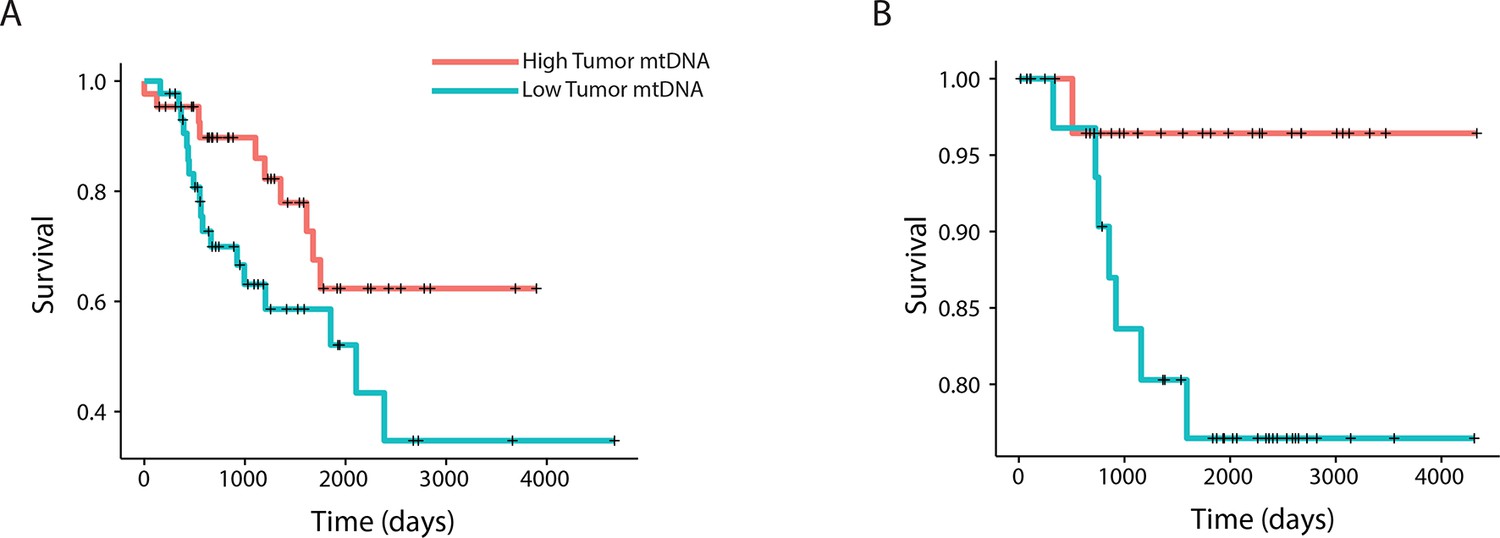
mtDNA content is significantly associated with patient survival in (A) adrenocortical (ACC) and (B) kidney chromophobe carcinoma (KICH).
For visualization purposes, patients are partitioned into two groups, based on tumor mtDNA copy number relative to the median mtDNA copy number across all tumor samples in the cancer type. Cox regression identified a significant association between high tumor mtDNA and better survival in these two tumor types (ACC, p-value 0.026; KICH, p-value 0.053).
Figure 5 with 1 supplement
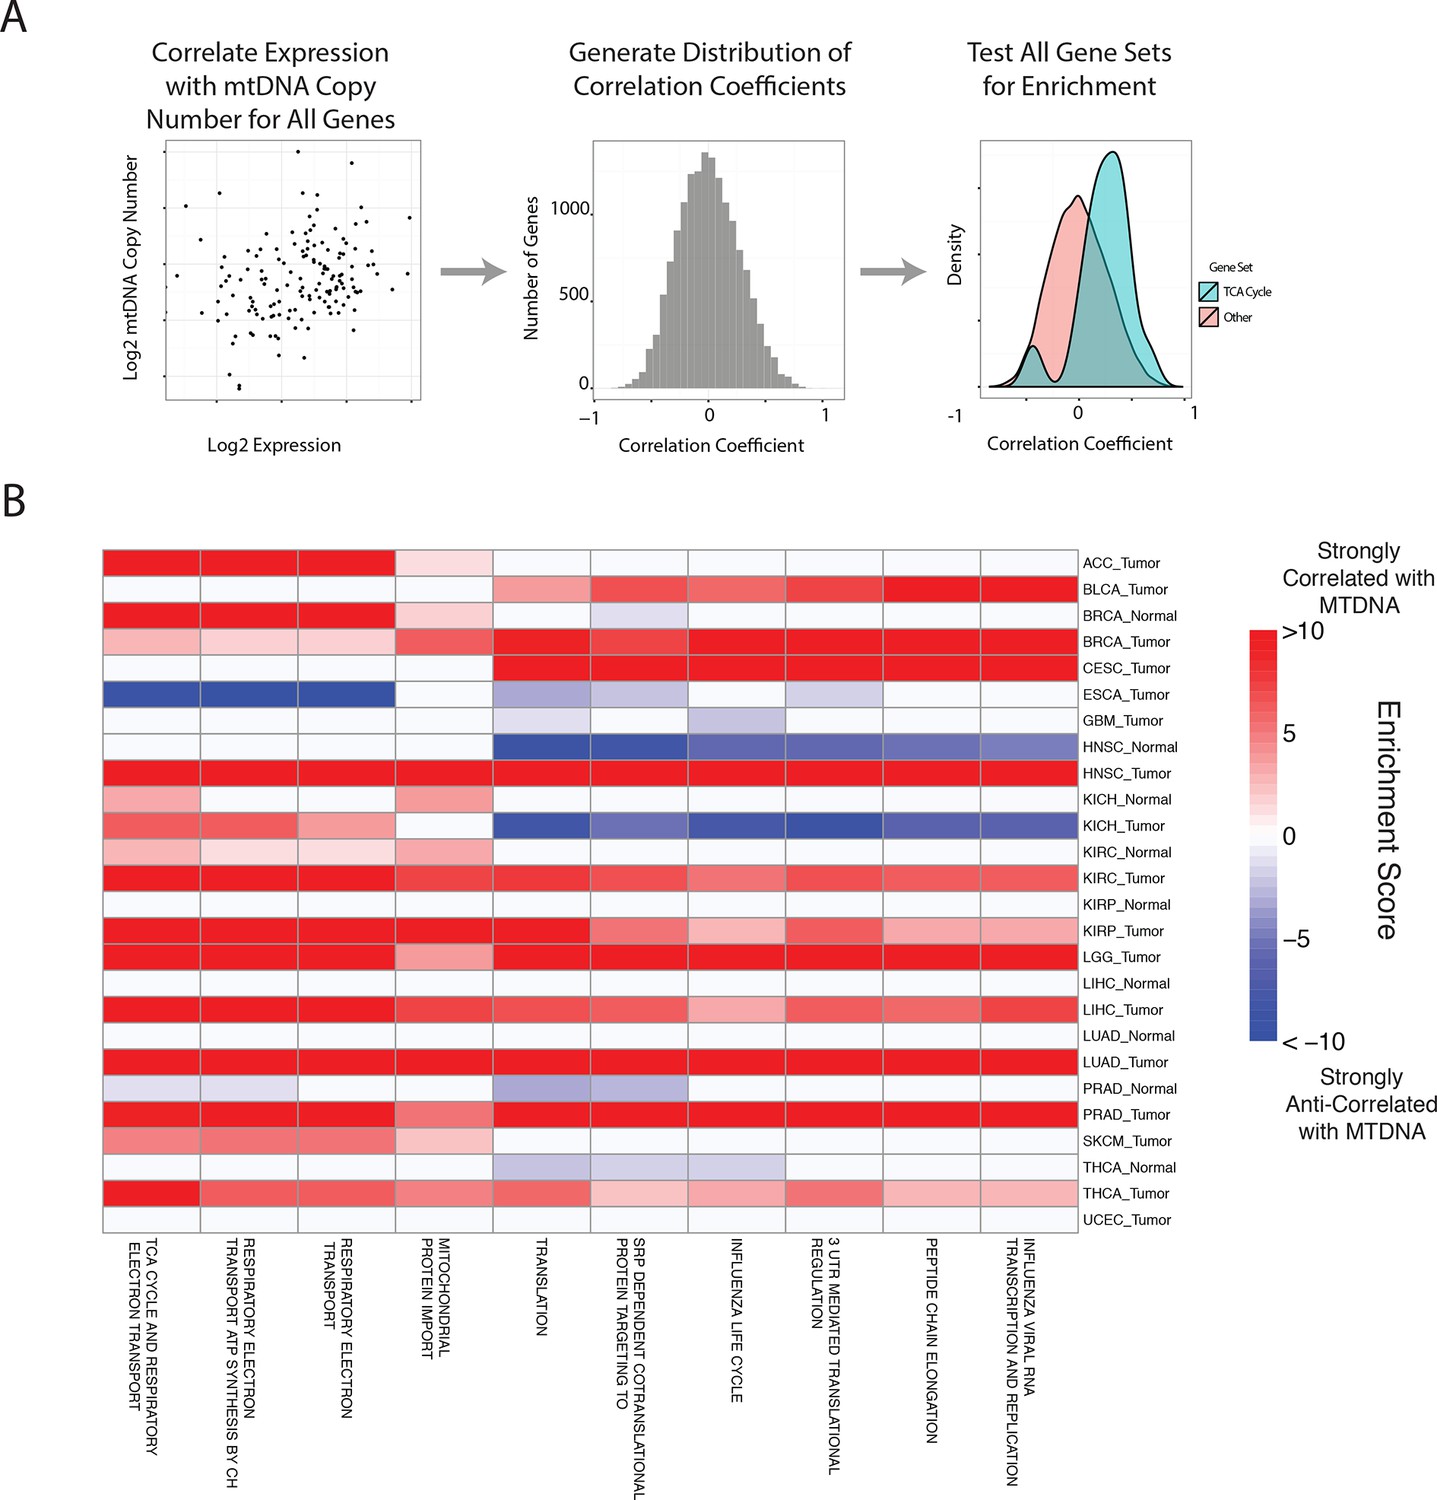
Gene set analysis identifies pathways correlated to mtDNA content.
(A) Correlations between all genes and mtDNA content are calculated. Then, gene sets enriched for high/low correlation coefficients are identified. (B) mtDNA copy number is most strongly correlated to metabolic pathways including respiratory electron transport and the TCA cycle, which are localized to the mitochondria. Enrichment score corresponds to the -log10 p-value of the statistical enrichment test, accounting for the sign of the correlation (i.e. positive or negative correlation). Red blocks indicate an enrichment for positive correlation, blue blocks indicate an enrichment for negative correlation. The top ten most frequently positively correlated gene sets across all studies are depicted. Full results are available in Supplementary file 2.
-
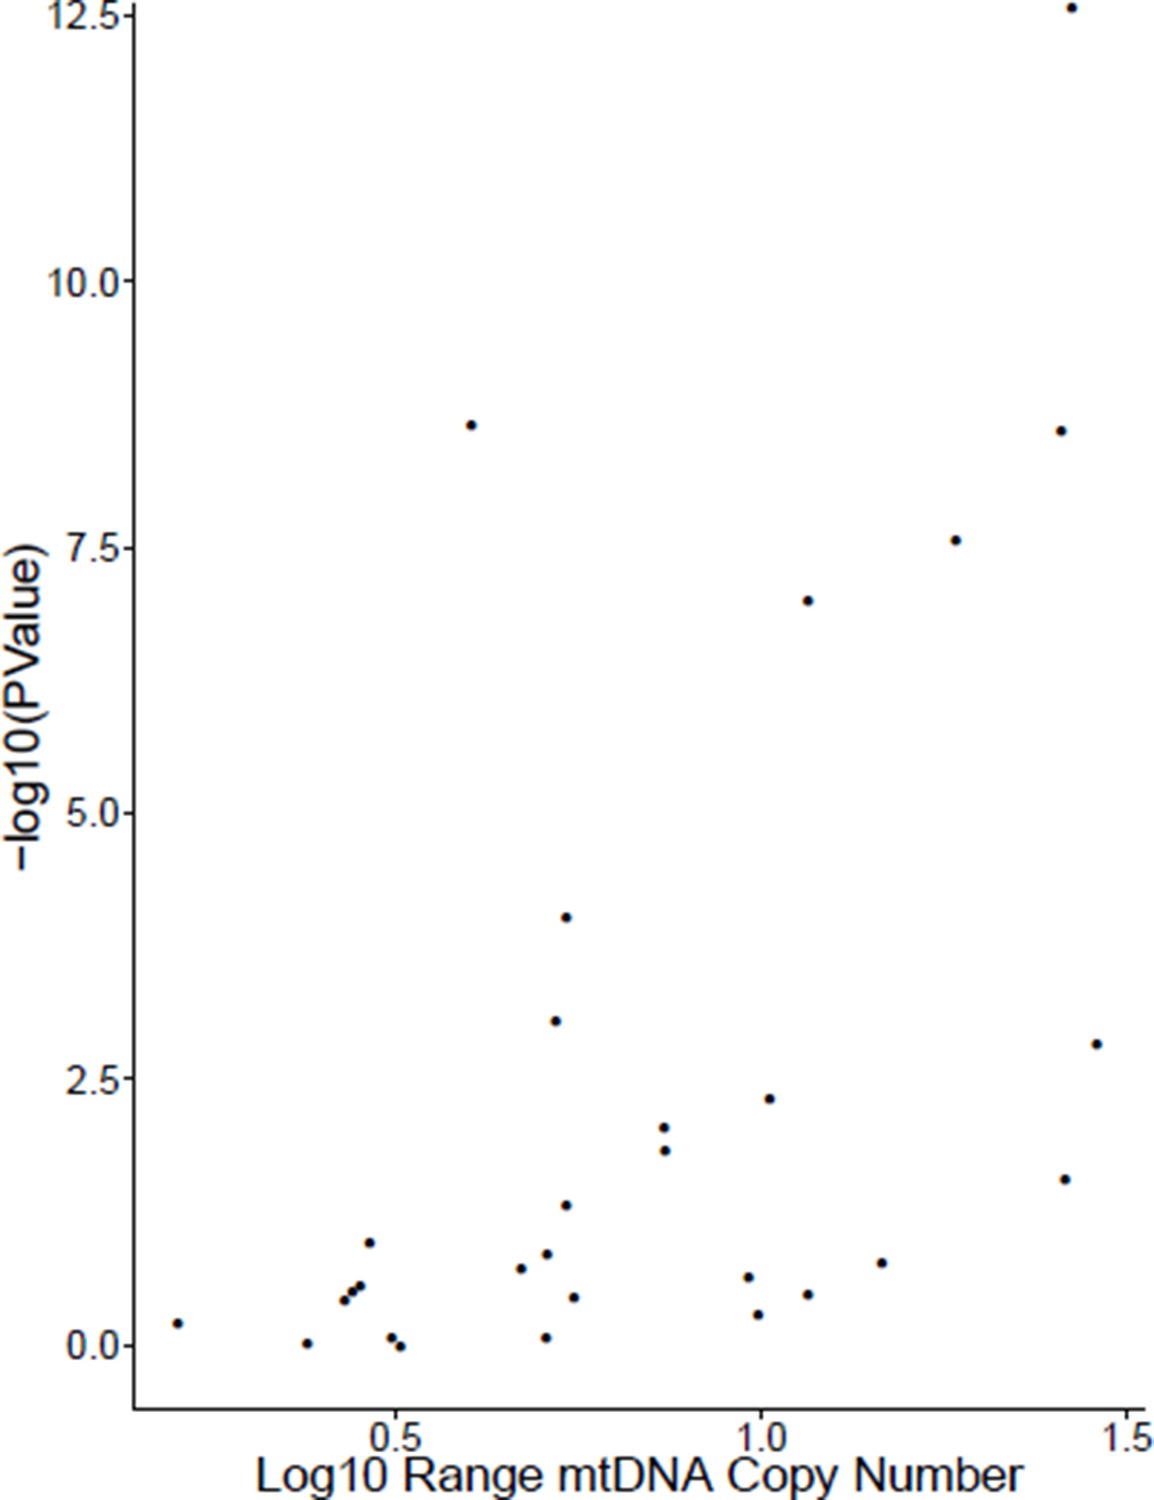
Figure 5—source data 1
Correlation of mtDNA copy number estimates from WXS and expression of TFAM.
Only cases with at least 20 samples were evaluated. Approximately 35% of studies show statistically significant positive correlation. Log10 range indicates the number of orders of magnitude separating the maximal and minimal value of mtDNA copy number in that cohort.
- https://doi.org/10.7554/eLife.10769.015
Figure 5—figure supplement 1
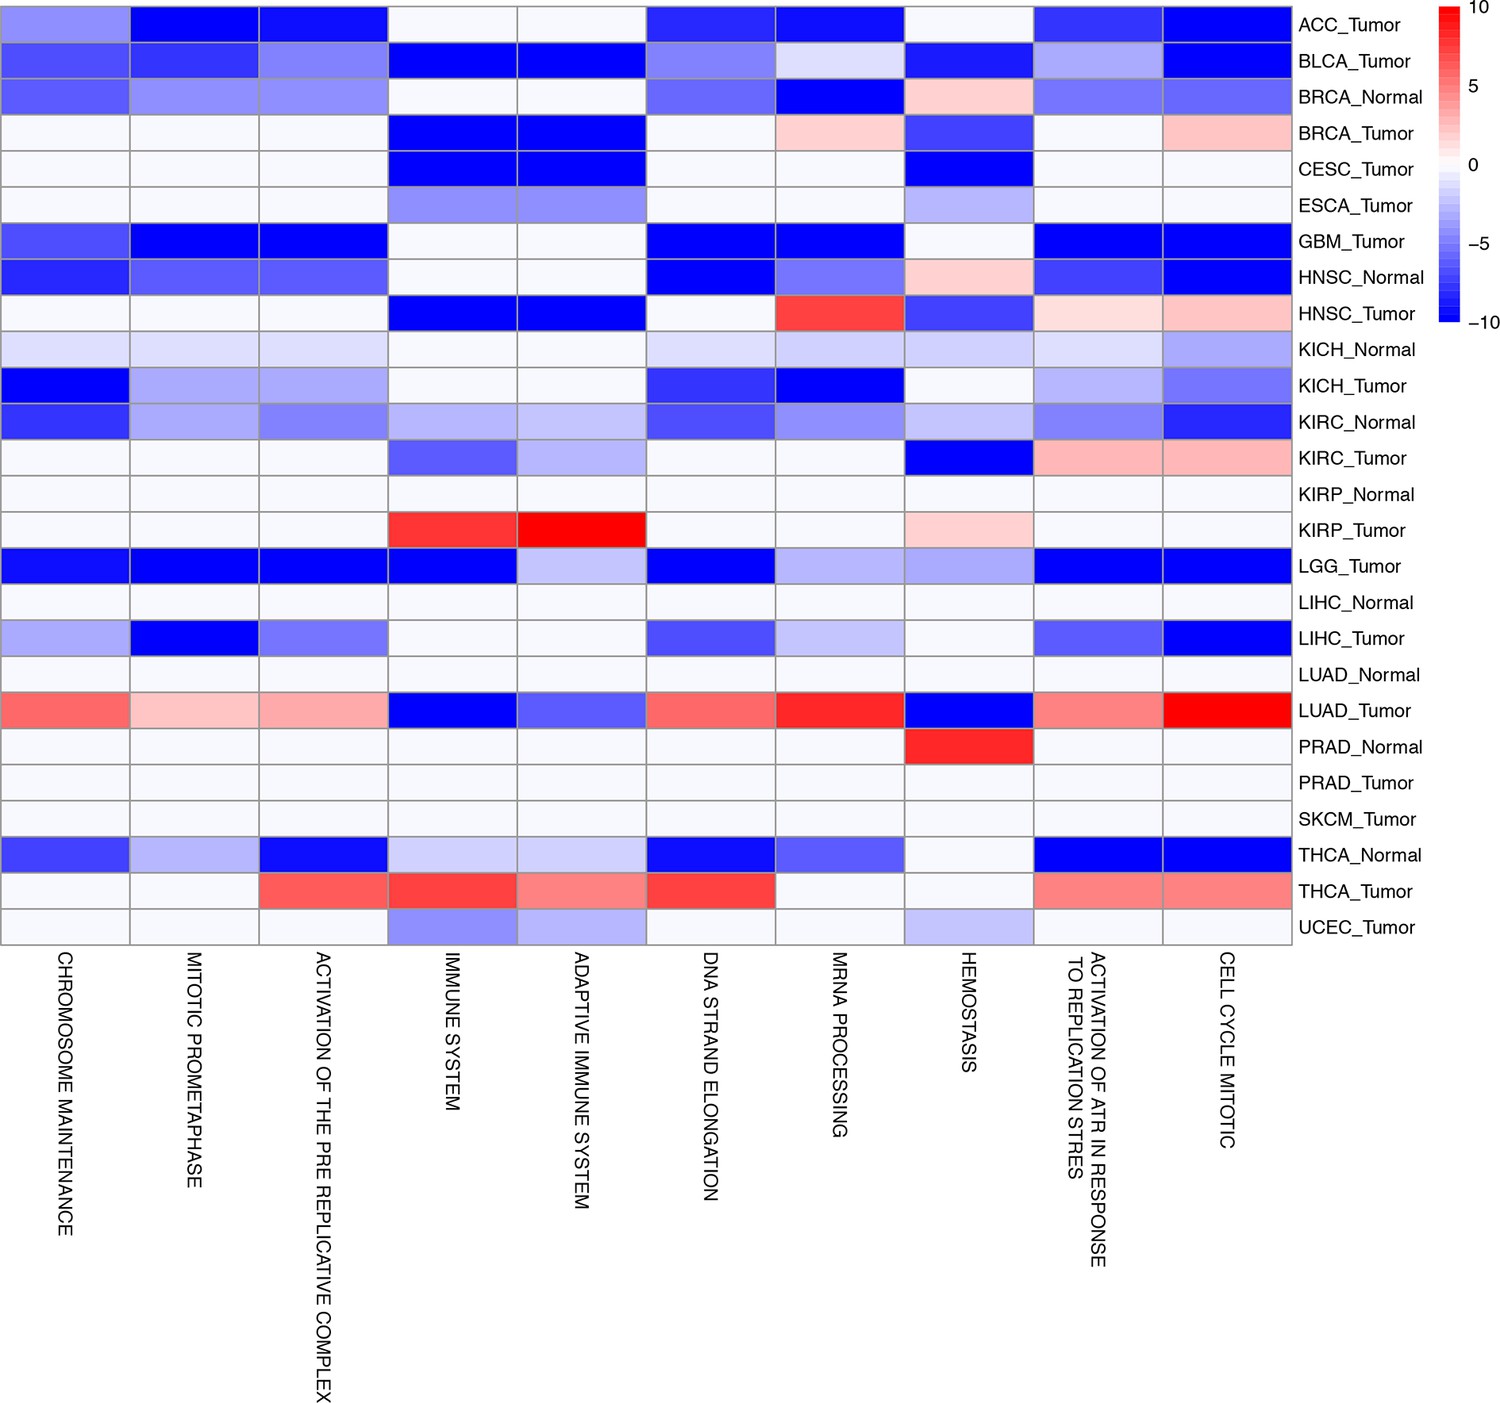
The top ten gene sets most frequently negatively correlated with mtDNA copy number across all studies are depicted.
Enrichment score corresponds to the -log10 p-value of the statistical enrichment test, accounting for the sign of the correlation (i.e., positive or negative). Red blocks indicate an enrichment for po sitive correlation, blue blocks indicate an enrichment for negative correlation. Full results are available in Figure 5—source data 1.
Figure 6 with 1 supplement
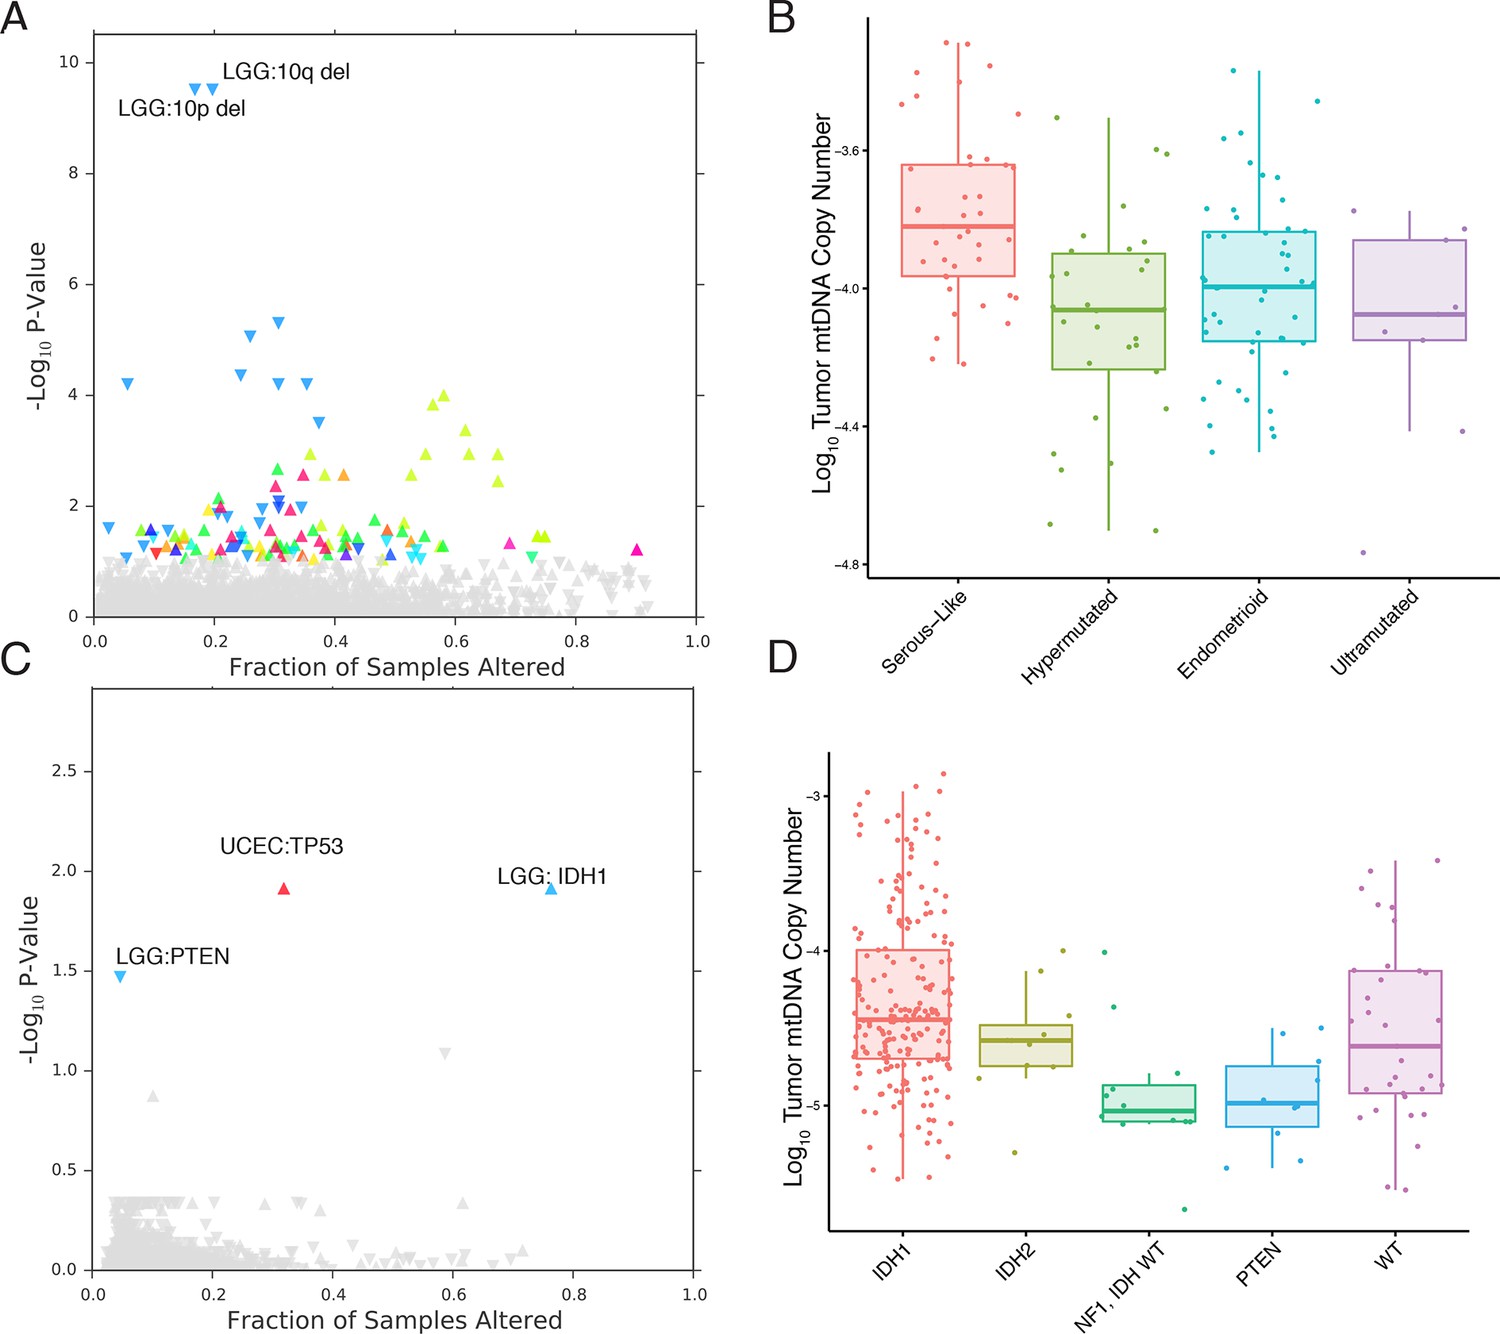
mtDNA content is correlated to the incidence of certain mutations and copy number alterations.
Each point corresponds to a single alteration (e.g TP53 mutation). Direction of arrow indicates whether alteration increases or decreases mtDNA content. X-axis in (A) and (C) indicates the fraction of samples in a cancer-type that contained the alteration (i.e., 20% of LGG samples were 10q deleted). (A) 73 out of 1896 copy number alterations (CNAs) tested were found to be significantly associated with mtDNA content (Mann-Whitney p-value <0.05). CNAs from the UCEC cancer type were excluded because of strong association between mtDNA copy number and the ‘copy-number high’ serous-like subtype in UCEC, shown in (B). (B) The UCEC serous-like subtype displays a marked increase in tumor mtDNA copy number, relative to endometrial tumors of other subtypes. (C) Relatively few mutations (3 out of 3954 tested) associate significantly with tumor mtDNA content (Mann-Whitney p-value <0.05). The UCEC associations are likely the result of the correlation to the serous-like subtype. (D) IDH1 and PTEN mutation status is linked to tumor mtDNA copy number in LGG.
Figure 6—figure supplement 1
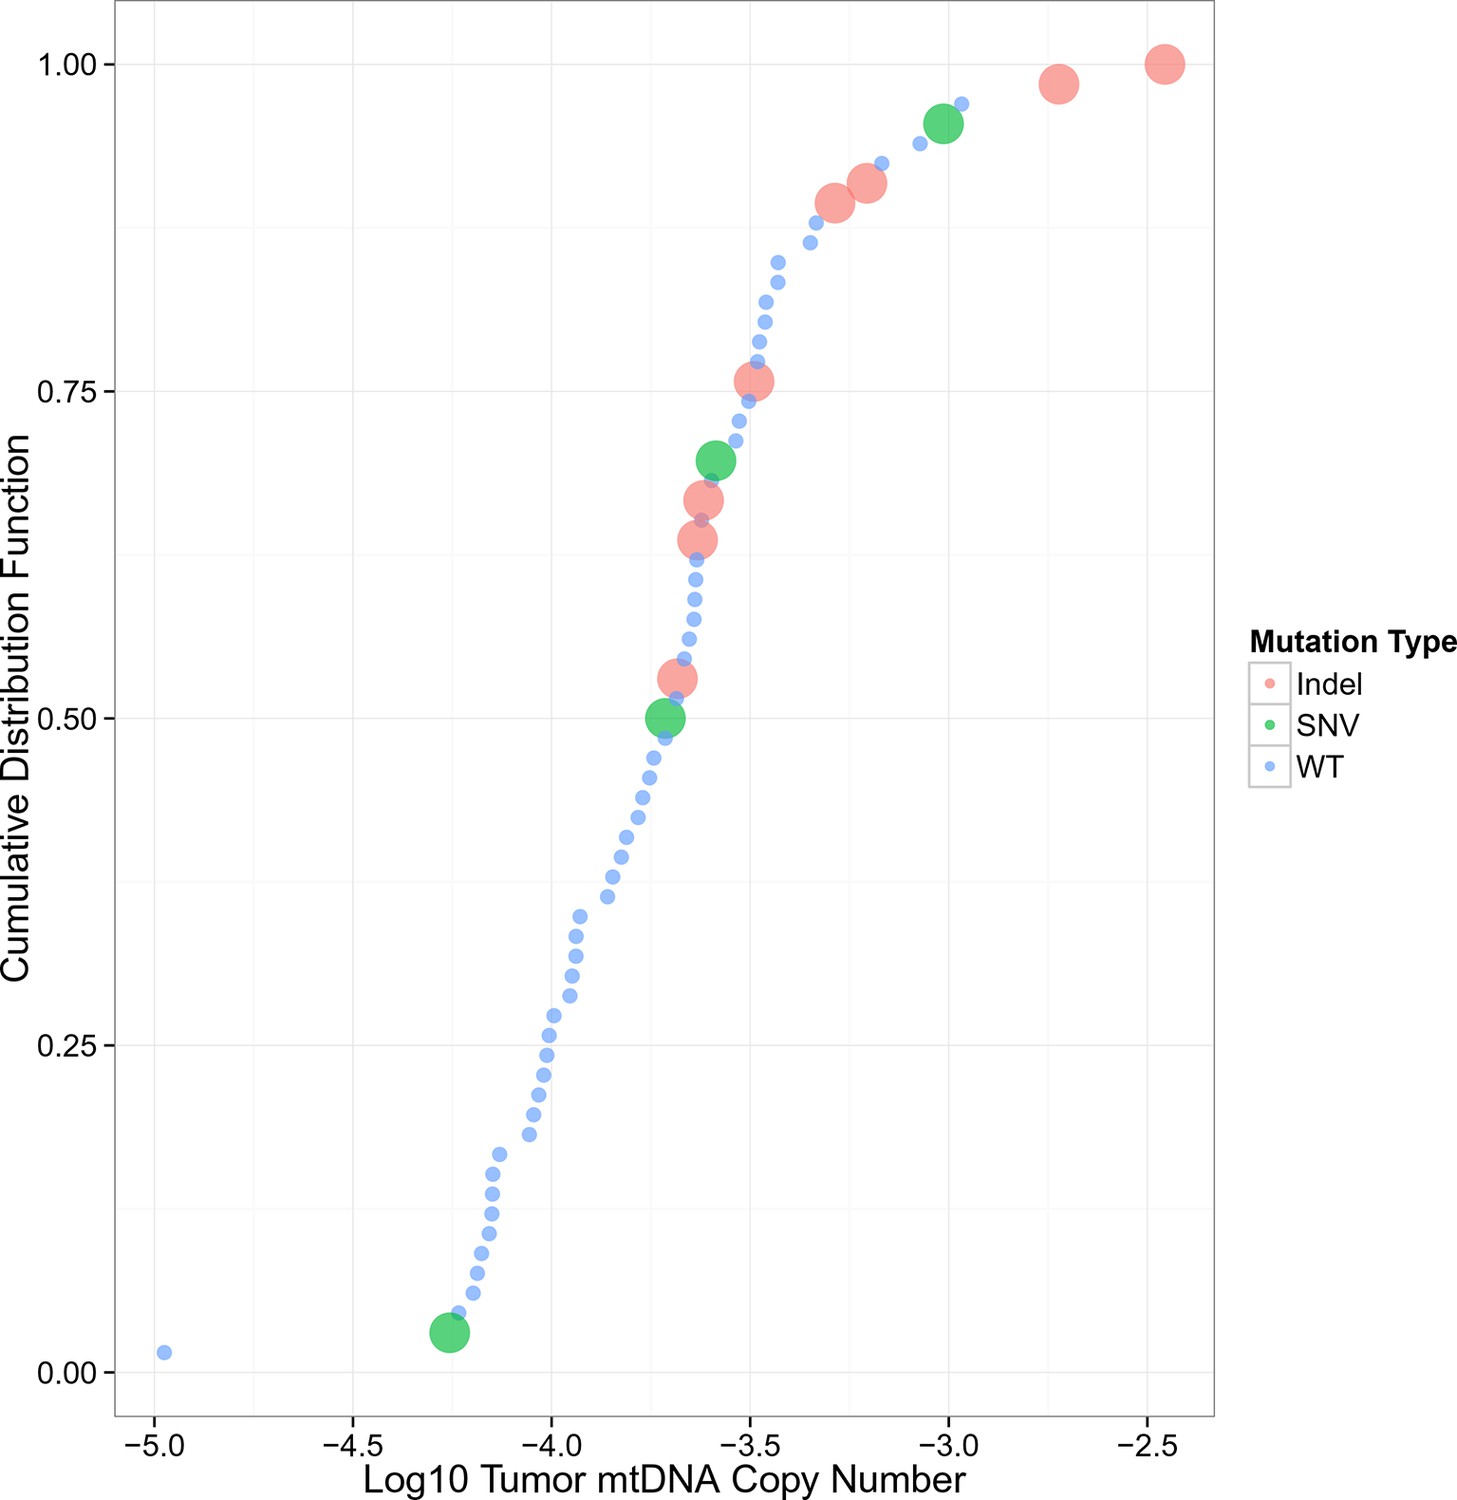
mtDNA copy number levels in kidney chromophobe carcinoma are elevated in samples with truncating mtDNA mutations.
Samples are sorted by increasing mtDNA copy number on the X-axis, with percentile indicated on the Y-axis.
Figure 7
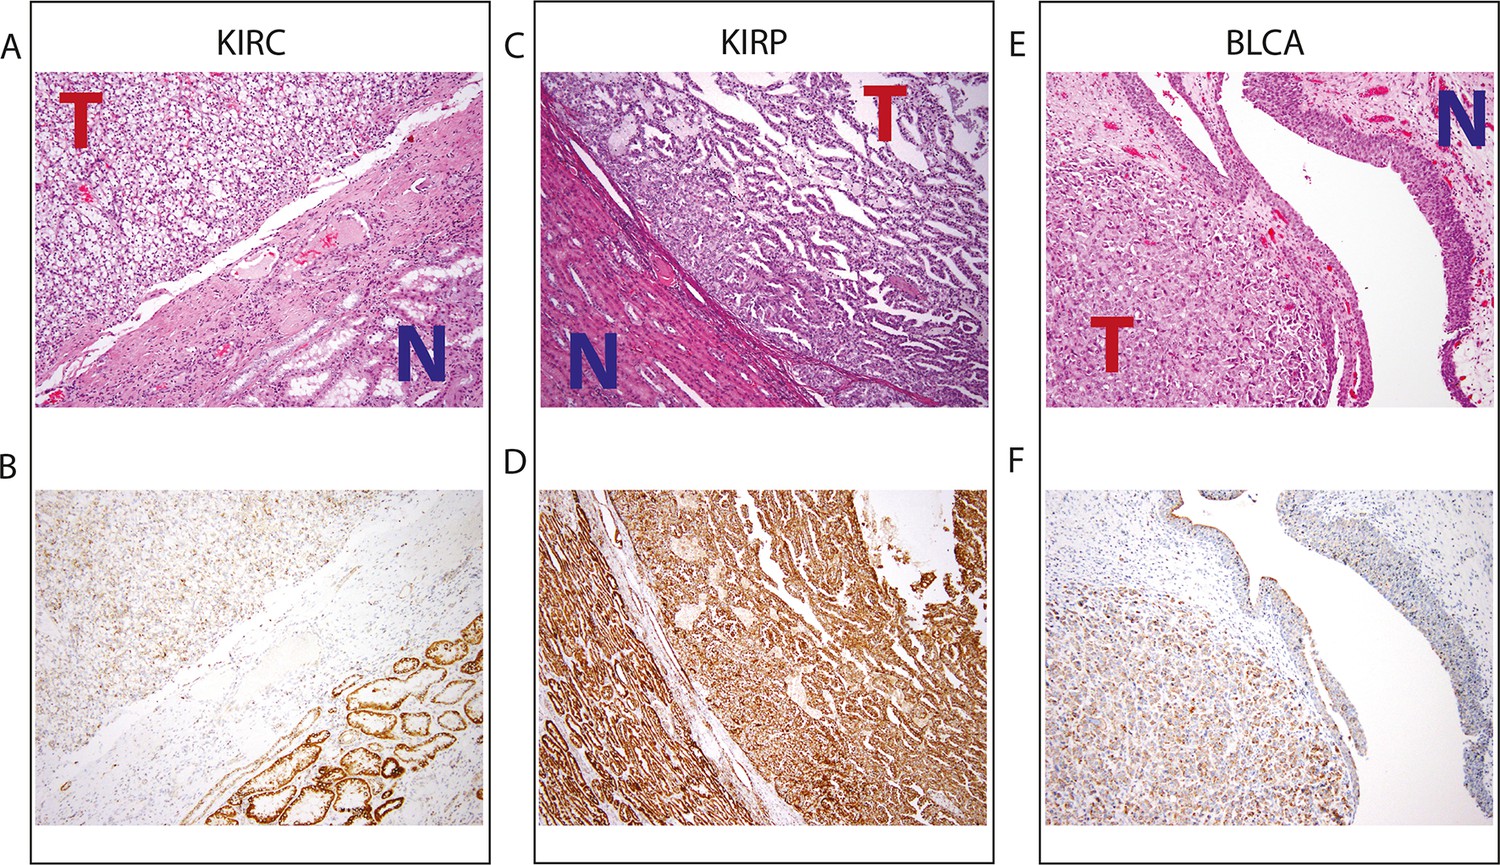
Top panel depicts H&E stains, and bottom panel depicts immunohistochemistry with antibody against mitochondrial protein.
In all H&E stains, red ‘T’ indicates tumor tissue, while blue ‘N’ indicates normal tissue. Orientation of tumor/normal tissue is mirrored in bottom panel. (A) H&E-stained section shows clear cell renal cell carcinoma (top left, KIRC Sample 1 from Figure 7—source data 1) with the classical features of tumor nests with clear cytoplasm, separated by intricate, branching vascular septae, and adjacent non-neoplastic renal parenchyma (lower right). (B) KIRC Sample 1 immunohistochemical staining with MITO Ab2 antibody reveals markedly lower mitochondrial content (cytoplasmic, brown granular positivity) in clear cell RCC compared to normal tubules. (C) H&E-stained section shows papillary renal cell carcinoma type 1 (KIRP Sample 3) with tumor (top right) and normal tubules (lower left). (D) KIRP Sample 3 immunohistochemical stain with MITO Ab2 antibody shows KIRP with a slightly weaker positivity compared to normal tubules. (E) H&E-stained section showing invasive high grade urothelial carcinoma (lower left) with sheets of tumor cells in the lamina propria and the overlying normal urothelium (top right). (F) Immunohistochemical staining with MITO Ab2 antibody reveals slightly higher mitochondrial staining in urothelial carcinoma compared to normal urothelium.
-
Figure 7—source data 1
Table of results of immunohistochemistry for mitochondrial protein.
The H-score for KIRC was significantly less than matched normal renal parenchyma in 3/3 samples. The H-score for KIRP was marginally lower than the H-score than matched normal renal parenchyma in 2/3 samples.The H-score for BLCA was higher than the H-score for matched normal urothelial tissue in 2/3 samples.
- https://doi.org/10.7554/eLife.10769.020
Author response image 1
Author response image 2
Comparison of mtDNA copy number estimates from samples profiled using both WGS and WXS.
Results above are those prior to batch-correction of mtDNA copy number.
Additional files
-
Supplementary file 1
Summary table of mtDNA copy number in tumor, adjacent-normal, and blood samples from the TCGA.
Data for a patient is included if and only if a tumor sample was sequenced. Normal tissue/blood data without a matching tumor sample is not included, but was used for batch-correction calculations.
- https://doi.org/10.7554/eLife.10769.021
-
Supplementary file 2
Results of gene set analysis.
Enrichment scores for each cancer type are negative log10 p-values.First column indicates enrichment score for positive correlations between mtDNA copy number and gene expression, second column indicates enrichment score for negative correlations between mtDNA copy number and gene expression.
- https://doi.org/10.7554/eLife.10769.022
-
Supplementary file 3
Results of association analysis with copy number alterations.
As mentioned in the main text, associations with the UCEC cancer type are removed.
- https://doi.org/10.7554/eLife.10769.023
-
Supplementary file 4
Results of association analysis with mutations.
- https://doi.org/10.7554/eLife.10769.024
Download links
A two-part list of links to download the article, or parts of the article, in various formats.
Downloads (link to download the article as PDF)
Open citations (links to open the citations from this article in various online reference manager services)
Cite this article (links to download the citations from this article in formats compatible with various reference manager tools)
Mitochondrial DNA copy number variation across human cancers
eLife 5:e10769.
https://doi.org/10.7554/eLife.10769


