Active contraction of microtubule networks
- Harvard University, United States
- New York University, United States
Figures
Figure 1

Stabilized microtubules form asters in Xenopus egg extracts.
(A) Experiments were performed in thin rectangular channels of width , height , and length . (B) In some regions of the channel, microtubules organize into asters, with minus ends localized in the aster core (Scale bar, m). (C) Isolated asters fuse together over minute timescales (Scale bar, m). (D) Aster-like structures form in other regions of the channel (Scale bar, m) (E) Aster-like structures show large scale movement on minute timescales. (Scale bar, m). (F) NUMA localizes to the network interior (Scale bar, m). (G) Closeup of aster-like structure showing NUMA localized on the interior (Scale bar, m).
Figure 2 with 1 supplement
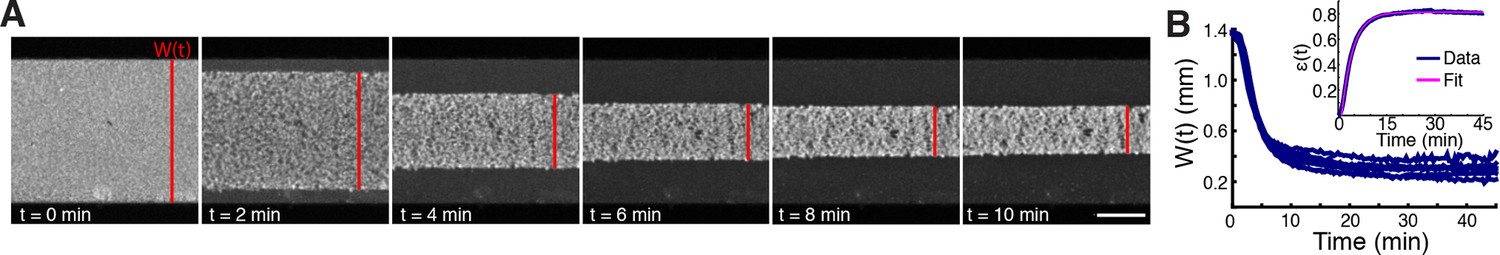
Stabilized microtubules form a contractile network in Xenopus egg extracts.
(A) Low magnification imaging shows that microtubules form a contractile network (Scale bar, m). (B) The width of the microtubule network decreases with time (n = experiments). (Inset) Representative plot of (t) (Blue line) and fit from (Equation 2) (Pink line), with , min, min.
Figure 2—figure supplement 1
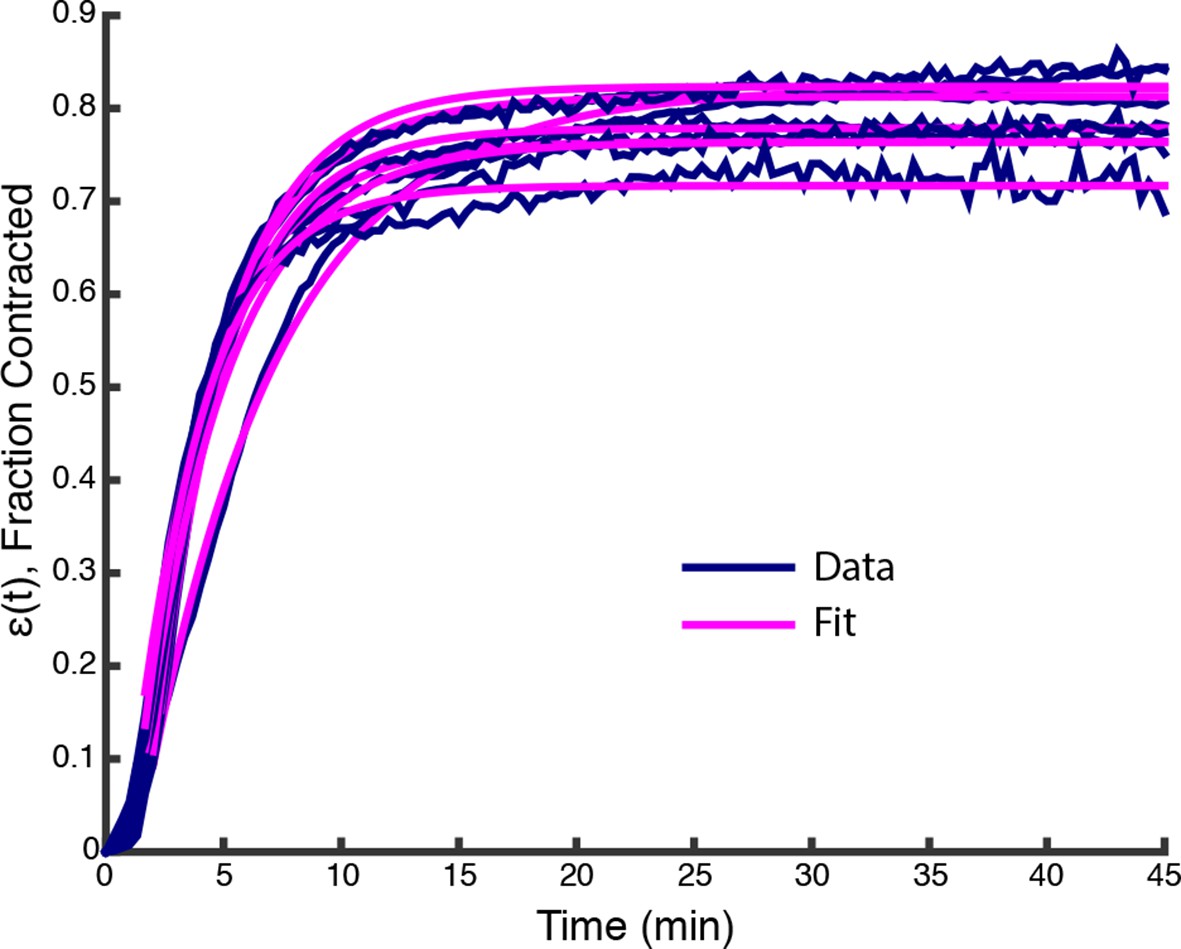
Plots of (t) from data in Figure 1F (Blue lines) along with fits from (Equation 2) (Pink lines).
https://doi.org/10.7554/eLife.10837.007
Figure 3
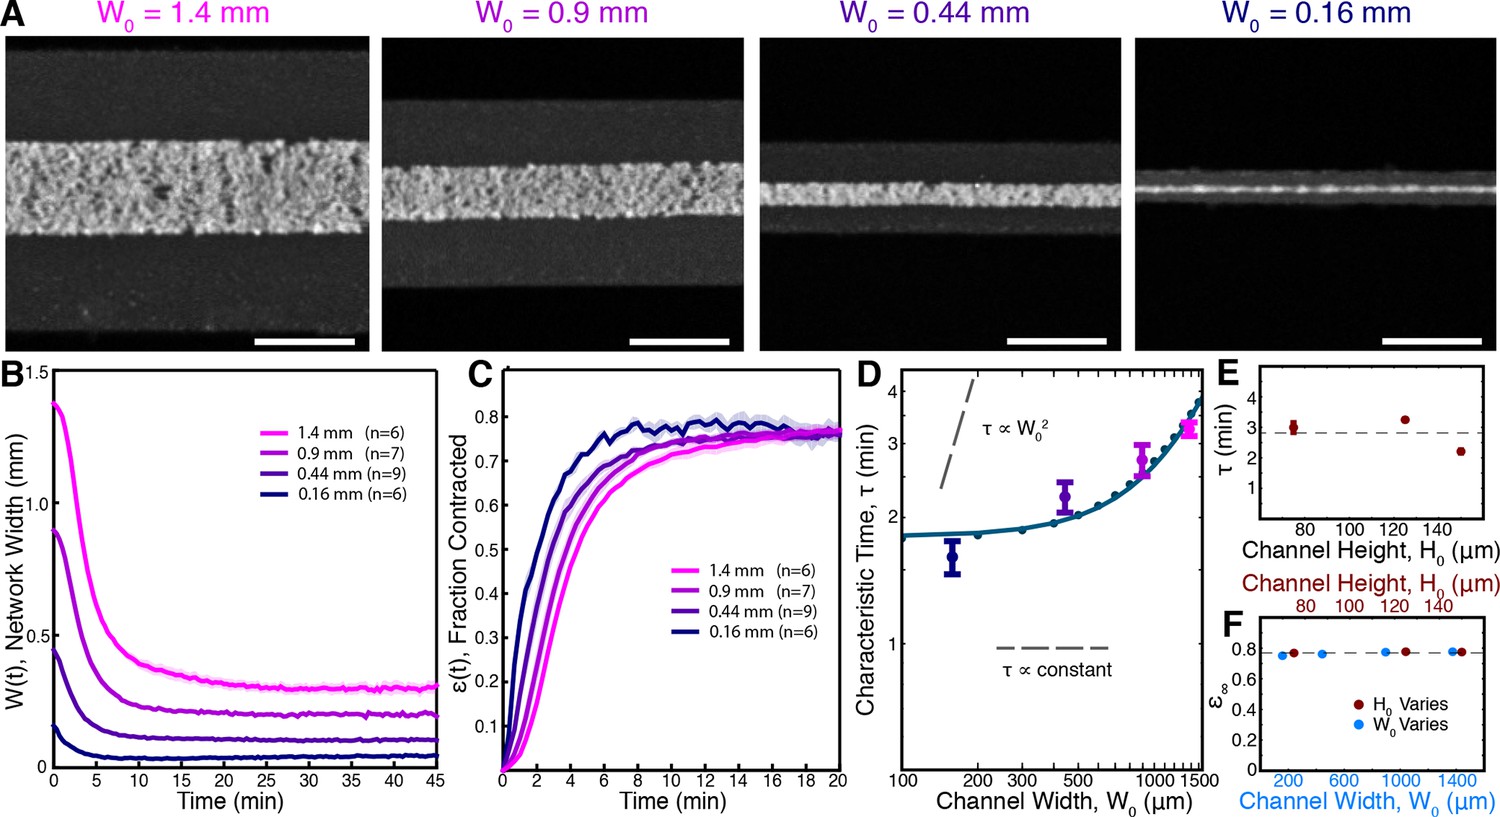
Contraction dynamics in channels of different width provide a means to test potential contraction mechanisms.
(A) Microtubules form contractile networks in channels with various widths (Scale bar, 500 m, t=10 min). (B) Width of the networks as a function of time in channels with various widths. (C) Fraction contracted as a function of time, (t), calculated from the data in B. The networks all contract to a similar final fraction, while the timescale of contraction differs. (D) The scaling of the characteristic time, , with channel width does not vary as , as would result for a poroelastic timescale, and is not a constant, independent of width, as would result from a viscoelastic timescale. The scaling is well described by an active fluid model (green line analytic scaling, fit to (Equation 6); green dots numerical solution). (E) The characteristic time, , is found to be independent of channel height. The dashed line is the mean value of . (F) is constant for all channel widths and heights, indicating that the network contracts to a constant final density. The dashed line is the mean value of . All panels display mean s.e.m.
Figure 4
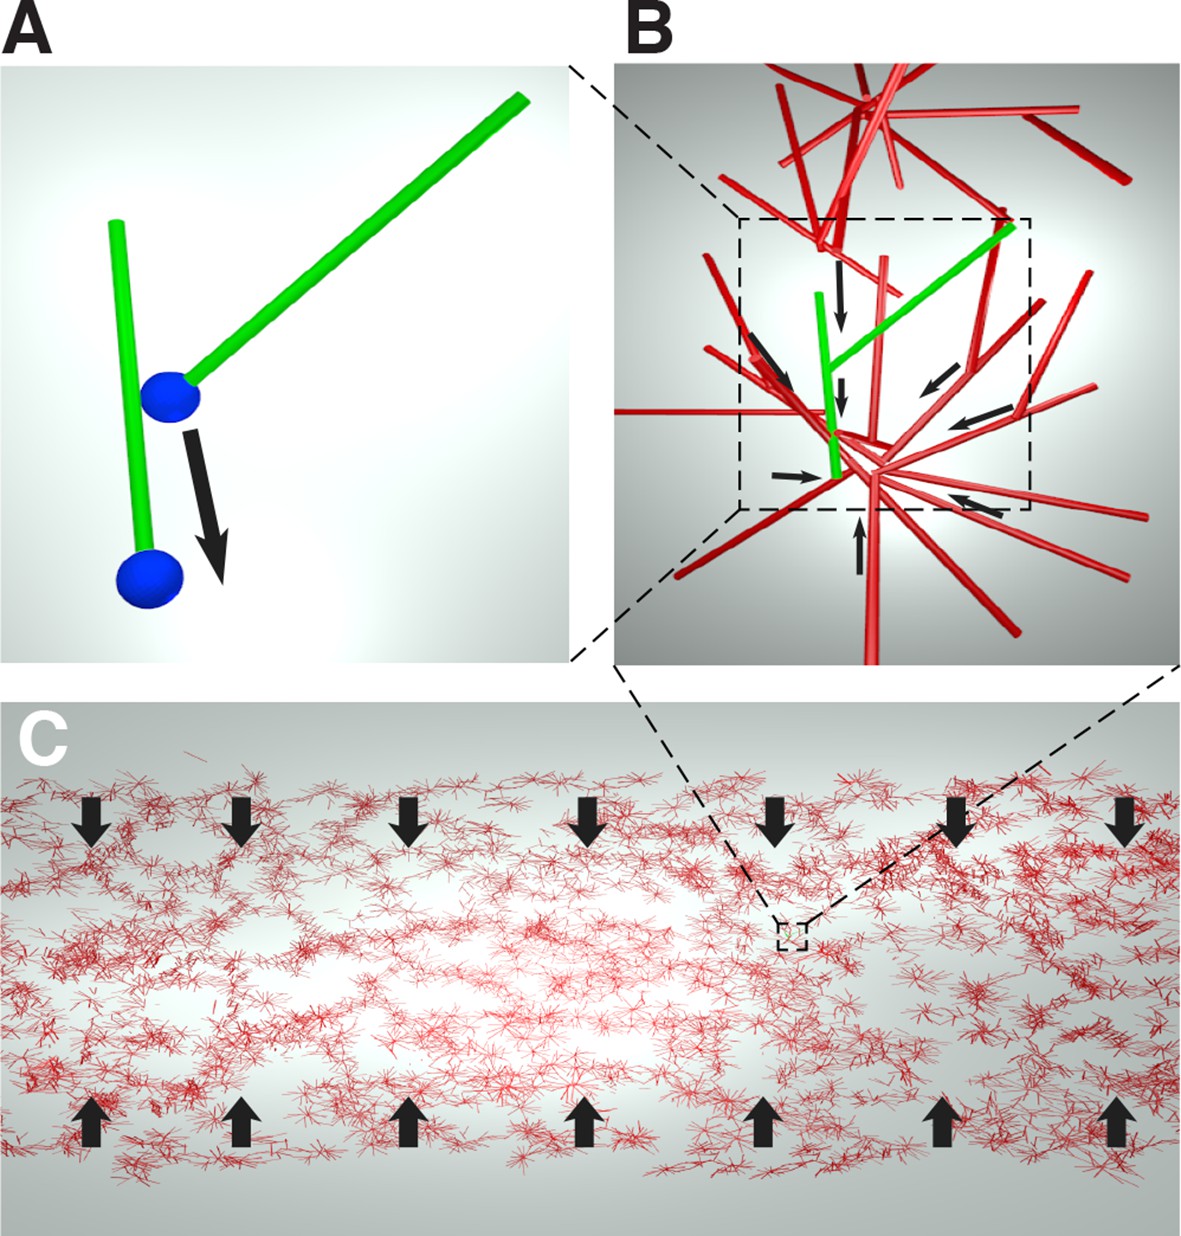
Cartoon of the microscopic model underlying the active fluid theory of network contractions by minus end clustering.
(A) Microtubule sliding by dynein drives microtubule minus ends together. (B) Minus end clustering leads to the formation of aster-like structures. Due to steric interactions between microtubules, there is an upper limit to the local microtubule density. (C) The microtubule network is composed of interacting asters. Motor activity driving aster cores together leads to bulk contraction of the network.
Figure 5 with 1 supplement
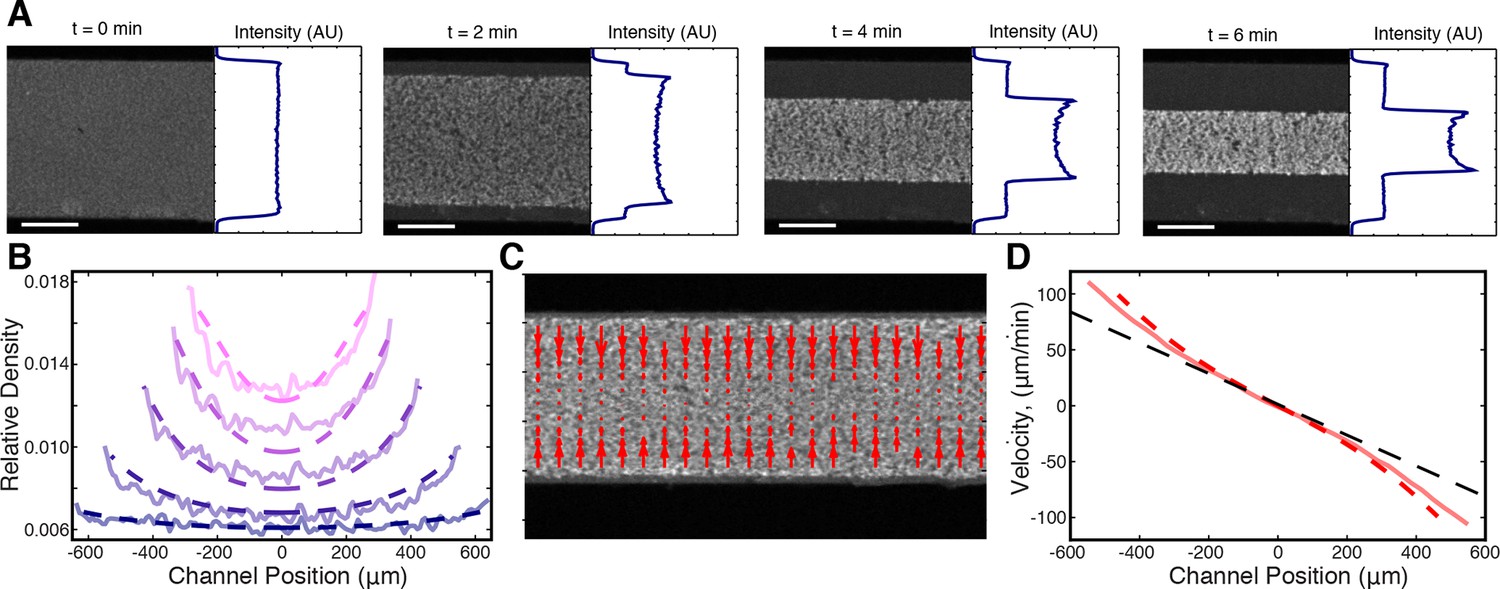
Microtubule density increases at the network’s edges during contraction.
(A) Time series of contraction showing intensity averaged along the length of the channel. The average intensity peaks at the network’s edges due to increased local microtubule density. (Scale bars, 500 m) (B) Comparison of measured density profiles (solid lines) with density profiles from simulation (dashed lines). Data are plotted at 1 min intervals starting at t = 40 s. (C) Representative frame from PIV showing the network’s local velocity component along the network’s width. (D) Comparison between measured (solid red line) and simulated (dashed red line) velocity along the width of the channel at t = 80 s. The measured and simulated velocities increase superlinearly with distance from the center of the network, as can be seen by comparison to a linear velocity profile (dashed black line).
Figure 5—figure supplement 1
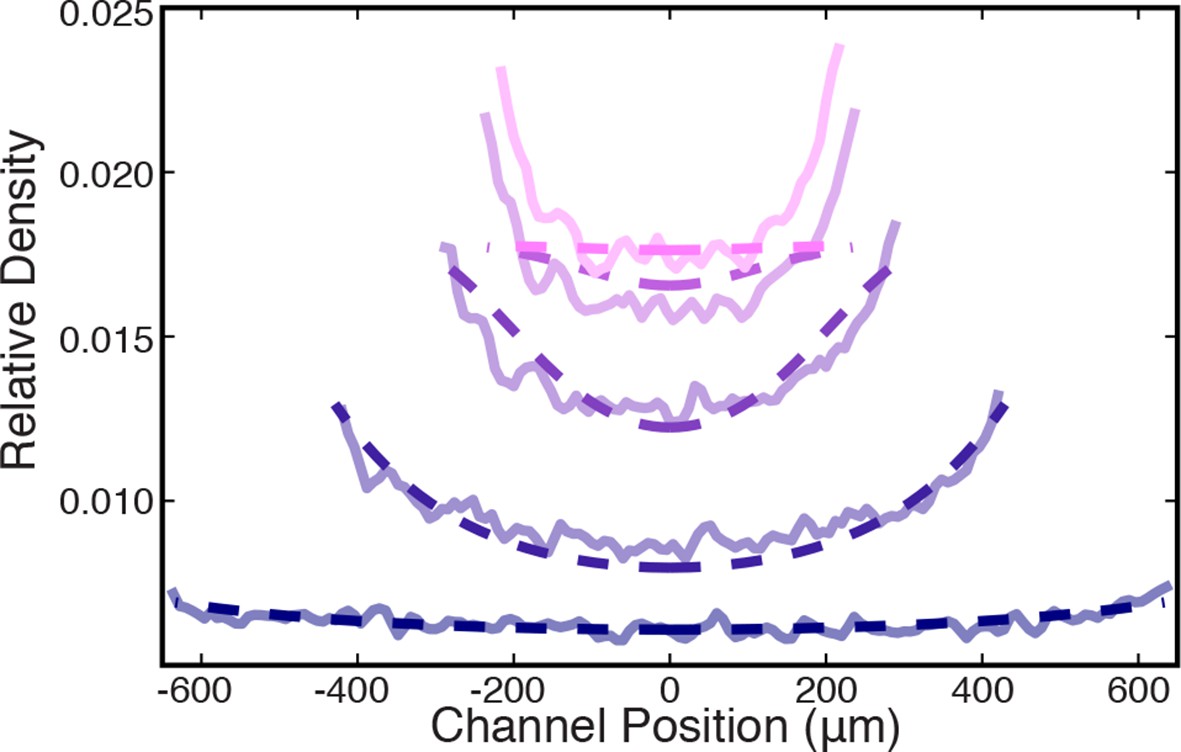
Comparison between measured (solid lines) and simulated (dashed lines) density profiles.
Data are plotted at 2 min intervals starting at t = 40 s.
Figure 6 with 2 supplements
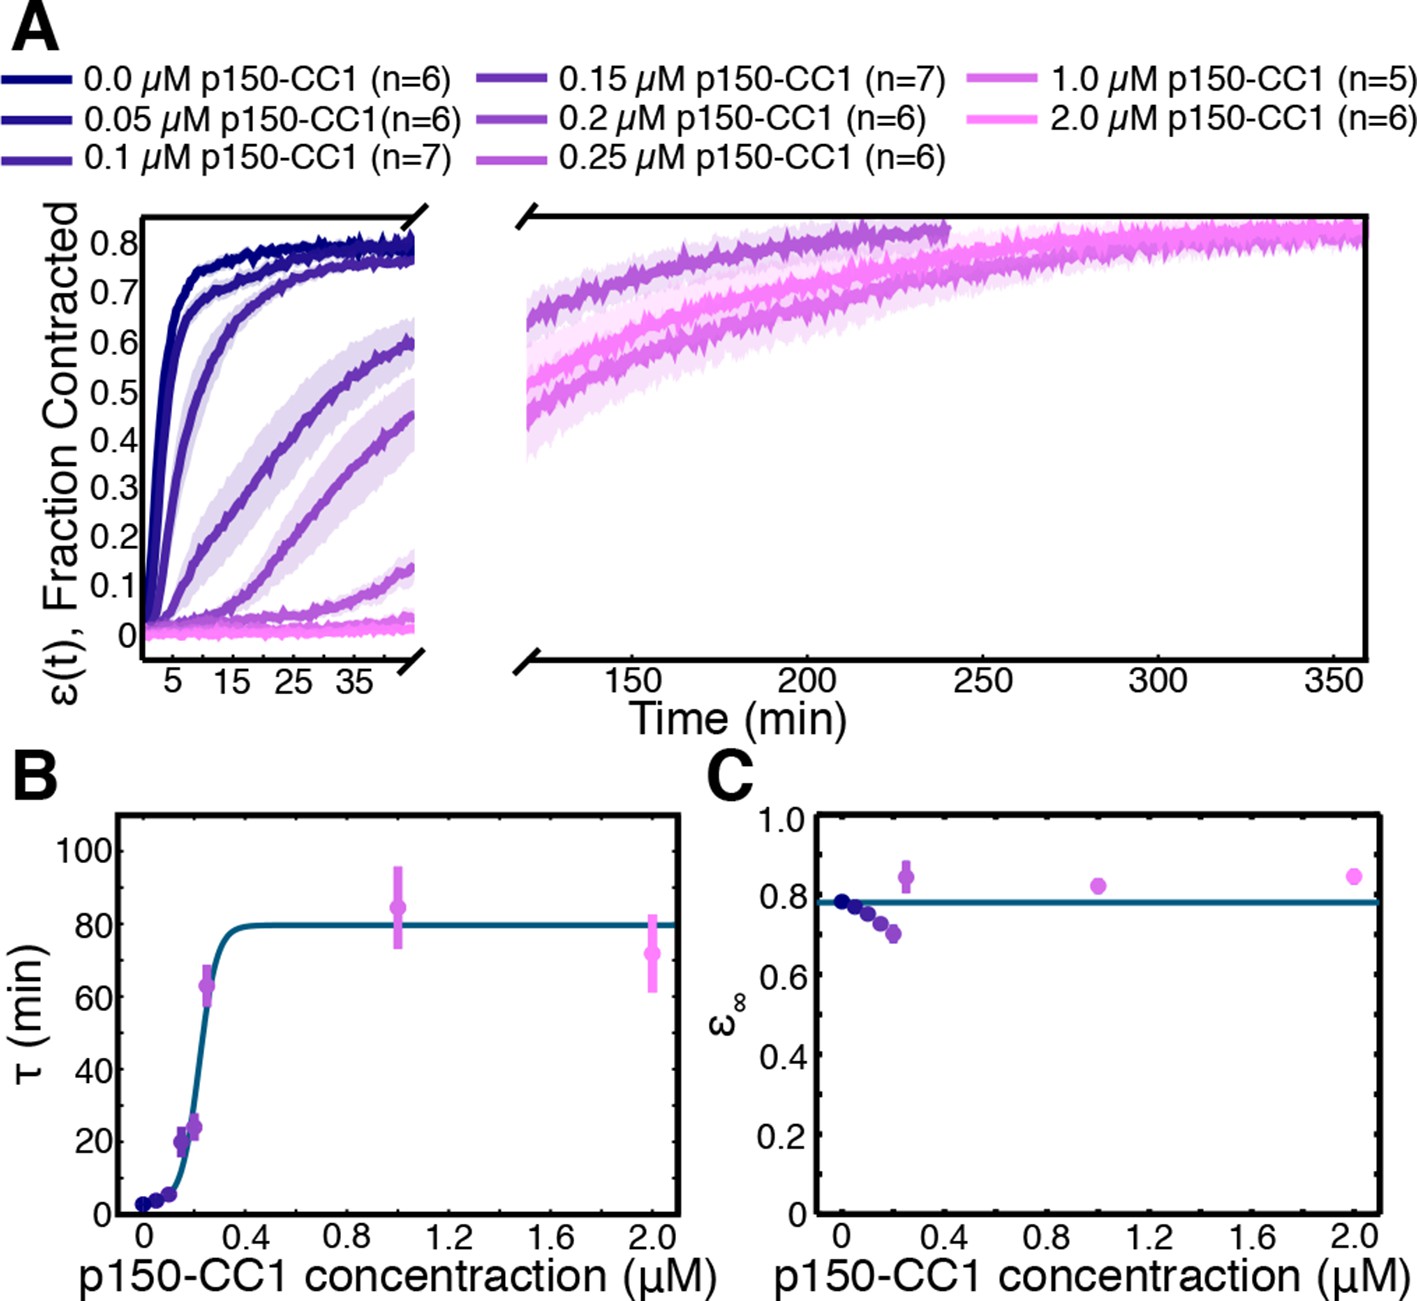
Network contraction is a dynein-dependent process.
(A) Fraction contracted as a function of time, (t), when dynein is inhibited using p150-CC1. (B) The characteristic time of contraction, , increases with increasing p150-CC1 concentration. Solid green line indicates fit of sigmoid function. (C) has no apparent variation with p150-CC1 concentration. Solid green line indicates the mean value of . All panels display mean s.e.m.
Figure 6—figure supplement 1
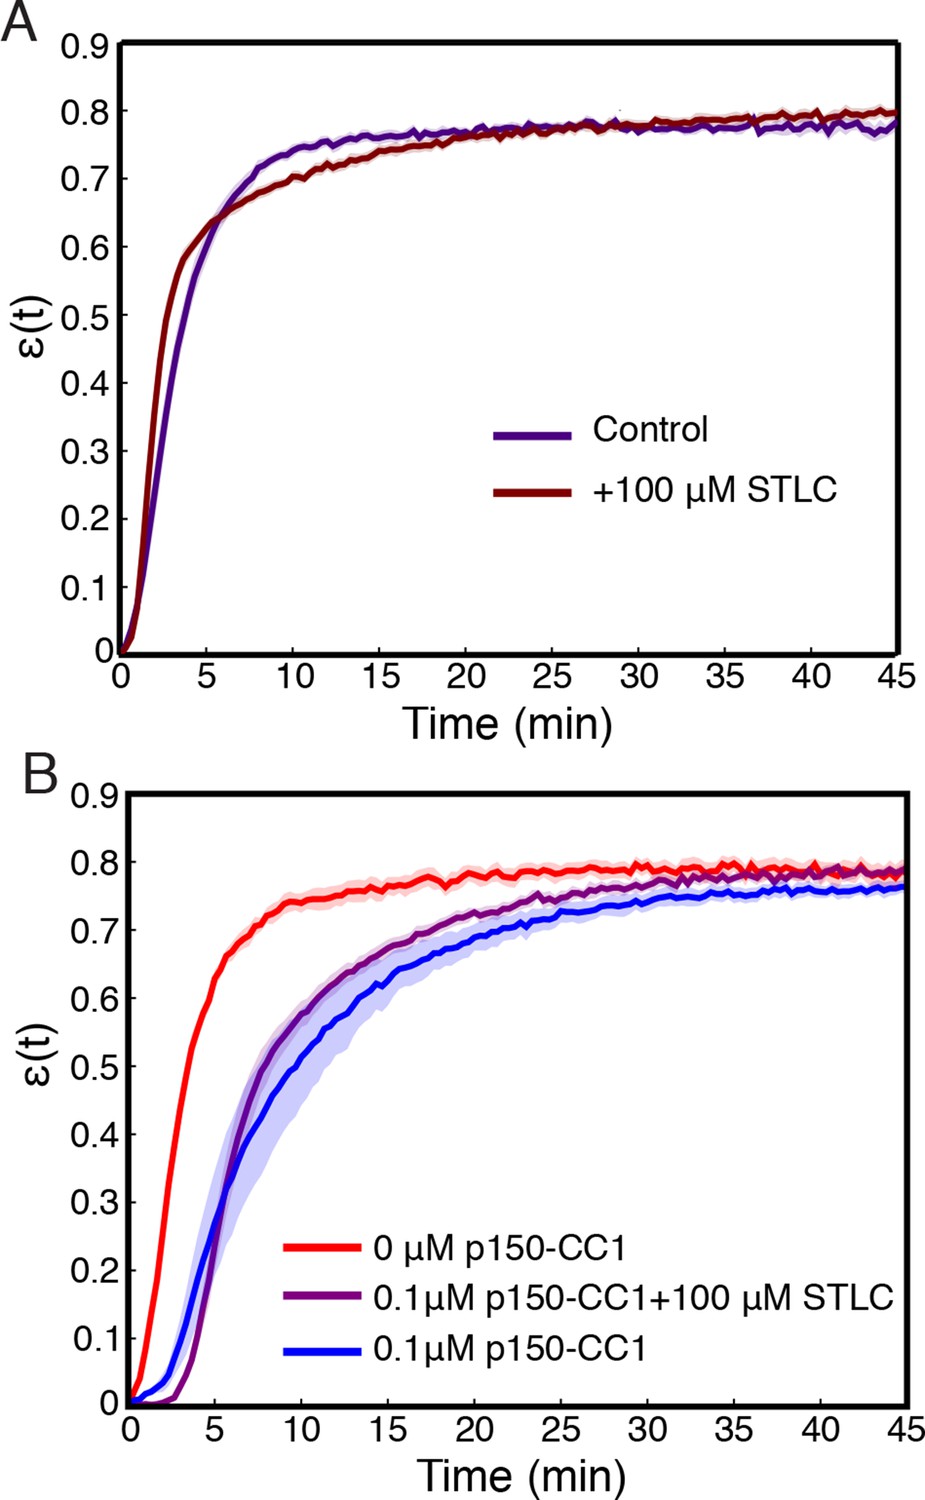
Inhibition of Kinesin-5 has little effect on the contraction process.
(A) Comparison of (t) curves for samples where Kinesin-5 was inhibited using STLC and control where no STLC was added. (B) Simultaneous inhibition of dynein with p150-CC1 and Kinesin-5 with STLC does not rescue the effects of dynein inhibition alone. All panels display mean s.e.m.
Figure 6—figure supplement 2

Plots of (t) from experiments with 2 M p150-CC1 (blue lines) along with fits from Equation (2) (pink lines).
https://doi.org/10.7554/eLife.10837.017Videos
Video 1
Isolated asters undergo coalescence.
Taxol stabilized microtubules in Xenopus oocyte extracts self-organize into asters that can then coalesce. The mageneta channel depicts microtubules while the green channel depicts NUMA localization, here used as a proxy for microtubule minus ends. Time is shown in minutes : seconds.
Video 2
Microtubules organize into dynamic aster-like structures.
In other regions of the channel, microtubules organize into aster-like structures that exhibit large-scale movement on the minute timescale. Time is shown in minutes : seconds.
Video 3
Microtubule networks undergo a spontaneous bulk contraction.
Low magnification imaging of the channels reveals that microtubules organize into a macroscopic network that spontaneously contracts on the millimeter length scale. Time is shown in minutes : seconds.
Video 4
Microtubule networks can undergo tearing.
During contraction, tears can develop in the microtubule network, causing the network to break. Time is shown in minutes : seconds.
Video 5
Network contraction in channels of varying width.
Devices were fabricated with different widths. Each video panel depicts a representative experiment using channels of the given width. Time is shown in minutes : seconds.
Download links
A two-part list of links to download the article, or parts of the article, in various formats.
Downloads (link to download the article as PDF)
Open citations (links to open the citations from this article in various online reference manager services)
Cite this article (links to download the citations from this article in formats compatible with various reference manager tools)
Active contraction of microtubule networks
eLife 4:e10837.
https://doi.org/10.7554/eLife.10837


