Tunable protein synthesis by transcript isoforms in human cells
- University of California, Berkeley, United States
- Howard Hughes Medical Institute, University of California, Berkeley, United States
- Lawrence Berkeley National Laboratory, United States
- University of California, Berkeley, California, United States
Figures
Figure 1 with 3 supplements
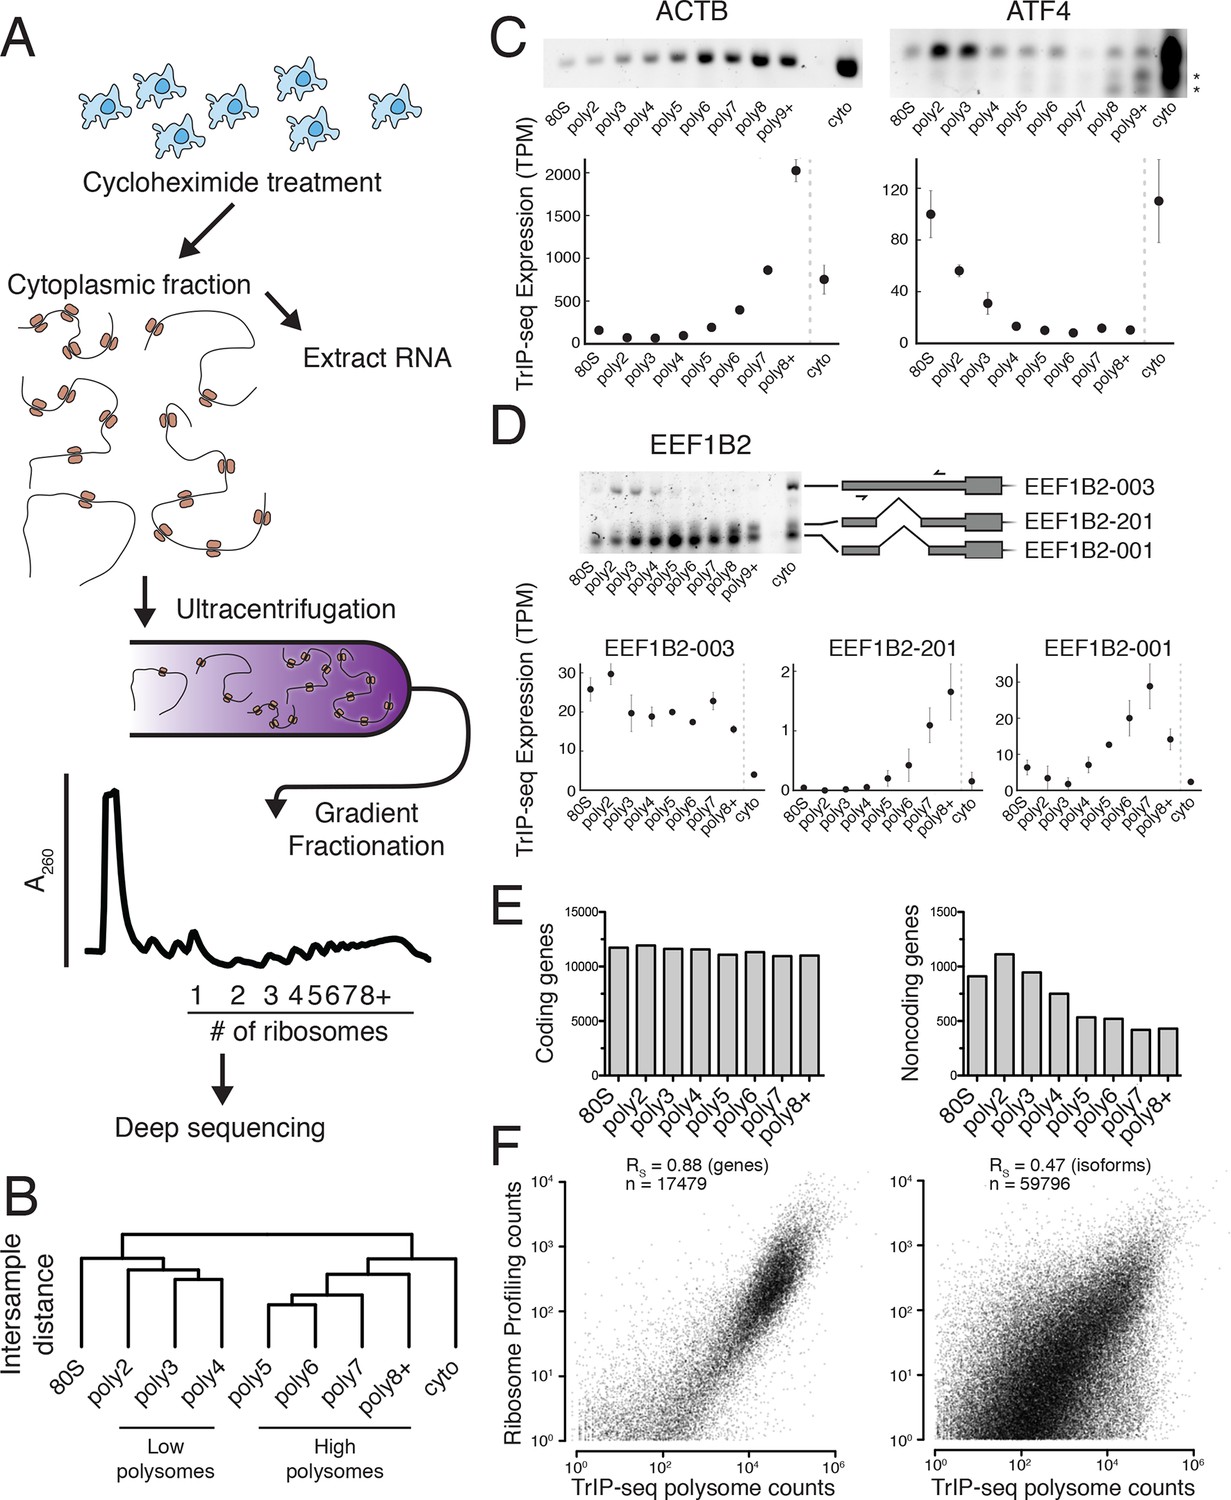
Transcript Isoforms in Polysomes sequencing (TrIP-seq) measures transcript isoform specific translation.
(A) HEK 293T cells were treated with cycloheximide and the cytoplasmic fraction was extracted and applied to a sucrose gradient, which was further fractionated into individual polysomes that were converted into sequencing libraries. (B) Intersample clustering recapitulates the gradient order of polysomes, indicating the sequenced fractions are faithful to the gradient profile. (C,D) RT-PCR analysis and transcript-level quantification for ACTB and ATF4 (C) and three transcripts of EEF1B2 (D) demonstrating concordance of sequencing and transcript-specific RT-PCR. TPM – transcripts per million. *nonspecific amplicon. (E) Members of transcript classes with more than 100 reads in indicated fractions show that coding genes are represented across the polysome while noncoding genes are preferentially in low polysome fractions. (F) Spearman’s correlation (RS) between gene (left) or isoform (right) read counts from ribosome profiling or TrIP-seq. See also Figure 1—figure supplement 1 and Materials and methods for calculation of TrIP-seq polysome counts.
-
Figure 1—source data 1
Gene-level abundances for all Ensembl 75 annotated human genes across all sequenced polysome fractions.
- https://doi.org/10.7554/eLife.10921.004
-
Figure 1—source data 2
Transcript isoform abundances for all Ensembl 75 annotated human transcripts across all sequenced polysome fractions.
- https://doi.org/10.7554/eLife.10921.005
Figure 1—figure supplement 1
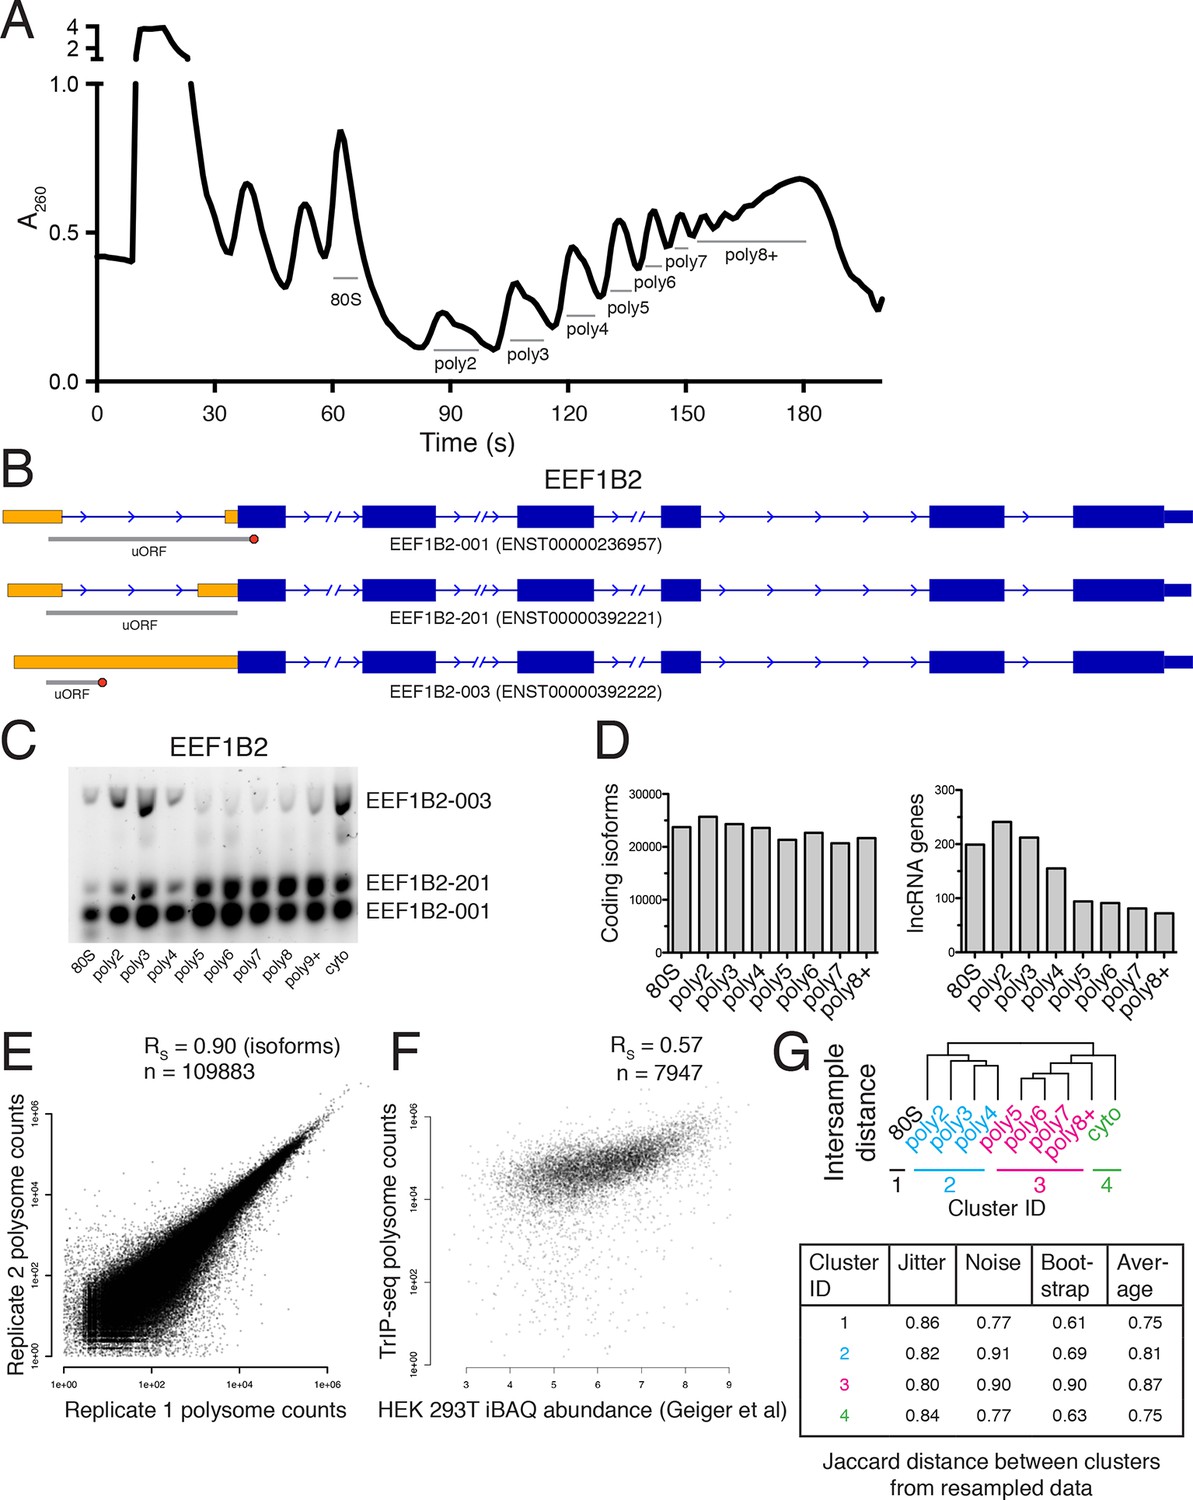
Extended TrIP-seq validation.
(A) A large version of a representative polysome profile showing fractions collected. (B) A diagram of the alternative transcript isoforms of the gene EEF1B2. Coding regions are wide boxes, noncoding regions are narrow boxes, and introns are lines. Upstream open reading frames (uORFs) are indicated by gray bars, with red octagons marking stop codons. The uORF for EEF1B2-201 is in-frame with the annotated start codon. Differentially included regions are shown in yellow, arrows show the direction of transcription, and select introns have been removed for clarity as indicated by gaps. (C) A replicate RT-PCR gel of EEF1B2 showing the presence of EEF1B2-003 in high polysomes. (D) The distribution of coding isoforms and noncoding genes across polysome fractions. (E) Replicate correlations between the weighted polysome sum of TrIP-seq read counts at the isoform level. RS: Spearman’s correlation. (F) Correlation between TrIP-seq polysome counts and HEK 293T cell iBAQ protein abundance. (G) The Jaccard distance between clusterings of resampled data from Figure 1B.
Figure 1—figure supplement 2
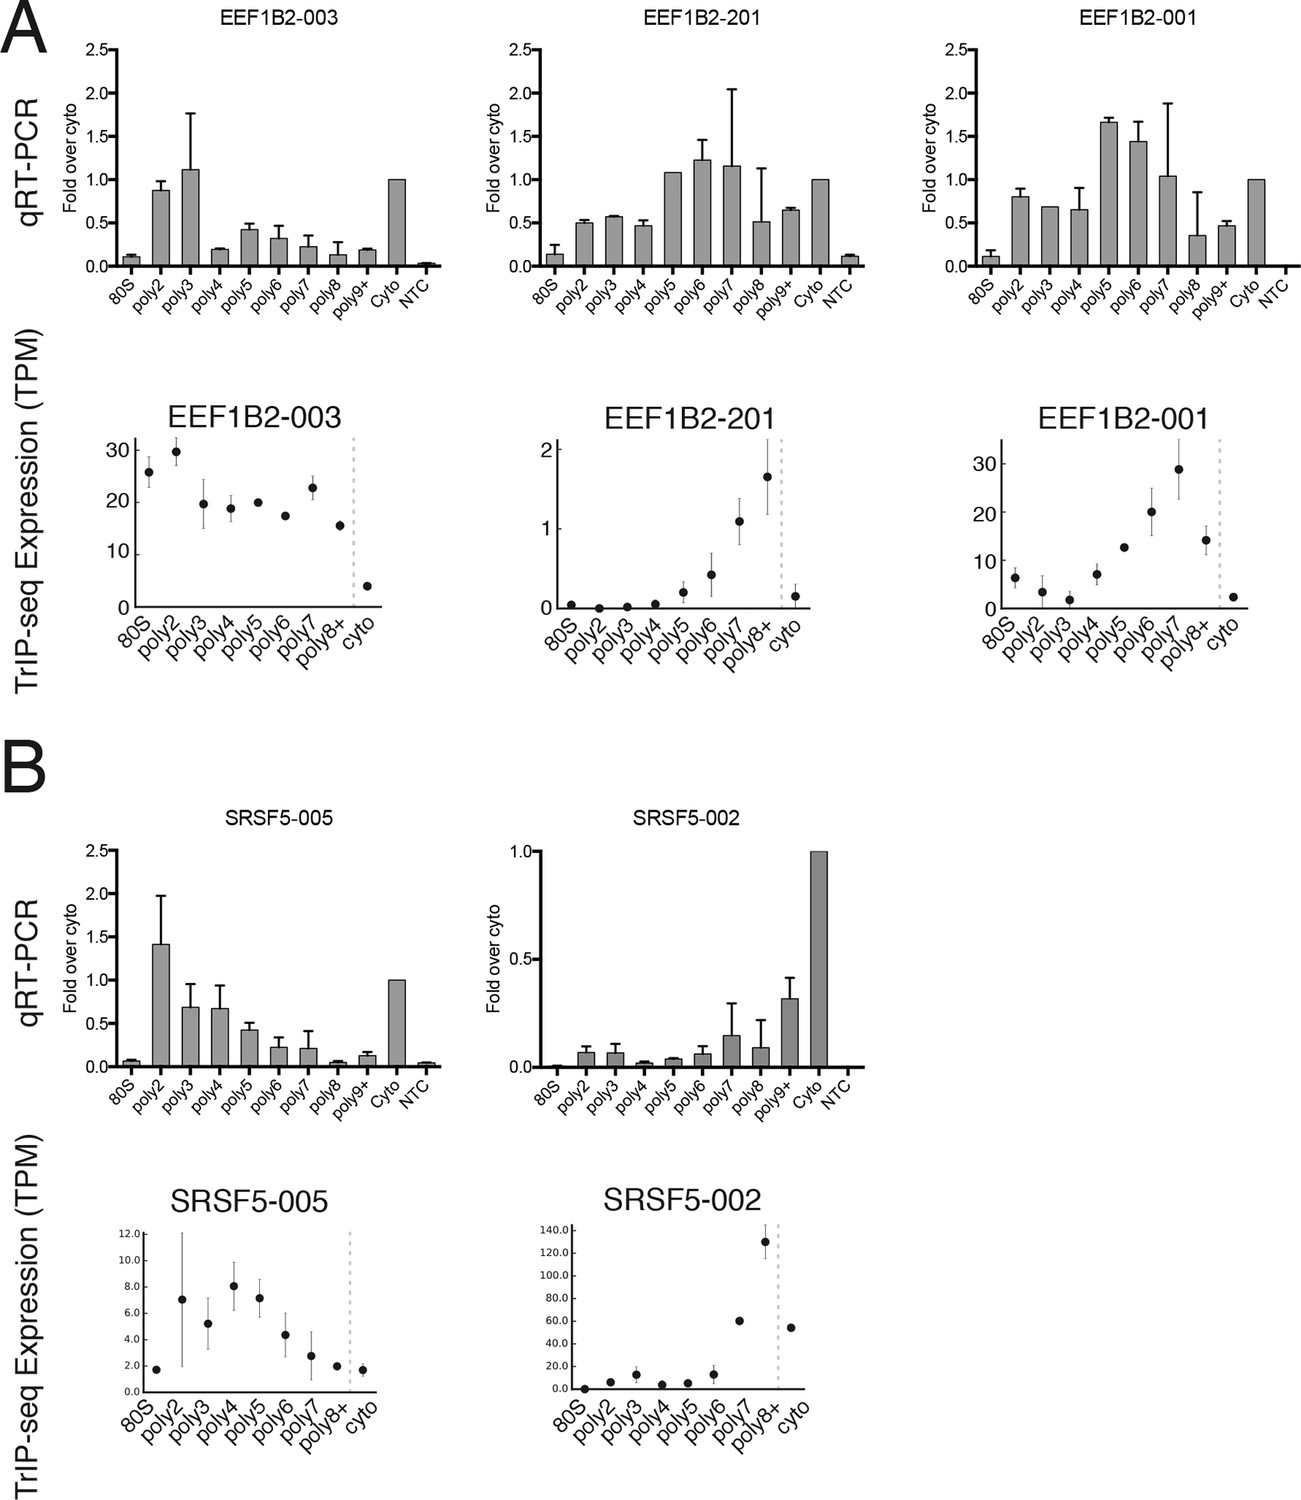
Extended validation of TrIP-seq isoform abundances across polysome fractions using qRT-PCR.
(A) qRT-PCR (top) and TrIP-seq abundances (bottom) for three EEF1B2 isoforms. (B) As in (A) except for the gene SRSF5. qRT-PCR abundance is calculated as a fold change versus cytoplasmic abundance. Note that systematic normalization differences exist between the TrIP-seq and qRT-PCR abundances since the TrIP-seq abundances are from repeat and rRNA subtracted data, while the input for qRT-PCR is total RNA. NTC: no template control.
Figure 1—figure supplement 3
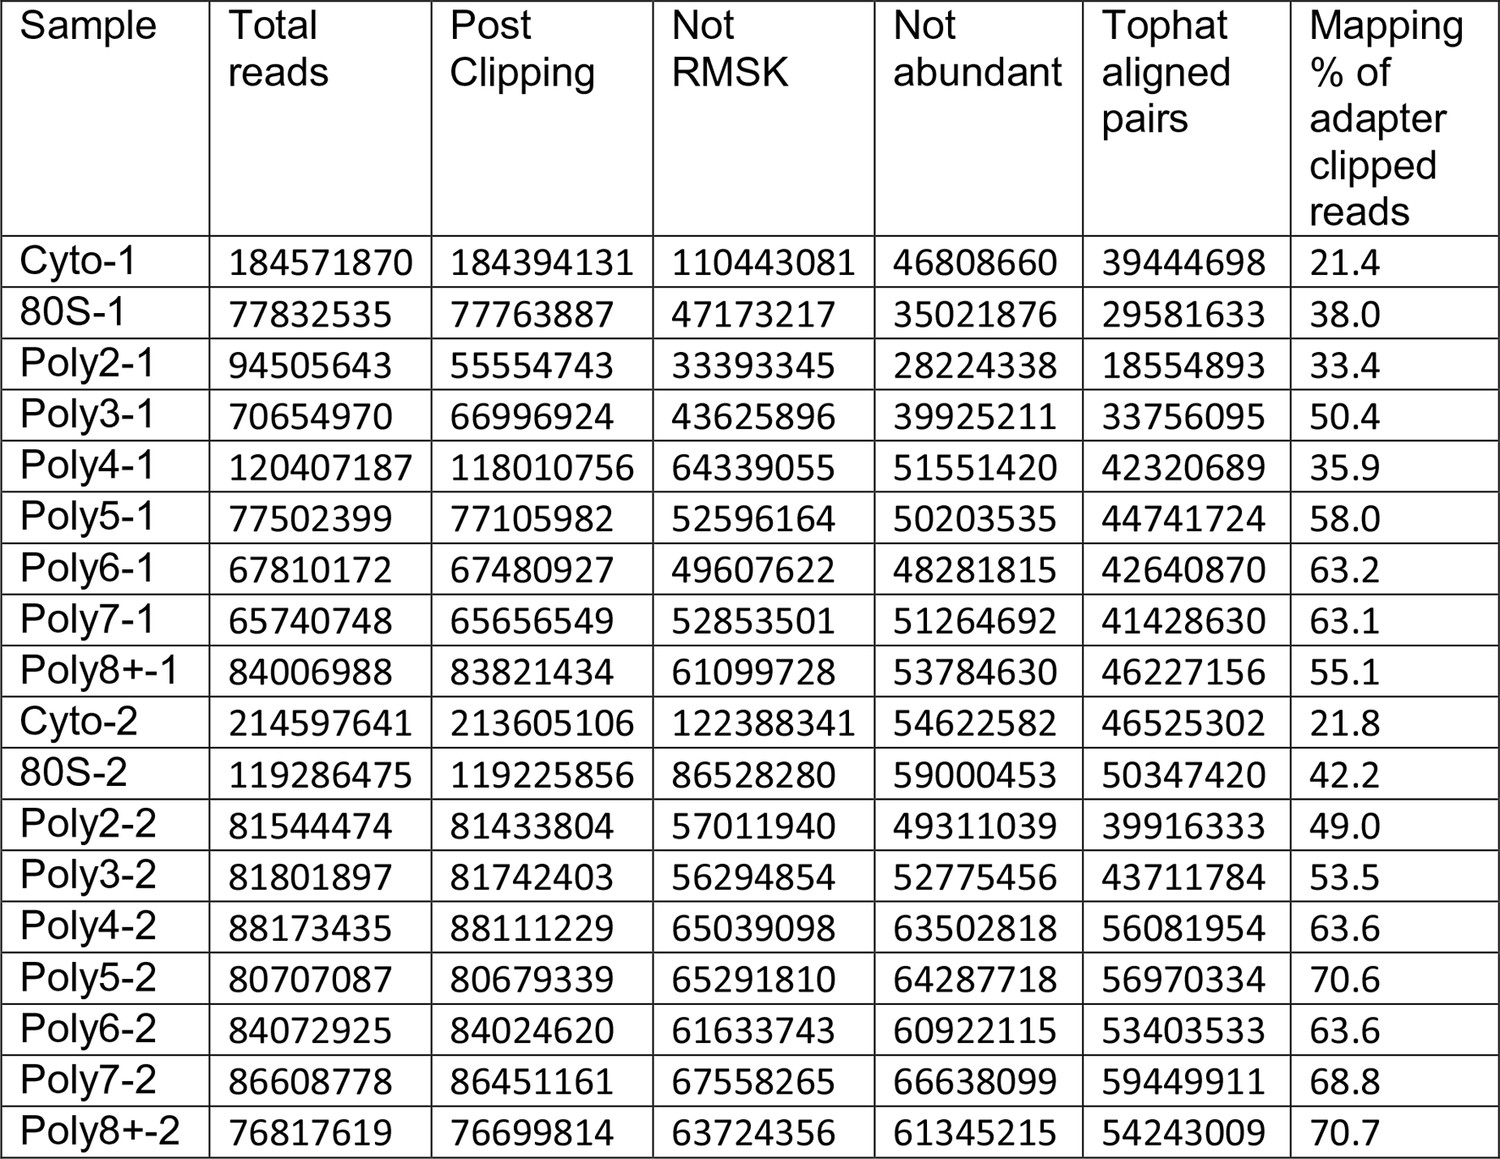
Read Tracking Across the Sequencing Analysis Pipeline.
"Not RMSK" refers to reads not mapping to repeatmasker sequences, and "not abundant" is reads not mapping to rRNA and the mitochondrial chromosome, etc (Materials and methods).
Figure 2 with 1 supplement
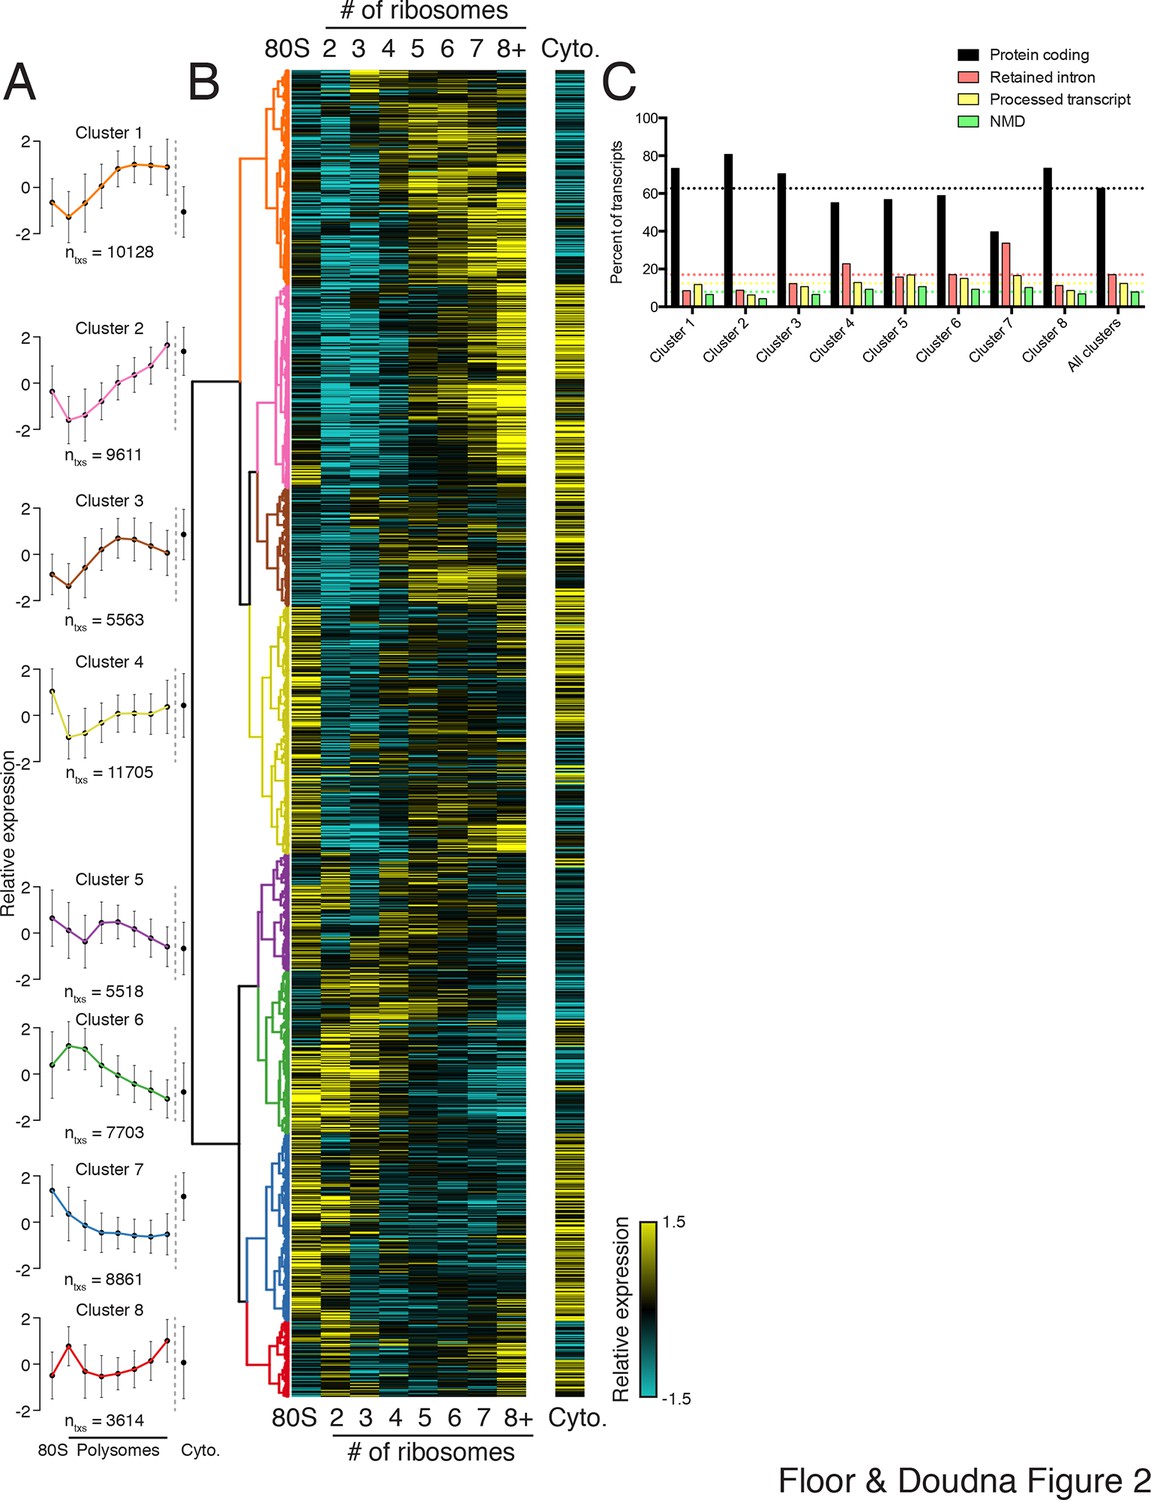
Clustering of transcript distributions yields eight major clusters with diverse behavior across the polysome profile.
(A) The average relative abundance of all isoforms in each cluster across polysomes is shown. Error is s.d. (B) Hierarchical clustering of 62,703 transcript isoform distributions across the polysome profile and cytoplasmic fraction. Yellow: above isoform average, cyan: below isoform average. (C) Transcript type distribution per cluster from Ensembl-annotated biotypes. Dotted lines mark the abundance of each transcript type in all isoforms that went in to the clustering. See also Figure 1—source data 1 and 2 and Figure 2—figure supplement 1.
-
Figure 2—source data 1
Variance stabilized transcript isoform abundances (see Materials and methods) and cluster number for all Ensembl 75 annotated human transcripts across all sequenced polysome fractions.
- https://doi.org/10.7554/eLife.10921.010
Figure 2—figure supplement 1
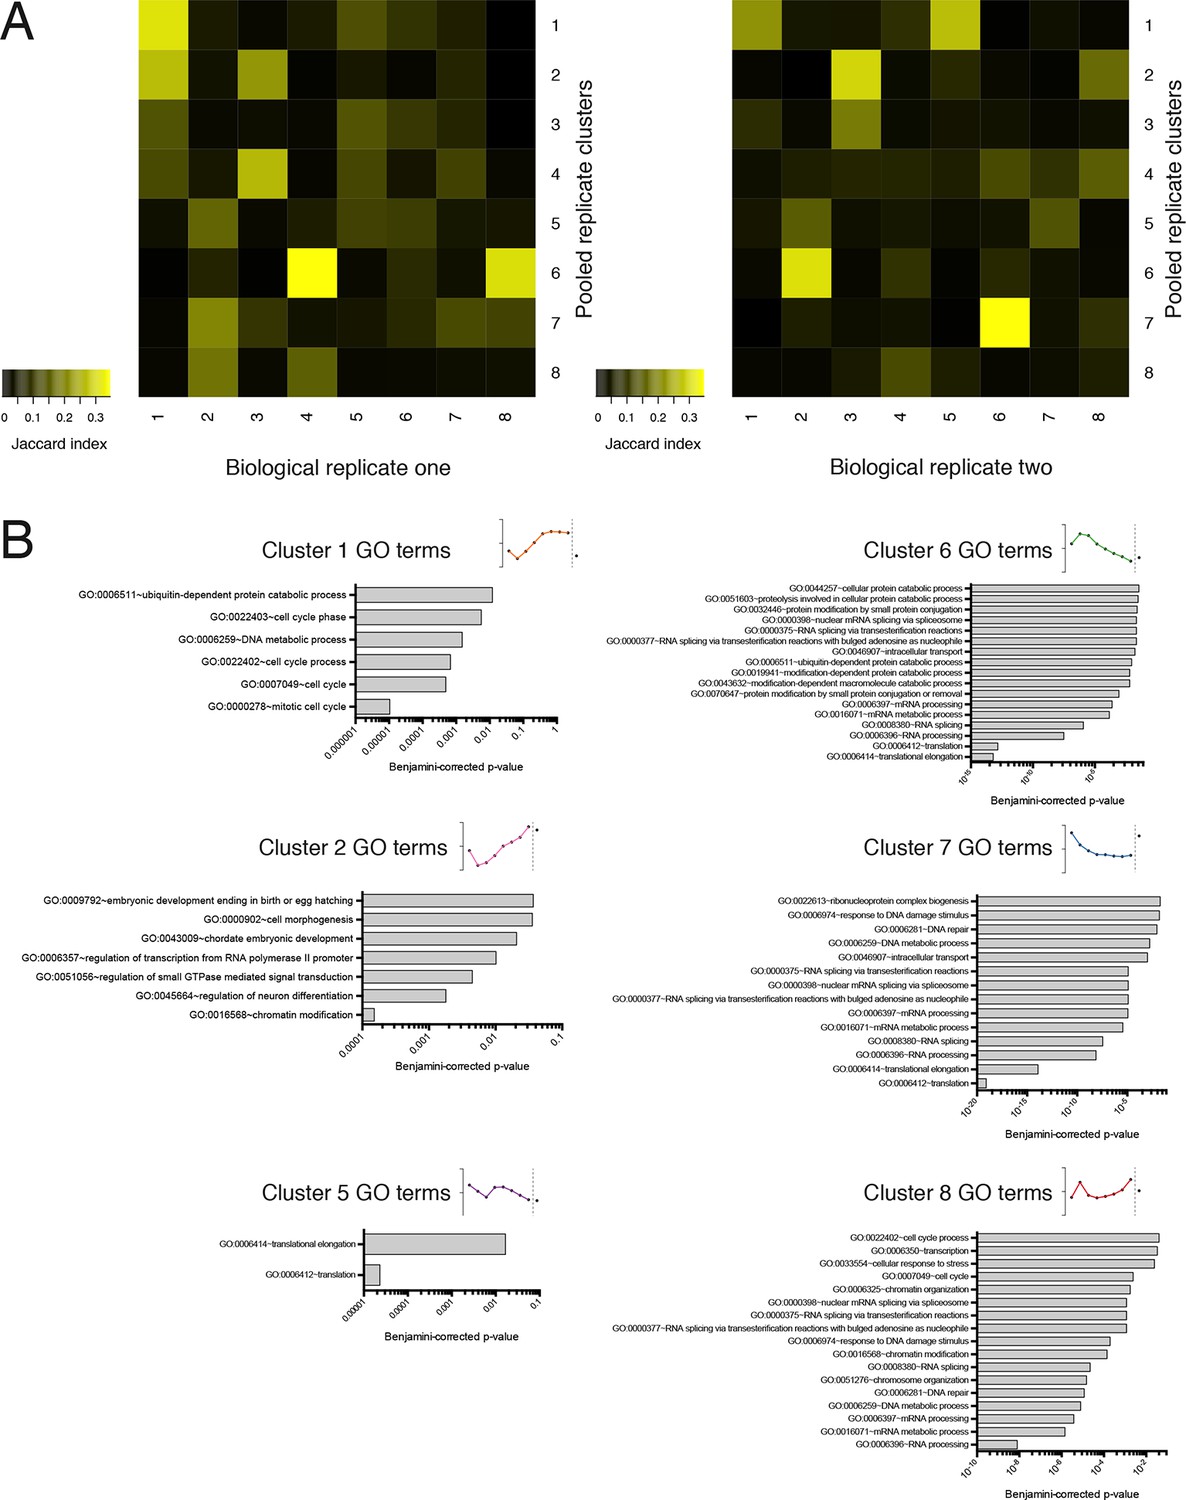
Further information on TrIP-seq clusters.
(A) Clustered transcript distributions from each biological replicate show robust clustering for the well-translated clusters 1, 2 and 6. The Jaccard distance is plotted (the intersection divided by the union) of each replicate cluster versus the pooled replicate clusters. (B) GO terms significant at the Benjamini-corrected p-value of 0.05 are indicated; clusters 3 and 4 had no enriched terms.
Figure 3 with 1 supplement
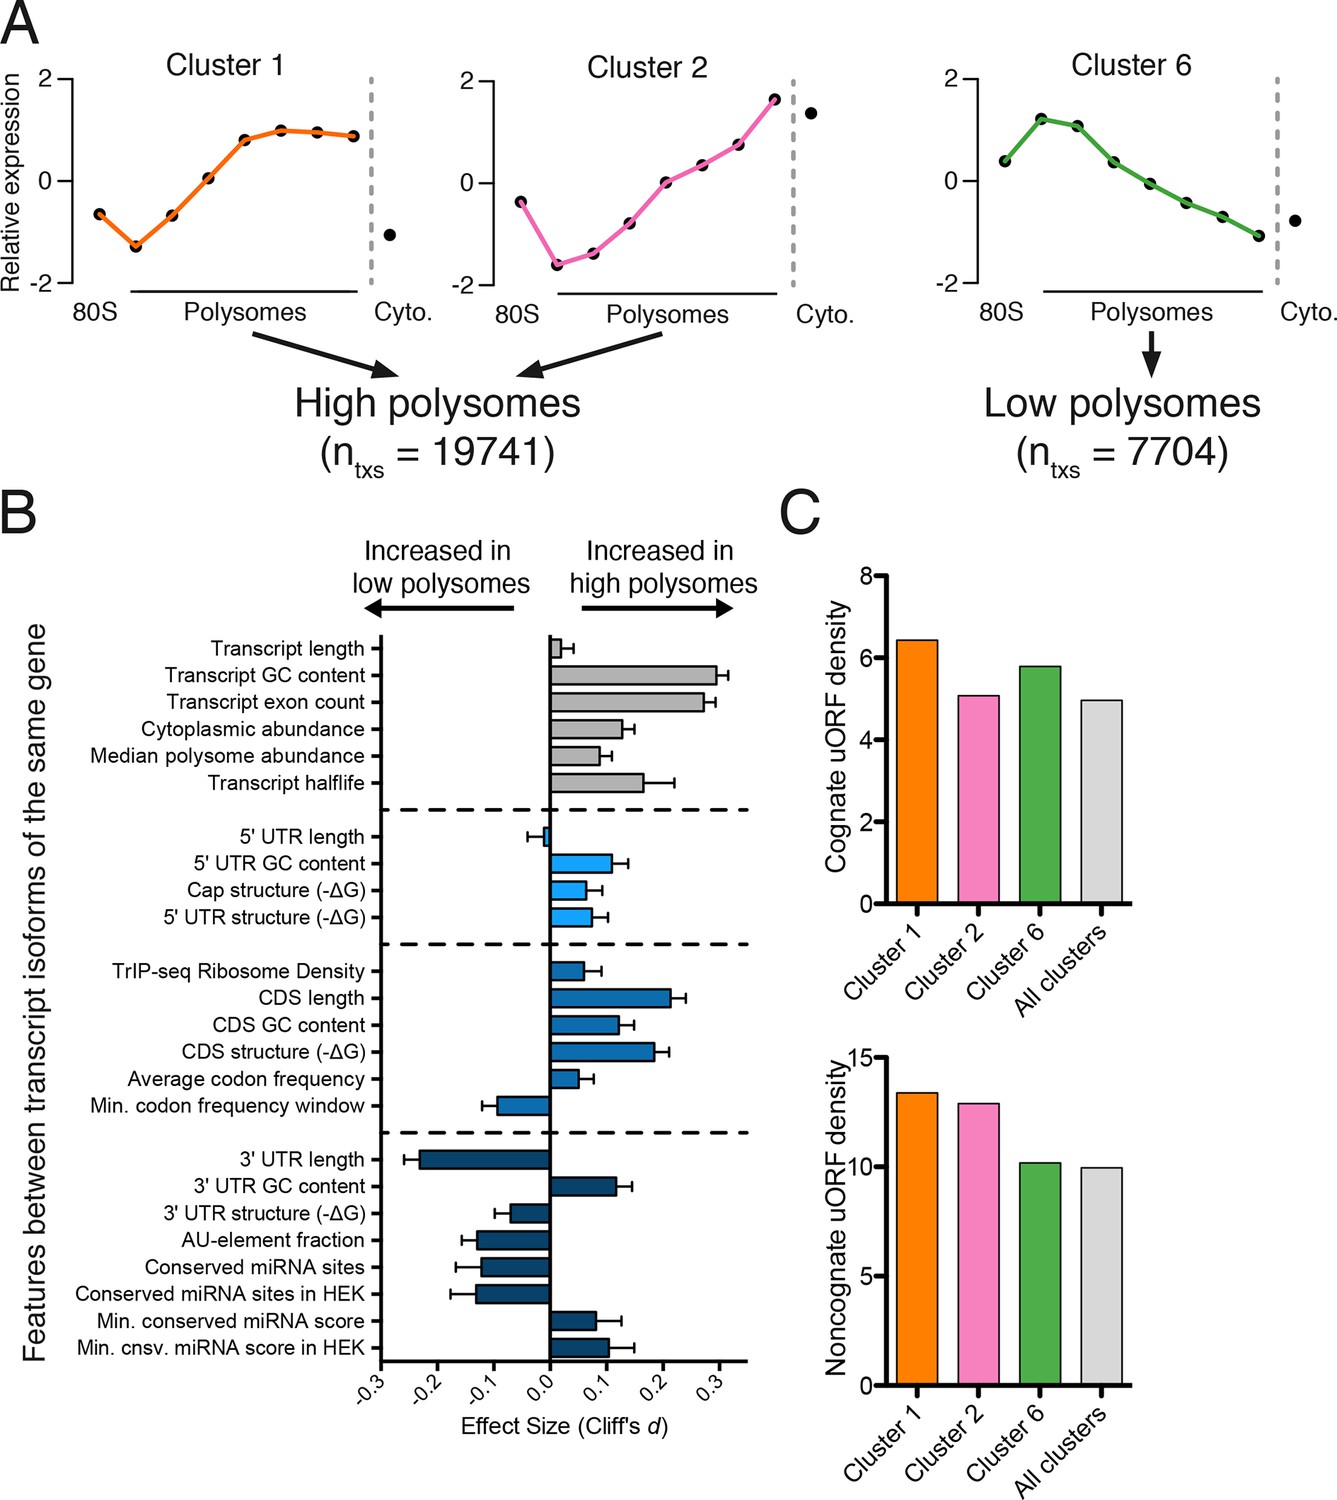
Effect of transcript features on polysome association.
(A) Meta-transcript distributions for two high polysome clusters (1 and 2) and one low polysome cluster (6). Clusters 1 and 2 were pooled for the analysis in (B). (B) The distance between distributions for 24 different transcript features evaluated for transcripts strongly or weakly associated with polysomes. Distance is the nonparametric effect size, measured as the dimensionless quantity Cliff’s d (see Materials and methods) and error bars are bootstrapped 95% confidence intervals. All differences except 5′ UTR and transcript length are significant at the p = 0.001 level based on two-tailed Mann-Whitney U-tests (Figure 3—figure supplement 1A). See Materials and methods for a description of all features and how they were tabulated. UTR – untranslated region; CDS – coding sequence. (C) Enrichment of either cognate (ATG start codon) or non-cognate (non-ATG) uORFs in high polysome versus low polysome clusters. Density is uORFs per 100 isoforms. See also Figure 3—figure supplement 1.
Figure 3—figure supplement 1
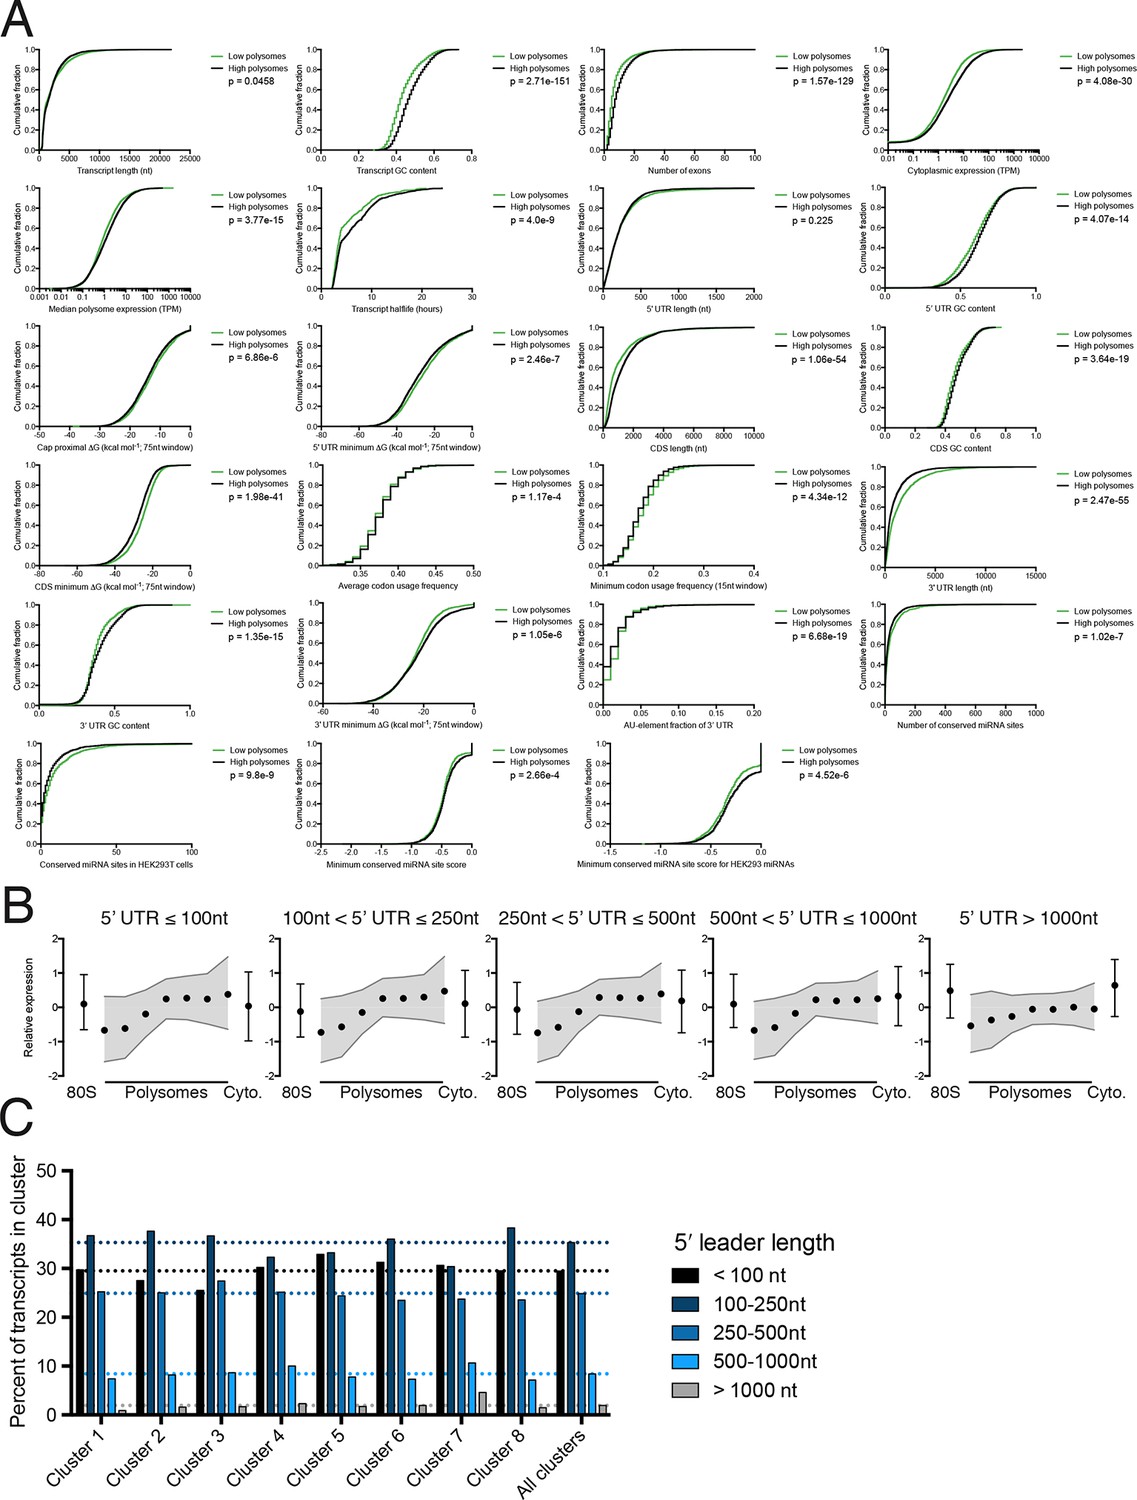
Further details of high versus low polysome associated transcript isoform comparisons.
(A) Empirical cumulative distribution functions (eCDFs) for all features compared, with p-values calculated using the Mann-Whitney U test. High polysome transcripts are from the union of clusters 1 and 2, while low polysome transcripts are from cluster 6. (B) Meta-isoform distributions for transcripts with 5′ leaders of indicated length ranges. Error bars and shaded gray area are upper and lower quartiles. (C) Percent of each TrIP-seq cluster with the indicated 5′ leader length. Note the increase in 5′ leader length in the poorly translated cluster 7.
Figure 4 with 2 supplements
Predicted isoform-specific translational control changes during human embryogenesis.
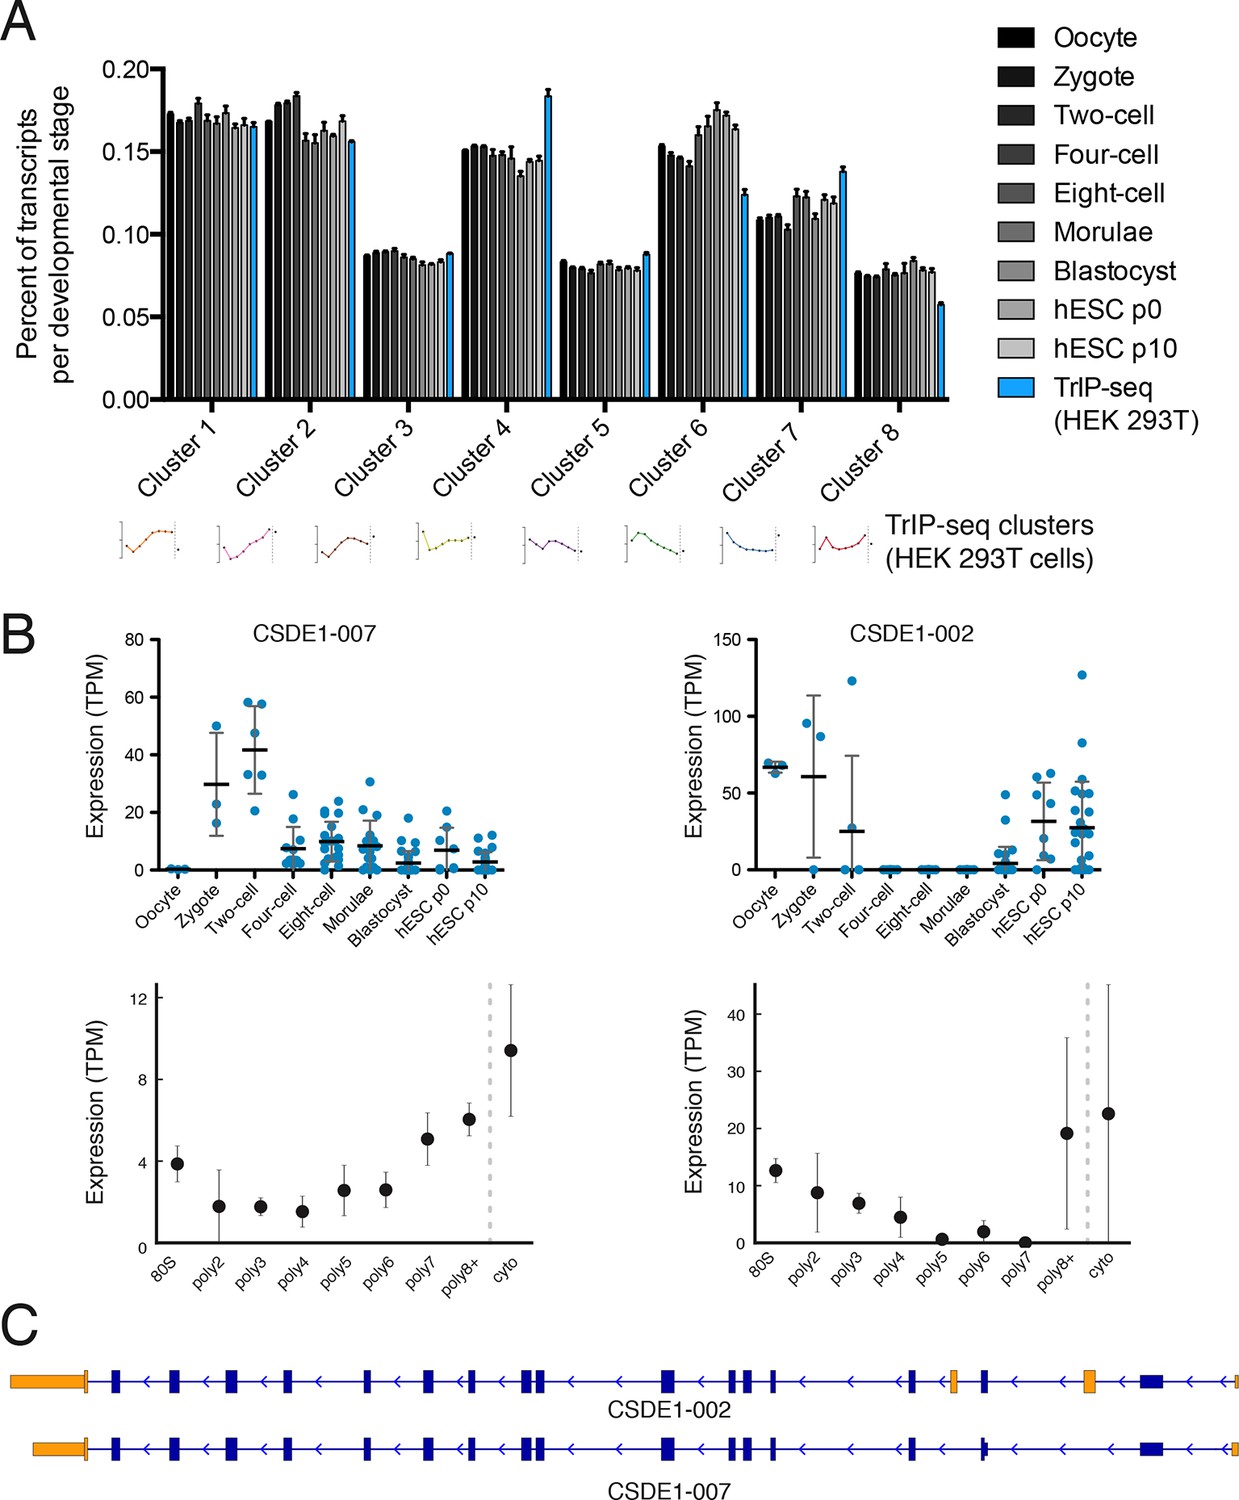
(A) For each embryonic stage, transcripts are mapped onto all eight TrIP-seq clusters, as in Figure 2. The percentage of transcripts mapping to each cluster per stage is then calculated, and compared to the percentage for TrIP-seq data. hESC – human embryonic stem cell; p0, p10 – passage zero or passage ten. Error is s.d. between single cells at each embryonic stage or between TrIP-seq biological replicates. (B) Expression levels for two transcripts of CSDE1 across embryonic development and polysome fractions demonstrating a switch in translational status. Error is S.D. TPM – transcripts per million. (C) Diagram of two transcript isoforms of CSDE1. Regions different between the two isoforms are in yellow and select shared intronic regions have been shortened for clarity. See also Figure 4—figure supplement 1.
Figure 4—figure supplement 1
Clustering of human preimplantation embryo data
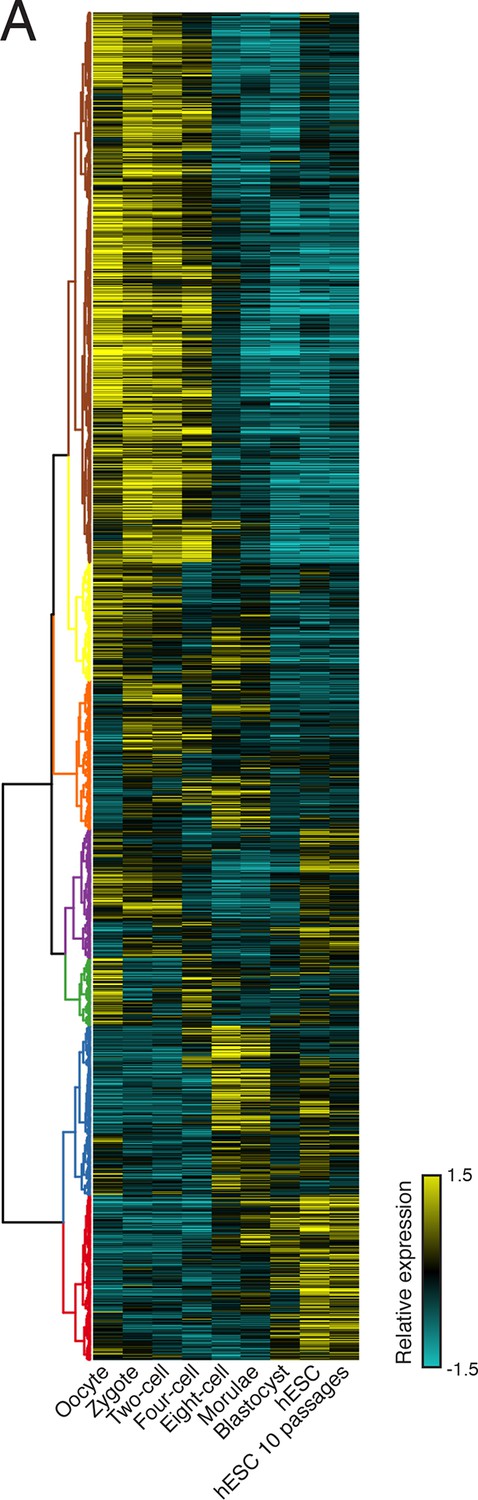
(A) Hierarchical clustering of 45,895 transcript isoforms across human preimplantation embryogenesis with the stages indicated below. Yellow: above isoform average, cyan: below isoform average.
Figure 4—figure supplement 2
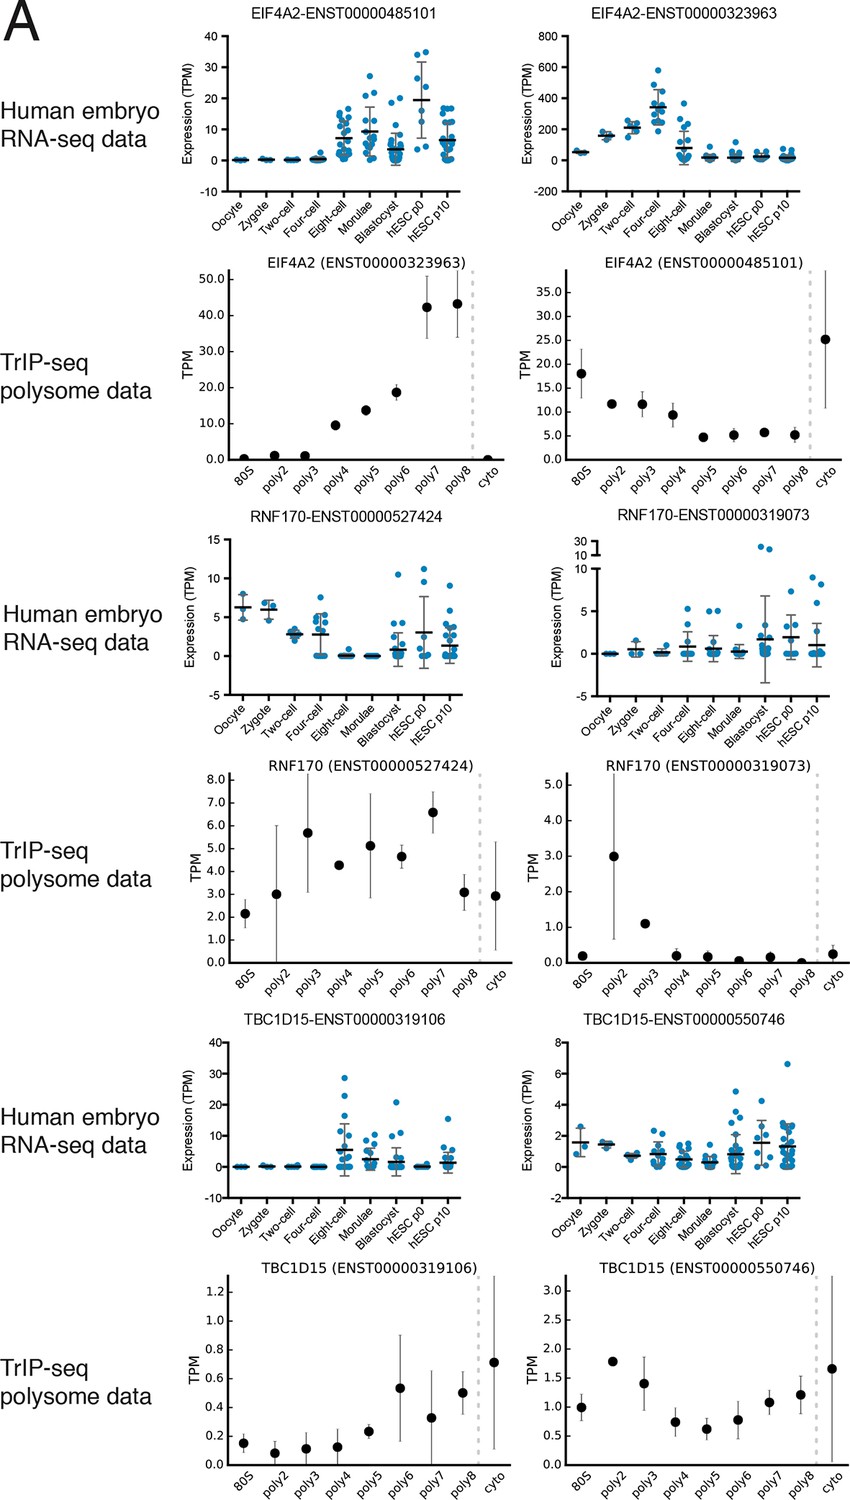
Additional examples of transcript isoforms that exhibit differential expression in human embryos and differential translation in TrIP-seq data.
https://doi.org/10.7554/eLife.10921.016
Figure 5 with 1 supplement

Regulatory UTR sequences are sufficient to control translation of a heterologous reporter.
HEK 293T cells were transfected with indicated RNAs and Renilla luciferase units are plotted. (A–D) Renilla light units normalized to control UTR mRNA (A,C) and corresponding traces from TrIP-seq data (B,D) for 5′ leaders (A,B) or 3′ UTRs (C,D) exhibit differential protein production over two log-units in cells. Inset graphs show comparisons between mock-transfected cells and the lowest output mRNAs. Error bars are S.E.M. from at least four biological and three technical replicates (twelve total; A) or three biological and three technical replicates (nine total; B). (B,D) Error is S.D. Rluc – Renilla luciferase units; UTR – untranslated region. (E) Luciferase fold change versus the average number of ribosomes on each transcript, computed by averaging the plots in B and D. See also Figure 5—figure supplement 1.
Figure 5—figure supplement 1
Diagrams of isoforms differentially represented in gigh versus low polysomes.
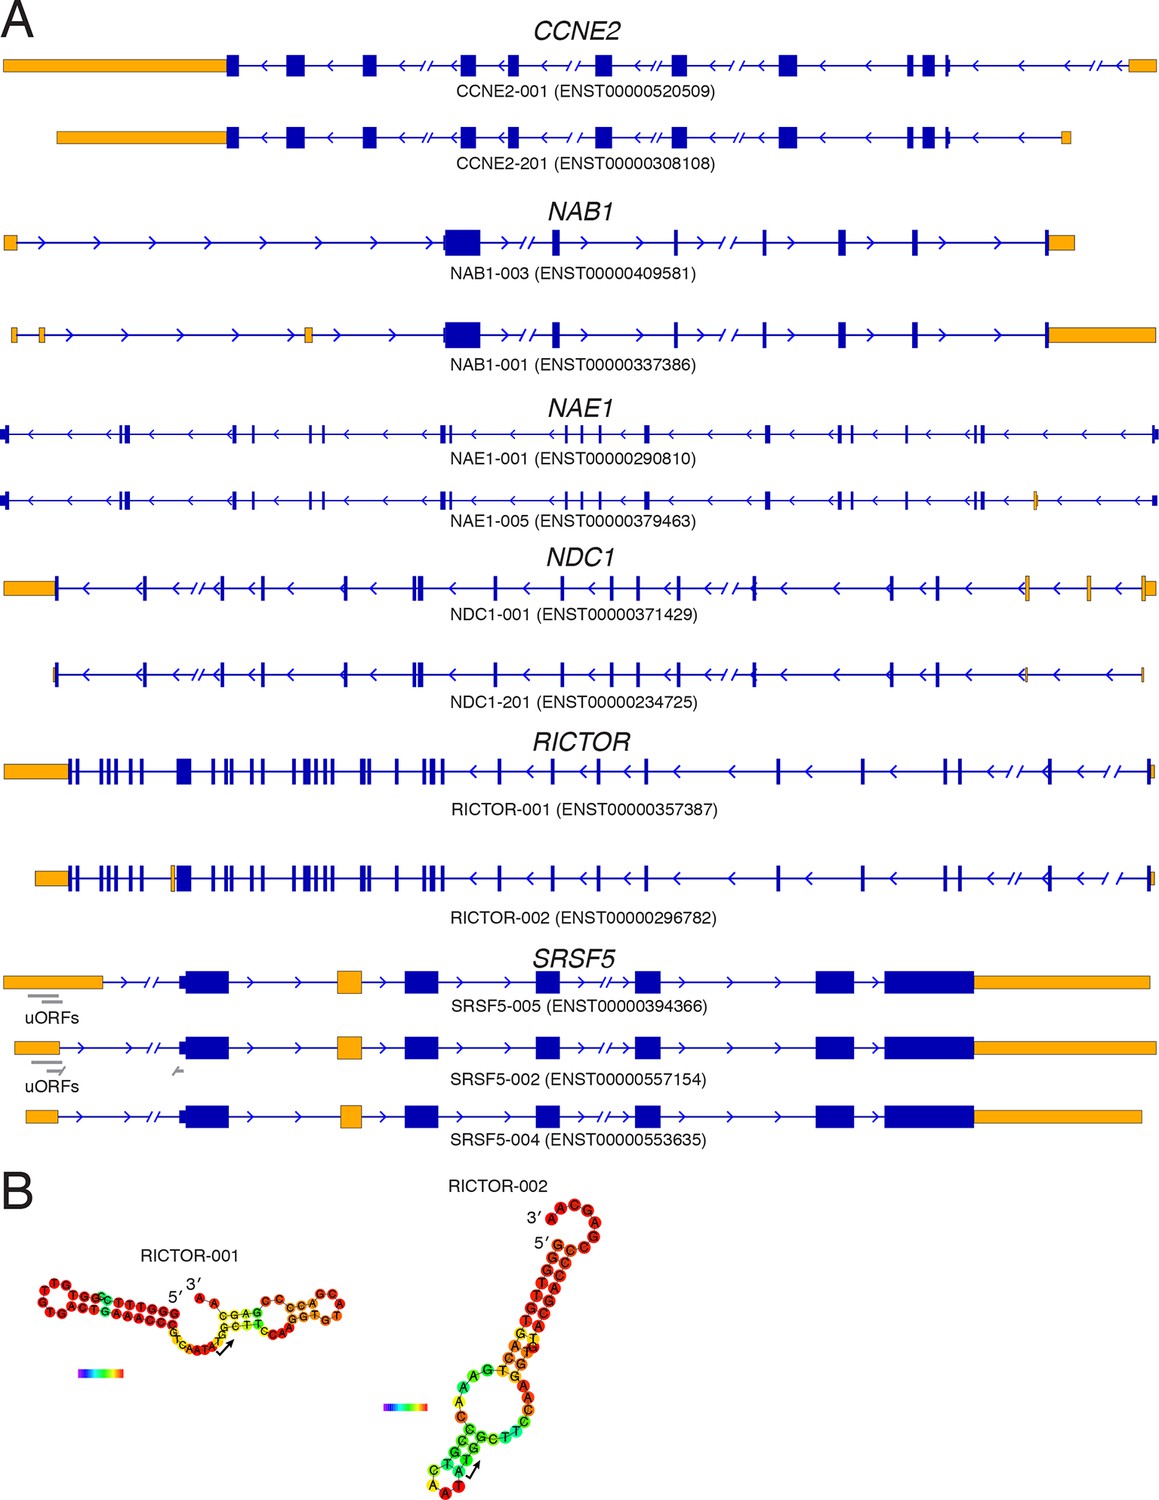
(A) Isoform diagrams for the genes CCNE2, NAB1, NAE1, NDC1, RICTOR, and SRSF5. Coding regions are wide boxes, noncoding regions are narrow boxes, introns are lines, and upstream open reading frames (uORFs) are indicated by gray bars. Differentially included regions are shown in yellow, arrows show the direction of transcription, and select introns have been removed for clarity as indicated by gaps. (B) Secondary structures of two RICTOR 5′ leader sequences predicted by RNAfold. RNA bases are colored by base pairing probability.
Figure 6 with 1 supplement
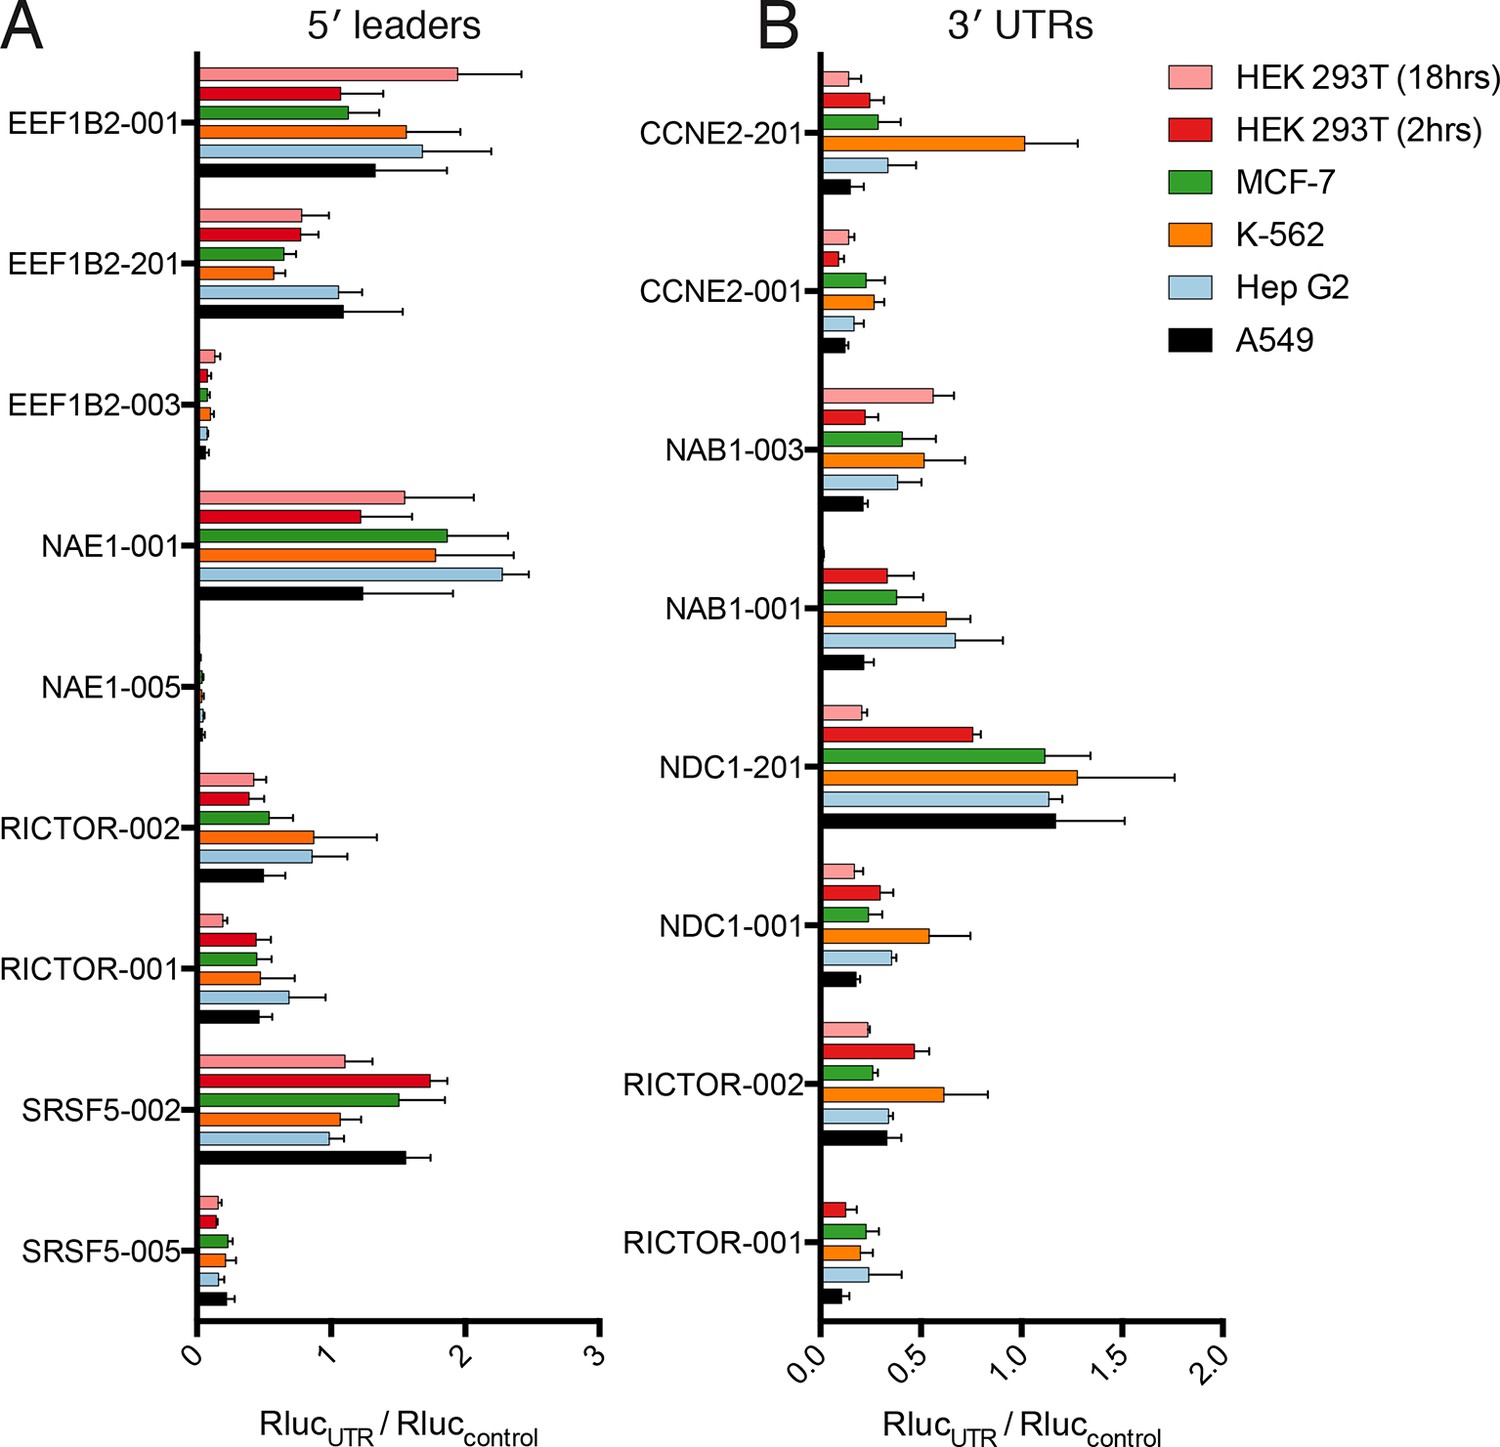
Translational control by transcript 5′ leader sequences is robust across cell types.
(A,B) Five cell lines in six conditions were transfected with Renilla luciferase fused to the UTR indicated and luciferase units normalized to control UTR mRNA. Both 5′ leaders (A) and 3′ UTRs (B) were tested. Error is S.E.M. between three technical and three biological replicates (nine total) per condition. See also Figure 6—figure supplement 1.
Figure 6—figure supplement 1
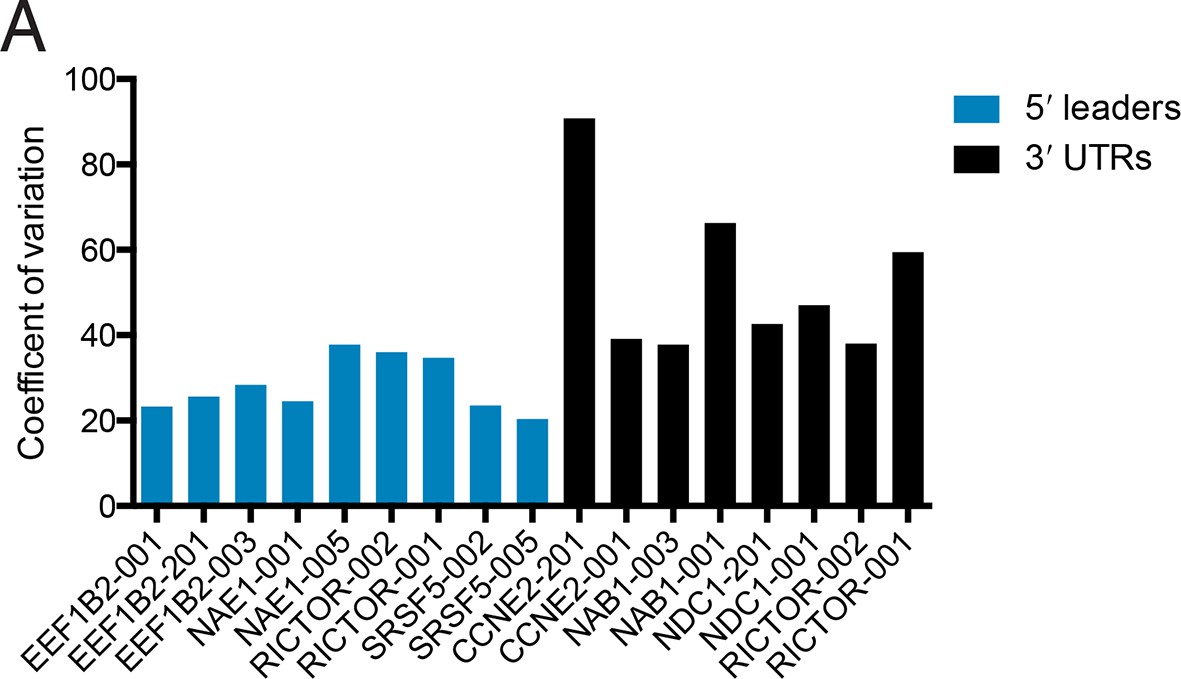
Changes in protein production conferred by 5′ UTRs are more robust across cell lines than those conferred by 3′ UTRs.
Plotted is the coefficient of variation (the standard deviation divided by the mean) for the indicated UTR fused to luciferase across five cell lines and HEK 293T cells at 2 hr and 18 hr (Figure 6).
Figure 7
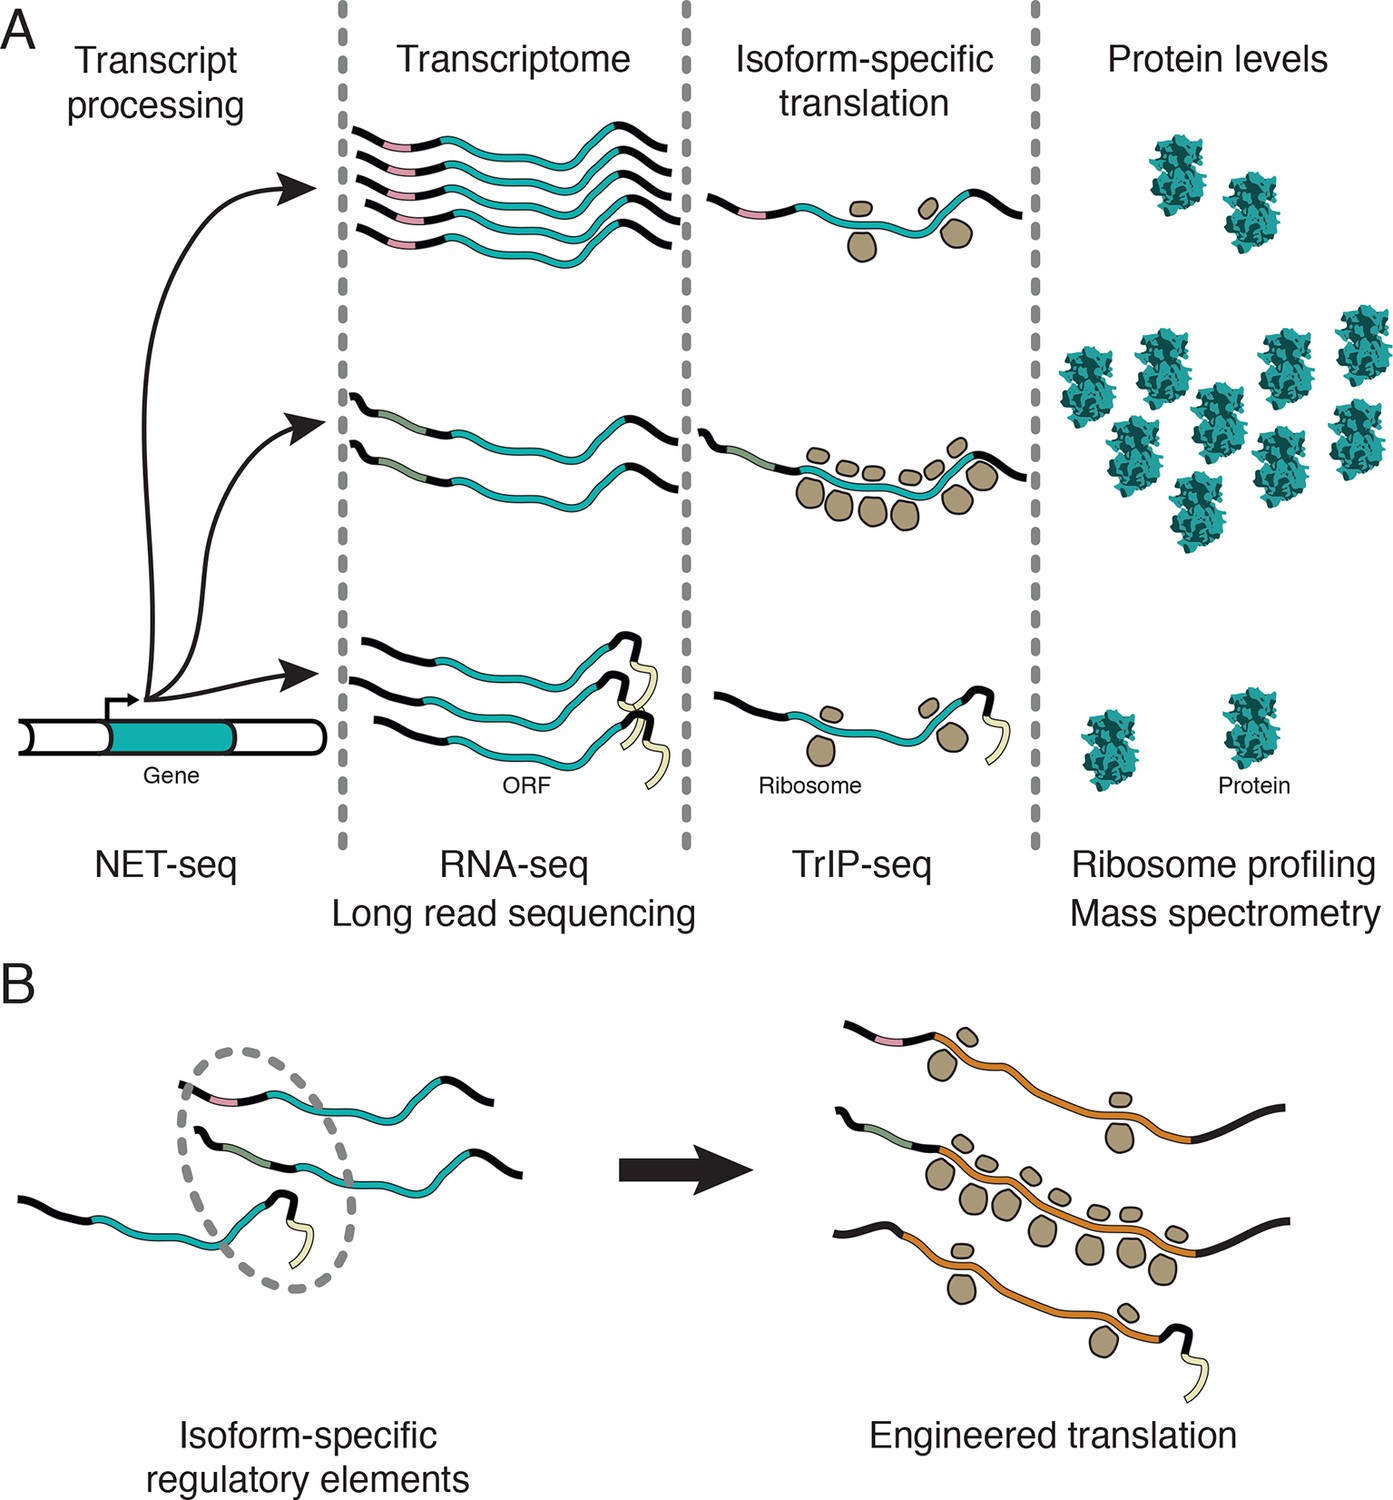
Transcript processing has widespread effects on protein production.
(A) The mapping between gene and protein is complex, and RNA processing has a strong influence on the translatability of individual transcript isoforms and therefore protein production. (B) Regulatory elements can be discovered by comparing transcript isoforms that are differentially translated, and subsequently fused to heterologous genes to control protein output in cells. ORF – open reading frame.
Author response image 1
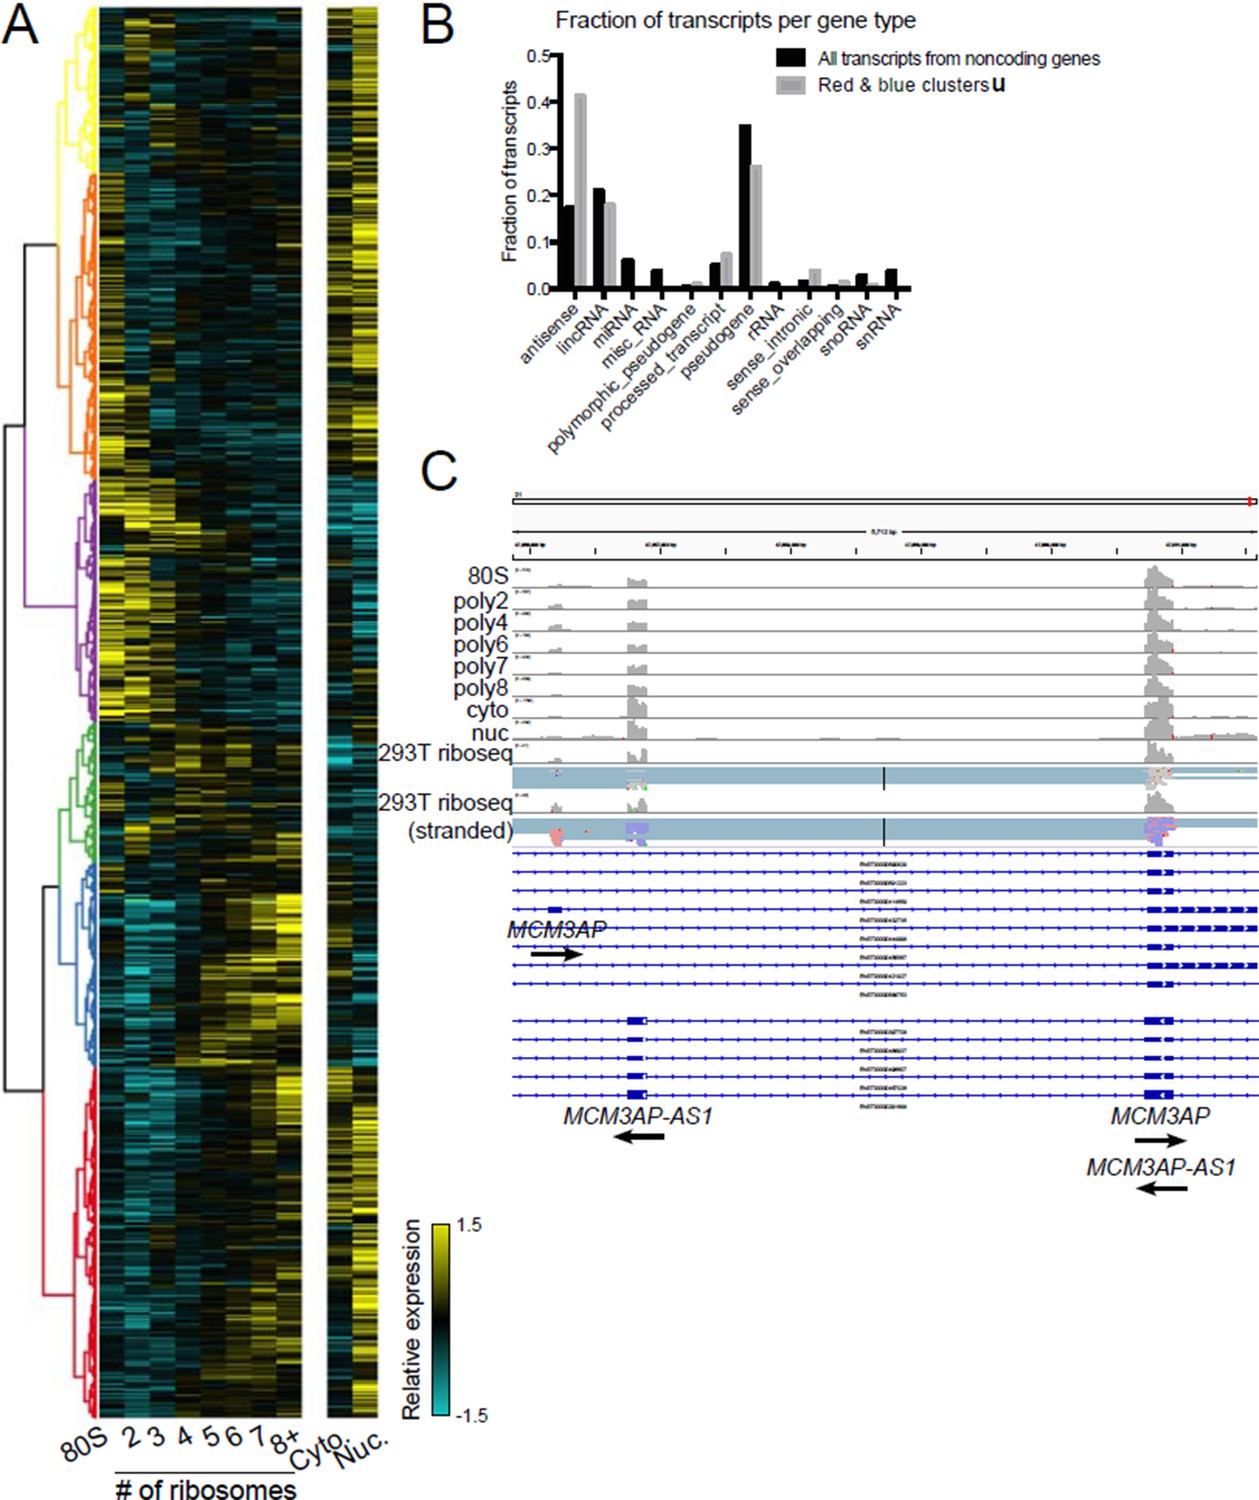
Polysome association of noncoding genes.
(A) Clustering of noncoding transcript isoforms as in Figure 2A. (B) The fraction of transcripts per noncoding gene type in high polysome clusters red and blue (gray) versus all annotated noncoding gene derived transcripts (black). (C) The gene MCM3AP and its antisense gene MCM3AP-AS1 are polysome associated and exhibit ribosome profiling reads from two datasets, one of which is stranded (red reads: sense strand; blue reads: antisense strand).
Author response image 2
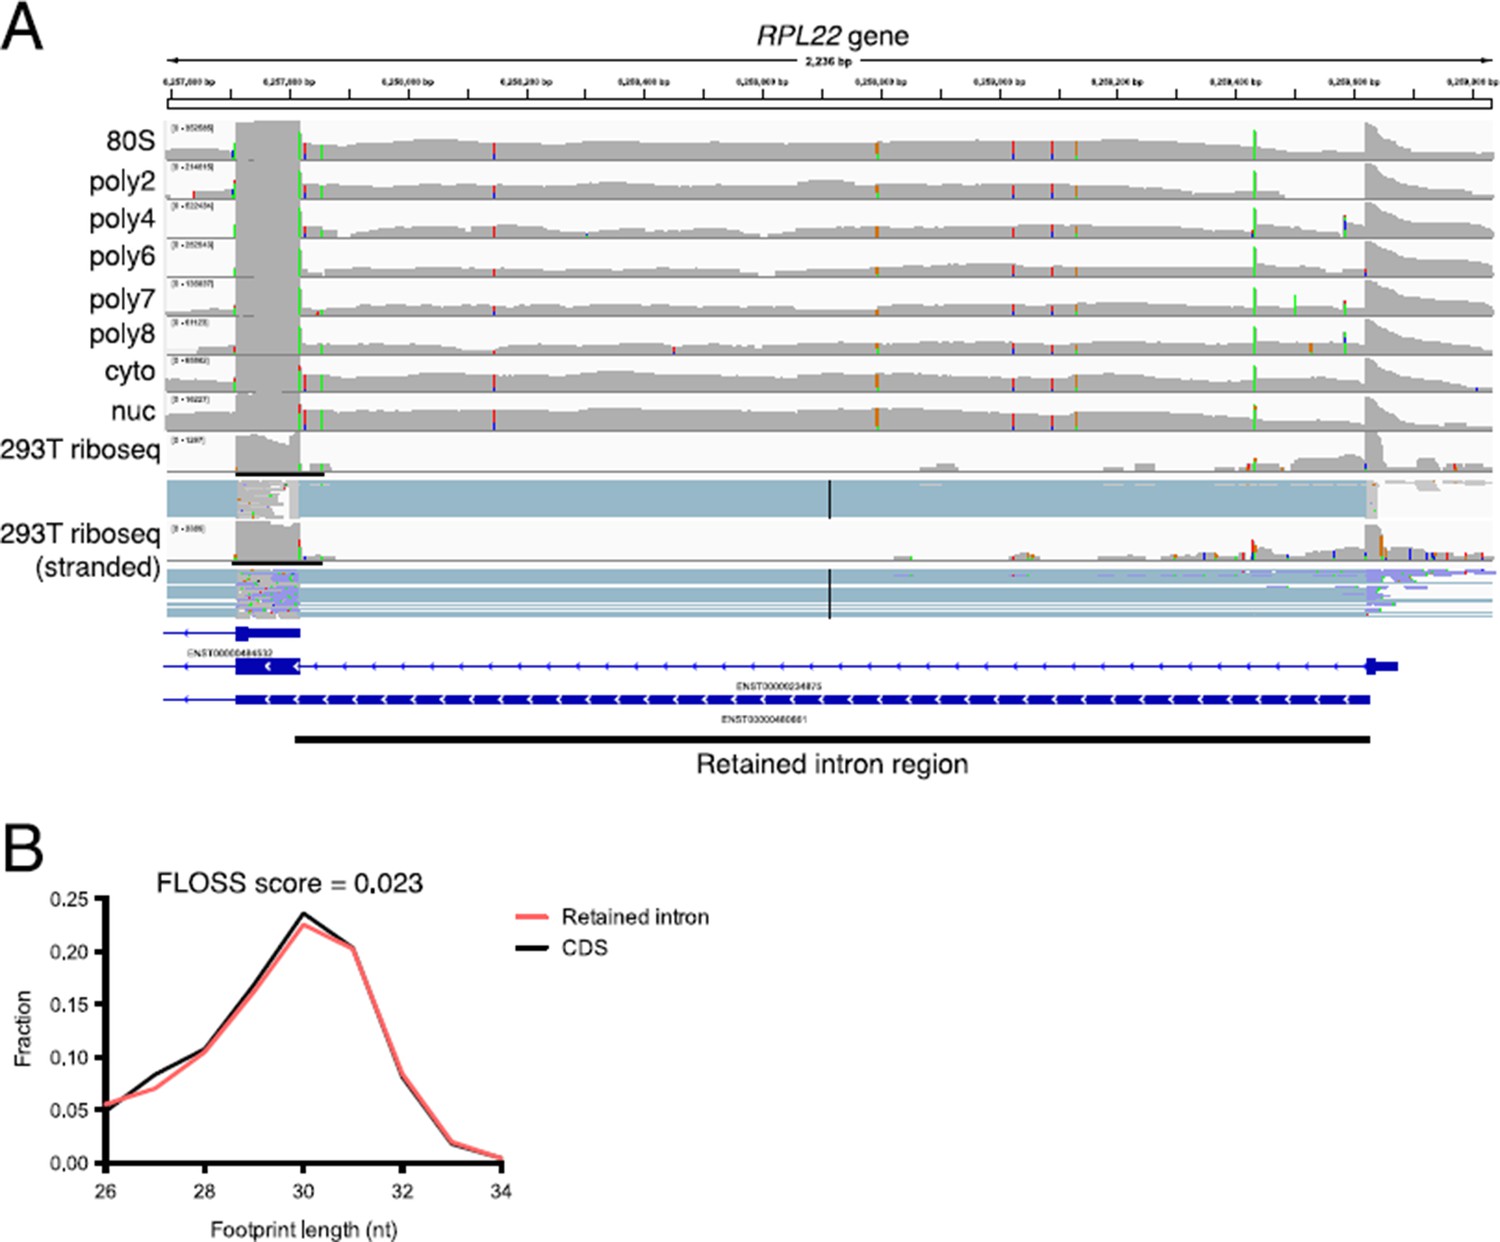
Retained intron transcripts found in polysomes are also observed by ribosome profiling.
(A) An example of a retained intron transcript on polysomes where the retained intron region is detected through the eight+ ribosome fraction. (bottom) Ribosome profiling reads are detected in the retained intron region in two separate 293T ribosome profiling datasets. (B) Shown are fragment length distributions for ribosome profiling reads derived from either retained intro regions (red) or coding sequence regions (black). The FLOSS score (Ingolia et al., 2014) between retained intron and CDS fragment length distributions is 0.023, indicating near perfect agreement. The FLOSS score is the integrated point wise difference between the two distributions. Ribosome profiling data from the Yoon-Jae Cho lab and from Sidrauski et al. (2015).
Additional files
-
Supplementary file 1
RNA sequences for untranslated regions fused to luciferase (Figure 5).
- https://doi.org/10.7554/eLife.10921.022
Download links
A two-part list of links to download the article, or parts of the article, in various formats.
Downloads (link to download the article as PDF)
Open citations (links to open the citations from this article in various online reference manager services)
Cite this article (links to download the citations from this article in formats compatible with various reference manager tools)
Tunable protein synthesis by transcript isoforms in human cells
eLife 5:e10921.
https://doi.org/10.7554/eLife.10921


