No current evidence for widespread dosage compensation in S. cerevisiae
- University of Massachusetts Medical School, United States
- Harvard Medical School, United States
- Massachusetts Institute of Technology, United States
- Howard Hughes Medical Institute, Massachusetts Institute of Technology, United States
Figures
Figure 1
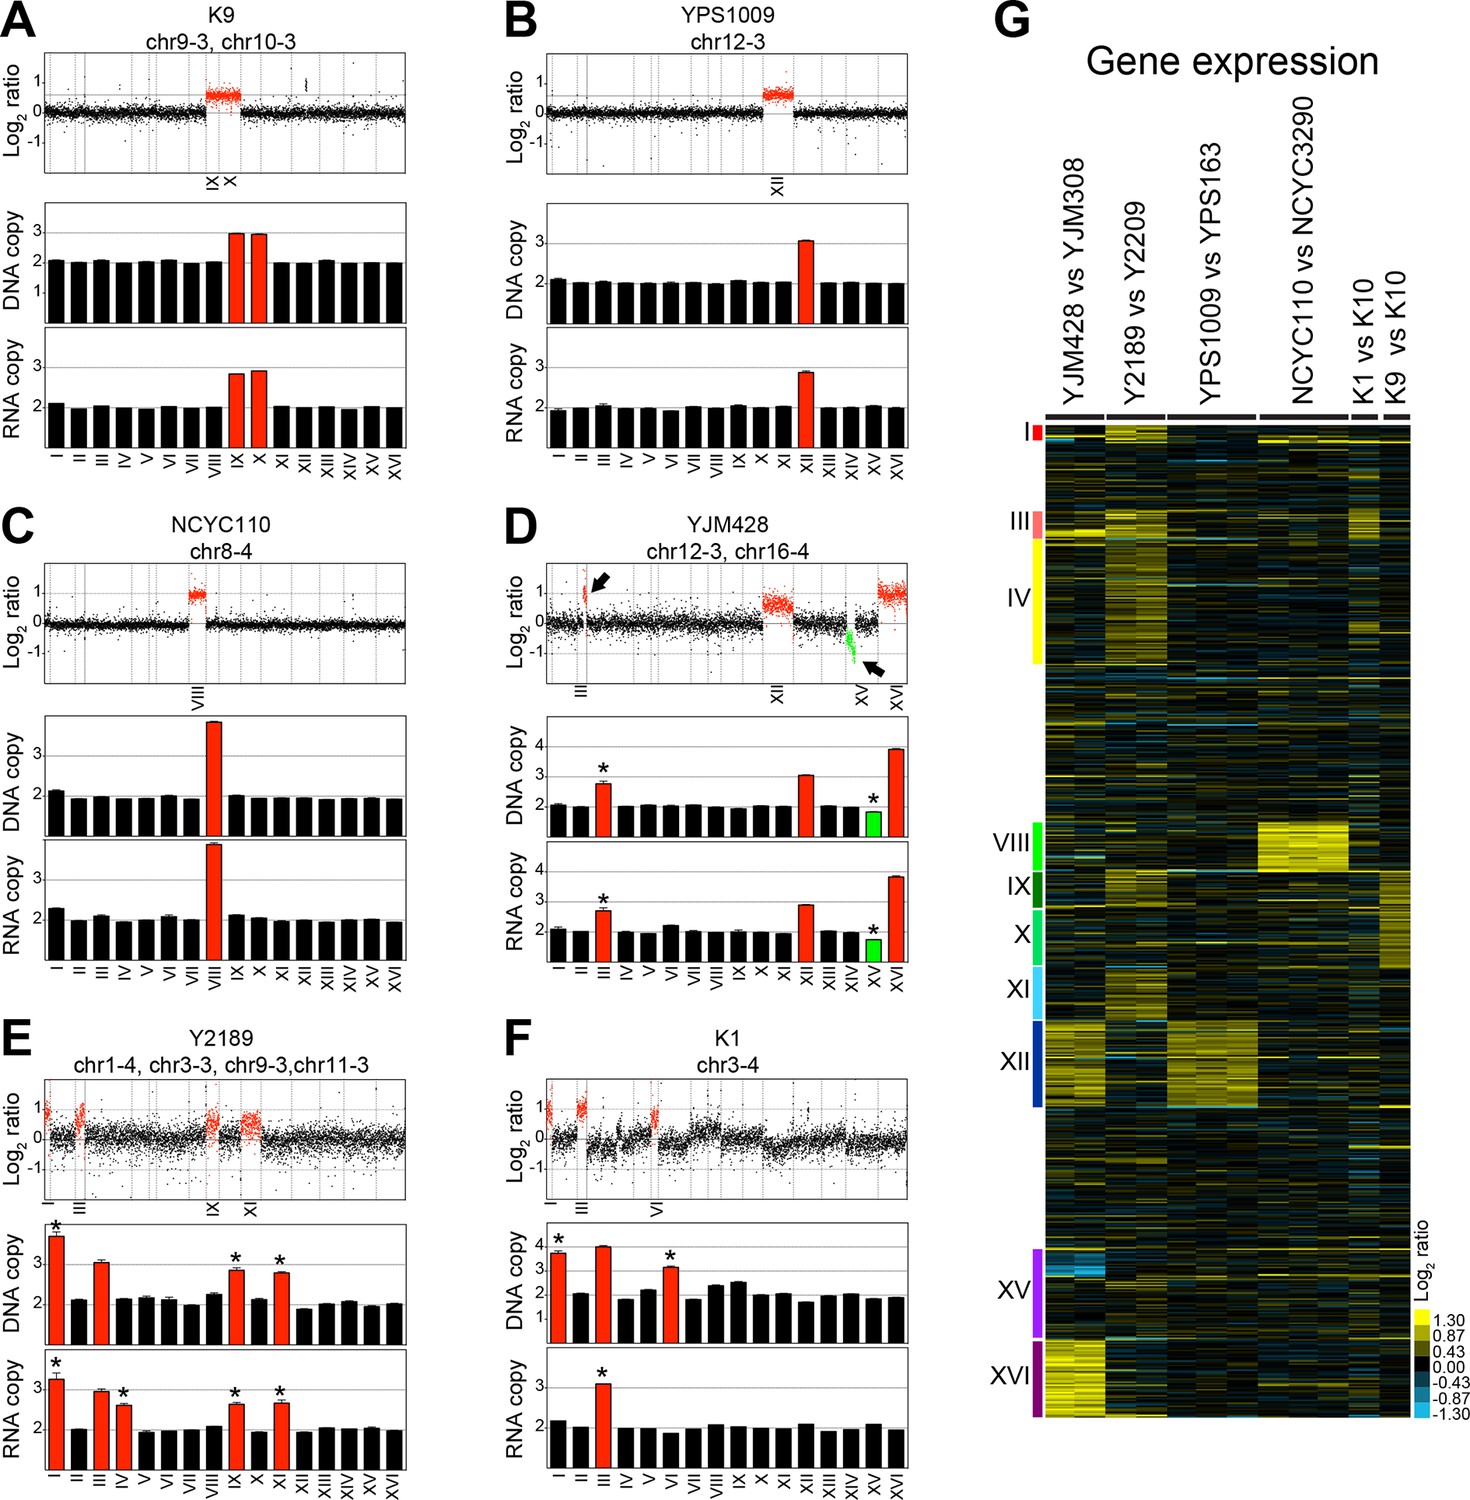
DNA and RNA copy number of six wild S. cerevisiae strains.
(A) DNA and RNA copy number analysis of strain K9 compared to K10. Log2 ratios of aneuploid vs. euploid DNA in the order of the chromosomal location of their encoding genes are shown on the top. DNA copy number of chromosomes IX and X are shown in red. The graph below shows the average DNA copy number per chromosome. The graph below shows RNA copy number averaged per chromosome relative to K10 (n = 1). (B) DNA and RNA copy number analysis of strain YPS1009 compared to YPS163. Data are represented as in (A). Error bars represent the SD of the chromosome means from three biological replicates. Medians are identical to the means. (C) DNA and RNA copy number analysis of strain NCYC110 compared to NCYC3290. Data are represented as in (A). Error bars represent the SD of the chromosome means from three biological replicates. Medians are identical to the means. (D) DNA and RNA copy number analysis of strain YJM428 compared to YJM308. Log2 ratios of aneuploid vs. euploid DNA in the order of the chromosomal location of their encoding genes are shown on the top. DNA copy number of chromosomes XII and XVI are shown in red. Arrows indicate an amplification of part of chromosome III (red) and a loss of part of chromosome XV (green). The graph below shows the average DNA copy number per chromosome relative to strain YJM308. The graph below shows RNA copy number averaged per chromosome. Error bars represent the SD of the chromosome means from two biological replicates. Medians are identical to the means. Asterisk indicate significant deviations from the expected value as determined by a one sample t-test (p < 0.01). (E) DNA and RNA copy number analysis of strain Y2189 compared to Y2209. Data are represented as in (D). Error bars represent the SD of the chromosome means from two biological replicates. Medians are identical to the means. Asterisk indicate significant deviations from the expected value as determined by a one sample t-test (p < 0.01). Note that chromosome IV shows increased RNA copy number relative to DNA copy number. (F) DNA and RNA copy number analysis of strain K1 compared to K10. Data are represented as in (D). Asterisk indicate significant deviations from the expected value as determined by a one sample t-test (p < 0.01). Note that chromosomes I and VI exhibit an increased copy number at the DNA level but not at the RNA level. (G) Gene expression of six aneuploid strains ordered by chromosome. Experiments (columns) of two biological replicates for strains YJM428 and Y2189, three biological replicates for strains YPS1009 and NCYC110, and one experiment for strains K1 and K9 are shown.
Figure 2
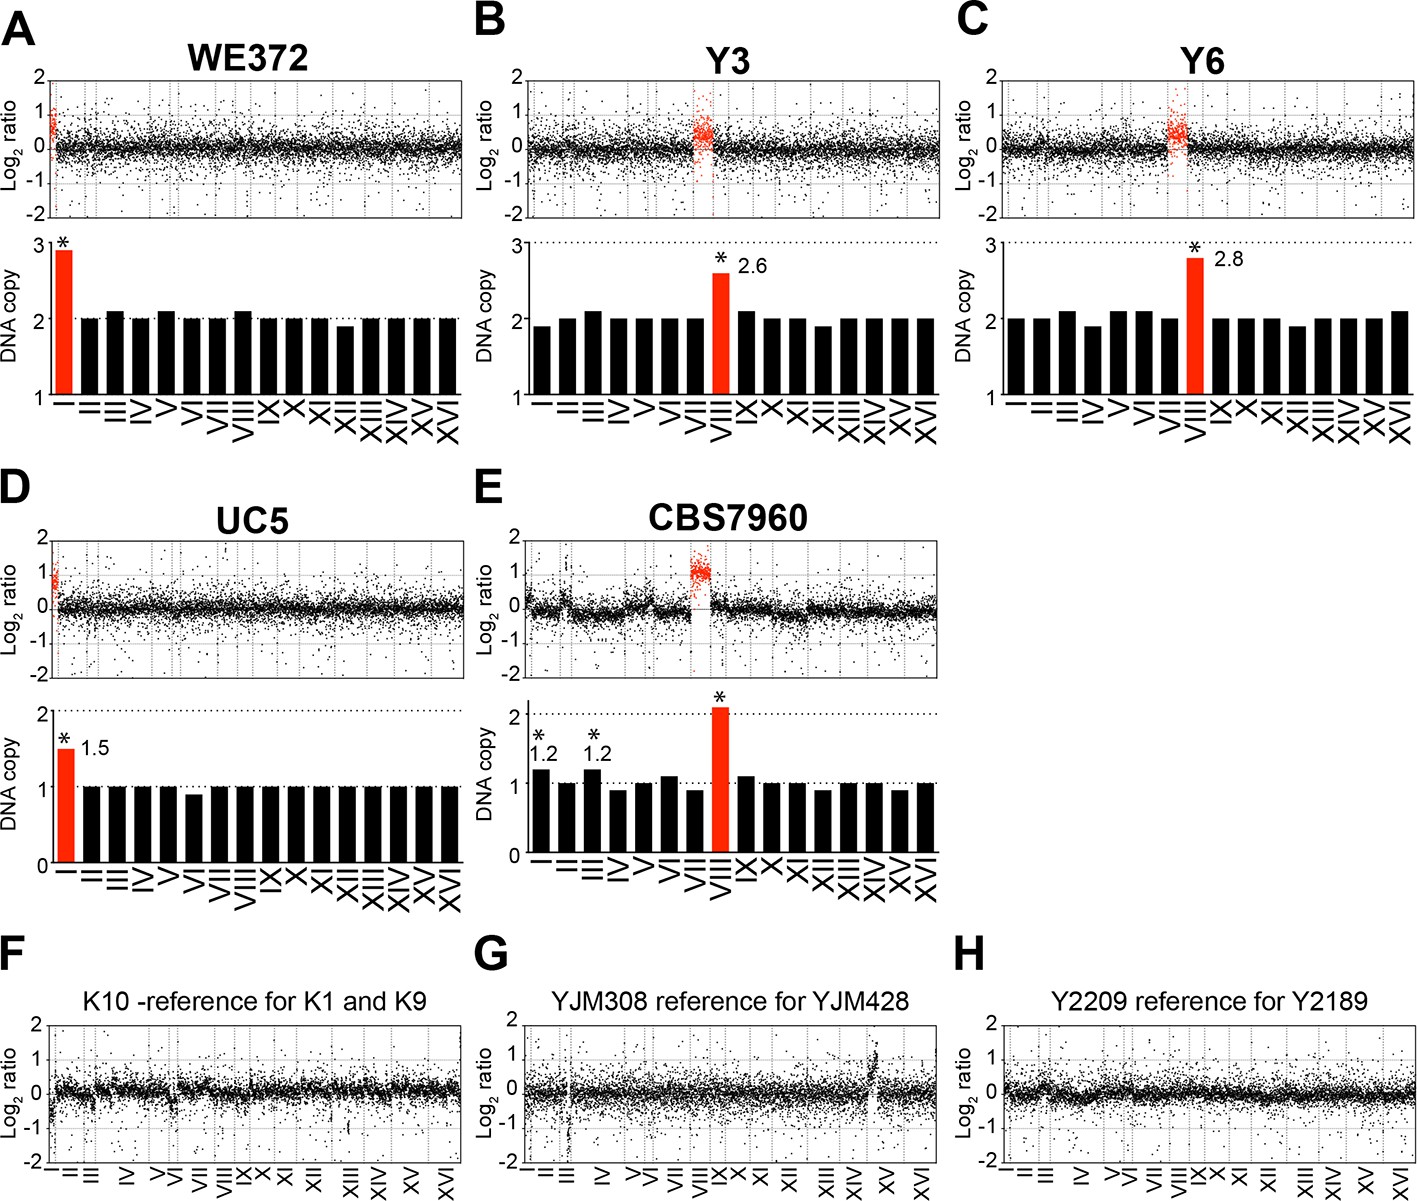
Karyotypes of aneuploid wild S. cerevisiae strains Y3, Y6 UC5, CBS7960, and WE372 and euploid control strains.
(A–E) Relative DNA copy of WE372 (A), Y3 (B), Y6 (C), UC5 (D), and CBS7960 (E) compared to S288C. Log2 (aneuploid vs. euploid DNA) per gene relative (top) are shown in the order of the chromosomal location of their encoding genes. DNA copy numbers of amplified chromosomes are shown in red. Bar graphs (bottom) represent the DNA copy numbers averaged per chromosome. Asterisks indicate significant deviations from expected integral value using one sample t test (p < 0.01). (F–G) Relative DNA copy of K10 (F), YJM308 (G), and Y2189 (H) compared to S288C. Log2 ratio (aneuploid vs. euploid DNA) per gene are shown in the order of the chromosomal location of their encoding genes.
Figure 3
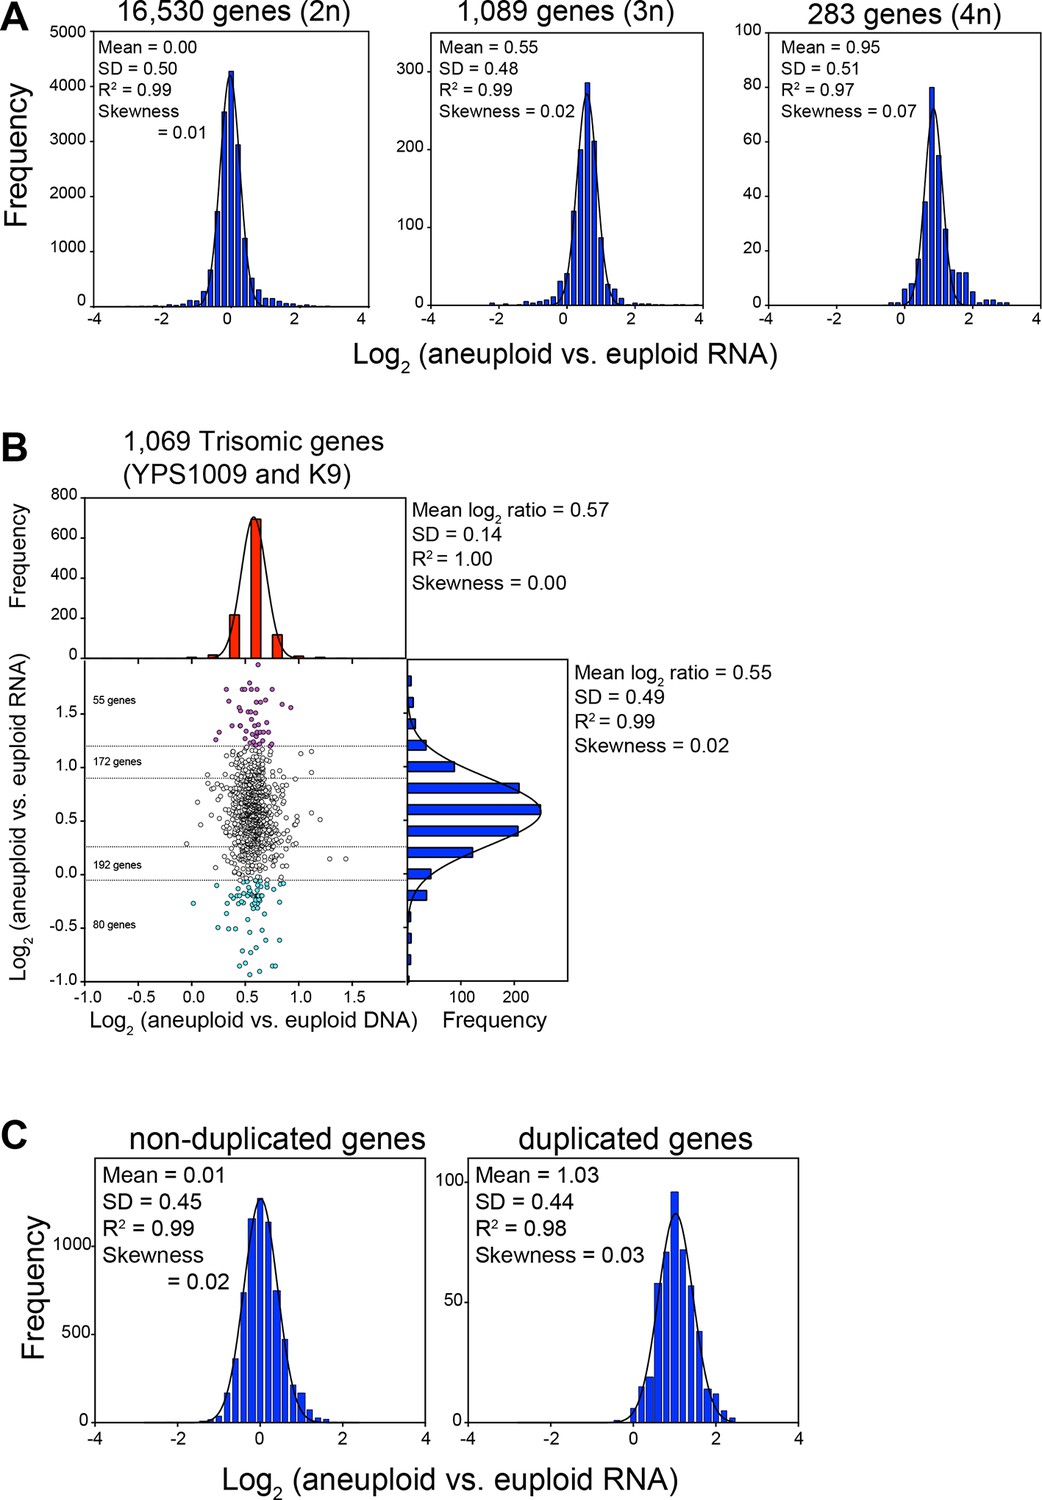
RNA levels correlate with DNA copy number in wild and laboratory strains of S. cerevisiae.
(A) Histogram of the log2 ratios of the RNA copy number of genes located on euploid chromosomes (left panel, strains YPS1009, NCYC110, and K9), genes present on trisomic chromosomes (3n, middle panel, YPS1009, and K9), and genes present on tetrasomic chromosomes (right panel, NCYC110), relative to euploid controls are shown. Bin size for all histograms is log2 ratio of 0.2, medians are identical to means. Fits to a normal distribution (black line), means and goodness of fit (R2) and skewness are shown for each distribution. (B) The average log2 (aneuploid vs. euploid RNA) of triplicated genes plotted against average log2 (aneuploid vs. euploid DNA) in strains YPS1009 and K9. Histogram of the log2 ratios of the DNA copy number is shown in red (mean log2 ratio = 0.57, SD = 0.14, R2 = 1.0, skewness = 0.00). Histogram of the log2 ratios of the RNA copy number of is shown in blue (median = mean = 0.55, skewness = 0.02). Fits to a normal distribution are shown (black line). Numbers of genes that show RNA copy numbers lower or higher than 1 or 2 SD from the mean are shown (separated by dotted lines). (C) Histogram of the log2 ratios of the RNA copy number of genes located on euploid chromosomes (left panel), and genes present on duplicated chromosomes (right panel) in two disomic laboratory strains (disome V and XVI) relative to the euploid W303 control are shown. Bin size for all histograms is log2 ratio of 0.2, medians are identical to means. Fits to a normal distribution are shown (black line). Means, goodness of fit (R2) and skewness are shown for each distribution.
Figure 4
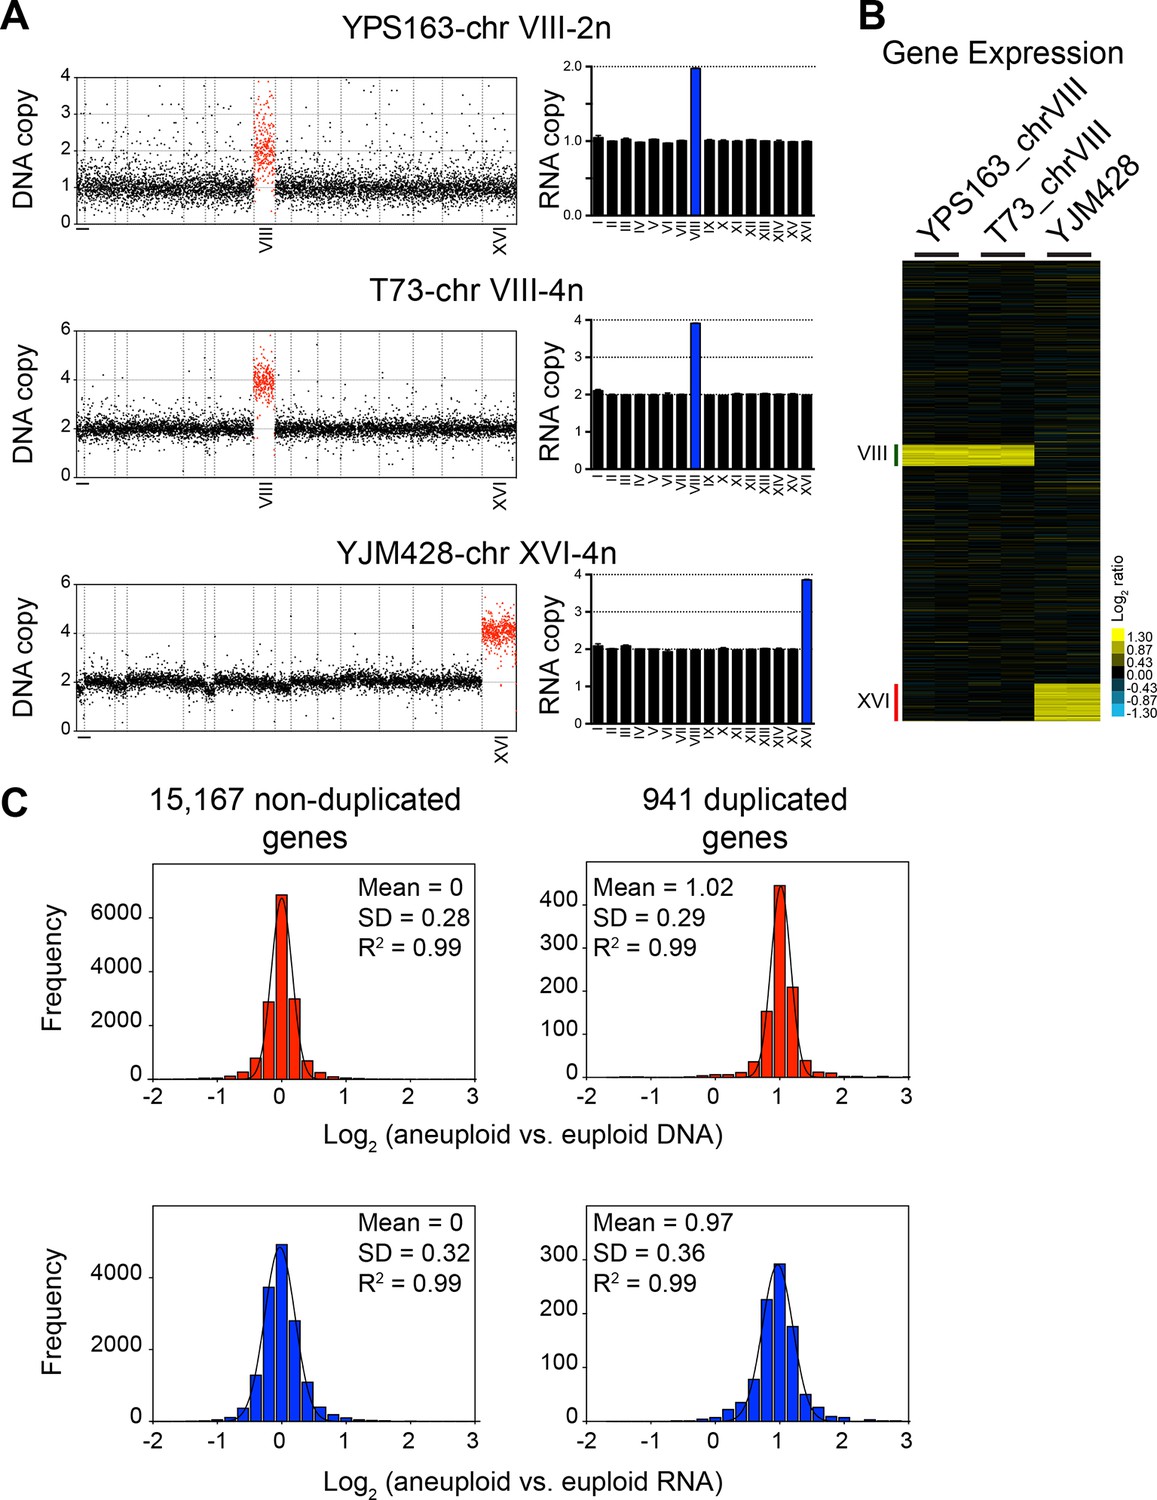
DNA and RNA copy number of euploid and aneuploid isogenic wild S. cerevisiae strains.
(A) Plots for strains YPS163-chrVIII-2n, T73-chrVIII-4n, and YJM428-chrXVI-4n, represent the log2 ratio of their relative DNA copy number compared to their isogenic and euploid counterparts. DNA copy numbers are shown in the order of the chromosomal location of their encoding genes (left). DNA copy numbers of amplified chromosomes are shown in red. Bar graphs on the right represent the RNA copy numbers averaged per chromosome for aneuploid strains relative to euploid reference strains. The average RNA copies of non-amplified chromosomes are shown in black. Amplified chromosomes, as predicted by the karyotype, are shown in blue. (B) Gene expression of three aneuploid strains ordered by chromosome position. Experiments (columns) of two biological replicates are shown. (C) Histogram of the log2 ratios of the DNA (top) and RNA (bottom) copy number of genes located on euploid chromosomes (left) and genes located on duplicated chromosomes (right) relative to euploid controls are shown. Bin size for all histograms is log2 ratio of 0.2, medians are identical to means and all distributions show a skewness of 0.01. Fits to a normal distribution are shown (black line) and so are means and goodness of fit (R2) for each distribution.
Figure 5
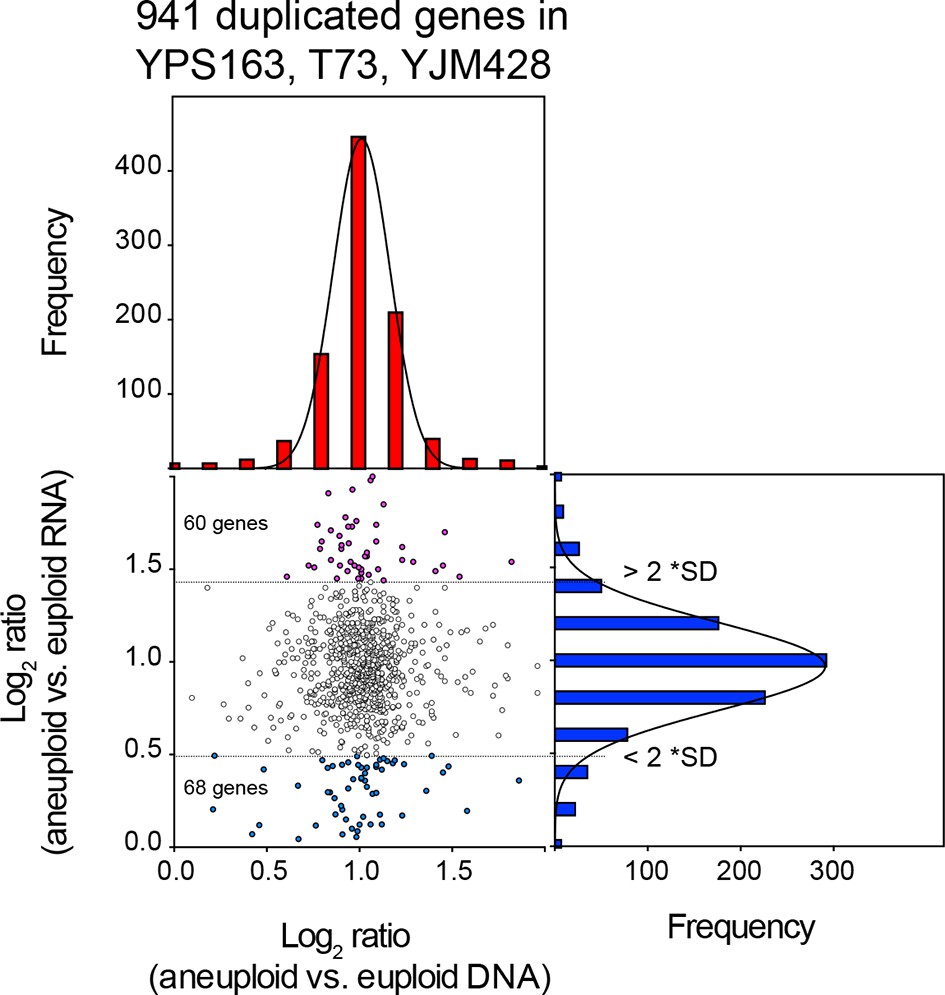
Comparison of DNA and RNA copy number distributions of strains YPS163, T73, and YJM428.
The average log2 (aneuploid vs. euploid RNA) of 941 genes located on duplicated chromosomes plotted against the average log2 (aneuploid vs. euploid DNA) in strains YPS163, T73, and YJM428. Histogram of the log2 ratios of the DNA copy number is shown in red. Histogram of the log2 ratios of the RNA copy number is shown in blue. Fits to a normal distribution are shown (black line). The number of genes that show RNA copy numbers lower or higher than 2 SD from the mean are shown (separated by dotted lines).
Figure 6
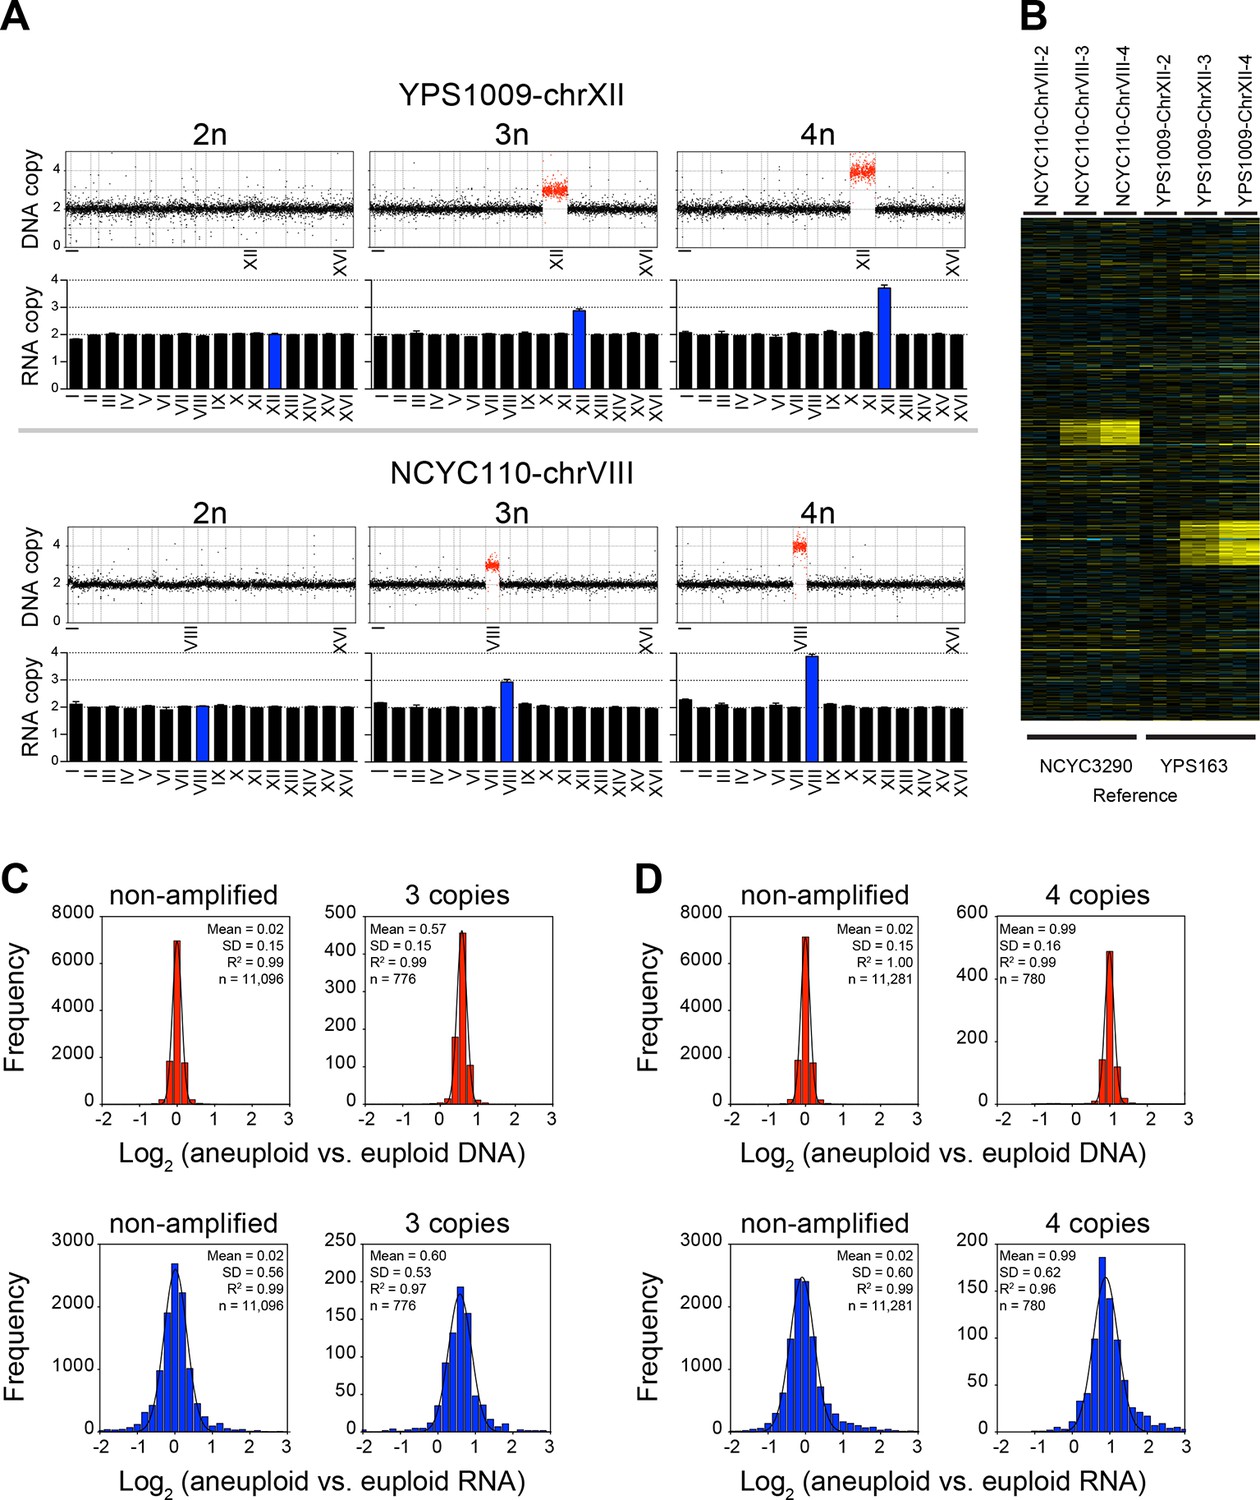
RNA copy number proportionally increases with DNA copy number in aneuploid series of wild S. cerevisiae strains.
(A) Plots for strain series YPS1009-XII-2n, YPS1009-XII-3n, YPS1009-XII-4n and strain series NCYC110-chrVIII-2n, NCYC110-chrVIII-3n, NCYC110-chrVIII-4n represent the DNA copy number compared to their euploid counterparts. DNA copy numbers are shown in the order of the chromosomal location of their encoding genes. DNA copy numbers of amplified chromosomes are shown in red. Bar graphs below represent the RNA copy numbers averaged per chromosome for aneuploid strains relative to euploid reference strains. The average RNA copies of non-amplified chromosomes are shown in black. Amplified chromosomes, as predicted by the karyotype, are shown in blue. (B) Gene expression of strain series YPS1009-XII-2n, YPS1009-XII-3n, YPS1009-XII-4n, and strain series NCYC110-chrVIII-2n, NCYC110-chrVIII-3n, NCYC110-chrVIII ordered by chromosome position. Experiments (columns) of three biological replicates are shown. (C) Histogram of the log2 ratios of the DNA copy number of genes located on euploid chromosomes (top left) and genes located on trisomic chromosomes (top right) in strains YPS1009-chrXII-3n and NCYC110-chrVIII-3n relative to euploid controls are shown. Fits to a normal distribution are shown (black line). Histogram of the log2 ratios of the RNA copy number of genes located on euploid chromosomes (bottom left) and genes present on trisomic chromosomes (bottom right) in strains YPS1009-chrXII-3n and NCYC110-chrVIII-3n relative to euploid controls are shown. Fits to a normal distribution are shown (black line). (D) Histogram of the log2 ratios of the DNA copy number of genes located on euploid chromosomes (top left) and genes located on tetrasomic chromosomes (top right) in strains YPS1009-chrXII-4n and NCYC110-chrVIII-4n relative to euploid controls are shown. Fits to a normal distribution are shown (black line). Histogram of the log2 ratios of the RNA copy number of genes located on euploid chromosomes (bottom left) and genes located on tetrasomic chromosomes (bottom right) in strains YPS1009-chrXII-4n and NCYC110-chrVIII-4n relative to euploid controls are shown. Fits to a normal distribution are shown (black line).
Figure 7
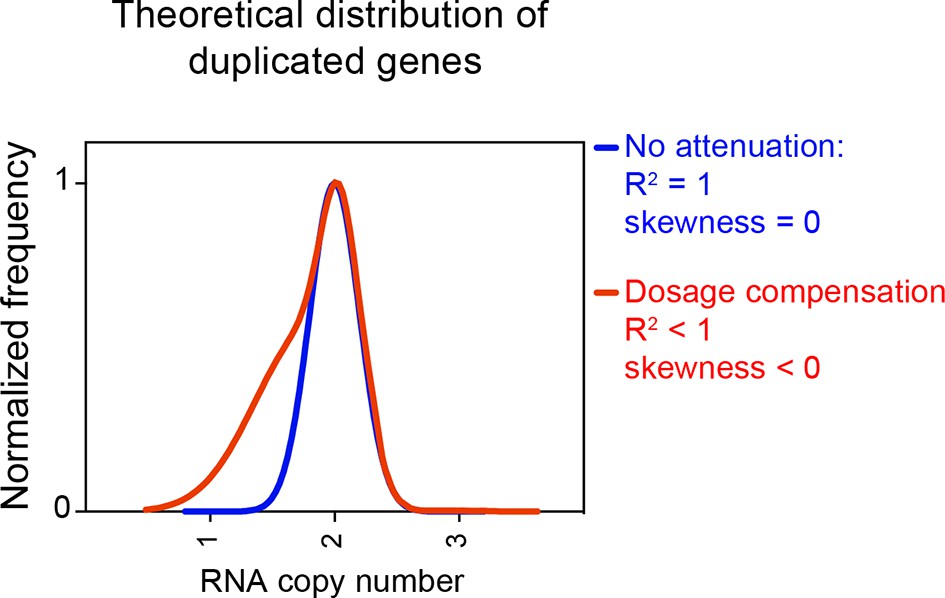
Theoretical distribution of RNA copy number of dosage compensated duplicated genes.
The theoretical distribution of RNA copy number of duplicated genes when no dosage compensation takes place is shown in blue. The theoretical distribution of RNA copy number of duplicated genes when 30% of the genes are dosage compensated is shown in red. The fit to a normal distribution shows negative skewness values (red).
Figure 8
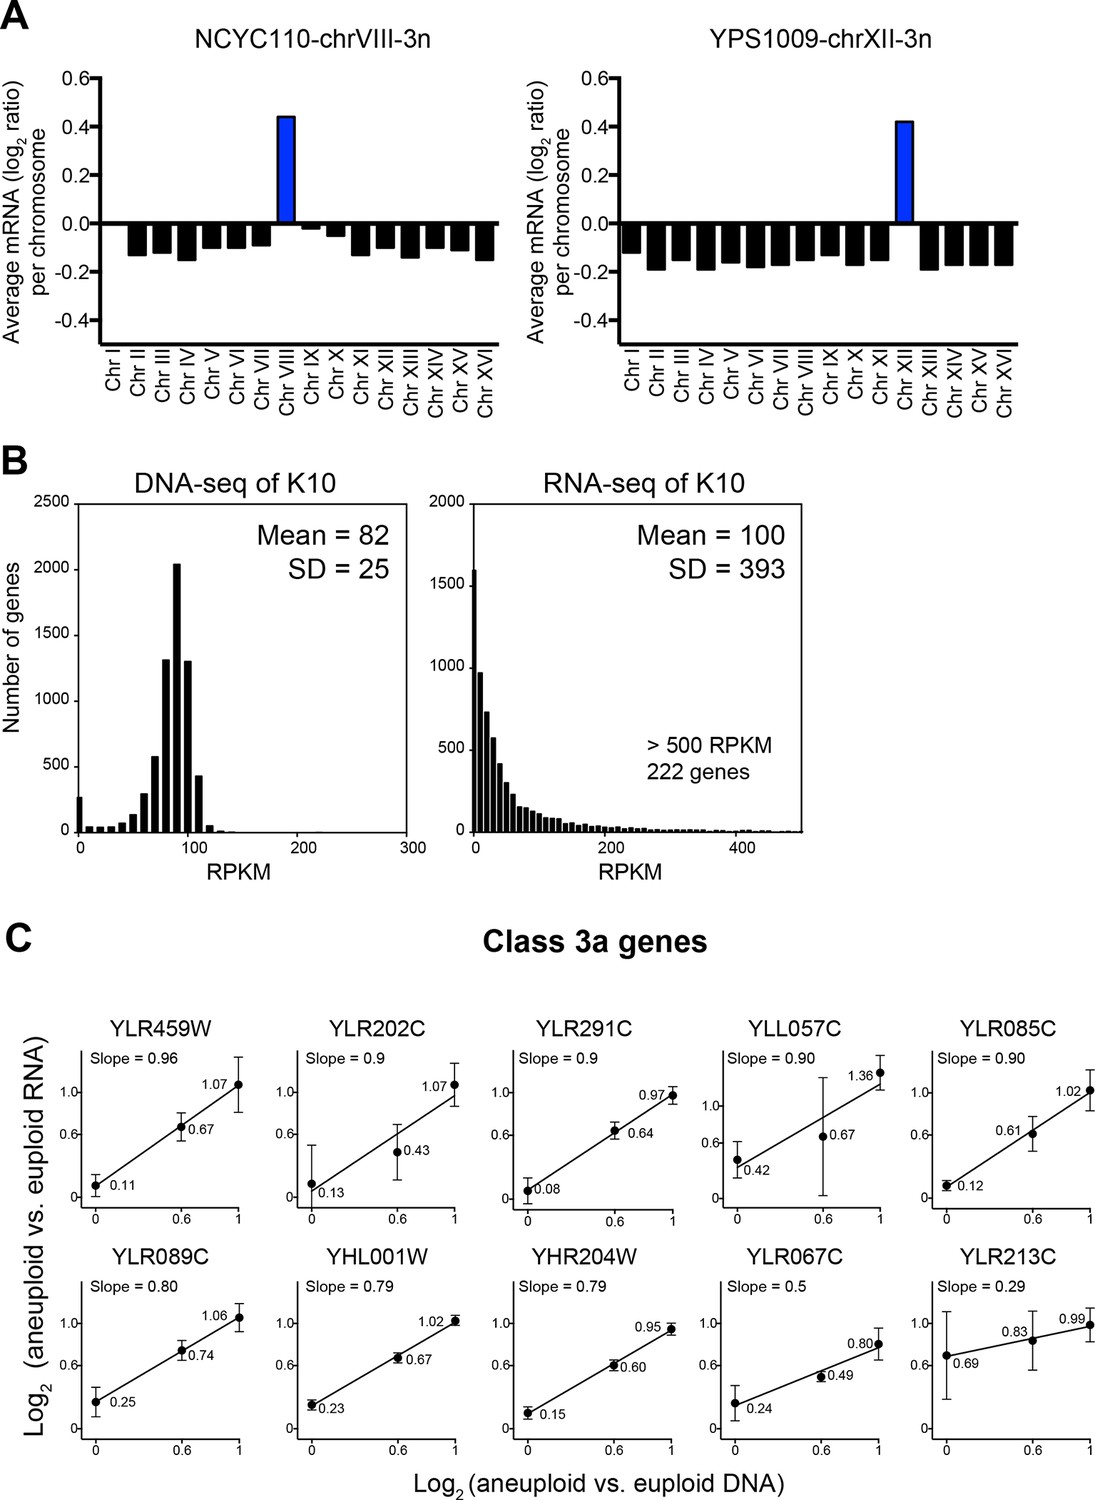
Evaluation of the analysis tools employed by Hose et al. (2015).
(A) RNA copy numbers averaged per chromosome of normalized RNA-seq data obtained by Hose et al. (2015). Data provided by Hose et al. (2015). (B) Standard deviations of RNA-seq data are greater than those of DNA-seq data. Histograms of DNA-seq RPKM and RNA-seq RPKM for strain K10 are shown. (C) Linear regression fits of RNA versus DNA copy number are shown for several genes identified as class 3a dosage compensated genes by Hose et al. (2015). Eight genes from chromosome XII and two genes from chromosome VIII are shown. Average log2 ratio of aneuploid vs. euploid RNA is shown. Error bars represent SD from three biological replicates.
Tables
Table 1
DNA and RNA copy number of six wild S. cerevisiae strains. The columns describe the following parameters: Column 1: Strain name. Column 2: Identity of chromosomes amplified in each strain. Euploid represents the combined data of all euploid chromosomes in a given strain. Column 3: Reported chromosome copy number. Column 4: Number of genes quantified by RNA-seq. Column 5: Mean of the normalized log2 ratios (aneuploid vs. euploid RNA). Column 6: Standard deviation (SD) of the normalized log2 ratios (aneuploid vs. euploid RNA). Column 7: Mean of the normalized log2 ratios (aneuploid vs. euploid DNA). Column 8: Standard deviation (SD) of the normalized log2 ratios (aneuploid vs. euploid DNA). Column 9: Number of genes whose values are below two SD from the mean. Column 10: Number of genes whose values are above two SD from the mean. Column 11: Cutoff used by Hose et al. (2015) to identified genes that are dosage compensated.
1 | 2 | 3 | 4 | 5 | 6 | 7 | 8 | 9 | 10 | 11 |
|---|---|---|---|---|---|---|---|---|---|---|
STRAIN | Chr | Copy number | Genes | RNA Mean | RNA SD | DNA Mean | DNA SD | Number of genes RNA <2*SD | Number of genes RNA >2*SD | Cutoffs by Hose et al |
YJM428 -1 | XII | 3 | 525 | 0.52 | 0.63 | 15 | ||||
XVI | 4 | 485 | 0.95 | 0.66 | 9 | 17 | ||||
Euploid | 2 | 5087 | −0.01 | 0.72 | 116 | 169 | ||||
YJM428-2 | XII | 3 | 533 | 0.54 | 0.70 | 0.60 | 0.22 | 10 | 18 | N/A |
| XVI | 4 | 490 | 0.92 | 0.63 | 0.96 | 0.23 | 11 | 18 | N/A |
Euploid | 2 | 5160 | −0.01 | 0.72 | 0.00 | 0.28 | 75 | 183 | ||
Aneuploid genes | 9 (1%) | 14 (1%) | ||||||||
Euploid genes | 36 (1 %) | 77 (1%) | ||||||||
Y2189-1 | I | 4 | 88 | 0.77 | 0.89 | 3 | 4 | |||
III | 3 | 170 | 0.60 | 0.88 | 5 | 3 | ||||
IX | 3 | 216 | 0.42 | 0.91 | 5 | 9 | ||||
XI | 3 | 325 | 0.37 | 0.89 | 3 | 8 | ||||
Euploid | 5209 | 0.05 | 0.76 | 104 | 204 | |||||
Y2189-2 | I | 4 | 89 | 0.63 | 1.01 | 1.05 | 1.04 | 4 | 3 | 0.21 |
| III | 3 | 167 | 0.53 | 0.90 | 0.53 | 0.55 | 5 | 6 | 0.24 |
IX | 3 | 214 | 0.37 | 0.96 | 0.45 | 0.48 | 5 | 9 | N/A | |
XI | 3 | 324 | 0.46 | 0.65 | 0.47 | 0.25 | 3 | 10 | 0.13 | |
Euploid | 2 | 5231 | 0.06 | 0.77 | 0.00 | 0.43 | 142 | 165 | ||
Aneuploid genes | 9 (1%) | 15 (2%) | ||||||||
Euploid genes | 50 (1%) | 124 (2%) | ||||||||
YPS1009-1 | XII | 3 | 511 | 0.53 | 0.62 | 13 | 27 | |||
Euploid | 2 | 5482 | 0.00 | 0.57 | 132 | 136 | ||||
YPS1009-2 | XII | 3 | 520 | 0.49 | 0.73 | 16 | 20 | |||
Euploid | 2 | 5531 | 0.00 | 0.60 | 145 | 119 | ||||
YPS1009-3 | XII | 3 | 521 | 0.56 | 0.66 | 0.62 | 0.24 | 11 | 31 | 0.10 |
| Euploid | 2 | 5532 | 0.00 | 0.56 | 0.00 | 0.31 | 130 | 180 | |
Aneuploid genes | 5 (1%) | 5 (1%) | ||||||||
Euploid genes | 46 (1%) | 27 (0%) | ||||||||
NCYC110-1 | VIII | 4 | 288 | 0.97 | 0.61 | 3 | 14 | |||
Euploid | 2 | 5806 | 0.00 | 0.62 | 69 | 274 | ||||
NCYC110-2 | VIII | 4 | 294 | 0.93 | 0.59 | 4 | 14 | |||
Euploid | 2 | 5919 | 0.00 | 0.61 | 60 | 247 | ||||
NCYC110-3 | VIII | 4 | 292 | 0.98 | 0.58 | 0.98 | 0.16 | 4 | 14 | 0.10 |
| Euploid | 2 | 5890 | 0.00 | 0.57 | 0.00 | 0.12 | 61 | 254 | |
Aneuploid genes | 0 (0%) | 5 (2%) | ||||||||
Euploid genes | 7 (0%) | 102 (2%) | ||||||||
K1 | III | 4 | 168 | 0.63 | 0.73 | 0.98 | 0.24 | 3 | 4 | 0.45 |
| Euploid | 2 | 5914 | 0.00 | 0.85 | 0.00 | 0.43 | 153 | 153 | |
Aneuploid genes | 3 (2%) | 4 (2%) | ||||||||
Euploid genes | 153 (3%) | 153 (3%) | ||||||||
K9 | IX | 3 | 223 | 0.51 | 0.59 | 0.55 | 0.13 | 10 | 4 | 0.24 |
X | 3 | 366 | 0.55 | 0.53 | 0.55 | 0.13 | 9 | 5 | 0.18 | |
Euploid | 2 | 5500 | 0.00 | 0.54 | 0.00 | 0.17 | 185 | 172 | ||
Aneuploid genes | 19 (3%) | 9 (2%) | ||||||||
Euploid genes | 185 (3%) | 172 (3%) | ||||||||
Table 2
RNA copy number of aneuploid chromosomes in strain series NCYC110 and YPS1009. Analysis of genes encoded by chromosome VIII in strains NCYC110-2n, NCYC110-3n, NCYC110-4n (top) and encoded by chromosome XII in strains YPS1009-2n, YPS1009-3n, YPS1009-4n. One SD was used as a cutoff to identified genes with lower than expected RNA levels in each biological replicate. The “All 3 replicates” line represents genes whose RNA levels are reproducibly lower than expected in 3 RNA-seq experiments. Line “Both 3n and 4n” represent the number of genes whose RNA levels are lower than expected in trisomic and tetrasomic strains.
NCYC110 | |||||||||
ChrVIII.2n-1 | ChrVIII.2n-2 | ChrVIII.2n-3 | ChrVIII.3n-1 | ChrVIII.3n-2 | ChrVIII.3n-3 | ChrVIII.4n-1 | ChrVIII.4n-2 | ChrVIII.4n-3 | |
Mean | 0.04 | -0.02 | 0.02 | 0.54 | 0.51 | 0.61 | 0.97 | 0.91 | 0.99 |
Number of genes | 282 | 285 | 283 | 284 | 286 | 282 | 285 | 286 | 284 |
SD | 0.53 | 0.56 | 0.54 | 0.51 | 0.50 | 0.54 | 0.57 | 0.55 | 0.56 |
Mean - 1*SD | 23 | 18 | 20 | 29 | 25 | 22 | 24 | 33 | 29 |
All 3 replicates | 3 | 12 | |||||||
Both 3n and 4n | 1 | 2 | |||||||
YPS1009 | |||||||||
| Chr XII-2n-1 | Chr XII-2n-2 | Chr XII-2n-3 | Chr XII-3n-1 | Chr XII-3n-2 | Chr XII-3n-3 | Chr XII-4n-1 | Chr XII-4n-2 | Chr XII-4n-3 |
Mean | 0.01 | 0.04 | 0.06 | 0.57 | 0.57 | 0.60 | 0.93 | 0.96 | 1.00 |
Number of genes | 495 | 500 | 496 | 498 | 499 | 499 | 499 | 499 | 500 |
SD | 0.41 | 0.52 | 0.46 | 0.46 | 0.47 | 0.51 | 0.65 | 0.66 | 0.66 |
Mean - 1*SD | 42 | 56 | 36 | 47 | 50 | 46 | 46 | 52 | 45 |
All 3 replicates | 8 | 15 | 17 | ||||||
Both 3n and 4n | 3 | 7 | |||||||
Download links
A two-part list of links to download the article, or parts of the article, in various formats.
Downloads (link to download the article as PDF)
Open citations (links to open the citations from this article in various online reference manager services)
Cite this article (links to download the citations from this article in formats compatible with various reference manager tools)
No current evidence for widespread dosage compensation in S. cerevisiae
eLife 5:e10996.
https://doi.org/10.7554/eLife.10996


