Layer specific and general requirements for ERK/MAPK signaling in the developing neocortex
- The University of North Carolina School of Medicine, United States
- Allen Institute for Brain Science, United States
- Arizona State University, United States
- University of North Carolina at Chapel Hill, United States
Figures
Figure 1 with 1 supplement
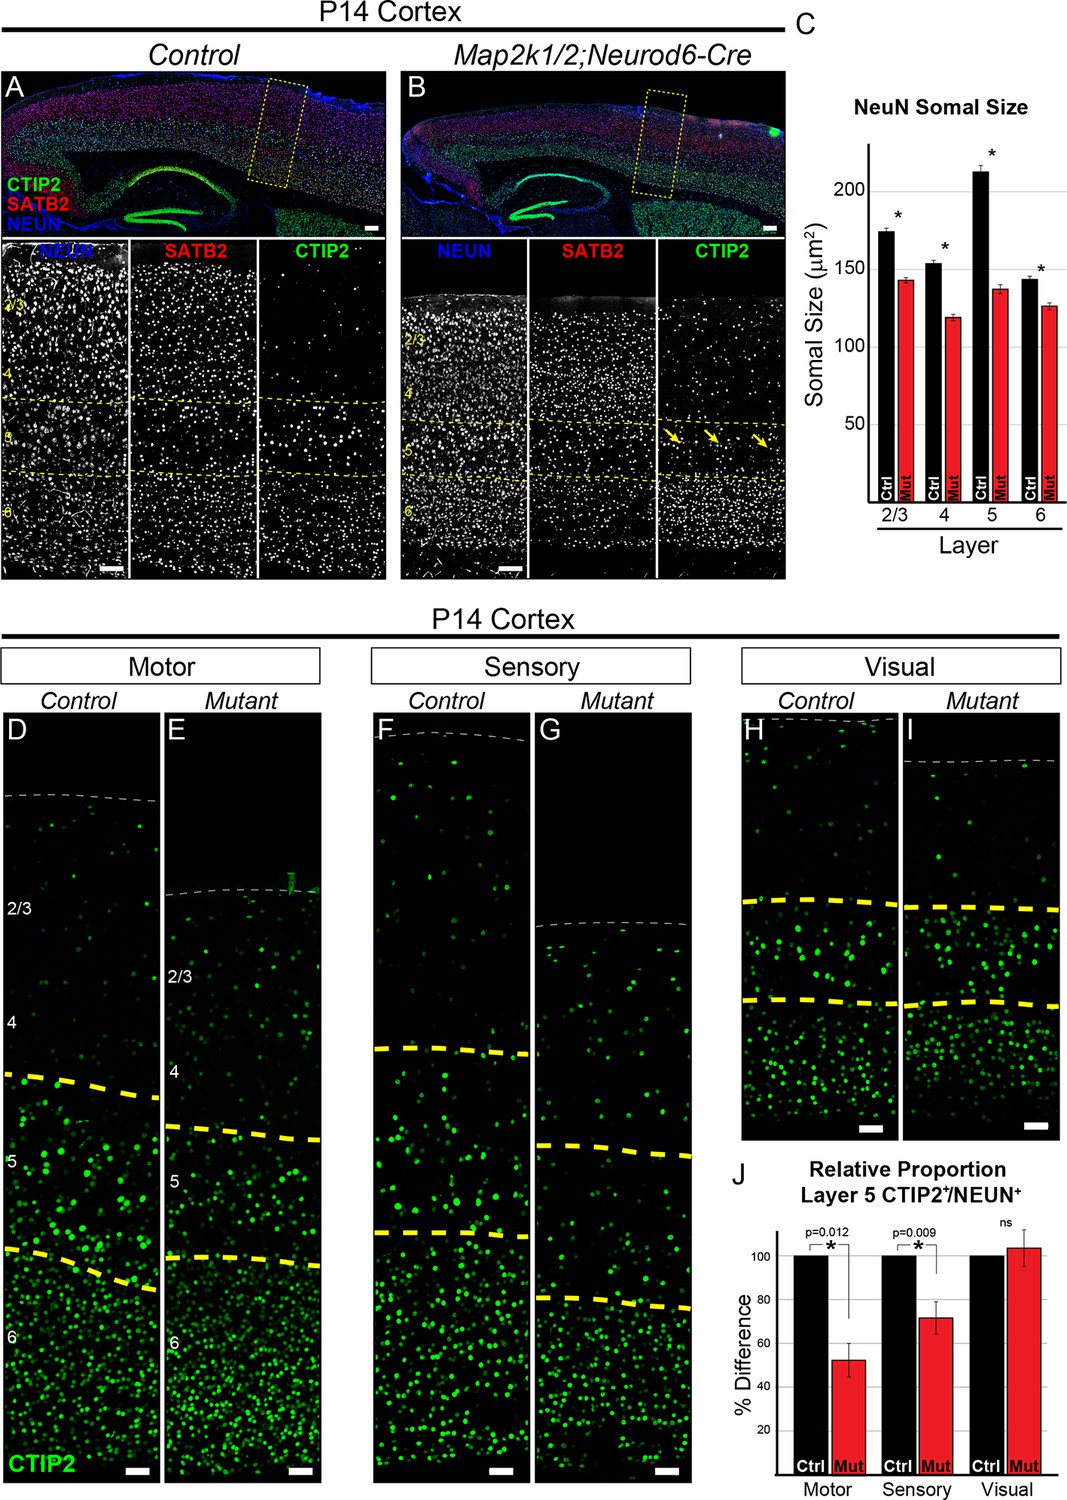
Loss of ERK/MAPK signaling leads to a reduction in the number of CTIP+ layer 5 neurons and reduced neuronal somal size.
(A–B). Immunostaining of P14 control (A) and Map2k1/2;Neurod6-Cre (B) sagittal forebrain sections for all neurons, callosal projection neurons, and subcortical projection neurons with NEUN, SATB2, and CTIP2, respectively, revealed an aberrant pattern of CTIP2 expression in layer 5 of mutant sensorimotor cortices (yellow arrows) (n=6, scale bar=100 µm). (C) Quantification of somal size was performed by measuring the cross-sectional area of randomly selected, NEUN labeled soma in distinct cortical layers. A reduction in the size of NEUN labeled soma in P14 mutant sensory cortices was detected in all cortical layers, but was particularly pronounced in layer 5 (n= >300 total neurons per layer derived from five independent mice per condition, mean ± SEM, *p<0.001). (D–I) Representative confocal images of CTIP2 immunolabeling in radial columns of primary motor (D–E), sensory (F–G), and visual (H–I) cortex from P14 control (D, F, H) and Map2k1/2;Neurod6-Cre (E, G, I) brains (scale bar=30 µm). (J) Quantification of the relative number of layer 5 CTIP2+ neurons as a proportion of the total number of NEUN+ neurons in a cortical column revealed a substantial decrease in motor and sensory, but not visual, cortices in P14 mutant mice (n=4, mean ± SEM, *p<0.05).
Figure 1—figure supplement 1
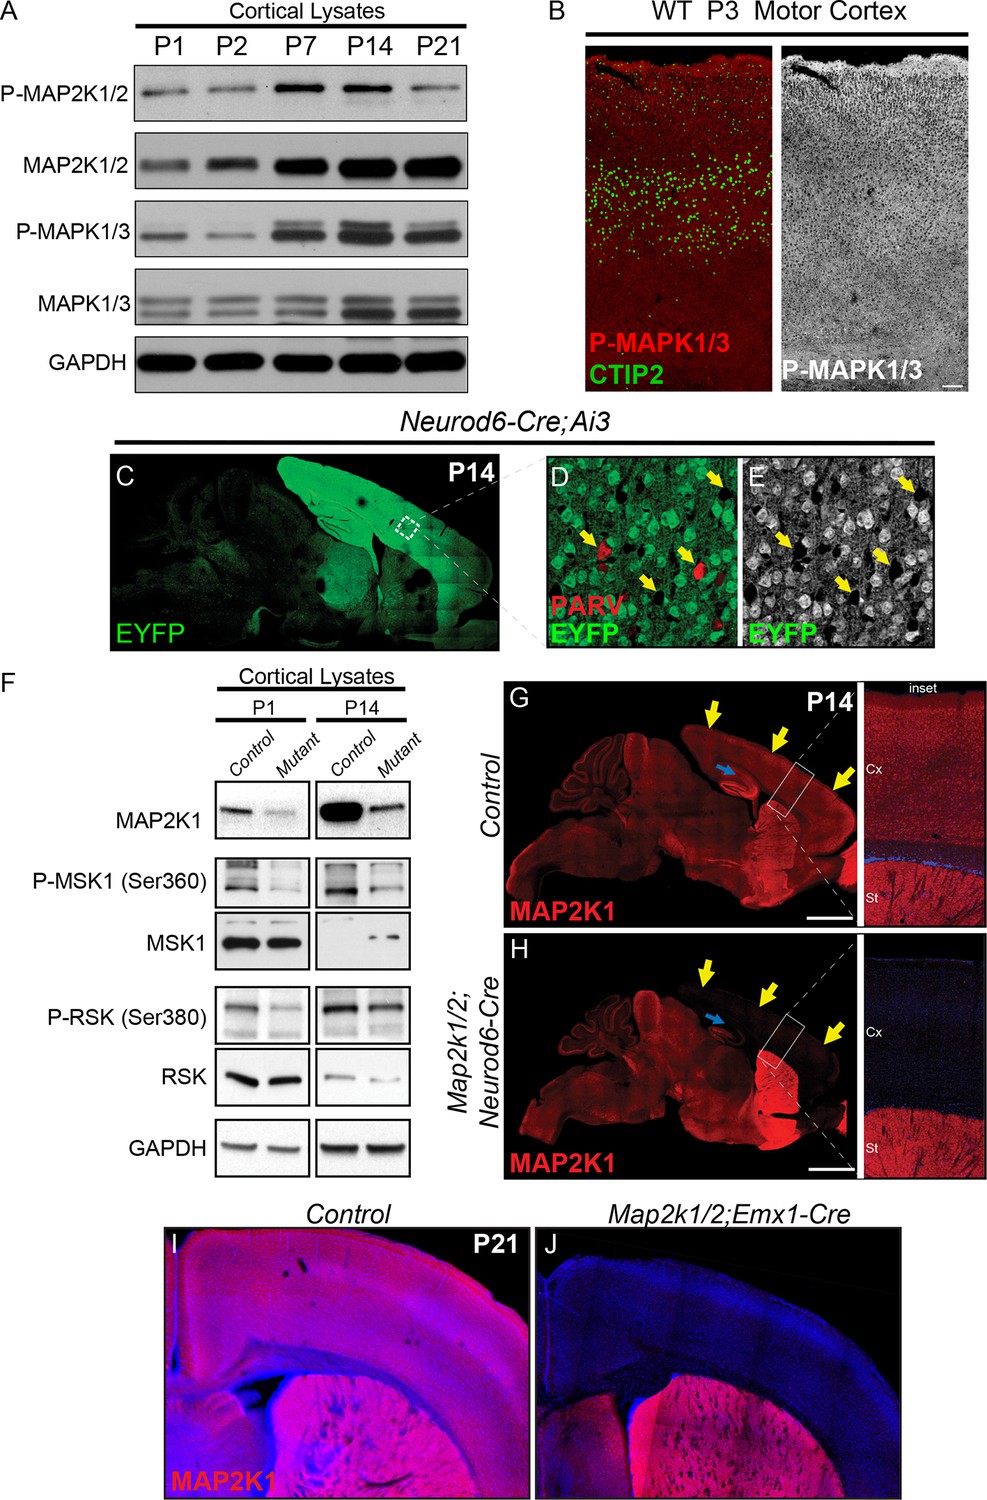
Developmental changes in ERK/MAPK activity and mouse models for loss of ERK/MAPK signaling in cortical excitatory neurons.
(A) Whole cortical lysates show significant changes in the expression and phosphorylation of ERK/MAPK components, MAP2K1/2 and MAPK1/3(ERK1/2), during the first three weeks of postnatal development (n=3). (B) Immunofluorescent staining reveals the ubiquitous distribution of activated, phospho-MAPK1/3(ERK1/2) in all cortical layers in P2-3 mouse sensorimotor cortices. (n=3, scale bar=200 µm) (C–E) Neurod6-Cre induces recombination of the Cre dependent EYFP reporter, Ai3, in postmitotic excitatory neurons throughout the cortex as shown here in P14 (C) sagittal brain sections. Parvalbumin expressing GABAergic interneurons (D, arrows) do not exhibit EYFP expression (E), further demonstrating the specificity of recombination in excitatory neurons. (F) P1 and P14 Map2k1/2;Neurod6-Cre cortices show pronounced loss of MAP2K1 expression and reduced phosphorylation of ERK/MAPK pathway substrates, RSK and MSK (n=5). (G–H) Representative confocal images of P14 control mouse brains show that cortical excitatory neurons in the cortex and hippocampus exhibit a high level of MAP2K1 immunolabeling (G). MAP2K1 levels are profoundly reduced in the cortex (yellow arrows) and hippocampal subfields CA1-CA3 (blue arrow) in P14 Map2k1/2;Neurod6-Cre mice (H) (n=6, scale bar=2 mm). (I–J) MAP2K1 expression is absent in the cortex of Map2k1/2;Emx1-Cre mice (J) when compared to P21 littermate control cortices (I) (n=3).
Figure 2 with 1 supplement
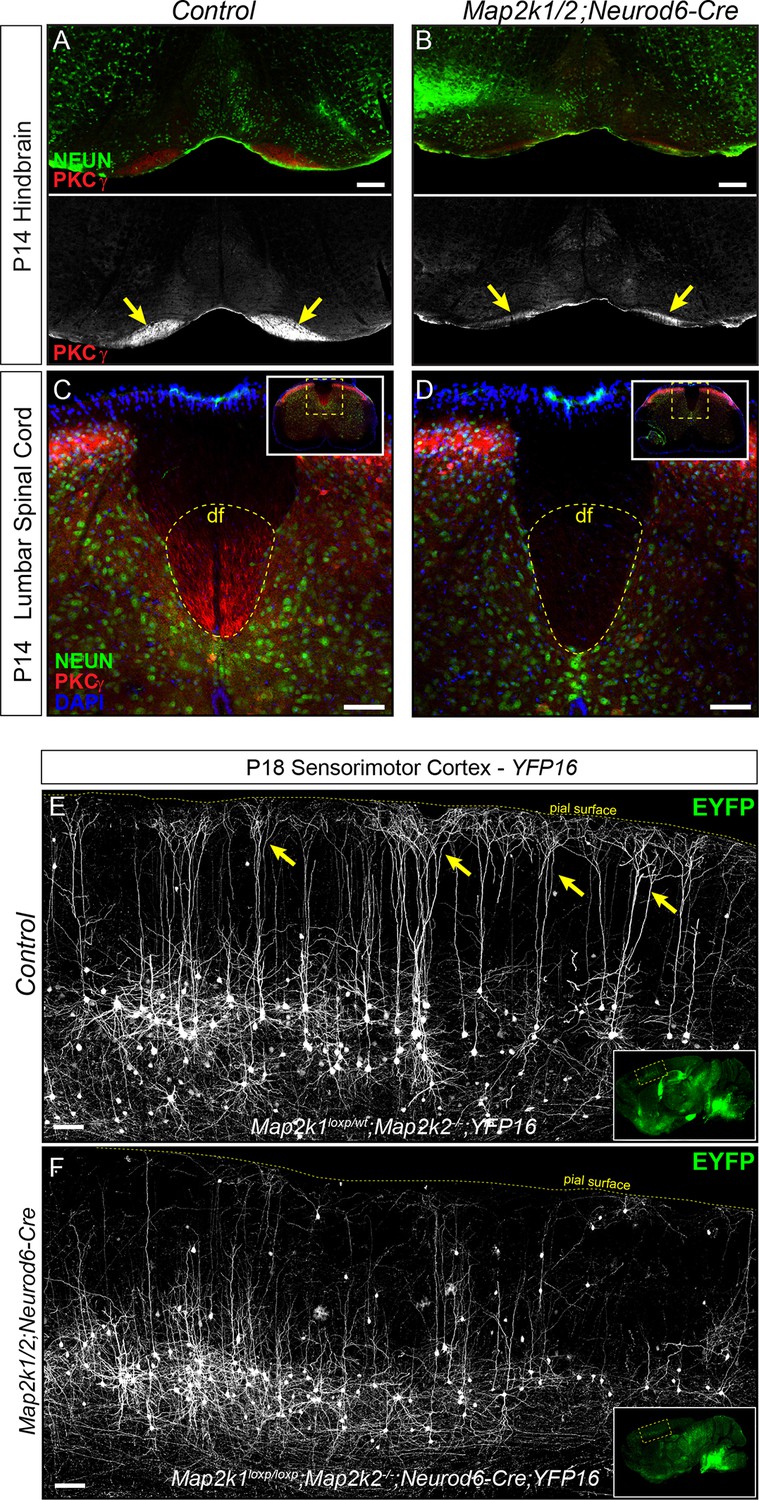
Corticospinal tract defects in Map2k1/2;Neurod6-Cre mice.
(A–D) To further evaluate the loss of layer 5 projection neurons, we examined the expression of a well-established corticospinal tract marker, PKCγ. Compared to control hindbrains (A) and spinal cords (C), a profound decrease in corticospinal tract labeling was observed in the Map2k1/2;Neurod6-Cre hindbrain (B-yellow arrows, scale bar=200 µm) and spinal cord (D), consistent with the reduced number of CTIP2+ layer 5 neurons (df=dorsal funiculus, n=3, scale bar=50 µm). (E–F) The Thy1-YFP reporter line, YFP16, labels a small fraction of layer 5 neurons in sensorimotor cortex. Many layer 5 neurons labeled in this line have large complex apical dendritic arbors (yellow arrows) that are consistent with the known morphology of subcerebral projection neurons, including corticospinal neurons. EYFP expressing neurons heavily branch in layer 1 as shown in representative confocal images of sagittal sections from P18 control mice (E, yellow arrows). In Map2k1/2;Neurod6-Cre cortices, we noted a significant reduction in the number of EYFP labeled neurons in layer 5 with complex apical dendritic arbors (F) (n=3, scale bar=100 µm).
-
Figure 2—source data 1
Reduced expression of layer 5 neuron markers following loss of Map2k1/2.
(A) Gene expression profiling of RNA extracts from the cortex of control and Map2k1/2;Neurod6-Cre mice collected at P9 (n=2) and P14 (n=3) revealed significantly diminished expression (fold change>1.5 and p<0.05) of many genes that are known to be expressed in layer 5 neurons (red filled boxes).
- https://doi.org/10.7554/eLife.11123.006
Figure 2—figure supplement 1
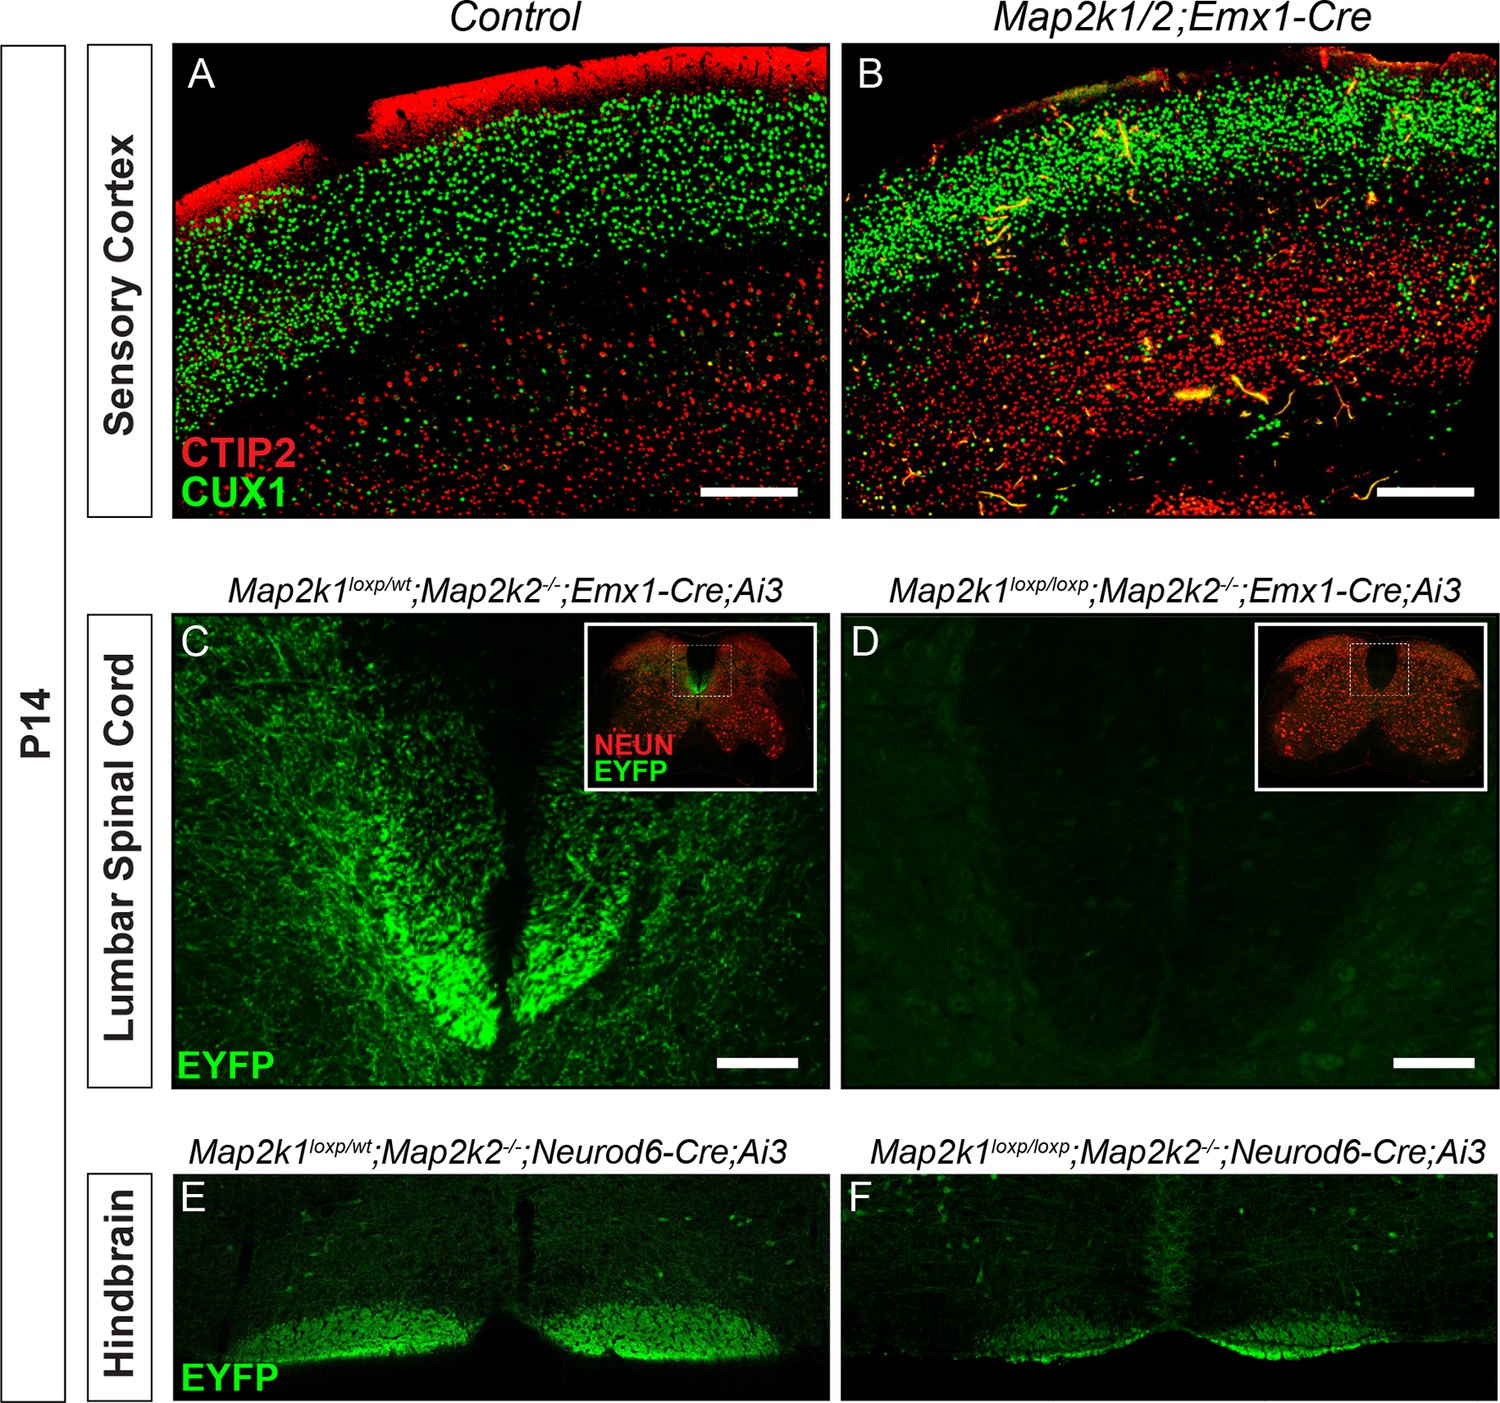
Reduced number of corticospinal neurons following loss of Map2k1/2.
(A–B) Similar to results with Neurod6-Cre mice, deletion of Map2k1/2 with Emx1-Cre also led to a disruption of CTIP2 labeling in layer 5 sensorimotor cortices in Map2k1/2;Emx1-Cre mice (B) when compared to controls (A) (n=3, scale bar=200 µm). (C–D) Visualization of the CST in spinal cord cross-sections of P14 Map2k1/2;Emx1-Cre;Ai3 mice revealed a near complete absence of corticospinal axons in the lumbar segment of the spinal cord compared to control (E) (n=3, scale bar=50 µm). (E–F) The size of the EYFP labeled CBT was reduced in P14 Map2k1/2;Neurod6-Cre;Ai3 hindbrains (F) when compared to controls (E) (n=3).
Figure 3 with 1 supplement
Layer 5 neuron corticospinal axon outgrowth requires ERK/MAPK signaling in vivo.
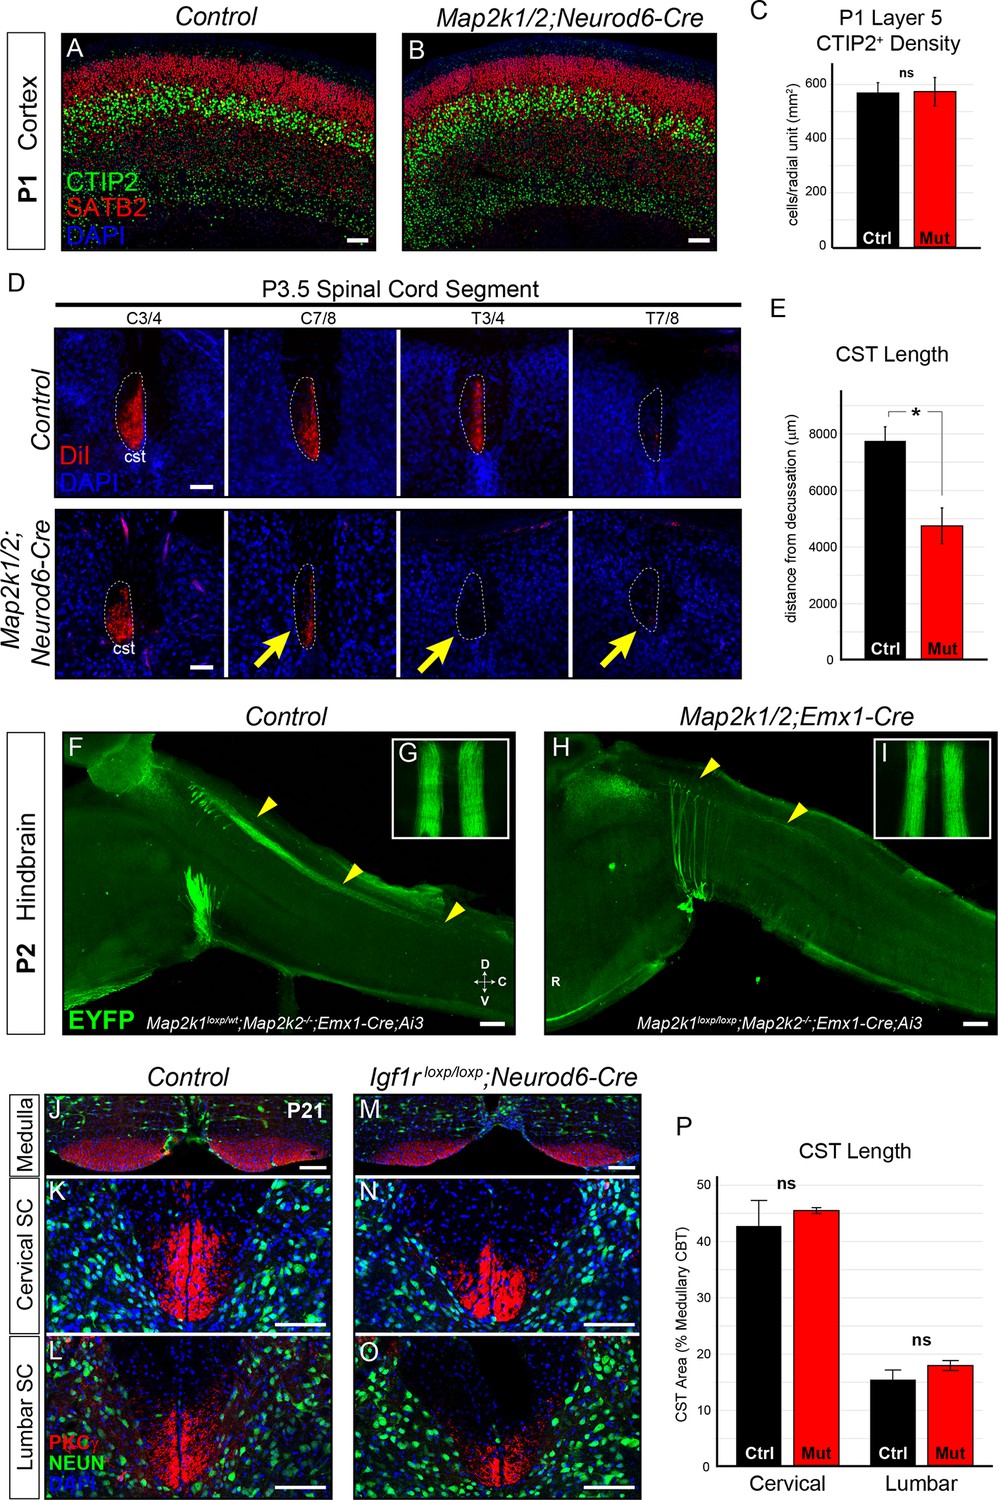
(A–C) Expression of a well-known master transcription factor for layer 5 neurons, CTIP2, was intact in cortical layer 5 as shown in representative confocal images of newborn control (A) and Map2k1/2;Neurod6-Cre (B) sensorimotor cortices (scale bar=50 µm). Quantitation of the number of CTIP2-expressing nuclei in cortical layer 5 (C) did not reveal a significant difference in CTIP2+ neuron density between control and mutant neonates (n=3, mean ± SEM, p=0.89). (D–E) In vivo DiI injections into the sensorimotor cortex of P0.5 control and Map2k1/2;Neurod6-Cre neonates were performed and mice were collected three days after injection. The extent of anterograde DiI labeling was analyzed in coronal sections through the spinal cord (D). We observed a significant decrease in the extent of corticospinal (cst) elongation in mutant mice, especially in the lower cervical/thoracic spinal cord segments (yellow arrows in D) (n=3, scale bar=100 µm). Quantitation of CST length relative to the medullary decussation revealed a significant decrease in corticospinal axon growth in mutant spinal cords (E) (n=3, mean ± SEM, *p=0.02). (F–I) The initial stages of corticospinal elongation in the dorsal spinal cord can be visualized in sagittal sections of the caudal medulla and rostral spinal cord from P2 Emx1-Cre;Ai3 mice. Immunoenhancement of the Ai3 reporter with an EGFP antibody clearly shows that the caudal extension of corticospinal axons (yellow arrowheads) is profoundly reduced in P2 Map2k1loxp/loxp;Map2k2-/-;Emx1-Cre;Ai3 mutant mice (H) when compared to Map2k1loxp/wt;Map2k2-/-;Emx1-Cre;Ai3 controls (F) (n=3, scale bar=200 µm). Whole mount visualization of the CST coursing through the ventral medulla in control (G) and mutant (I) hindbrains did not reveal an overt difference in corticospinal growth (n=3). (J–P) Compared to control mice (J–L), Neurod6-Cre mediated deletion of Igf1r did not alter the relative area of PKCγ labeling in the cervical (K, N, P) or lumbar (L, O, P) CST compared to the medullary CBT (J, M) in mutant mice (M–O) at P21 (n=3, scale bar=50 µm).
Figure 3—figure supplement 1
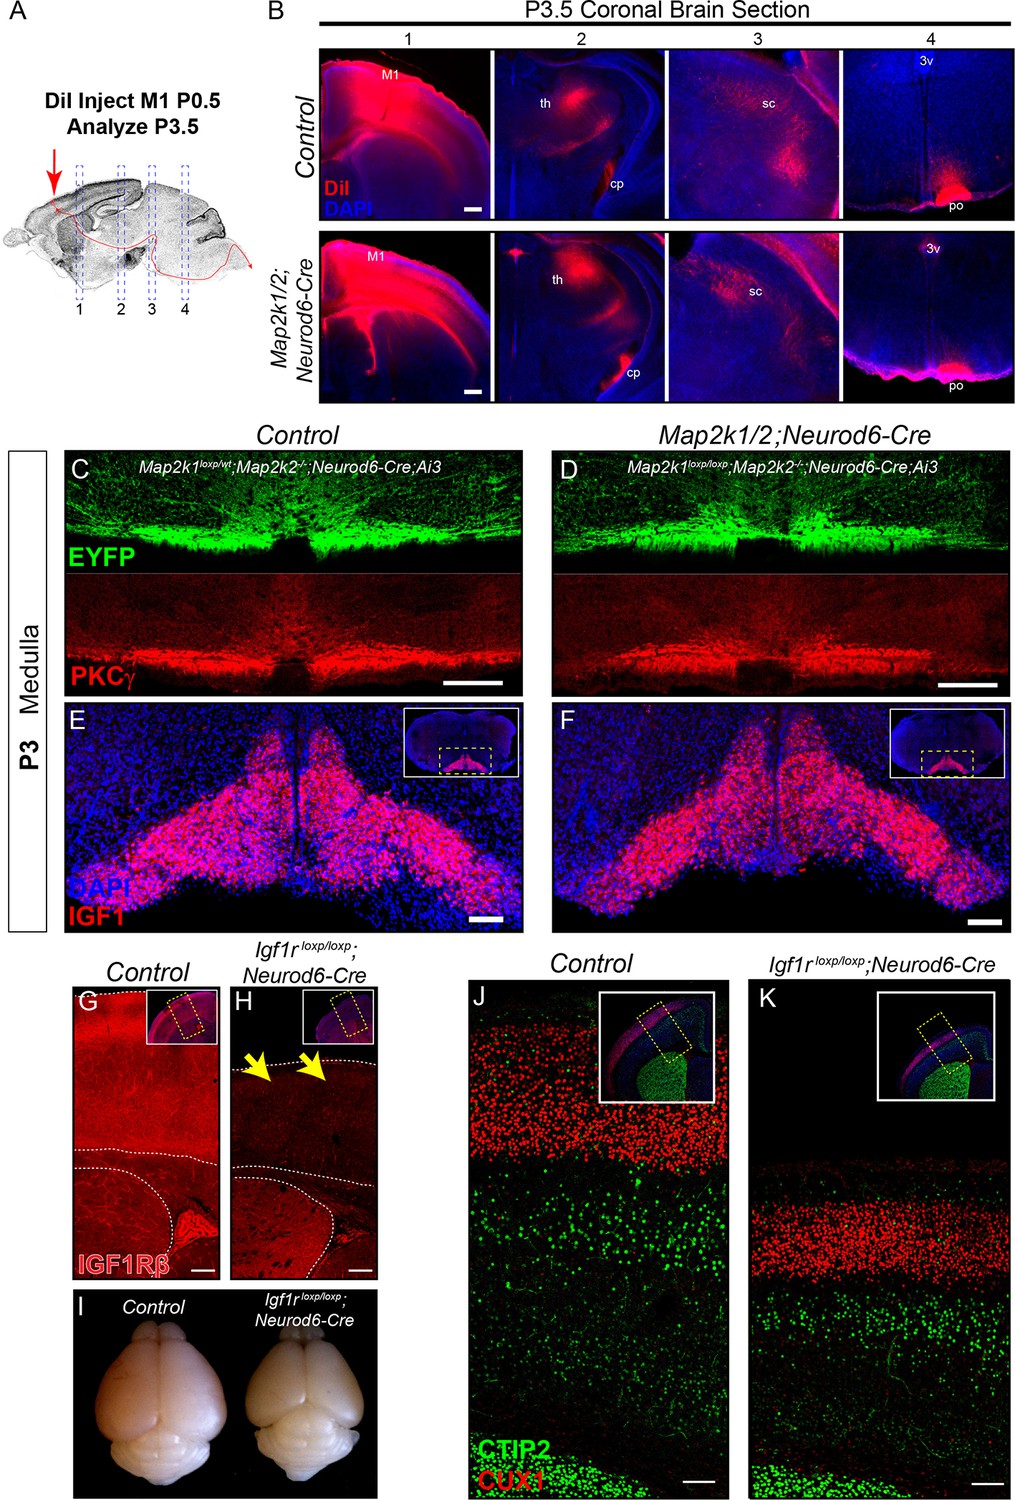
The rostrocaudal elongation of layer 5 axons in the spinal cord requires ERK/MAPK, but not IGF1R, signaling.
(A–B) In vivo DiI injections into the sensorimotor cortex were performed in P0.5 control and Map2k1/2;Neurod6-Cre neonates to label subcortical projection neuron afferents (A). Mice were collected three days after injection and the extent of DiI labeling in multiple subcortical targets was analyzed in coronal sections through the brain (B). A substantial difference in the innervation of the thalamus (th), cerebral peduncle (cp), superior colliculus (sc), or pons (po) was not detected in mutants (B) (n=3, scale bar=100 µm). C-D. Cross sections through the medulla were labeled with EYFP and PKCγ in P3 control (C) and Map2k1/2;Neurod6-Cre;Ai3 mutant (D) hindbrains. No overt change in CST size was detected in mutant mice, providing evidence that cortical layer 5 axon outgrowth to the hindbrain does not require ERK/MAPK signaling (n=3, scale bar=100 µm). (E–F) At P3, IGF1 expression is high in the inferior olive adjacent to the location of the developing CST in control neonates (E). Map2k1/2;Neurod6-Cre mutants did not exhibit a qualitative difference in IGF1 expression (F) (n=3, scale bar=100 µm). (G–K) A substantial loss of IGF1Rβ protein expression (yellow arrows) was observed in the developing cortex of Igf1rloxp/loxp;Neurod6-Cre mutant mice (H) when compared to controls (G) (scale bar=200 µm). The loss of IGF1R signaling led to a relatively reduced brain size when compared to P7 littermates (I), but had no effect on the expression of CTIP2 or CUX1 in the sensorimotor cortex of Igf1rloxp/loxp;Neurod6-Cre mutants (K) relative to controls (J) (n=3) (scale bar=100 µm).
Figure 4
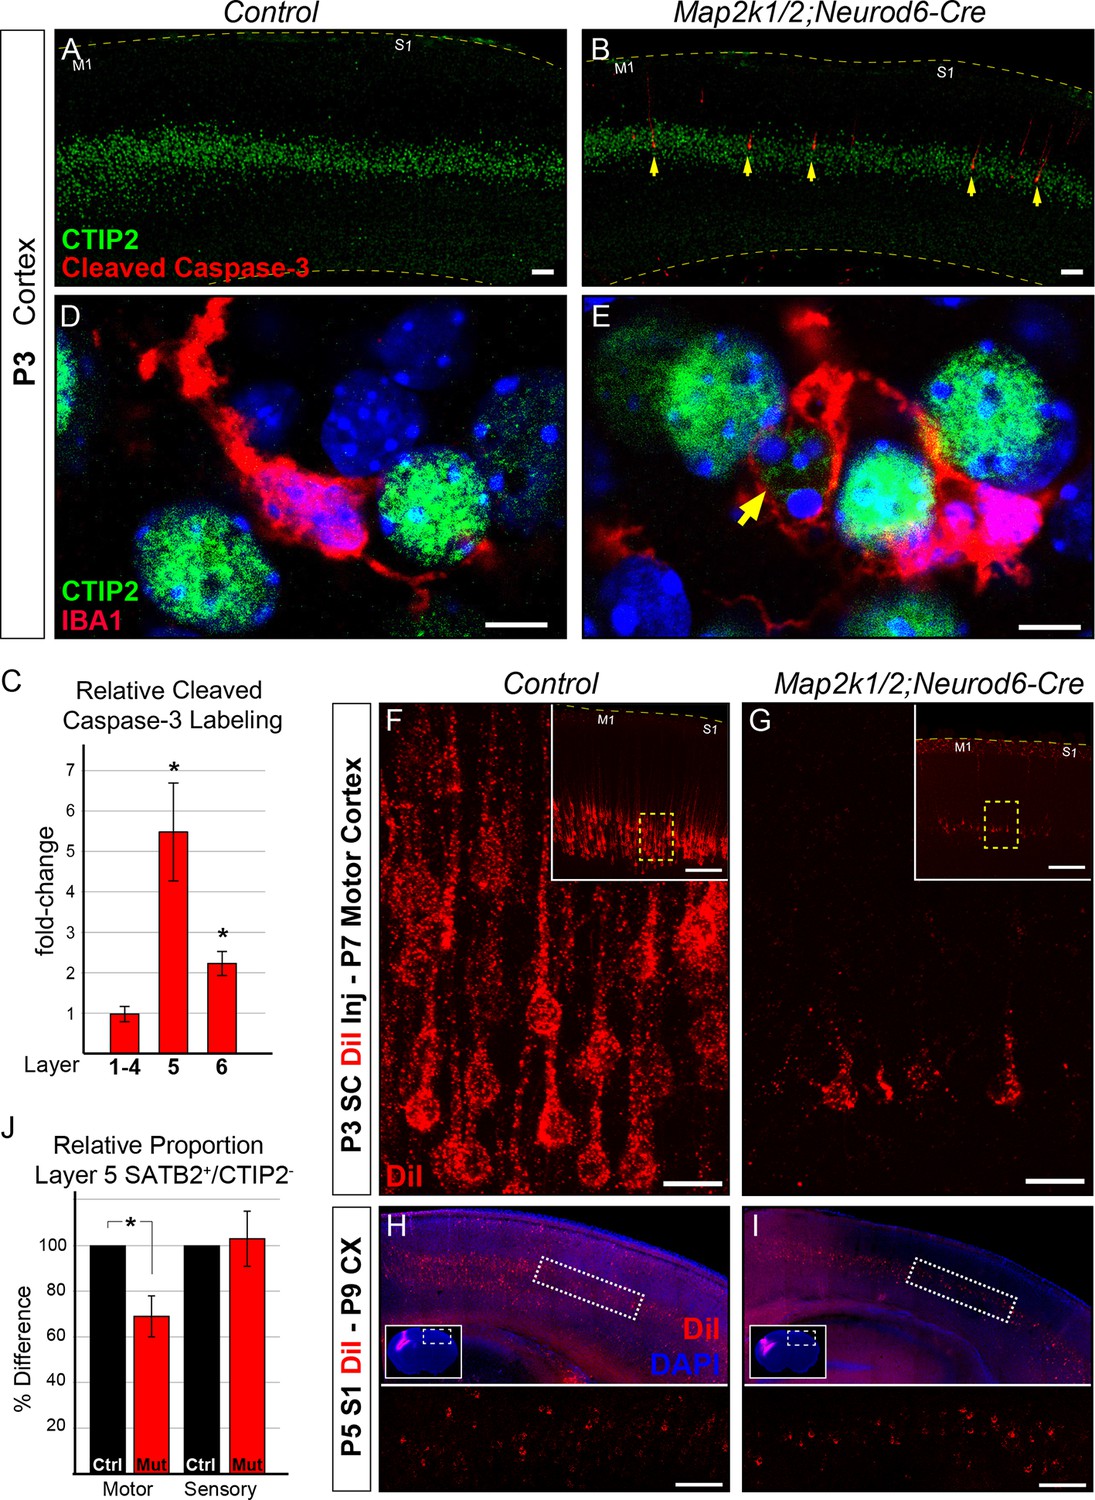
Initiation of layer 5 neuron death by P3 in Map2k1/2;Neurod6-Cre mutants.
(A–B) Representative confocal images of immunolabeling for cleaved activated caspase-3, a well-known marker of neuronal apoptosis in P3 control (A) and Map2k1/2;Neurod6-Cre (B) sensorimotor cortices. Note the extensive increase in the number of activated caspase-3+ cells co-labeled with CTIP2 in layer 5 of mutant cortices (B, yellow arrows) (n=4, scale bar=50 µm). (C) Quantification of activated caspase-3+ cells in upper layers (layer 1–4), layer 5 (CTIP2+) and layer 6 revealed a pronounced elevation in the number of apoptotic cells in layer 5 in P3 Map2k1/2;Neurod6-Cre mice relative to controls. The numbers of activated caspase-3+ cells are comparable in upper layers and doubled in layer 6 relative to controls. (n=4, mean ± SEM, * p<0.05) D-E. Relative to controls (D), many microglia (IBA1+) were observed with processes surrounding CTIP2 labeled neurons in layer 5 of mutant cortices (E) (n=3, scale bar=5 µm). F-G. Retrograde labeling of corticospinal neurons at P3 via DiI injection into the cervical spinal cord revealed a substantial reduction in the number of DiI labeled neuronal bodies in mutant (G) sensorimotor cortices at P7 when compared to controls (F) (n=3, scale bar=20 µm). (H–I) Retrograde labeling of layer 5 neurons that project into the contralateral hemisphere by injection of DiI in contralateral cortices, did not reveal an obvious loss in mutant (I) mice when compared to controls (H) (n=3, scale bar=100 um). (J) Quantification of the relative number of layer 5 SATB2+/CTIP2- neurons as a proportion of the total number of NEUN+ neurons in a cortical column revealed a substantial decrease in motor, but not sensory, cortices in mutant mice (n=3, mean ± SEM, *p=0.003).
Figure 5 with 1 supplement
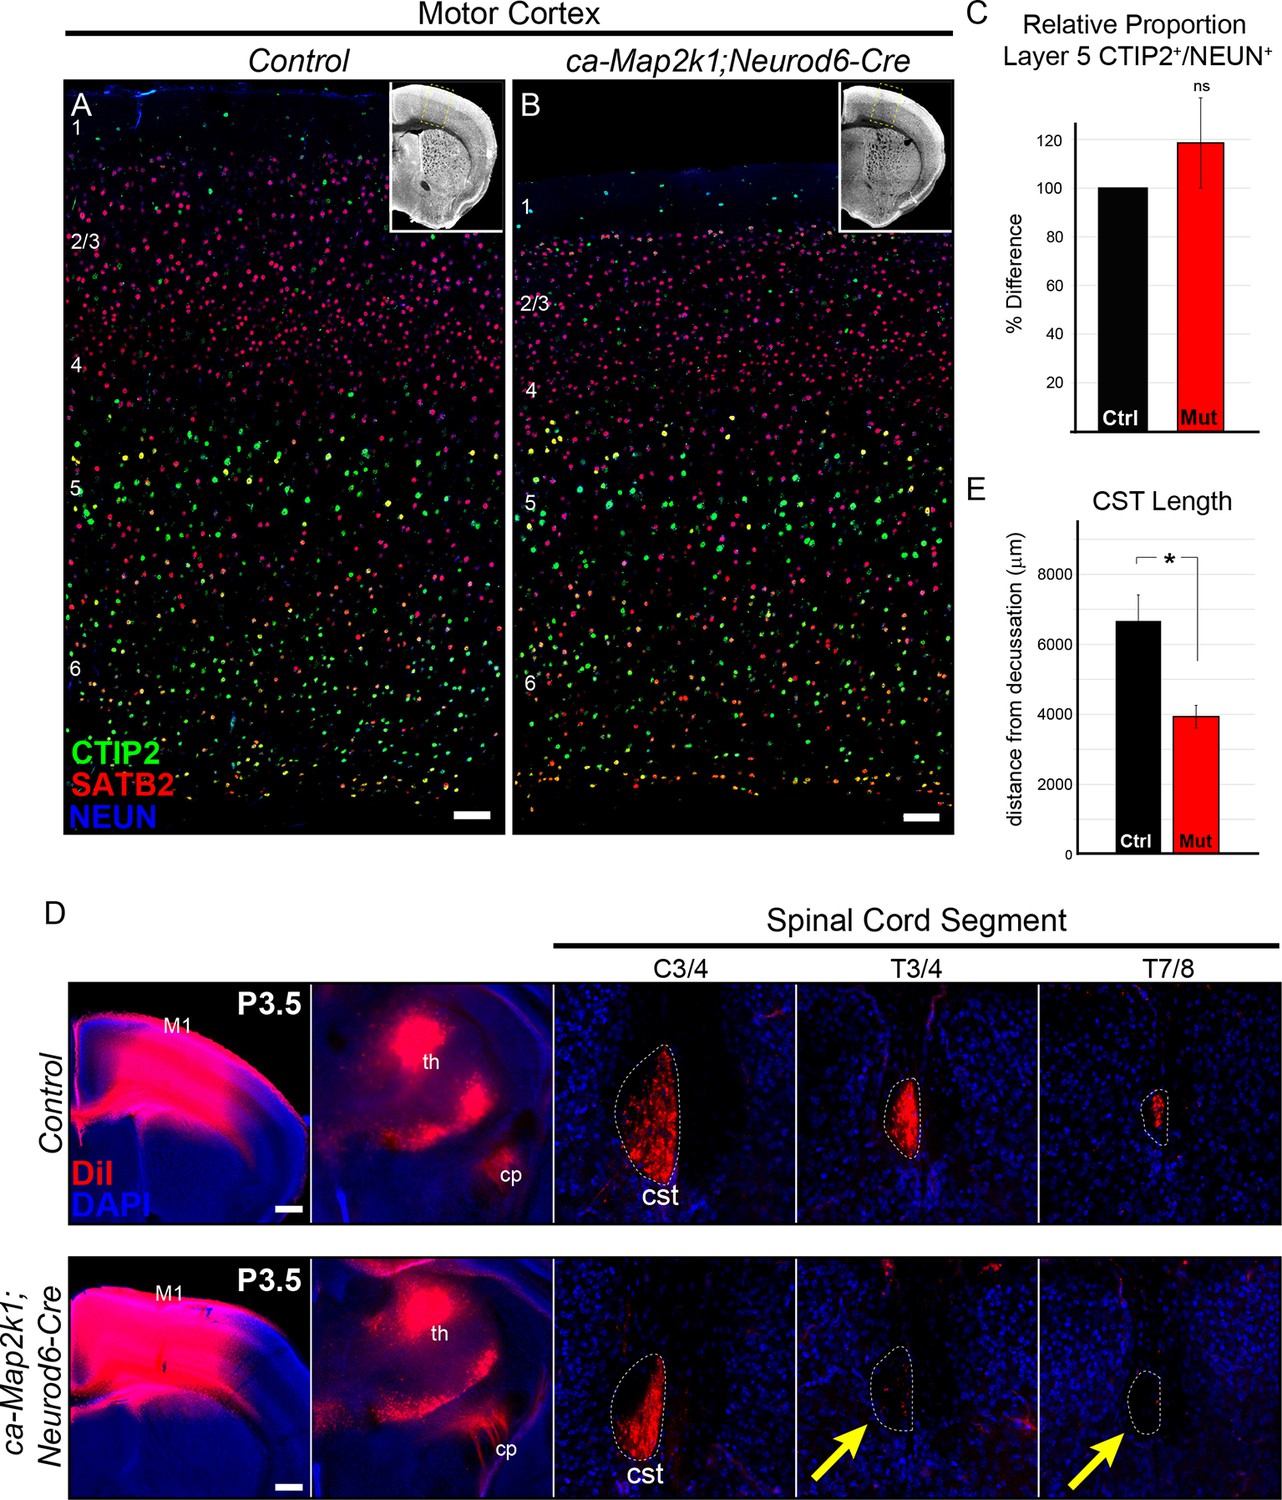
Gain of function ERK/MAPK signaling in ca-Map2k1;Neurod6-Cre mice decreases corticospinal extension into the spinal cord.
(A–C) Representative confocal images of sensory cortices show that the expression and distribution of the callosal projection neuron marker, SATB2, and subcerebral projection neuron marker, CTIP2, in ca-Map2k1;Neurod6-Cre forebrains (B) appears normal when compared to littermate controls (A) (n=4, scale bar=100 µm). The relative proportion of CTIP2+ layer 5 neurons as a percentage of NEUN+ neurons within a radial unit did not show a significant difference between adult mutant and control motor cortices (C) (n=3, mean ± SEM, p=0.2). (D–E) In vivo DiI injections into P0 neonates were performed to label corticospinal axons during initial stages of elongation into the spinal cord (D). Analysis of DiI labeling in the spinal cord dorsal funiculus at P3 revealed a significant decrease in the extent of axonal elongation in mutant spinal cords relative to controls (E) (n=3, mean ± SEM, *p=0.033, scale bar=100 µm).
Figure 5—figure supplement 1
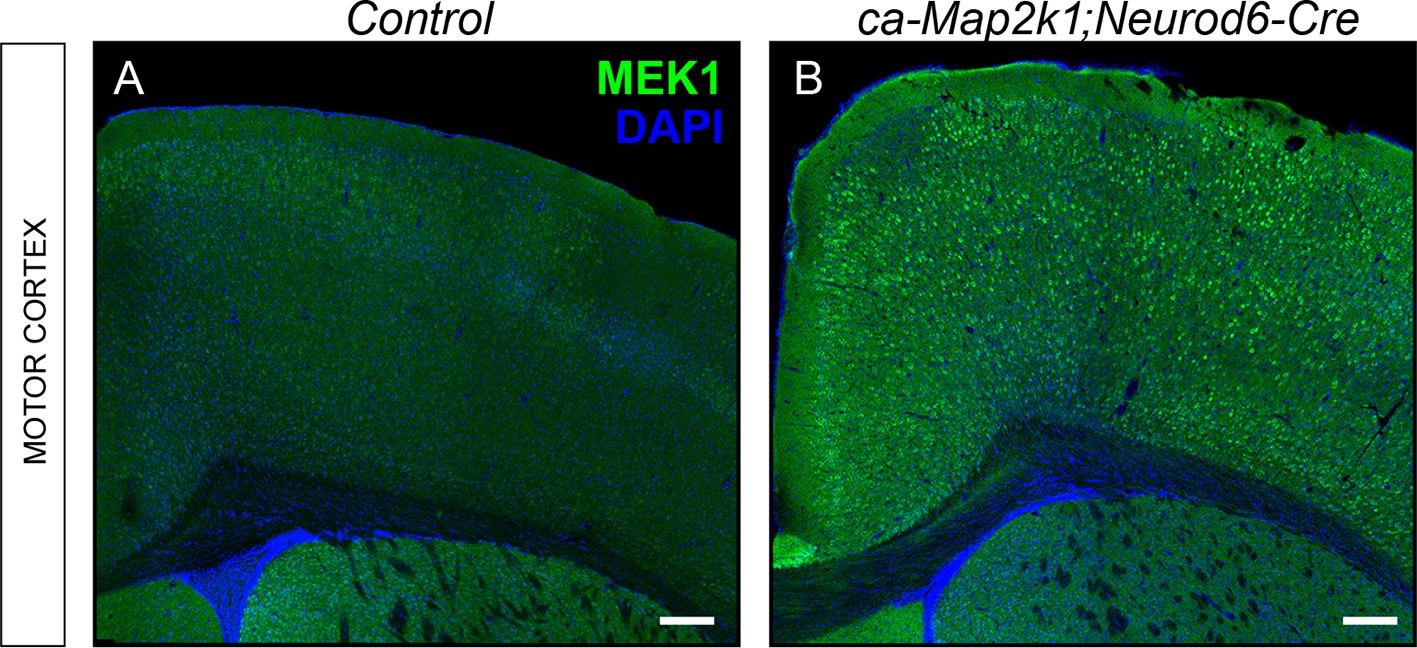
Mouse model for excitatory neuron specific gain-of-ERK/MAPK signaling in the cortex.
(A–B) Representative confocal images of forebrain sections from controls (A) and ca-Map2k1;Neurod6-Cre mutants (B) demonstrate that the expression of MAP2K1 is substantially higher in excitatory neurons across all layers of the cortex, but not in the striatum (n=4, scale bar=100 µm).
Figure 6 with 1 supplement

Hyperactivation of ERK/MAPK enhances axonal branching in the hindbrain and spinal cord.
(A–J) AAV5-FLEX-tdTomato injections into control (Neurod6-Cre) and ca-Map2k1;Neurod6-Cre motor cortices at P1 (inset in A–B) results in labeling of subcerebral axon projections in P30 hindbrains (A–F) and spinal cords (G–L). To measure axonal elongation from the hindbrain to spinal cord, high resolution confocal images of the extent of axonal labeling in sections of the hindbrain corticobulbar tract (cbt, C–D) and brachial spinal cord corticospinal tract (cst, I–J) were collected and compared. The ratio of corticospinal to corticobulbar tract axonal labeling was significantly decreased in ca-Map2k1;Neurod6-Cre mutants (M), providing further evidence for a reduction in corticospinal axon elongation at P30 (n=3, mean ± SEM, *p<0.01, scale bar=500 µm). The extent of axonal branching was measured by comparing the amount of axonal labeling in the hindbrain (A–B, zoom in E–F) or spinal cord grey matter (G–H, zoom in K–L), to the amount of axonal labeling in the corresponding white matter tract, the CBT (C–D) or CST (I–J), respectively. We observed a significant increase in the relative ratio of grey/white matter labeling in ca-Map2k1;Neurod6-Cre mutant hindbrains (n=4, mean ± SEM, *p<0.05) and spinal cords (n=3, mean ± SEM, *p<0.05) when compared to controls (N).
Figure 6—figure supplement 1
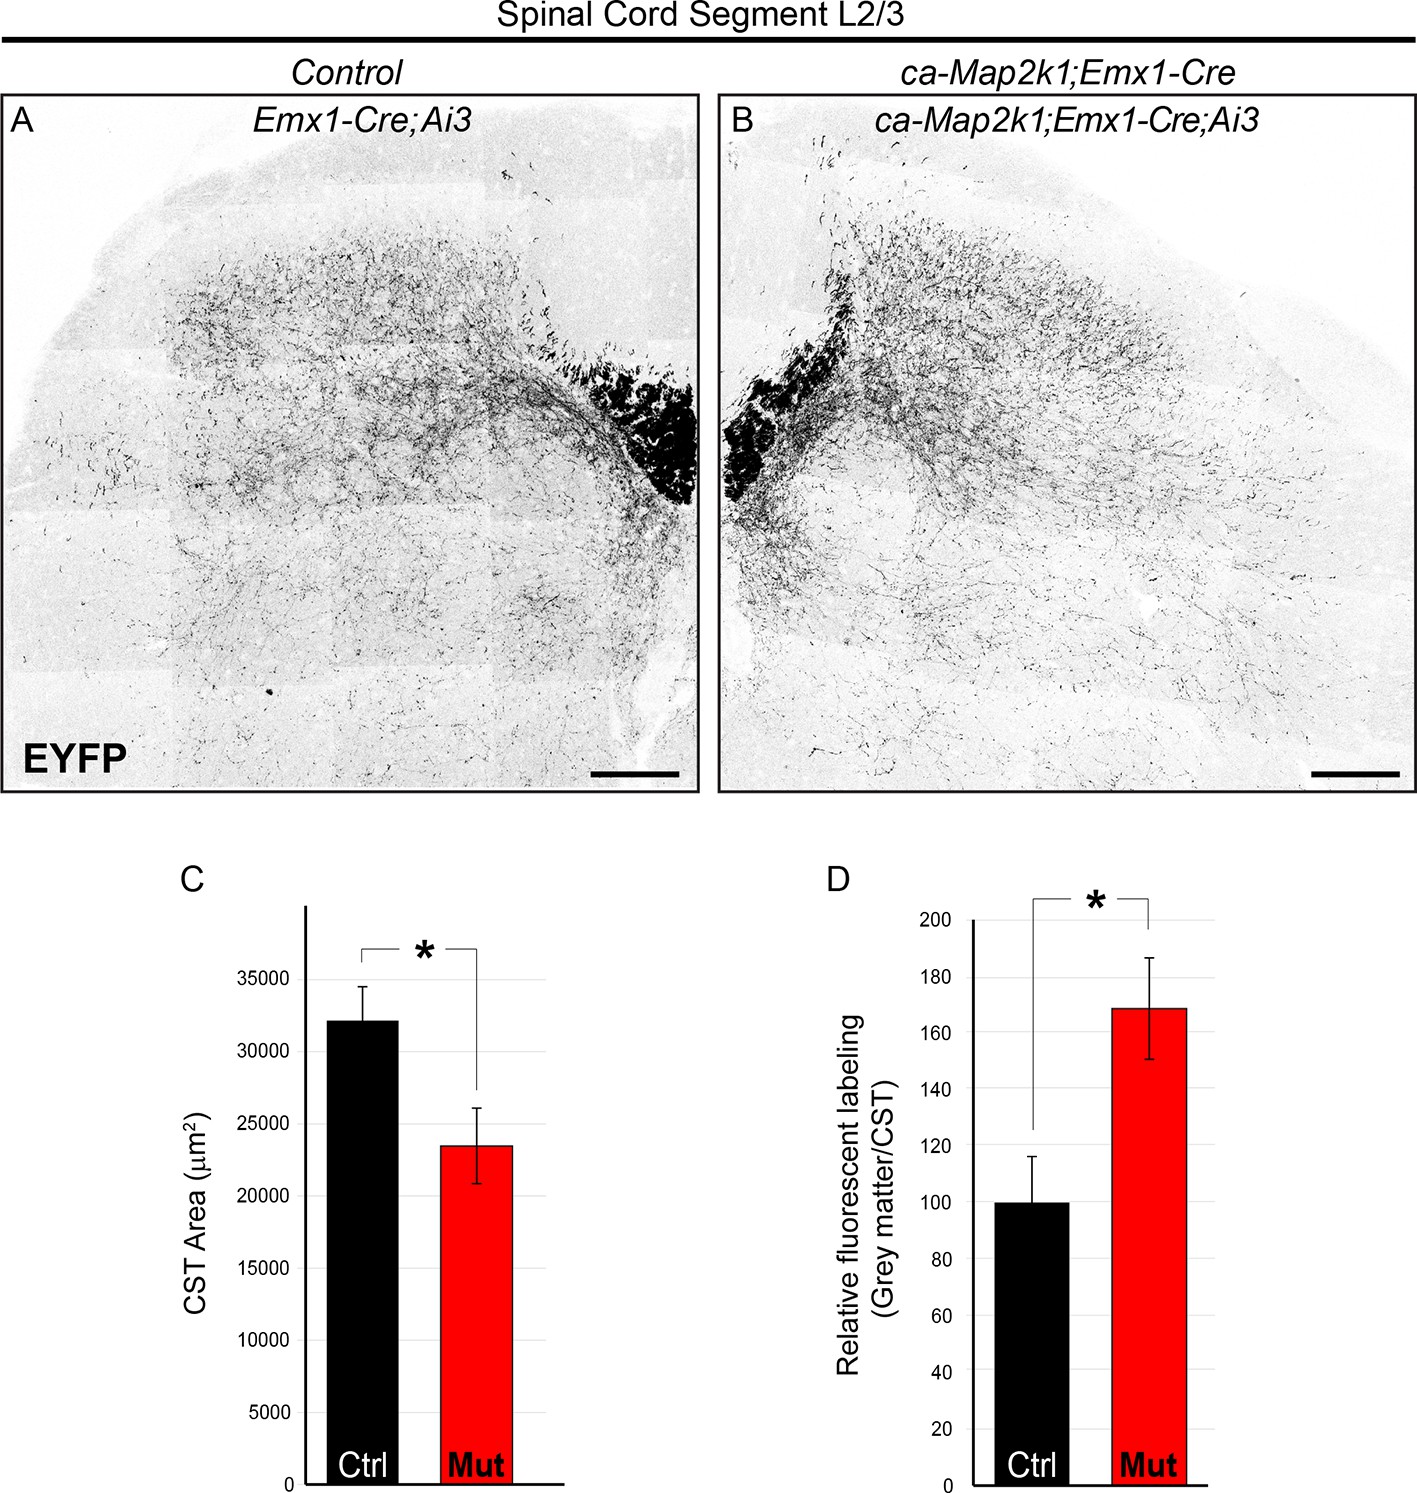
ca-Map2k1;Emx1-Cre mice exhibit alterations in the pattern of corticospinal outgrowth in the spinal cord similar to ca-Map2k1;Neurod6-Cre mutants.
(A–D) The entire pattern of corticospinal branching can be visualized in Emx1-Cre;Ai3 mice. P30 ca-Map2k1;Emx1-Cre;Ai3 mice showed a significant reduction in the area of corticospinal labeling in the white matter of lumbar spinal cord segments (B and C) when compared to Emx1-Cre;Ai3 controls (A and C) (n=4, mean ± SEM, *p=0.01, scale bar=100 µm). When the amount of fluorescent labeling in the grey matter relative to the white matter was assessed (D), mutant mice exhibited an increased extent of axonal branching per axon (n=4, mean ± SEM, *p=0.001).
Figure 7 with 1 supplement
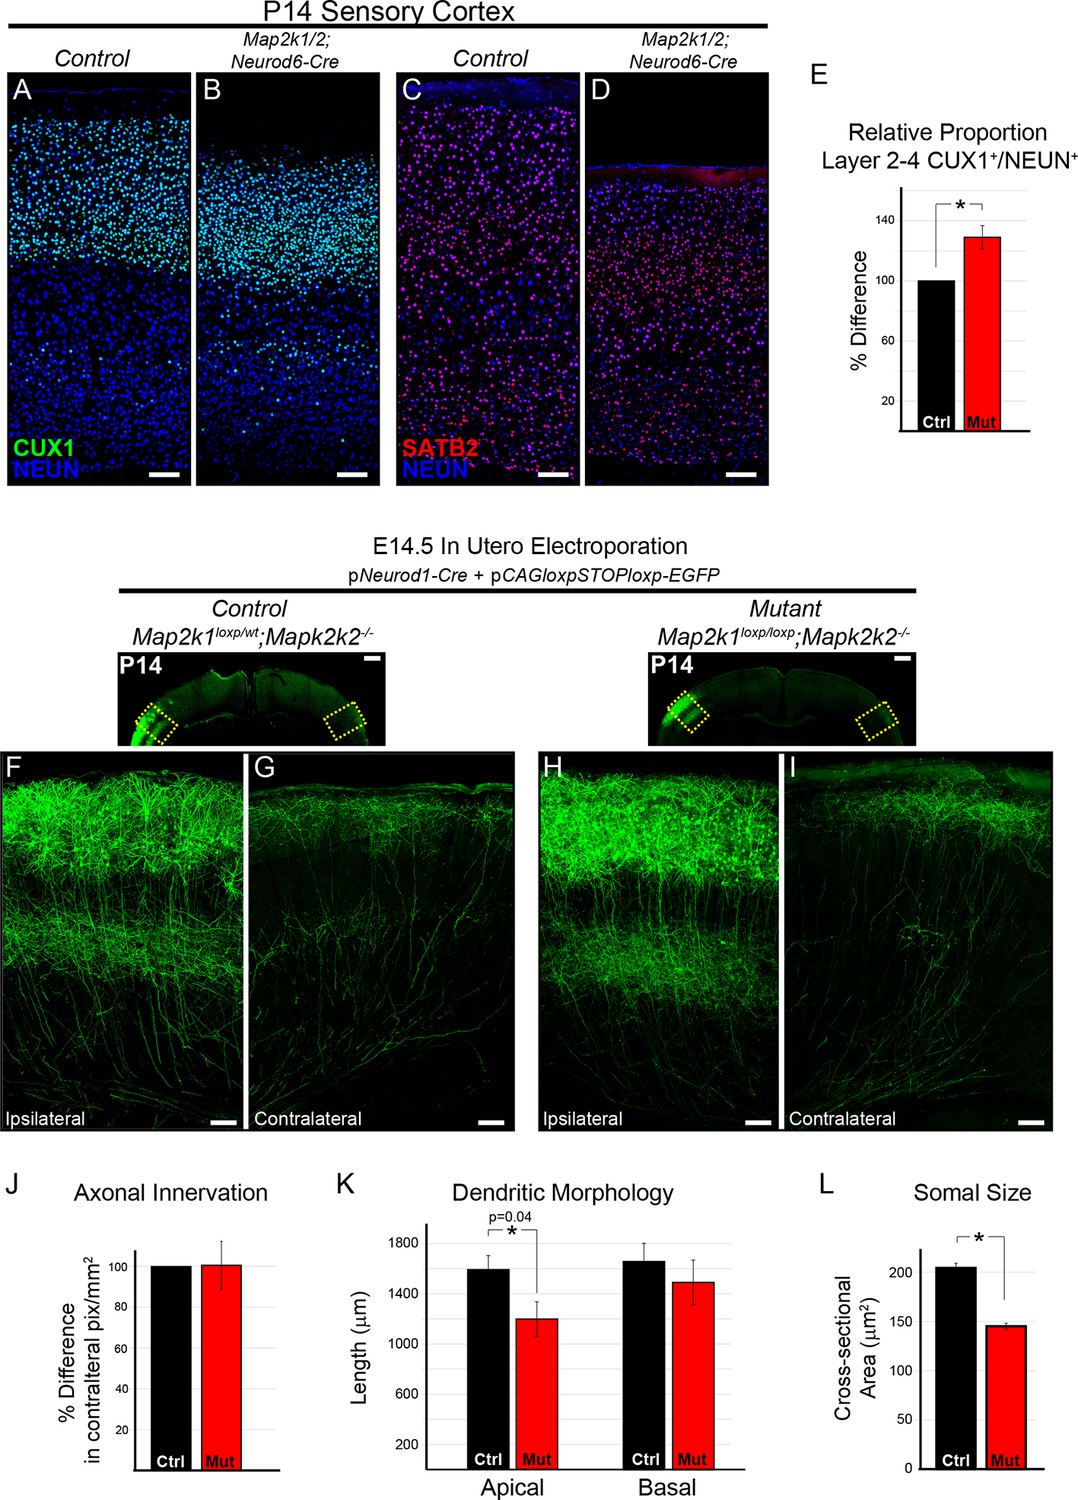
The differentiation and morphology of callosal projecting neurons in layer 2/3 does not require ERK/MAPK signaling during development.
(A–E) Analysis of intracortical neuron markers, CUX1 (A–B) and SATB2 (C–D), from confocal images of P14 control (A, C) and Map2k1/2;Neurod6-Cre (B, D) sensory cortices did not reveal significant differences in overall expression. (E) Quantitation of the proportion of CUX1 labeled neurons in layer 2–4 as a percentage of NEUN labeled neurons in a radial unit was not decreased in mutant mice when compared to controls (n=3, mean ± SEM, *p=0.033, scale bar = 100 µm). (F–L) Cell autonomous deletion of Map2k1/2 and labeling of a subset of layer 2/3 cortical neurons through unilateral in utero electroporation (IUEP) of pNeurod1-Cre and ploxp-STOP-loxpEGFP into the E14.5 ventricular zone. Following IUEP, coronal forebrain sections from electroporated P14 Map2k1wt/loxp;Map2k2-/-control (F–G) and Map2k1loxp/loxp;Map2k2-/- mutant (H–I) mice were immunostained for EGFP. Representative two-dimensional projections of confocal Z-stack images of EGFP-labeled layer 2/3 neuron bodies and dendrites in the electroporated hemisphere (F, H) and associated callosally projecting axons in the contralateral hemisphere (G, I) are shown (scale bar=50 µm). (J) The extent of axonal innervation was assessed by quantifying the number of labeled pixels within contralateral radial units. A significant difference in axonal innervation was not detected following loss of ERK/MAPK signaling (n=3, mean ± SEM, p=0.97). K. High resolution confocal Z-stacks of EGFP expressing layer 2/3 neurons were collected from control and mutant sections. Reconstruction and analysis of randomly selected layer 2/3 neurons show that the length of apical dendritic arbors was modestly reduced in Map2k1/2 deleted layer 2/3 neurons (K) (n=10 control and 11 mutant neurons, mean ± SEM, p=0.04). No significant effect on basal dendrite length was detected in mutant neurons (mean ± SEM, p=0.625). (L) Somal size assessment revealed a substantial decrease in the cross sectional size of EGFP labeled layer 2/3 neuron cell bodies following IUEP mediated Map2k1/2 deletion (n>100 neurons per condition, mean ± SEM, *p<0.001).
Figure 7—figure supplement 1
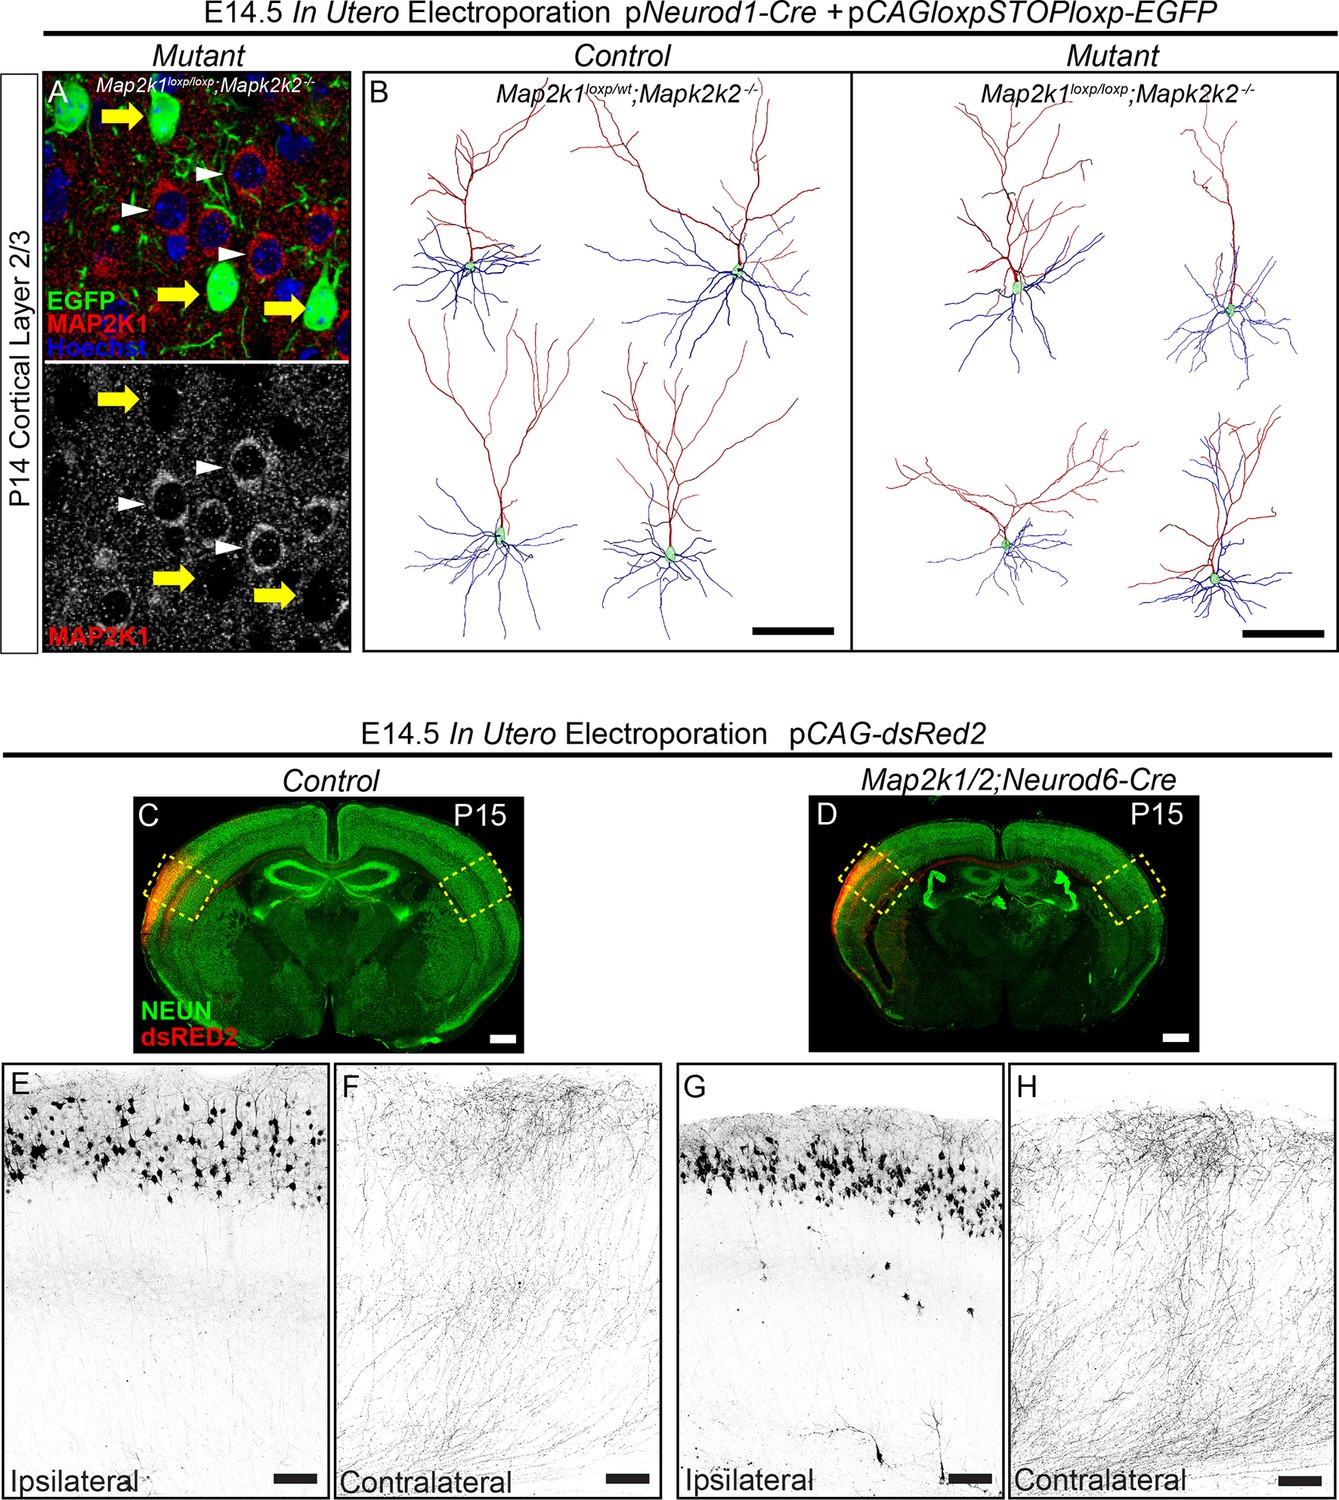
ERK/MAPK signaling is dispensable for the differentiation and axonal morphology of callosal projection neurons in layer 2/3.
(A–B) Co-in utero electroporation (IUEP) of pNeurod1-Cre and ploxp-STOP-loxp-EGFP plasmids into E14.5 control (Map2k1loxp/wt;Map2k2-/-) and mutant (Map2k1loxp/loxp;Map2k2-/-) embryonic ventricles results in layer 2/3 neuron autonomous Map2k1/2 deletion and fluorescent labeling of excitatory neuron dendrites and axons. A. Immunohistochemical detection of MAP2K1 and EGFP expression in cortical layer 2/3 neurons of P14 Map2k1loxp/loxp;Map2k2-/- mice that were electroporated at E14.5 with pNeurod1-Cre and ploxp-STOP-loxpEGFP plasmids. Note the substantial loss of MAP2K1 expression in EGFP labeled mutant pyramidal neurons (yellow arrows) when compared to unlabeled control excitatory neurons (white arrowheads). (B) Representative neurolucida reconstructions of layer 2/3 neurons from P14 control (Map2k1loxp/wt;Map2k2-/-) and mutant (Map2k1loxp/loxp;Map2k2-/-) cortex following electroporation with pNeuroD-Cre and ploxp-STOP-loxpEGFP at E14.5 (scale bar=100 µm). (C–I) IUEP of pCAG-dsRed2 into E14.5 control and Map2k1/2;Neurod6-Cre mutant embryos leads to fluorescent labeling of layer 2/3 cortical neurons and callosal axons. P15 forebrain sections from control (C) and Map2k1/2;Neurod6-Cre mutant (D, scale bar=2 mm) mice were immunostained for NEUN and dsRED2. High resolution confocal images show that upper layer neurons were electroporated at similar efficiency in control (E) and mutant (G) forebrains and contralateral axon innervation is not different (F, H, scale bar = 50 µm).
Figure 8 with 1 supplement

ERK/MAPK signaling promotes ARC expression and reduces neuron excitability in layer 2/3 and 5 pyramidal neurons during development.
(A) Microarray profiling of whole cortical lysates detected a significant decrease in the expression of activity-dependent genes in P14 Map2k1/2;Neurod6-Cre mice compared to controls (n=3). (B) Western blotting of P14 control and Map2k1/2;Neurod6-Cre whole cortical lysates confirmed the decrease in ARC expression in mutant cortices (B) (n=3). (C-D) Immunostaining with an ARC antibody shows reduced expression across all cortical layers in P14 Map2k1/2;Neurod6-Cre mutants (D) when compared to controls (C) (n=3, scale bar=100 µm). (E–F) Average action potential frequency-current (F/I) curves recorded from layer 2/3 (E) and layer 5 (F) pyramidal neurons in acute slices of control and Map2k1/2;Neurod6-Cre sensory cortices. Recordings were performed in the presence of DNQX, APV, and picrotoxin to block all synaptic activity. Both layer 5 (n=16 control, 14 mutant neurons, mean ± SEM; F/I Slope t-test, p<0.0001) and layer 2/3 (n=14 control, 14 mutant neurons, mean ± SEM; F/I Slope t-test, p<0.0001) pyramidal neurons in Map2k1/2;Neurod6-Cre sensory cortices exhibited a marked increase in action potential firing frequency in response to increasing current injections. (G–H) Recordings of miniature excitatory postsynaptic currents in layer 2/3 pyramidal neurons from the visual cortex revealed a significant increase in the amplitude, but not frequency, of mEPSCs in neurons lacking Map2k1/2 (n=12 neurons of each genotype from three independent litters, mean ± SEM, t-test, p=0.0012) (G). In contrast, a substantial decrease in the frequency, but not amplitude, of mIPSCs from Map2k1/2;Neurod6-Cre neurons was observed (H) (n=12 neurons of each genotype, mean ± SEM, t-test, p=0.0002).
Figure 8—figure supplement 1
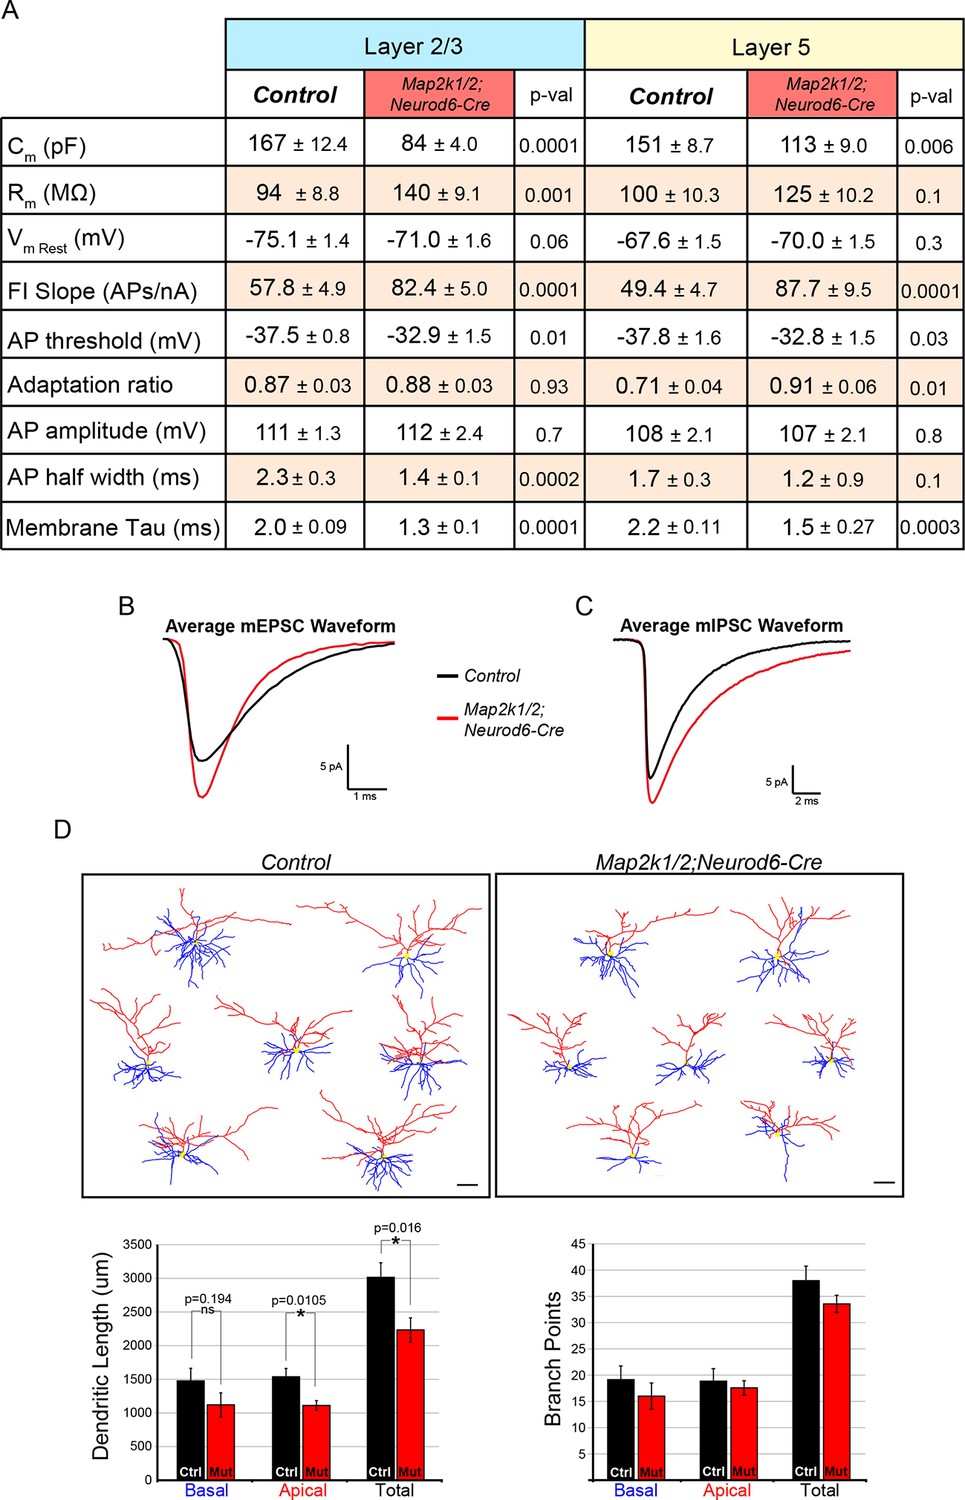
Loss of ERK/MAPK signaling leads to imbalanced excitatory and inhibitory synaptic drive in layer 2/3 neurons.
(A) Intrinsic membrane properties and action potential properties of layer 5 (n=16 control, 14 mutant neurons, mean ± SEM) and layer 2/3 (n=14 control, 14 mutant neurons, mean ± SEM) neurons measured in current clamp. (B–C) Average miniature postsynaptic current waveforms recorded from layer 2/3 pyramidal neurons in control (black) and mutant (red) visual cortices. (D) Morphological reconstructions of confocal Z-stack images of biocytin backfilled P14 control and Map2k1/2;Neurod6-Cre layer 2/3 neurons following electrophysiological recordings. Quantification of dendritic length shows a significant decrease in apical and total dendritic length in Map2k1/2;Neurod6-Cre layer 2/3 neurons, but no significant effect on basal dendritic length or branch points could be detected (n=7 neurons per condition from three independent litters, mean ± SEM, scale bar=50 µm).
Download links
A two-part list of links to download the article, or parts of the article, in various formats.
Downloads (link to download the article as PDF)
Open citations (links to open the citations from this article in various online reference manager services)
Cite this article (links to download the citations from this article in formats compatible with various reference manager tools)
Layer specific and general requirements for ERK/MAPK signaling in the developing neocortex
eLife 5:e11123.
https://doi.org/10.7554/eLife.11123


