cryo-EM structures of the E. coli replicative DNA polymerase reveal its dynamic interactions with the DNA sliding clamp, exonuclease and τ
- MRC Laboratory of Molecular Biology, United Kingdom
Figures
Figure 1 with 3 supplements
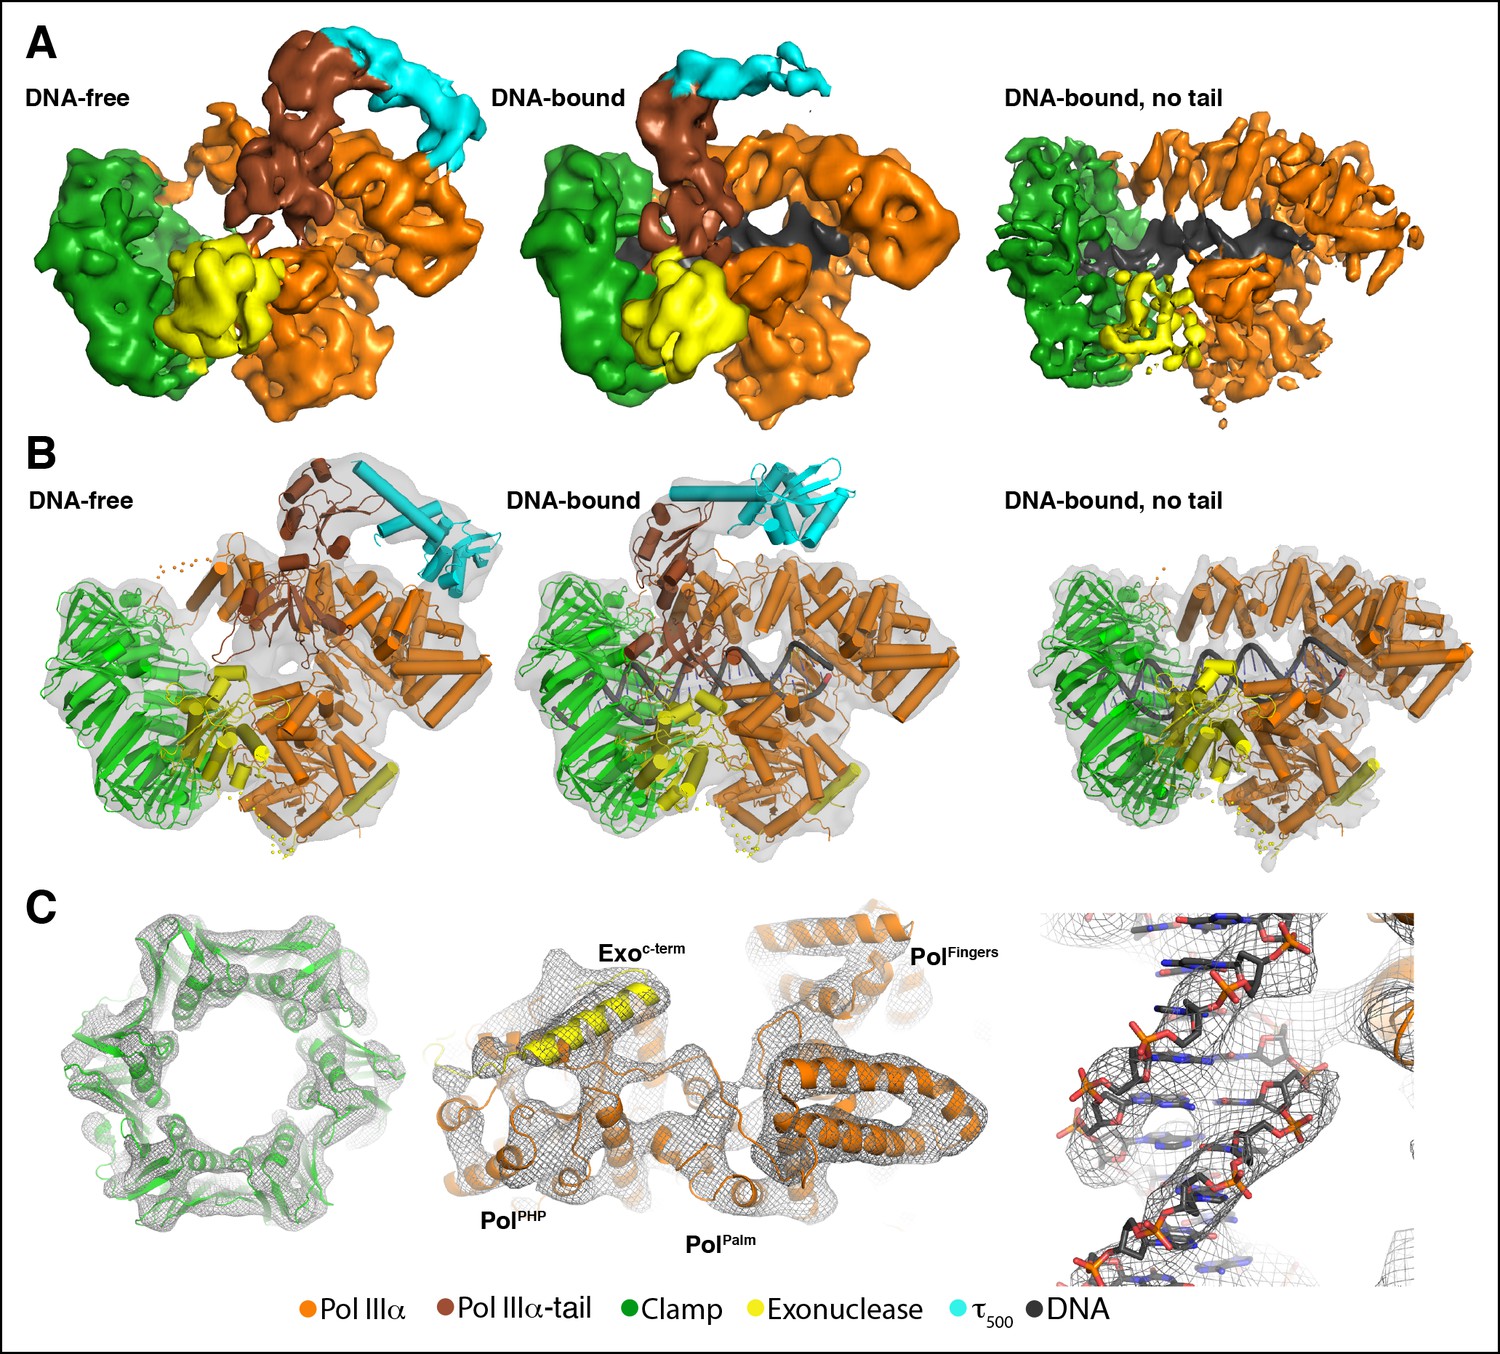
Cryo-EM structures of the E. coli PolIIIα-clamp-exonuclease-τ500 complex.
(A) Surface representation of the three structures, shown at 5 σ. Left to right: DNA-free, DNA-bound, and DNA-bound without tail. Colors indicate the position of the different proteins (B) Individual structures of PolIIIα, clamp, exonuclease, and τ500 fitted into the cryo-EM map (shown in grey at 5 σ) (C) Detailed views of the cryo-EM map (shown in grey mesh at 6 σ). Left panel: exit channel of the clamp in the DNA-free structure showing the ‘DNA-free’ map. Middle panel: bottom view of the polymerase showing the ‘DNA-free’ map. Right panel: detail of the DNA showing the ‘DNA-bound, no tail’ map. See also Videos 1 and 2.
Figure 1—figure supplement 1

Characterization of improved clamp binding mutants.
(A) Gel filtration analysis of the wild-type PolIIIα-clamp-exonuclease complex (top panel) and the PolIIIαQLDLF-clamp-exonucleaseQLSLPL complex (lower panel). The wild-type complex dissociates at lower protein concentrations, while the stabilized complex remains intact even at 0.1 μM.
Figure 1—figure supplement 2
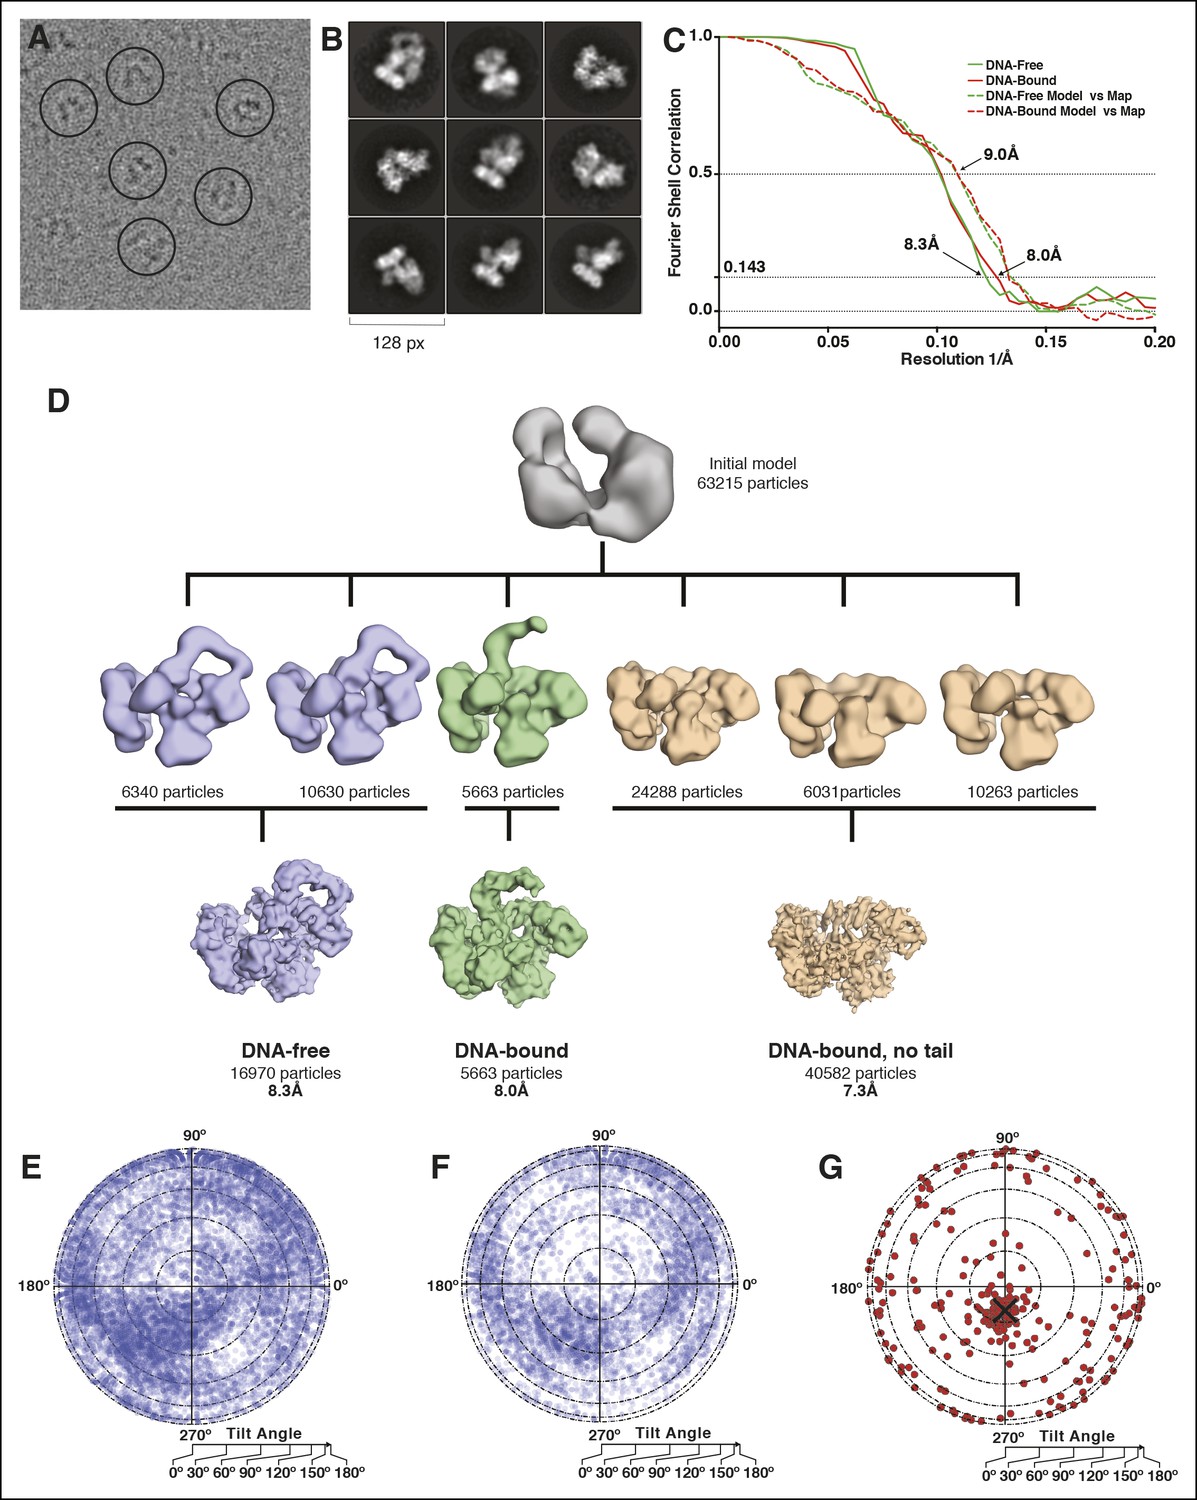
Microscopy data analysis and validation.
(A) Typical micrograph of the PolIIIα-clamp-exonuclease-τ500-DNA complex. (B) 2D class averages derived from the final 63,215 particle dataset (C) Fourier shell correlation for the DNA-free and DNA-bound models. In solid lines, the correlation between two independently refined halves of the data is indicated (gold-standard FSC). Estimated resolution at a correlation of 0.143 is 8.3 Å and 8.0 Å for the DNA-free and DNA-bound complex, respectively. In dashed lines, the correlation between the rigid-body docked models and their respective maps is indicated. (D) 3D model reconstruction. An initial model was obtained using Eman2 and subsequently classified into six 3D classes. Two of the 3D classes were merged into the ‘DNA-free’ map (16,970 particles) and one of these (5663 particles) was used for the ‘DNA-bound’ map. The remaining three classes were merged into the ‘DNA-bound, no tail’ map (40,582 particles) and further refined in Relion, resulting in three structurally distinct models. (E) Orientational distribution for particles of the DNA-free complex. The circle represents a flattened sphere plotted using Lambert equal area projection with the pole at the center and the equator at the outer rim of the circle. The radius indicates the tilt angle and the azimuth indicates the rotation or direction of the tilt. (F) Same for the DNA-bound complex (G) Tilt pair validation using 267 particle pairs that were selected from 20 image pairs collected at 0 and 20° tilt angle of the sample stage. The angular difference between the same particle collected from the two images is displayed. The black cross indicates the expected angular difference between pairs.
Figure 1—figure supplement 3
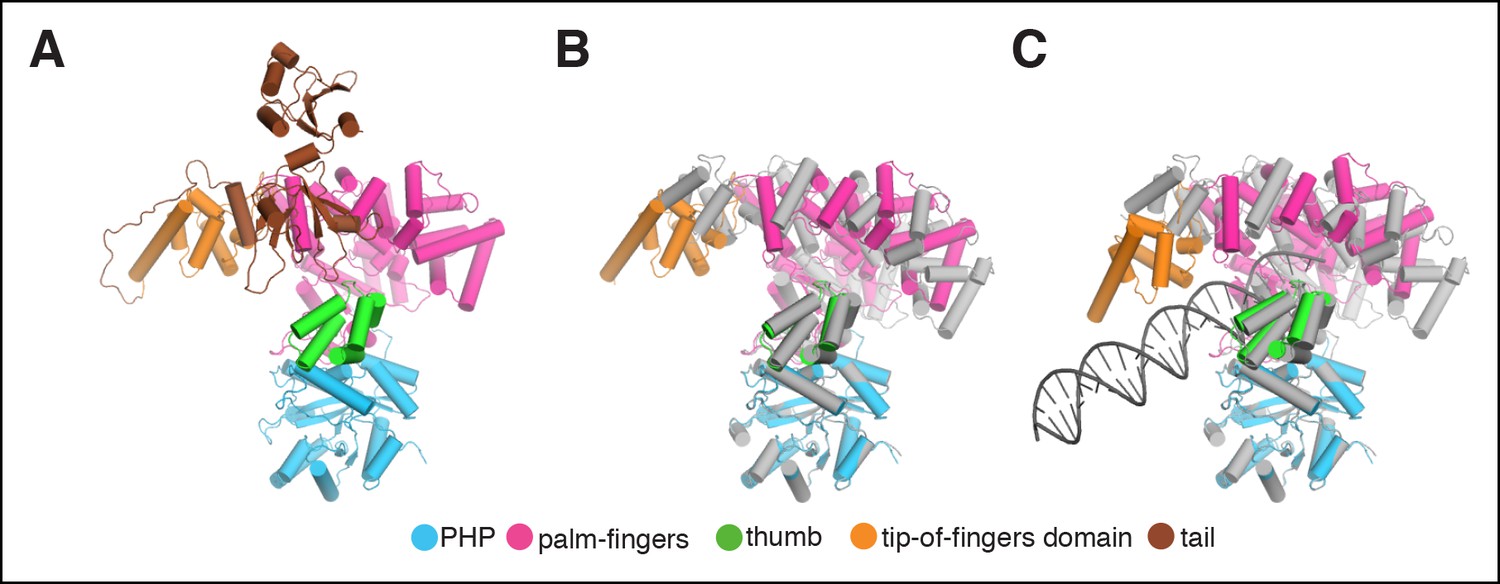
Rigid body movements in PolIIIα.
(A) Domain definitions used for the rigid body fitting of the PolIIIα structure into the cryo-EM maps. Domain boundaries are: PHP (residues 1–280), palm-fingers (residues 281–432 + 510–810), thumb (residues 433–509), tip-of-fingers (residues 811–928) and C-terminal tail (residues 929–1160). (B and C) Comparison of crystal structure of E. coli PolIIIα (shown in grey) and PolIIIα as fitted into the cryo-EM maps (the tail of the polymerase is omitted for clarity).
Figure 2 with 3 supplements

Multiple contacts between the subunits hold the complex together.
(A) Three different views of the DNA-free complex of PolIIIα-clamp-exonuclease-τ500 showing extensive contacts between the polymerase and other subunits. Missing loops in PolIIIα (residues 927–936) and exonuclease (residues 190–207) are shown in dots. Dashed boxes indicate views shown in panels B-D. (B) Modified clamp binding motif of PolIIIα (QLDLF: shown in sticks) modeled into the binding pocket of the clamp. (C) Modified clamp binding motif of the exonuclease (QLSLPL: shown in sticks) modeled into the second binding pocket of the dimeric clamp. (D) τ500 simultaneously binds the fingers and tail domain of the polymerase. The C-terminal residues of τ500 (residues 622–643: not modeled) bind to the tail of the polymerase, while the globular domain of τ500 binds to the polymerase fingers domain (see Figure 2—figure supplement 2 for more details).
Figure 2—figure supplement 1
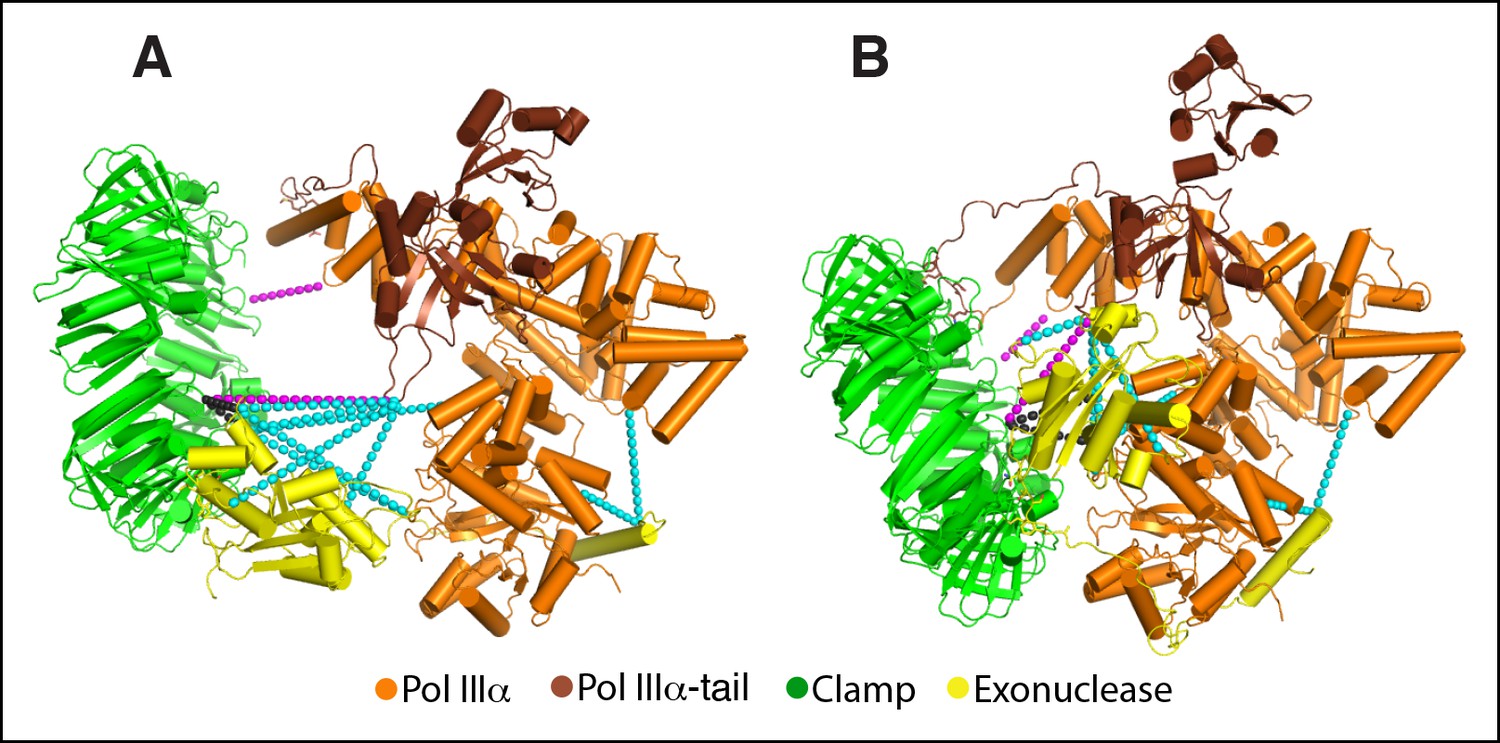
Previously determined cross-links fit accurately with the cryo-EM model.
(A) Model of the polymerase-clamp-exonuclease complex based on chemical cross-links reported in (Toste Rêgo et al., 2013). Magenta dashed lines: polymerase-clamp cross-links. Cyan dashed lines: polymerase-exonuclease cross-links. Black dashed lines: clamp-exonuclease cross-links. (B) Same cross-links mapped onto the DNA-free cryo-EM model.
Figure 2—figure supplement 2
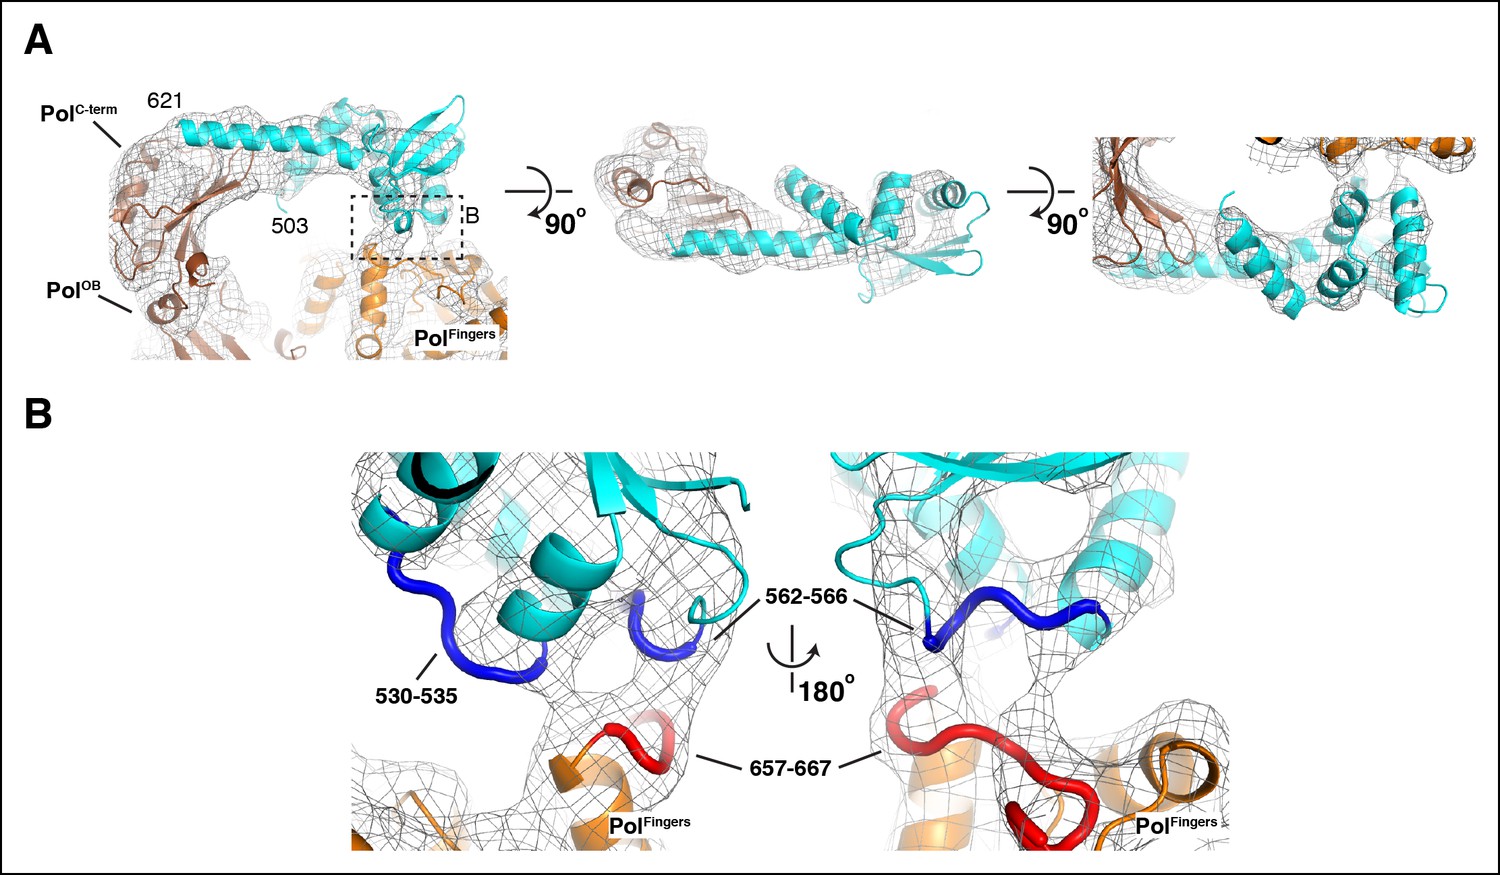
Details of the interactions between τ500 and the PolIIIα fingers domain.
(A) Three orthogonal views of the fit of τ500 into the cryo-EM density. Dashed box in left panel indicates view shown in panel B. (B) Detailed view of the τ500 - PolIIIα fingers domain interaction. Contact regions at the interface are indicated with thick coil in red (τ500: residues 530–535 and residues 562–566) and blue (PolIIIα: residues 657–667)
Figure 2—figure supplement 3
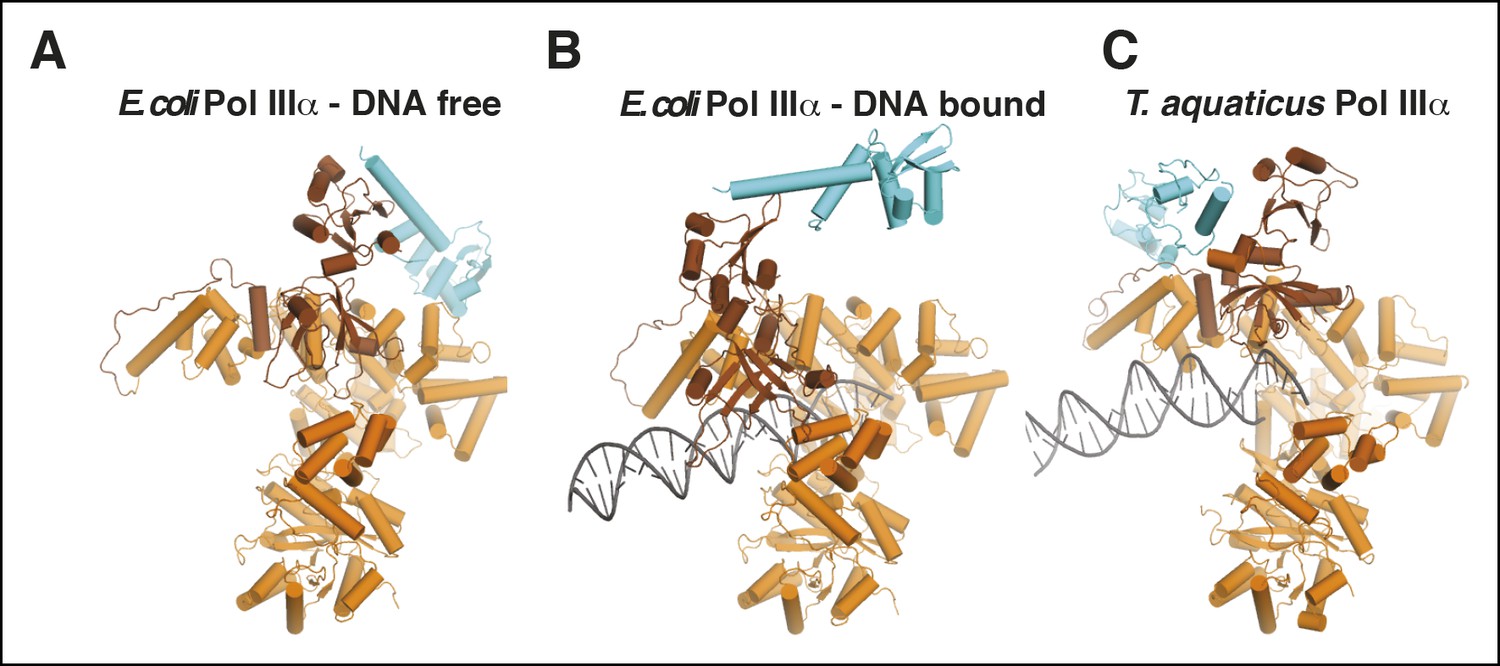
Comparison of τ binding in E. coli and Taq PolIIIα.
(A,B) DNA-free and DNA-bound E. coli PolIIIα-τ500. The clamp and exonuclease are omitted for clarity. (C) Taq PolIIIα-τc (Liu et al., 2013).
Figure 3 with 2 supplements
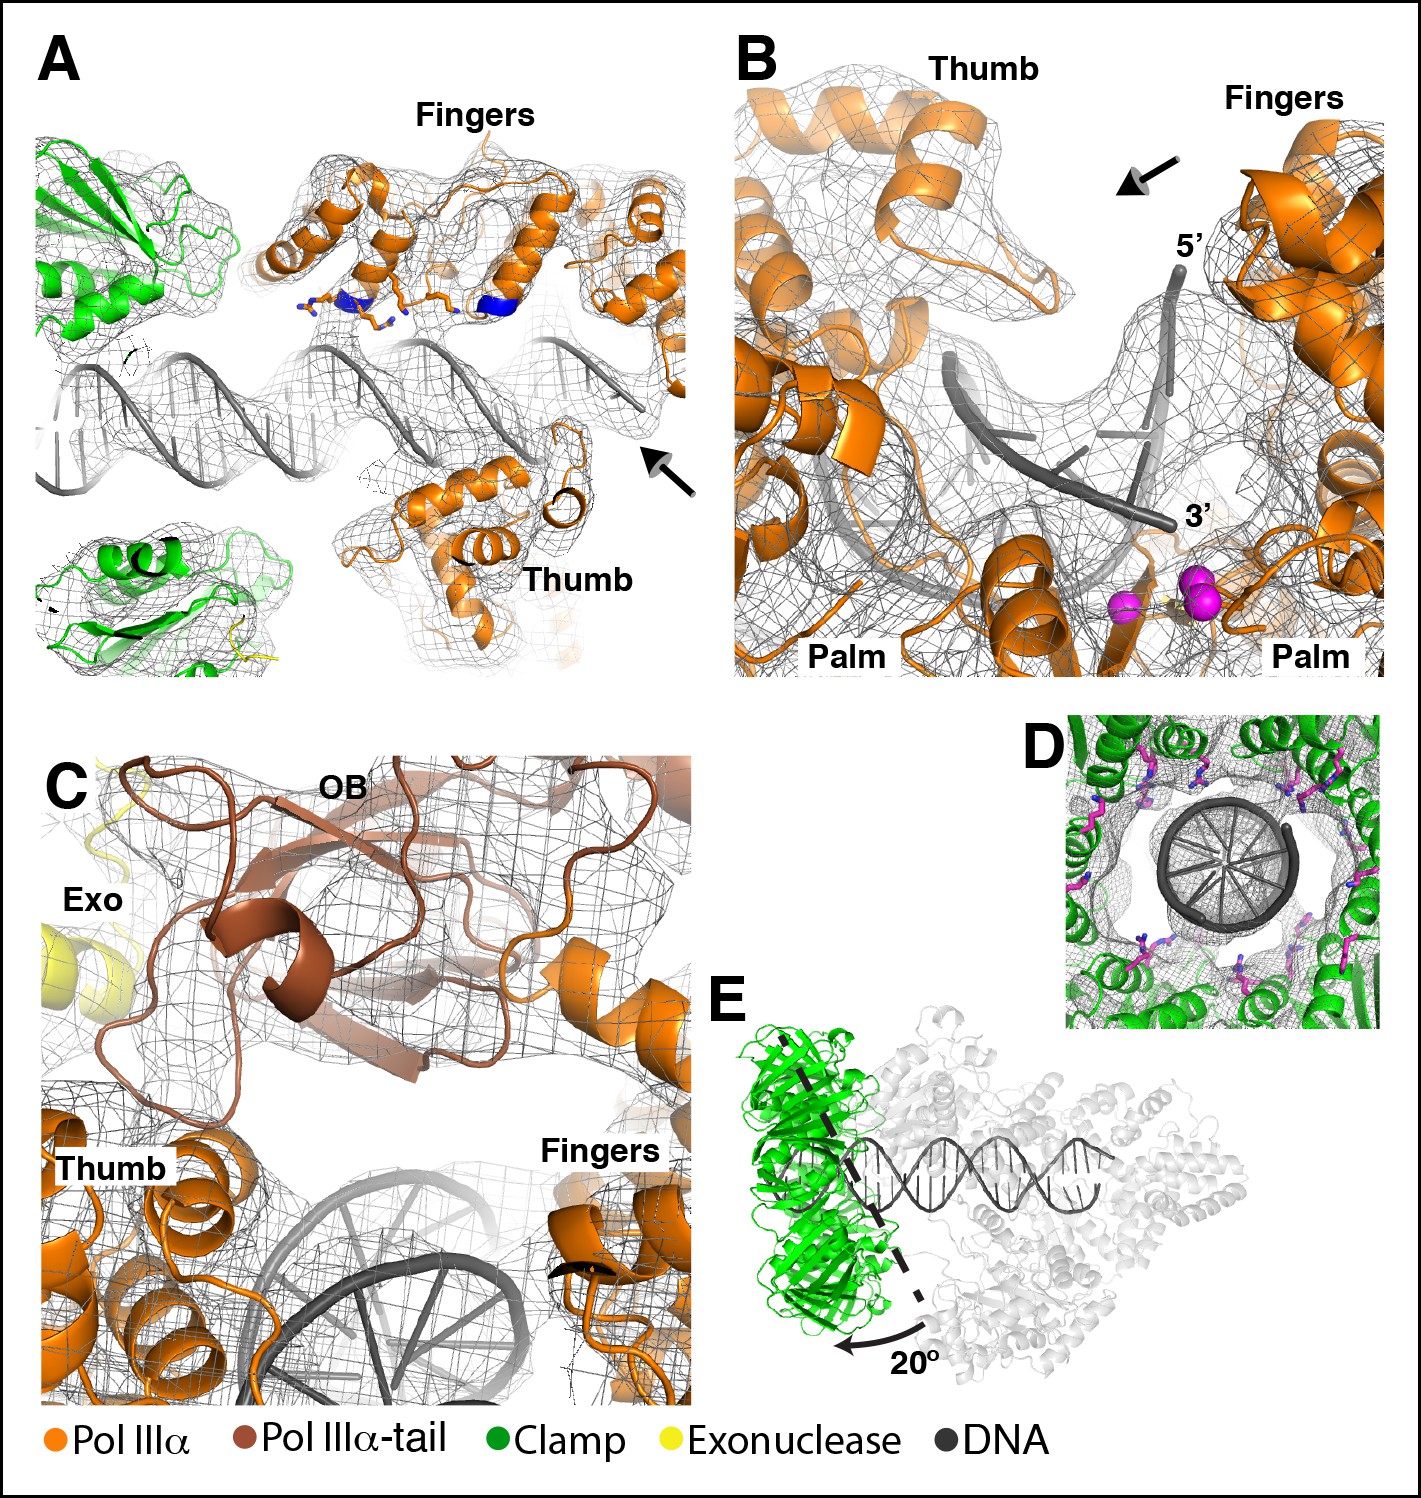
The DNA has extensive contacts with PolIIIα and clamp.
(A) Overview of the DNA-bound complex. The N-termini of the two helices that point at the DNA backbone are colored in blue. Potential DNA interacting side chains are shown in sticks. The tail of PolIIIα, the exonuclease and τ500 are omitted for clarity. Arrow indicates viewpoint in panel B (B) Polymerase active site, with the DNA held between thumb, palm and fingers domain. Polymerase active site residues are indicated with magenta spheres. Arrow indicates viewpoint in panel C (C) DNA interactions downstream of the active site. The OB domain is positioned on top of the DNA but does not make any contacts with it. (D) DNA exit channel in the clamp with positively charged residues within 10 Å of the DNA indicated in magenta sticks. Note that the positions of the side chains have not been refined and should be seen as approximate positions. (E) In the DNA-bound complex, the clamp is at a ∼80° angle from the DNA. A dashed line indicates the position of the clamp alone bound to a DNA substrate. (Georgescu et al., 2008a). The other subunits (PolIIIα, exonuclease, τ500) are shown in light grey for clarity.
Figure 3—figure supplement 1
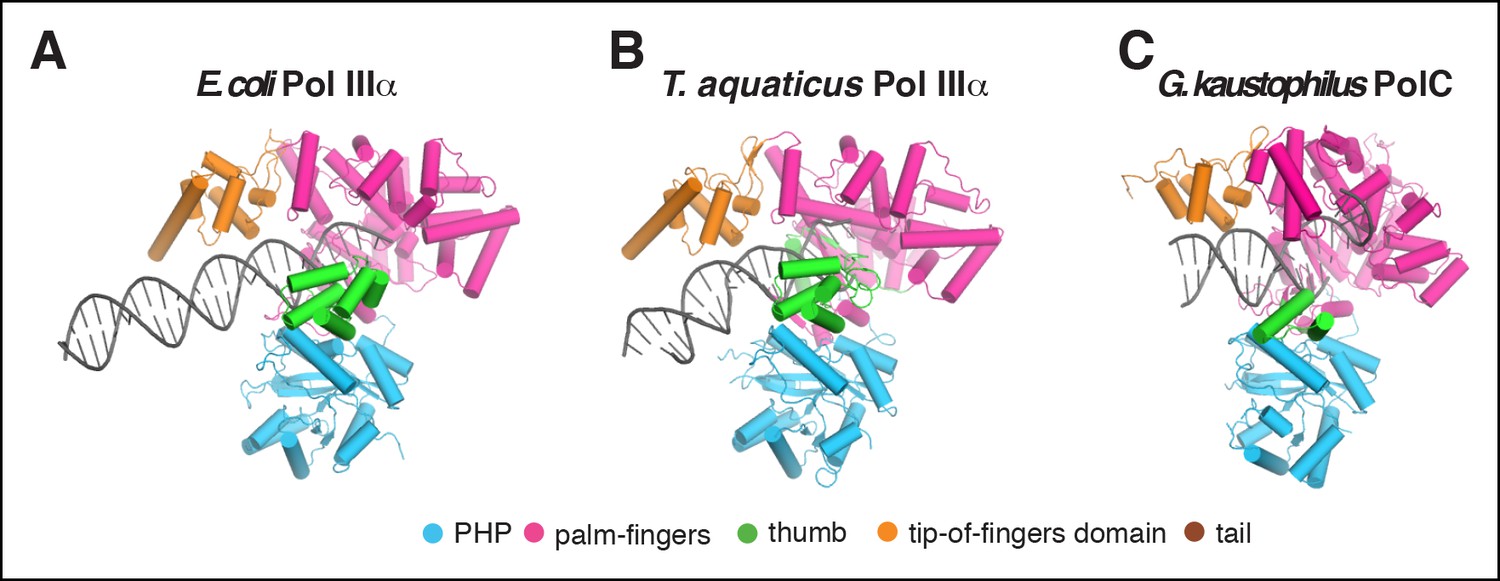
Comparison of DNA binding by C family DNA polymerases.
(A) E. coli PolIIIα, (B) T. aquaticus PolIIIα (Wing et al., 2008), (C) G. kaustophilus PolC (Evans et al., 2008).
Figure 3—figure supplement 2
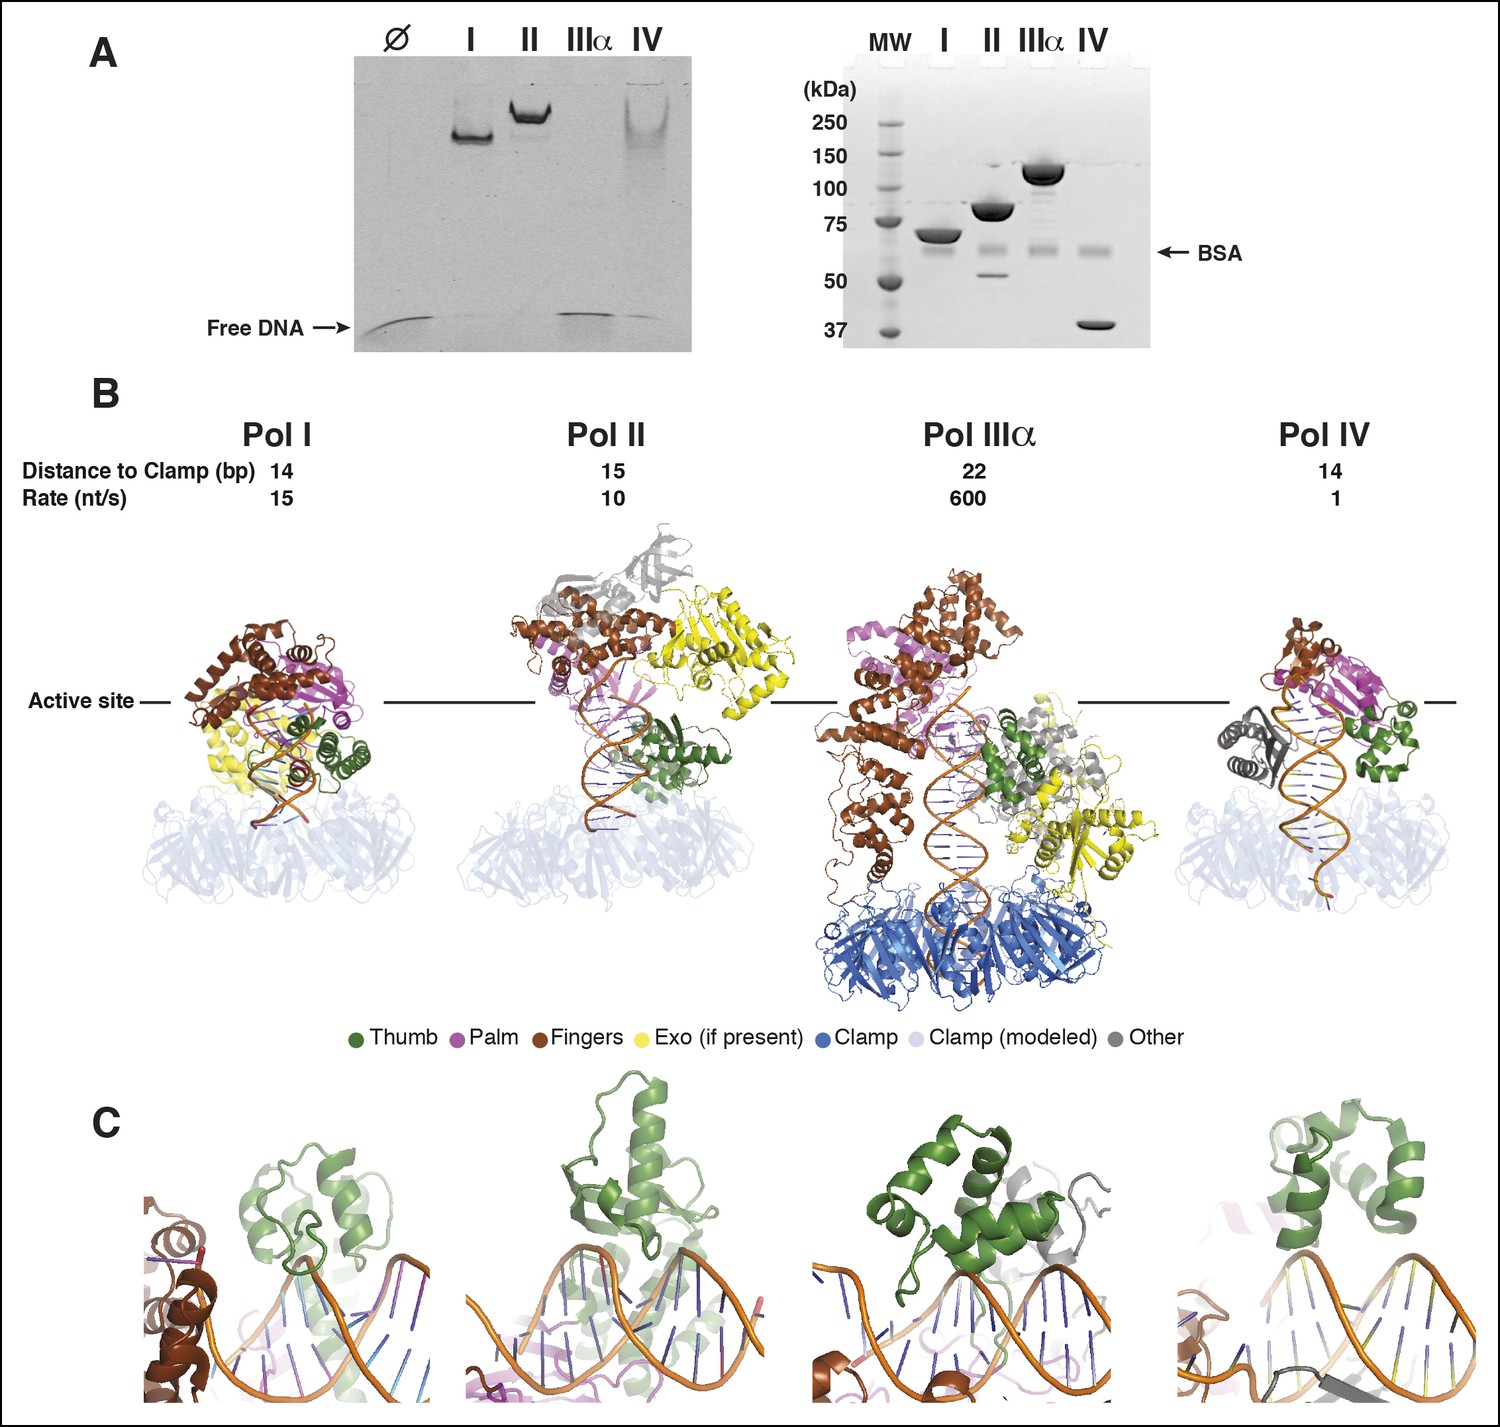
Pol IIIα has more extensive DNA interactions than other DNA polymerases.
(A) Left panel: Electro-mobility shift assay with the E. coli DNA polymerases Pol I (Klenow fragment), Pol II, Pol IIIα, and Pol IV. At 2.5 μM Pol I, Pol II, and Pol IV retain DNA, whereas Pol IIIα does not. The more intense bands for Pol I and Pol II are caused by protein induced fluoresence enhancement (PIFE) (Hwang et al., 2011). Right panel: SDS-page analysis of the same samples used for the electro-mobility shift assay (proteins stained with coomassie blue). Molecular weights: Pol I (Klenow fragment) 70 kDa, Pol II 90 kDa, Pol IIIα 130 kDa, Pol IV 40 kDa. (B) Structural comparison of Pol I (PDB code: 1QTM [Li et al., 1999]), Pol II (PDB code: 3K57 [Wang and Yang, 2009]), PolIIIα (this work), and Pol IV (PDB code: 4IRD [Sharma et al., 2013]). Polymerases were aligned on the 3’ end of the primer, indicated by the solid line. For Pol I, Pol II, and Pol IV, the clamp was modeled based on predicted clamp interacting motifs in the respective polymerases. The distance measured in base pairs between the 3’ end of the primer and the opening of the clamp is indicated on top of the structures, together with the rate of DNA synthesis of each polymerase. (C) Detailed view of the interaction of the polymerase thumb domains and the DNA. All polymerase thumb domains interact with the backbone of the minor groove. Only Pol IIIα inserts a loop into the major groove of the DNA.
Figure 4
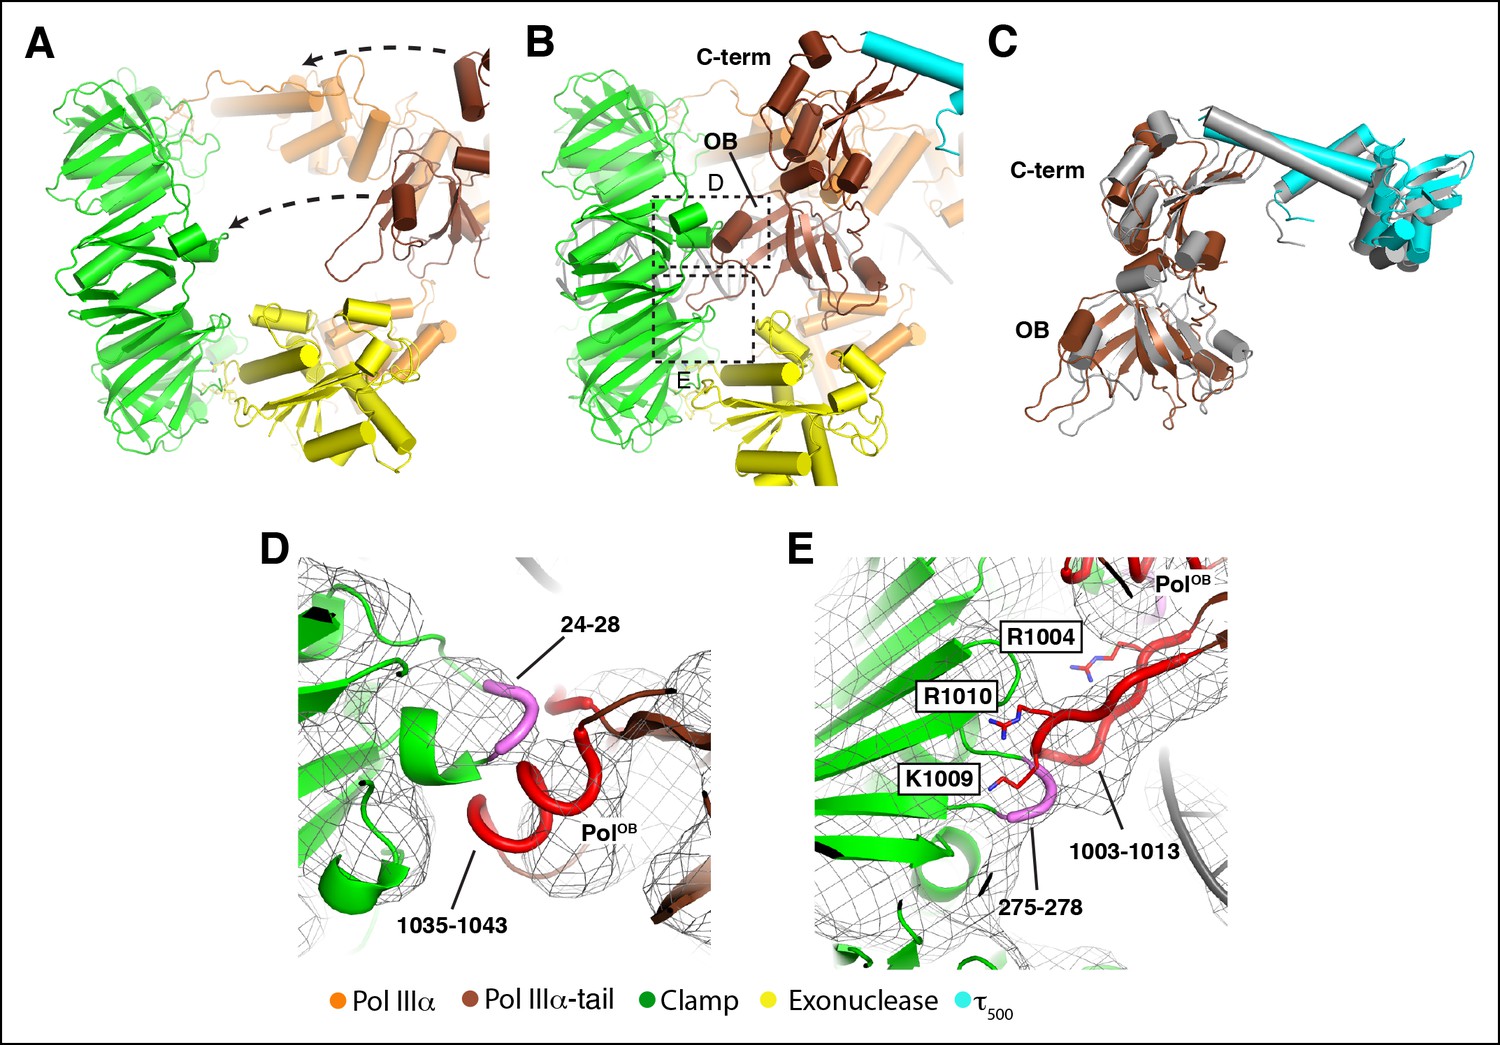
DNA binding induces large conformational changes in the polymerase.
(A) Clamp binding by PolIIIα in the DNA-free complex. Arrows indicate movement of the PolIIIα tail (see also Video 3). (B) Clamp binding by PolIIIα in the DNA-bound complex. Dashed boxes indicate views shown in panel D and E (C) Comparison of the PolIIIα-tail - τ500 interaction in the DNA-free (in grey) and DNA-bound structure. (D and E) Detailed view of the clamp - PolIIIα OB domain interaction. Interacting regions at the interface are indicated in thick coil in magenta (clamp: residues 24–24 and residues 275–278) and red (PolIIIα-OB domain: residues 1035–1043 and residues 1003–1013). Residues mutated in Georgescu et al (Georgescu et al., 2009) are shown in sticks and labeled with outlined boxes. Note that the positions of the side chains have not been refined and should be seen as approximate positions.
Figure 5
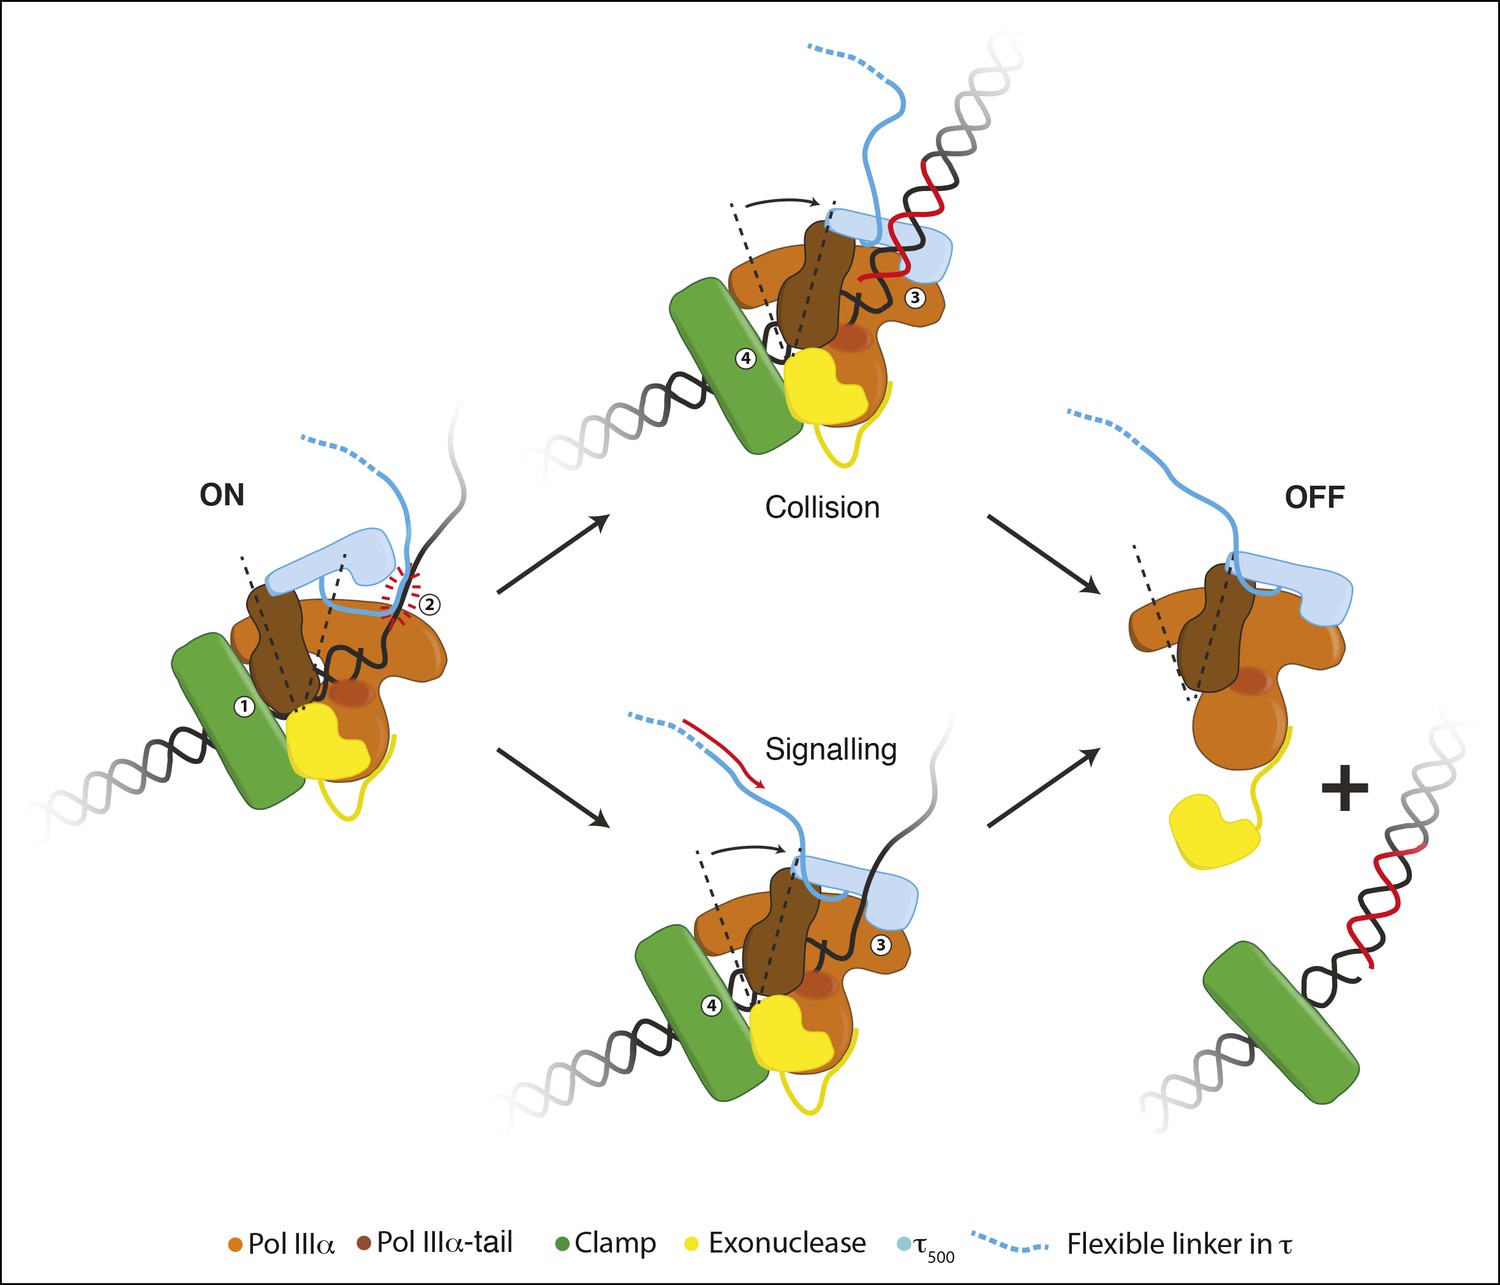
Schematic representation for a possible role of the conformational changes in the polymerase.
During processive DNA synthesis, the tail of the polymerase is attached to the clamp (indicated with ‘1’) and pulls τ500 away from the polymerase fingers domain. This conformation may be further stabilized by the presence of a DNA binding region immediately upstream of τ500 (indicated with ‘2’; see text for more details).Upon encounter of a release trigger, the contact between τ500 and the polymerase fingers domain is restored (indicated with ‘3’), and the contact between the clamp and polymerase tail is broken (indicated with ‘4’). The release trigger may either come from a collision with the previous Okazaki fragment (indicated with ‘Collision’), or a signal from other replisome components via the flexible linker of τ (indicated with ‘Signaling’). Once the polymerase-tail clamp contact has been broken, the two remaining contacts between the clamp and polymerase-exonuclease are not enough to keep the polymerase bound to the clamp. The polymerase is released from clamp and DNA and can be repositioned to a newly primed site to reinitiate DNA synthesis.
Videos
Video 1
Structure of the DNA-free complex of PolIIα-clamp-exonuclease-τ500, Related to Figure 1.
Fitting of the high-resolution structures into the cryo-EM map of the DNA-free complex.
Video 2
Structure of the DNA-bound complex of PolIIα-clamp-exonuclease-τ500, Related to Figure 1.
Fitting of the high-resolution structures into the cryo-EM map of the DNA-bound complex.
Video 3
DNA binding induces large conformational changes in the complex, Related to Figure 4.
Linear morphing of the DNA-free to DNA-bound state showing the large conformational change between the two states.
Download links
A two-part list of links to download the article, or parts of the article, in various formats.
Downloads (link to download the article as PDF)
Open citations (links to open the citations from this article in various online reference manager services)
Cite this article (links to download the citations from this article in formats compatible with various reference manager tools)
cryo-EM structures of the E. coli replicative DNA polymerase reveal its dynamic interactions with the DNA sliding clamp, exonuclease and τ
eLife 4:e11134.
https://doi.org/10.7554/eLife.11134


