Salicylate, diflunisal and their metabolites inhibit CBP/p300 and exhibit anticancer activity
- University of California, United States
- Kyoto University, Japan
- University of Miami, United States
- Sylvester Comprehensive Cancer Center, United States
- University of Pennsylvania, United States
- Abramson Family Cancer Research Institute, United States
- National Cancer Institute, United States
Figures
Figure 1 with 1 supplement
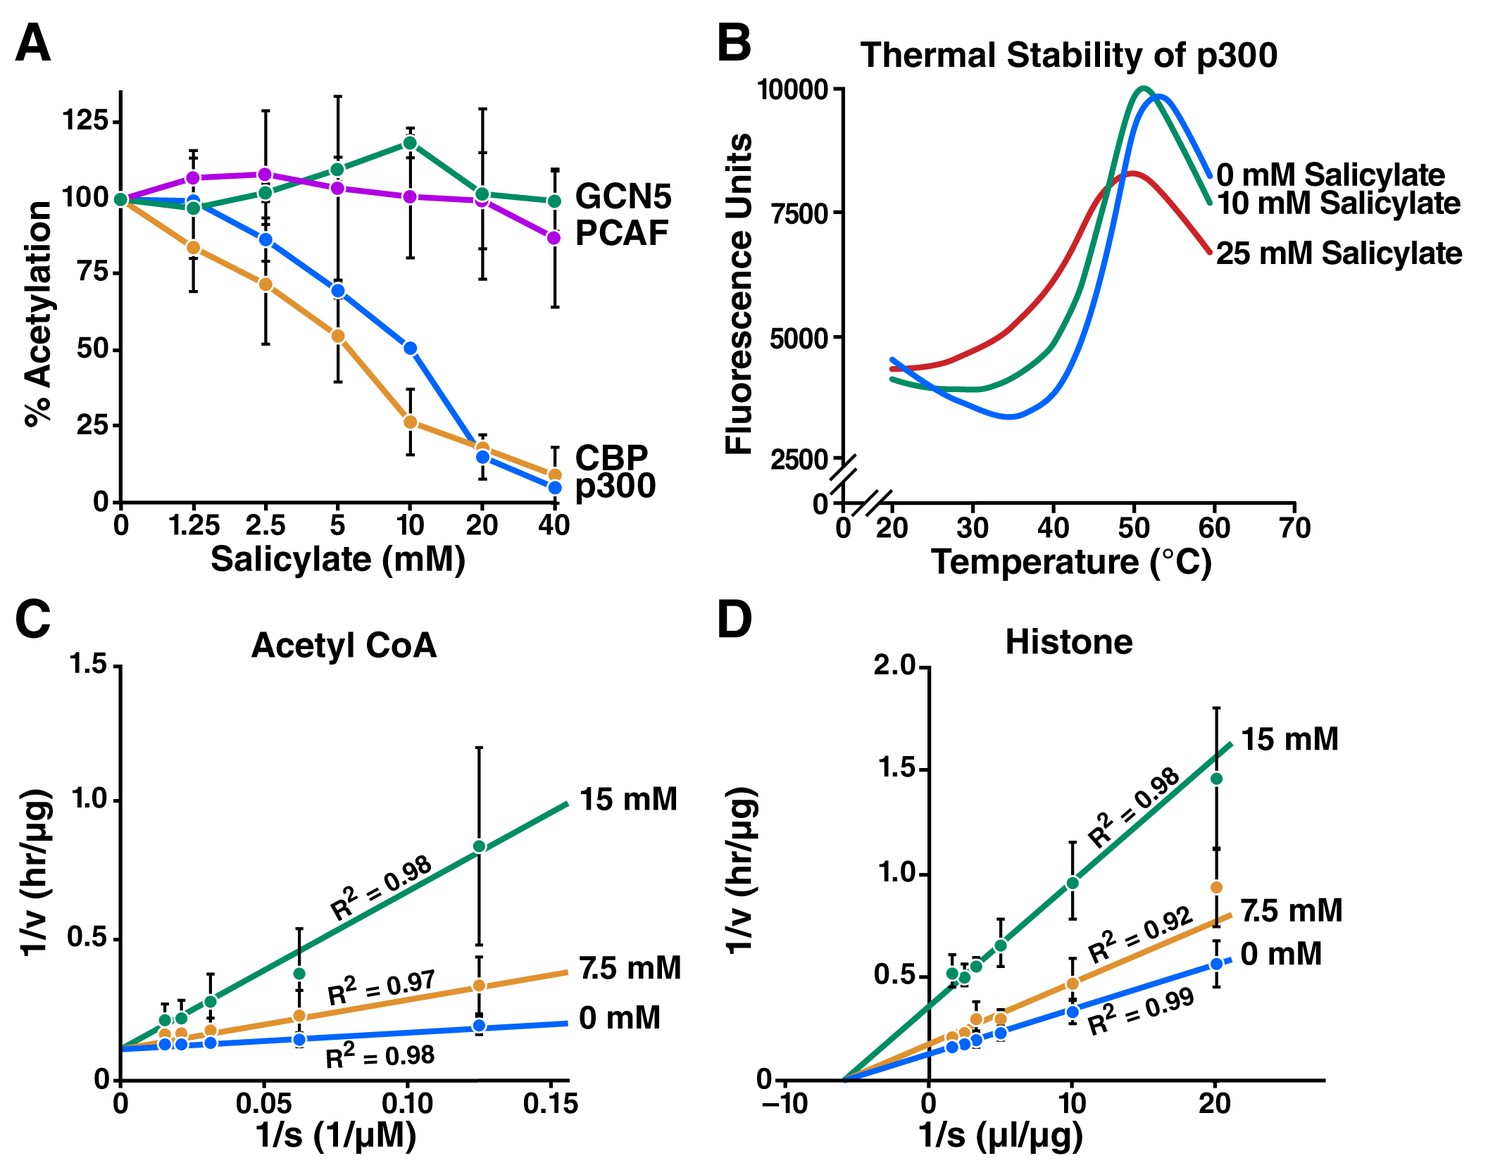
Salicylate inhibits CBP/p300 in vitro.
(A) Recombinant p300, CBP, GCN5, or PCAF and histones were incubated with 14C-labeled acetyl-CoA with or without sodium salicylate, separated by SDS-PAGE, analyzed by autoradiography, and quantified with Image J software. Acetylation levels are relative to those in untreated controls. (B) Thermal stability assay for sodium salicylate binding to the p300 HAT domain. Tm, melting temperature. (C) and (D) Lineweaver-Burk plots showing kinetic analysis of p300 acetyltransferase inhibition by sodium salicylate. Histone acetylation was measured with several concentrations of acetyl-CoA (C) or histone (D) in the presence or absence of sodium salicylate.
Figure 1—figure supplement 1
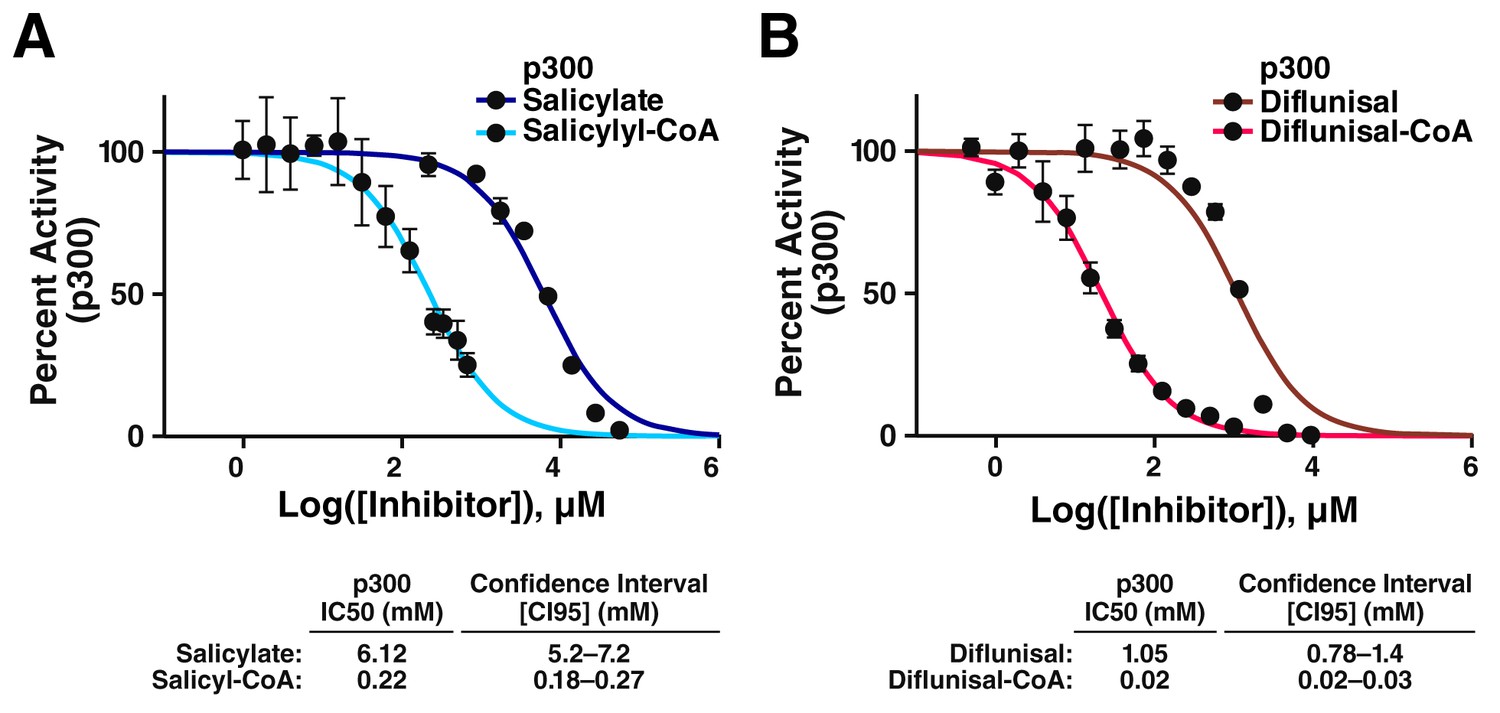
CoA metabolites of salicylate and diflunisal are more potent inhibitors of p300.
(A) Dose-response data for inhibition of p300 by salicylate and salicyl-CoA. Acetylation of an H4(3–14) peptide was monitored using direct microfluidic mobility shift analysis as previously described (Montgomery et al., 2014; Fanslau et al., 2010). Error is given as the 95% confidence interval. (B) Dose-response data for inhibition of p300 by diflunisal and diflunisal-CoA. Error is given as the 95% confidence interval.
Figure 2 with 2 supplements

Salicylate inhibits specific lysine acetylation of histone and nonhistone proteins independently of AMPK activation.
(A) Decreased acetylation of specific lysines in histones in the presence of salicylate. HEK293T cells were treated with the indicated concentrations of sodium salicylate for 24 hr. Site-specific histone acetylation was detected by Western blot with specific antisera. Bands were quantified with Image J software. Acetylation was normalized to that of untreated cells and plotted. Representative results are shown in Supplementary Figure 1. Experiments are repeated and error bars indicate SEM. (B–D) Salicylate-induced hypoacetylation of histone H2B was rescued by overexpression of p300 (B) but not by the catalytically inactive p300 mutant F1504A (C), or PCAF (D). HEK293T cells were transfected with increasing amounts of expression vectors for p300 or F1504A or PCAF, treated with sodium salicylate for 24 hr, and analyzed by Western blotting analysis with an antiserum specific for acetyl histone H2BK12/K15. Bands were quantified with Image J software. Acetylation was normalized to that of untreated control. Average levels of relative acetylation are plotted and error bars indicate SEM. Representative results are shown in Supplementary Figure 2—figure supplement 2. (E) IC50 values generated from all curves in panel (B) and (D) were plotted against the amount of plasmid transfected (p300 or PCAF). (F), (G) HEK293 T cells were transfected with expression vectors for p300 and NF-κB p65 (F) or p53 (G), treated with salicylate for 24 hr, and analyzed by Western blot with specific antibodies against acetyl NF-κBK310 (F) or acetyl p53K382 and acetyl H2BK12/15 (G). Compound C (10 μM), a specific AMPK inhibitor, was added to salicylate-treated cells for 24 hr before Western blot (G). KR, p65 K310R mutant
Figure 2—figure supplement 1
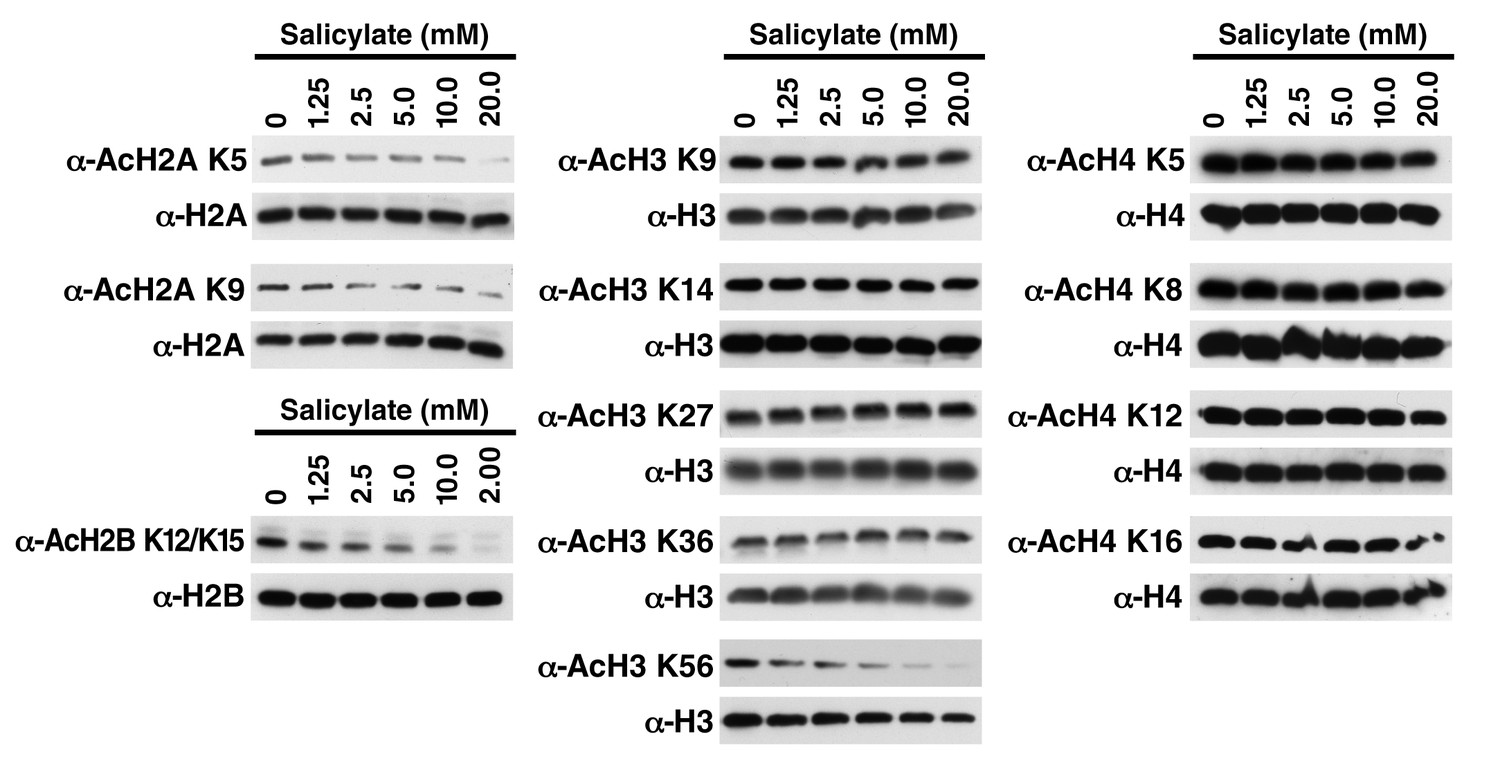
Salicylate induces histone deacetylation in HEK293T cells HEK293T cells were treated with sodium salicylate as indicated for 24 hr, immediately lysed in Laemmli buffer, and then subjected to western blot analysis with the indicated antibodies.
Histones H2A, H2B, H3 and H4 were used as input loading controls. Experiments are repeated five times and representative data are shown.
Figure 2—figure supplement 2

Salicylate-induced deacetylation of histone H2B can be rescued by overexpression of p300, but not PCAF, in a dose-dependent manner.
(A) Overexpression of p300 but not PCAF specifically leads to hyperacetylation of histone H2B. Expression plasmids for p300 WT, catalytically inactive (Y1503A or F1504A) p300, or PCAF were transfected into HEK293T cells by calcium phosphate. H2B acetylation was measured by western blot and the specified antibodies. (B) Overexpression of p300 but not PCAF rescued salicylate-induced H2B deacetylation in a dose-dependent manner. Transfected cells were prepared as above and treated with sodium salicylate as indicated for 24 hr. H2B acetylation was measured by Western Blot and the specified antibodies. Experiments are repeated five times and representative data are shown.
Figure 3 with 2 supplements
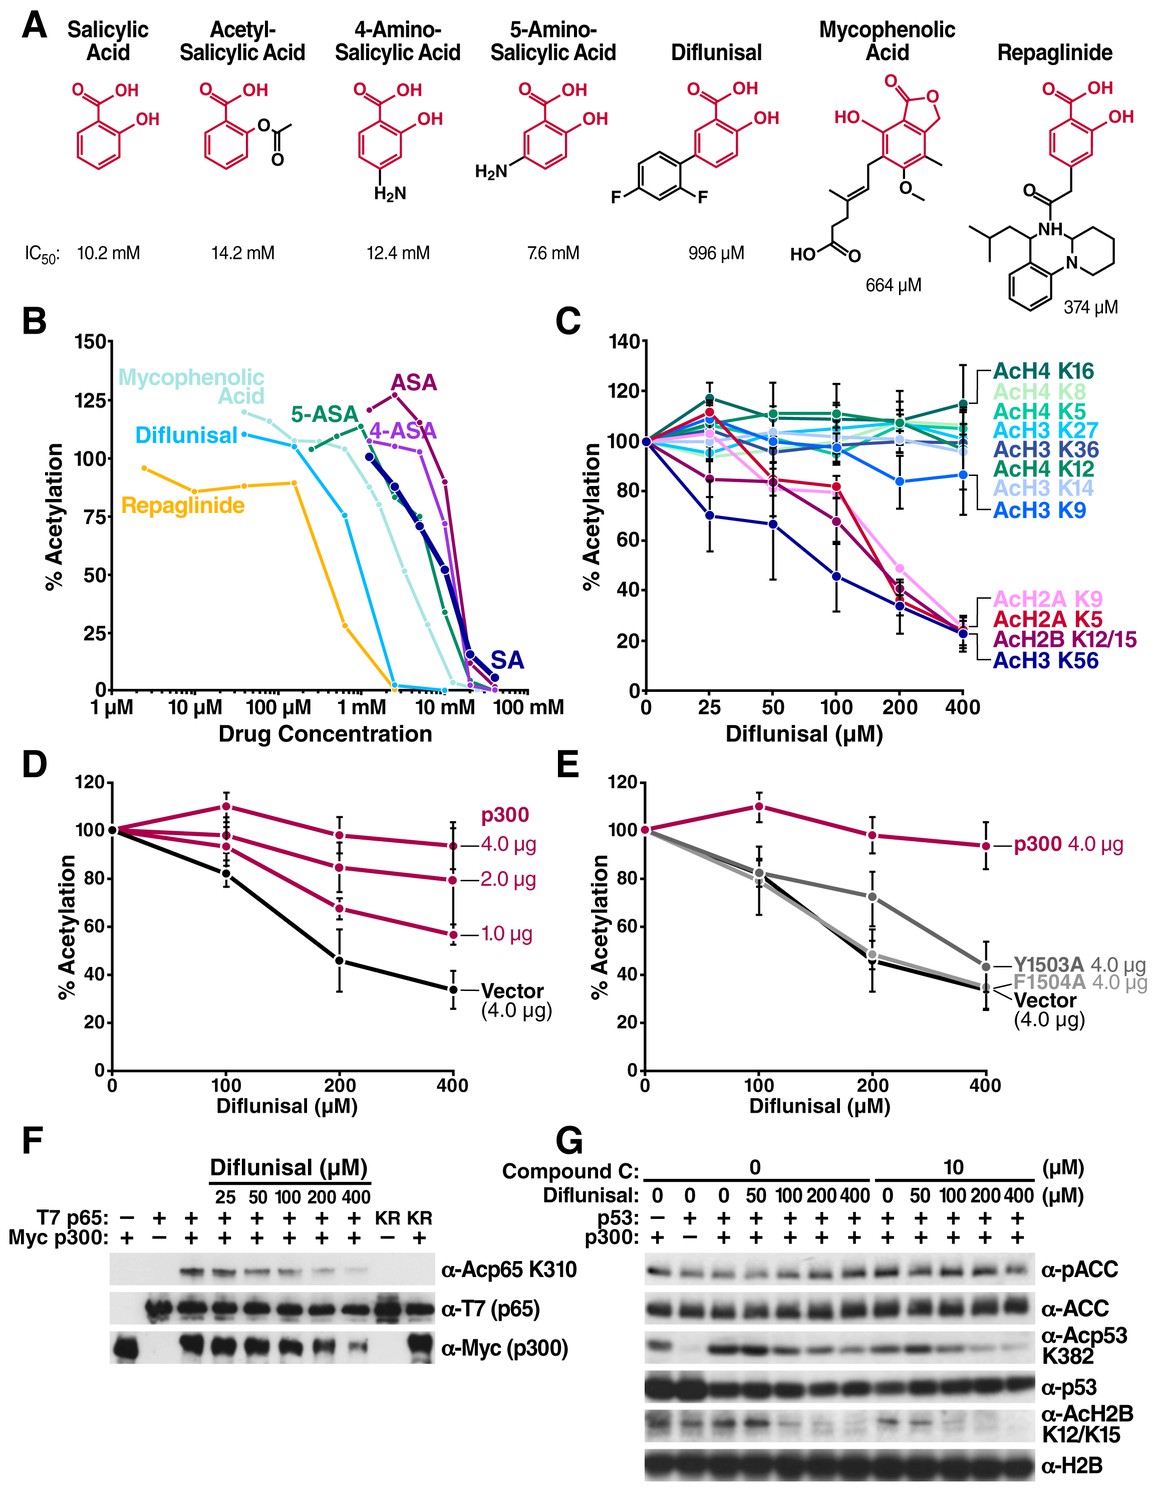
Structural homology search identifies diflunisal as a potent p300 inhibitor.
(A) FDA-approved drugs that contain a structure similar to that of salicylate are shown in red. Numbers below the structures are IC50 of each drug, measured by in vitro p300 HAT assays. (B) Relative HAT activities are plotted by in vitro HAT assays using recombinant p300 and histones with increasing amount of various FDA approved drugs. Acetylation levels are relative to those in untreated controls. (C) Relative levels of histone acetylation in response to diflunisal. HEK293T cells were treated with various amount of diflunisal, followed by Western blotting with specific acetyl histone antibodies, as indicated. Bands were quantified with Image J software and plotted. Experiments are repeated two to five times. Error bars indicate SEM. Representative results are shown in Figure 2—figure supplement 1. (D) and (E) Diflunisal-induced hypoacetylation of histone H2B was rescued by overexpression of p300 (D) but not by the catalytically inactive p300 mutants Y1503A and F1504A (E) (F) Diflunisal inhibits acetylation of NF-κB p65 (G) and p53 (G) independently of slight AMPK activation (G).
Figure 3—figure supplement 1
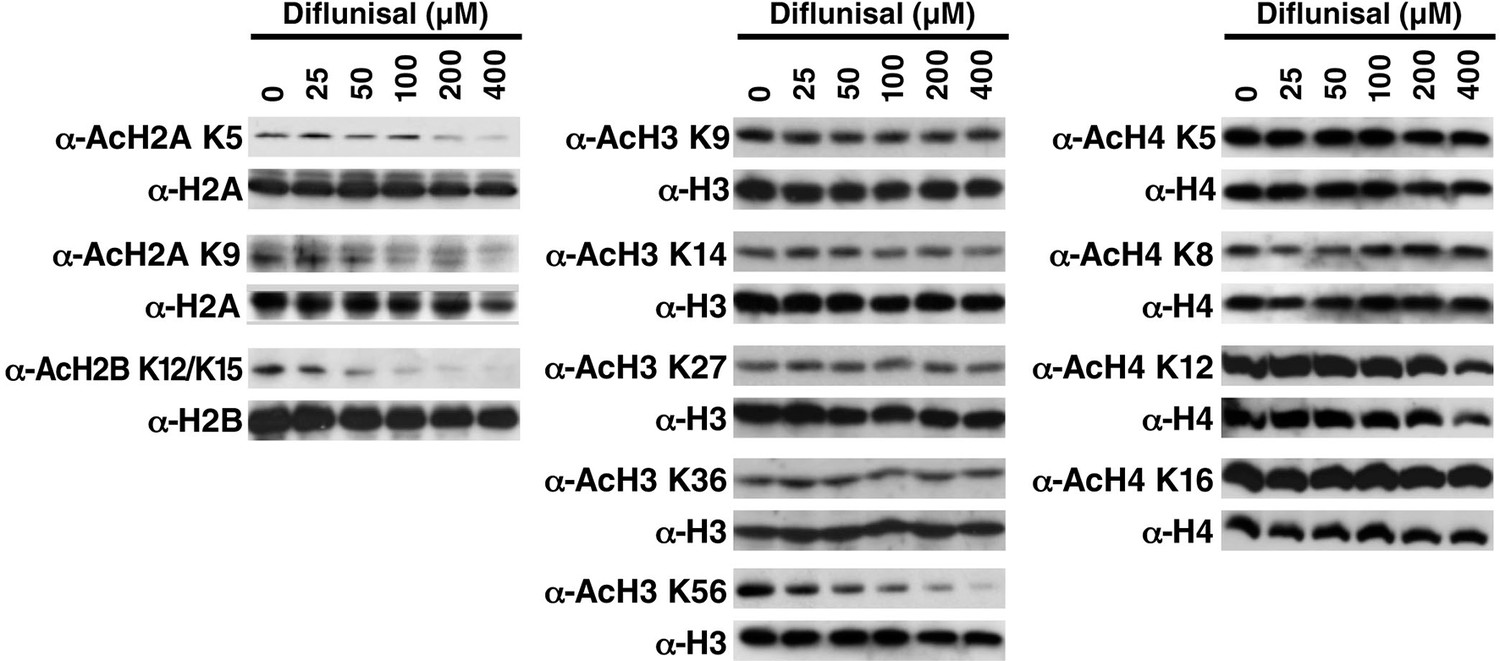
Diflunisal induces histone deacetylation in HEK293T cells HEK293T cells were treated with diflunisal as indicated for 24 hr, immediately lysed in Laemmli buffer, and then subjected to western blot analysis with the indicated antibodies.
Histones H2A, H2B, H3 and H4 were used as input loading controls. Experiments are repeated five times and representative data are shown.
Figure 3—figure supplement 2
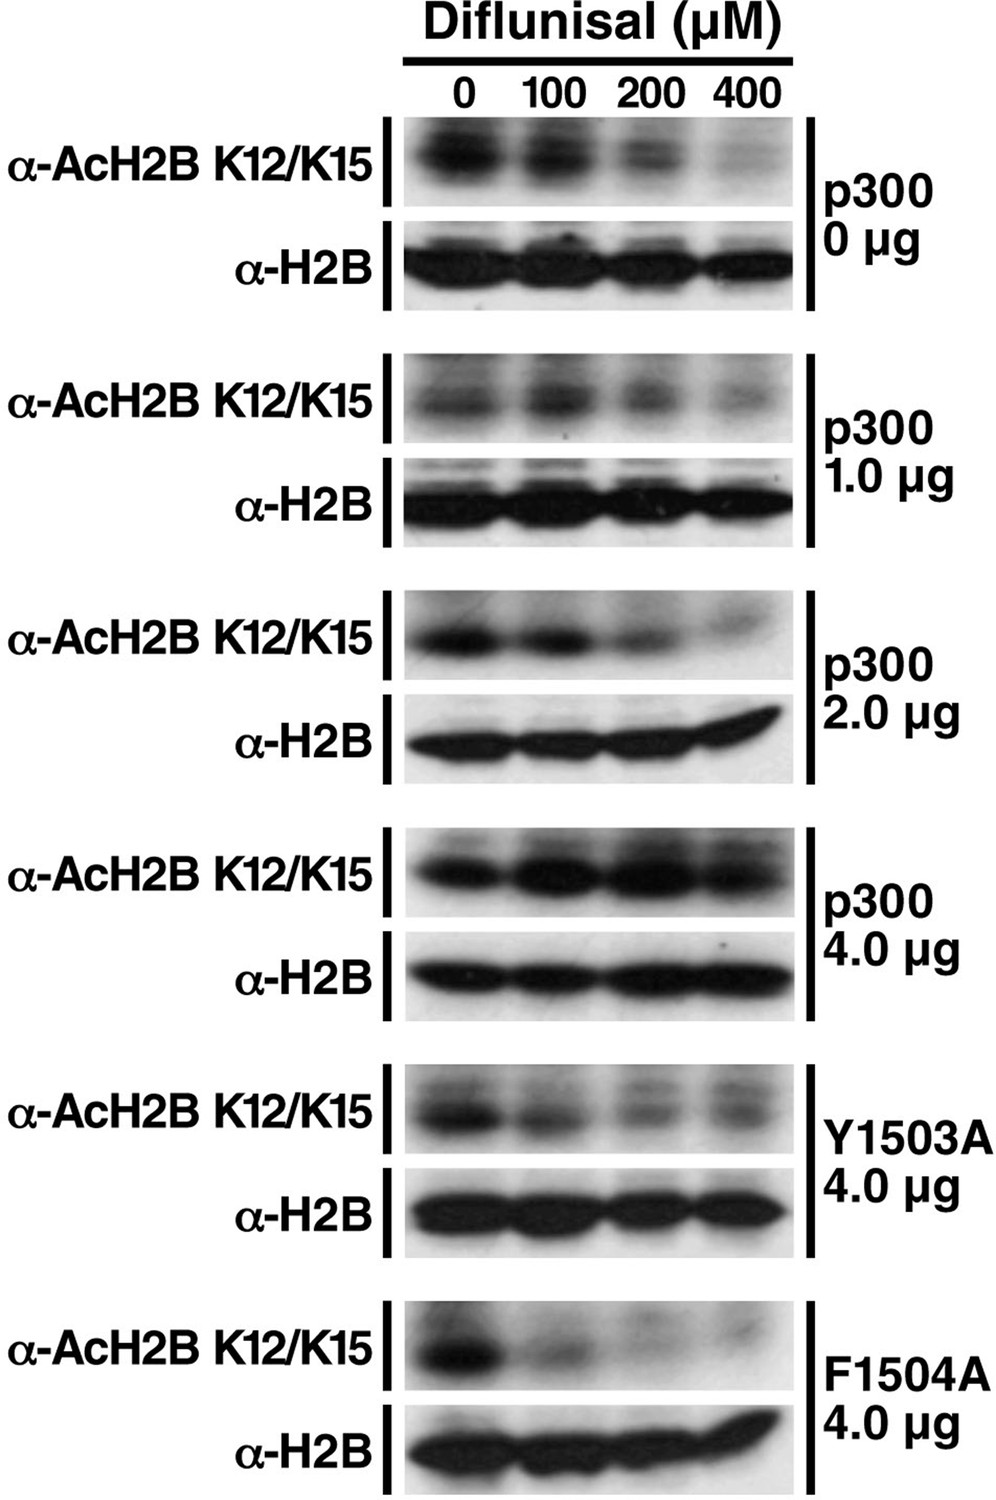
Diflunisal-induced deacetylation of p300 is rescued by overexpression of p300 in a dose-dependent manner, but not inactive p300 mutants.
HEK293T cells were transfected with expression vectors for WT p300 or catalitycally inactive mutant. 24 hr after transfection, cells were treated with diflunisal as indicated for 24 hr. H2B acetylation was measured by Western Blot using specified antibodies. Experiments are repeated four times and representative data are shown.
Figure 4
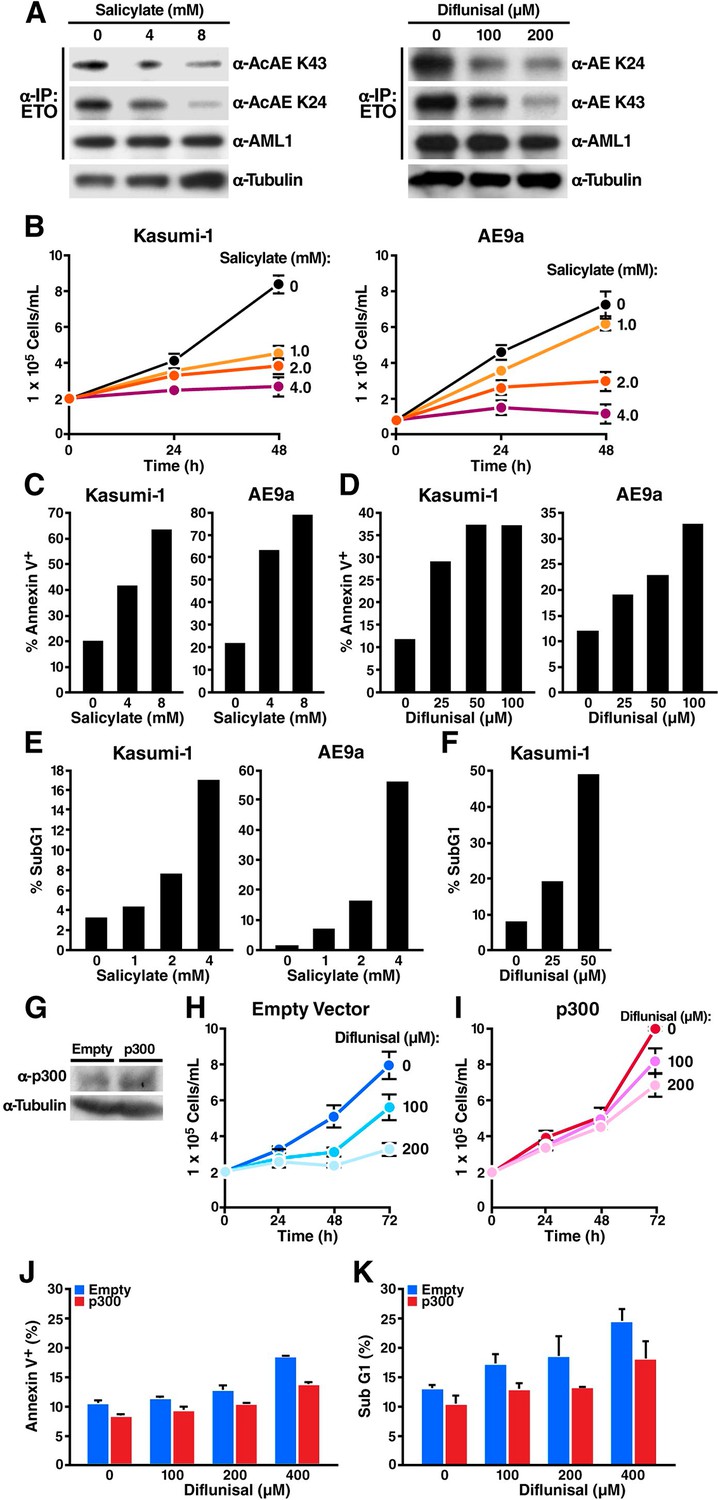
Sodium salicylate and diflunisal decrease acetylation of AML1-ETOK43/K24 and block the growth of t(8;21) leukemia cells by inducing apoptosis.
(A) Kasumi-1 cells expressing the AML1-ETO fusion protein were treated with sodium salicylate (4 or 8 mM, left) or diflunisal (100 or 200 μM, right) for 24 hr, followed by immunoprecipitation of AML1-ETO and analysis by Western blotting with an anti-acetyl lysine antiserum. (B) Kasumi-1 and AE9a cells treated or not with salicylate were counted by trypan-blue exclusion under light microscopy. (C) and (D) Annexin-V/7AAD staining of Kasumi-1 and AE9a cells after 24 hr of treatment with salicylate (C) or diflunisal (D). (E) and (F) Kasumi-1 and AE9a cells treated or not with salicylate (E) or diflunisal (F) were collected, and DNA content was measured by propidium iodide staining after overnight fixation in 75% ethanol. The percentage of sub-G1 cells is shown. (G) p300 overexpression in the p300 lentiviral tranduced cells were confirmed by Western Blotting. (H) and (I) Kasumi-1 cells were transduced with p300 or empty lentiviral vector and treated with or not diflunisal. Cells were counted by trypan-blue exclusion under light microscopy. (J) and (K) Annexin-V/7AAD staining (J) and subG1 population analyzed by PI staining (K) of p300 transduced Kasumi-1 cells after 6 hr of treatment of diflunisal.
Figure 5
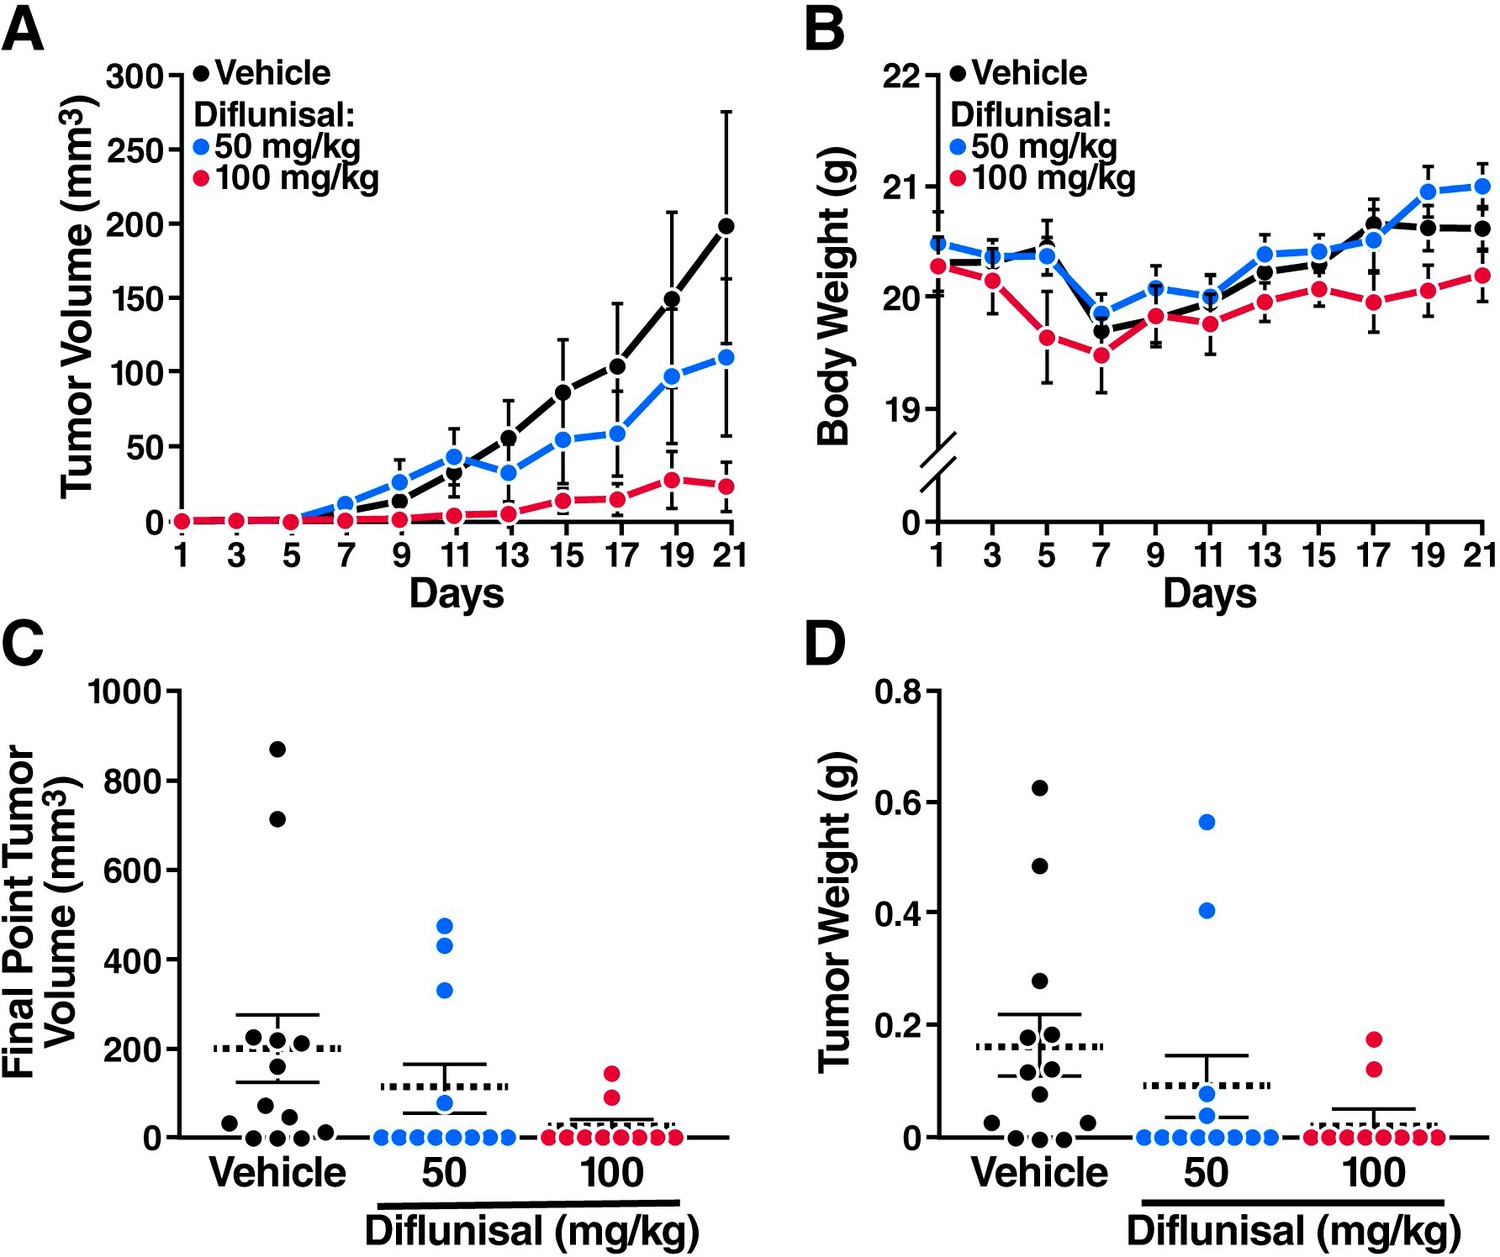
Sodium salicylate and diflunisal inhibit the growth of AML1-ETO leukemia cells in SCID mice.
The mice were inoculated with Kasumi-1 cells (3x10⁷) and, starting 3 weeks later, were treated daily with oral diflunisal (50 or 100 mg/kg) or vehicle for 3 weeks. (A) and (B) Plots of tumor volume (A) and body weight (B). (C) and (D) Tumor size (C) and body weight (D) at sacrifice after 3 weeks of treatment.
Download links
A two-part list of links to download the article, or parts of the article, in various formats.
Downloads (link to download the article as PDF)
Open citations (links to open the citations from this article in various online reference manager services)
Cite this article (links to download the citations from this article in formats compatible with various reference manager tools)
Salicylate, diflunisal and their metabolites inhibit CBP/p300 and exhibit anticancer activity
eLife 5:e11156.
https://doi.org/10.7554/eLife.11156


