Evaluating probabilistic dengue risk forecasts from a prototype early warning system for Brazil
- Institut Català de Ciències del Clima, Spain
- Instituto Nacional de Pesquisas Espaciais, Brazil
- Fundação Oswaldo Cruz, Brazil
- Universidade Estadual Paulista, Brazil
- Ministério da Saúde, Brazil
- Universidade de Brasília, Brazil
- University of Exeter, United Kingdom
- Institució Catalana de Recerca i Estudis Avançats, Spain
Figures
Figure 1
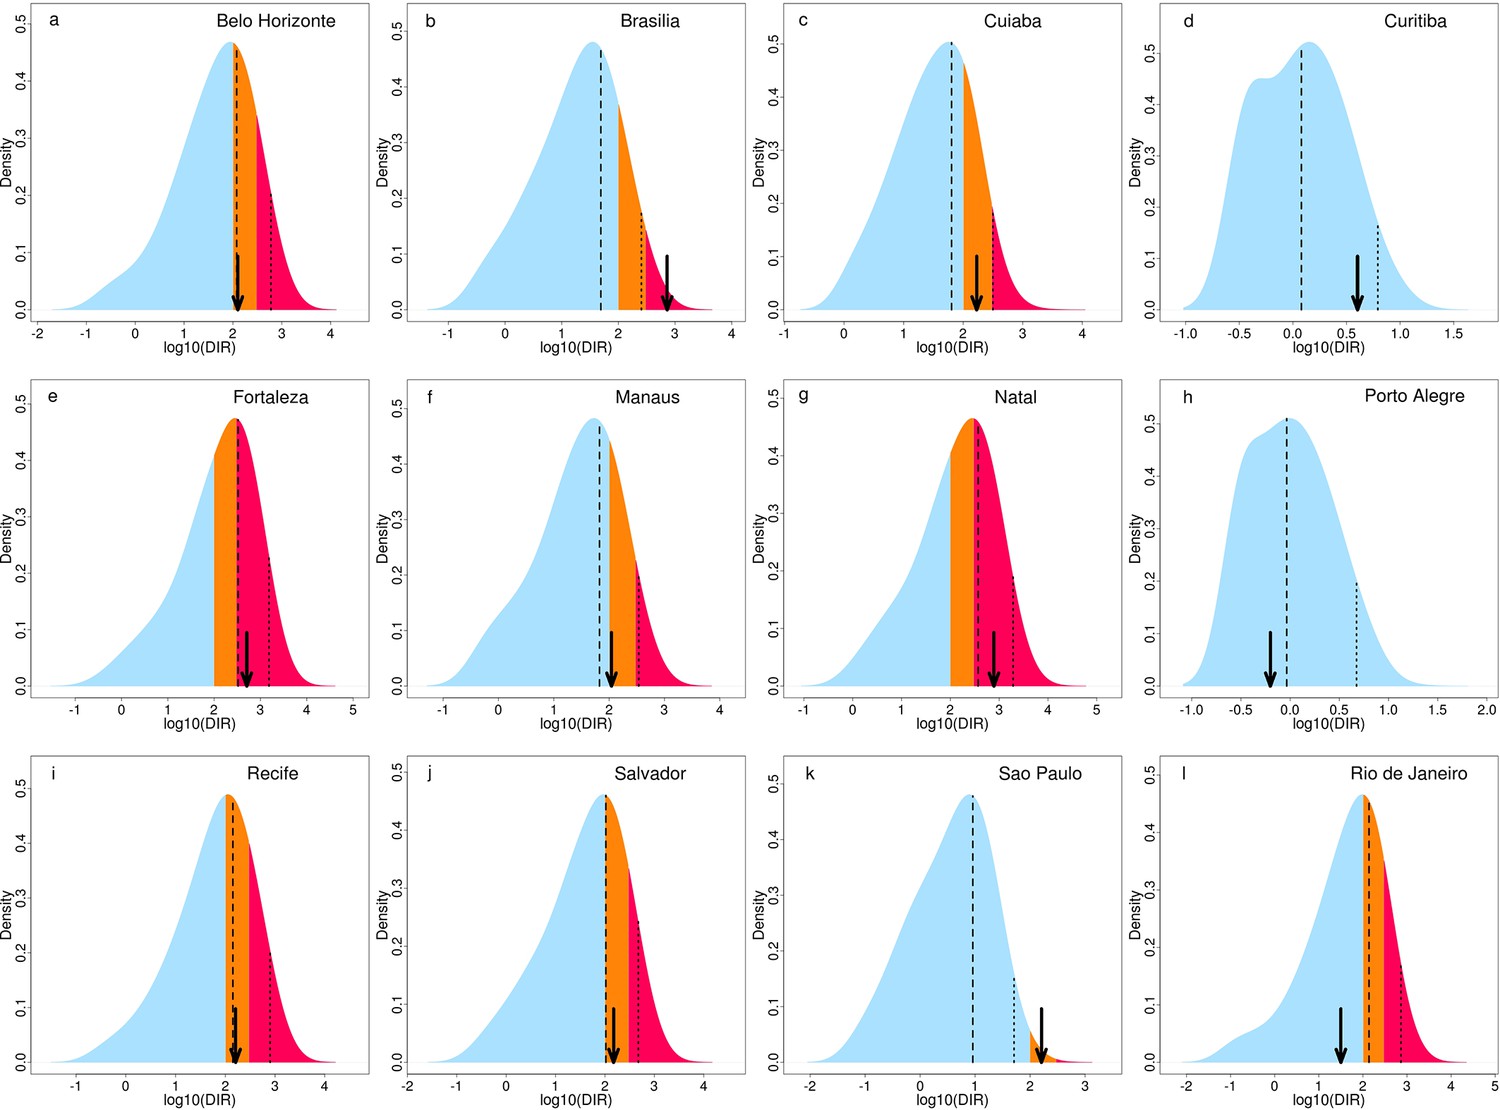
Predictive distributions and observed DIR for June 2014 for host microregions.
Posterior predictive distributions of dengue incidence rates (DIR) (base-10 logarithmic scale) for June 2014 showing the probability of low risk (blue), medium risk (orange) and high risk (pink) for June 2014, in the microregions hosting the World Cup tournament: (a) Belo Horizonte, (b) Brasília, (c) Cuiabá, (d) Curitiba, (e) Fortaleza, (f) Manaus, (g) Natal, (h) Porto Alegre, (i) Recife, (j) Salvador, (k) São Paulo and (l) Rio de Janeiro. Observed DIR indicated by black arrow. Posterior predictive mean and upper 95% prediction (credible) interval of the distribution indicated by a dashed and dotted line, respectively.
Figure 2
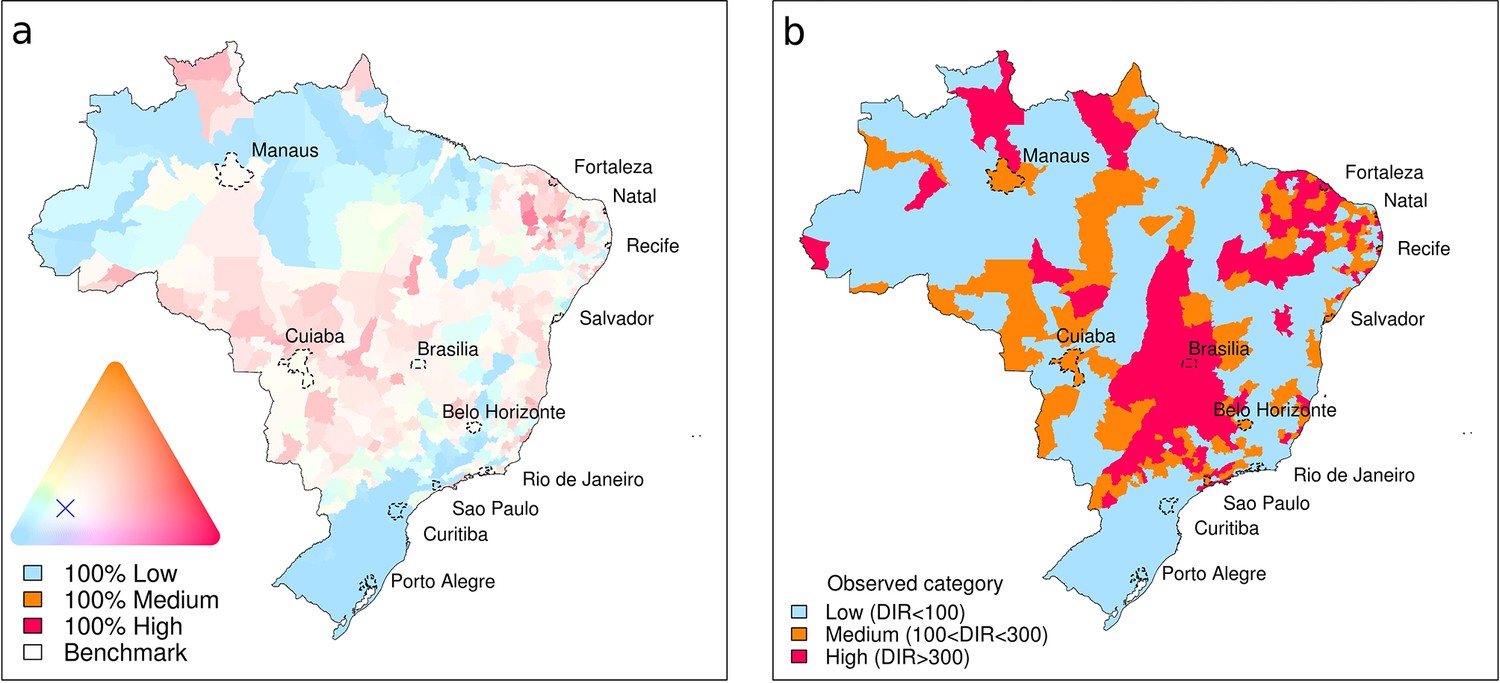
Probabilistic dengue forecast and observed dengue incidence rate categories for Brazil, June 2014.
(a) Probabilistic dengue forecast for June 2014. The continuous colour palette (ternary phase diagram) conveys the probabilities assigned to low-risk, medium-risk, and high-risk dengue categories. Category boundaries defined as 100 cases per 100,000 inhabitants and 300 cases per 100,000 inhabitants. The greater the colour saturation, the more certain is the forecast of a particular outcome. Strong red shows a higher probability of high dengue risk. Strong blue indicates a higher probability of low dengue risk. Colours close to white indicate a forecast similar to the benchmark (long-term average distribution of dengue incidence in Brazil, June, 2000–2013: pL=68%, pM=16%, pH=16%), marked by a cross. (b) Observed dengue incidence rate (DIR) categories for June, 2014.
Figure 3
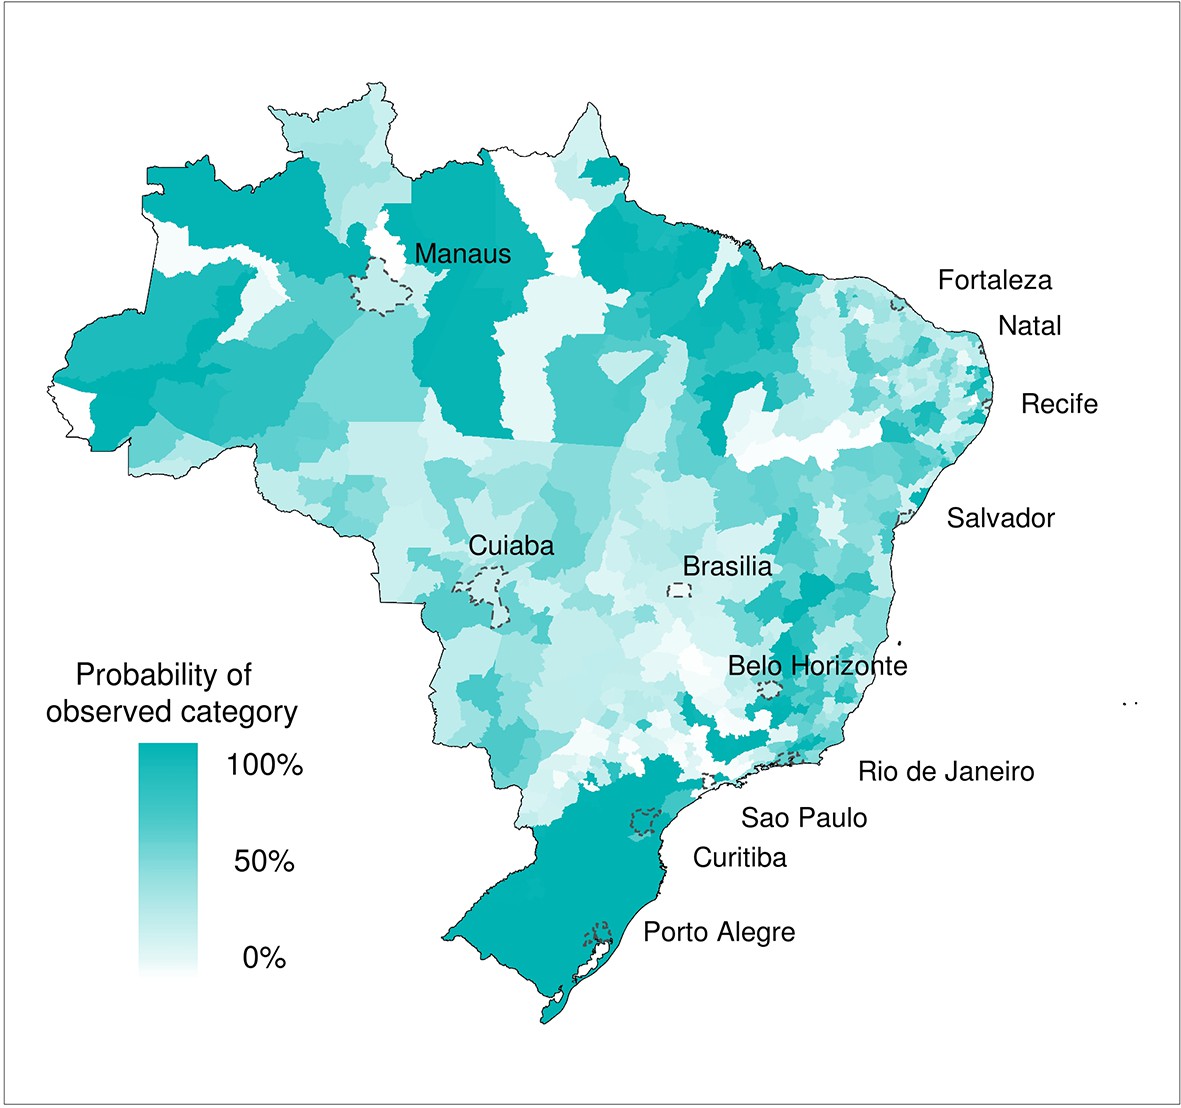
Forecast probability of observed DIR categories for June 2014.
Probability of observing the correct DIR category (low, medium and high). The graduated colour bar represents the probability of observing any given category (ranging from 0%, pale colours, to 100%, deep colours).
Figure 4
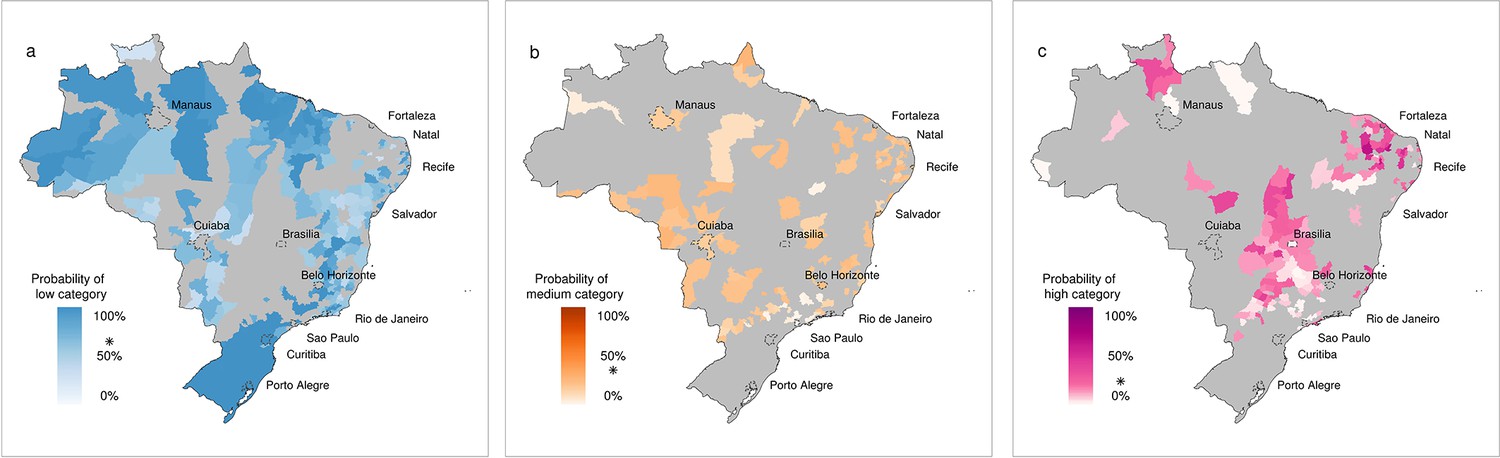
Forecast probability of observed DIR in the low, medium and high category for June 2014.
Forecast probability given that (a) low, (b) medium and (c) high DIR was observed. Grey areas indicate that other DIR categories were observed and are therefore not considered. The graduated colour bar represents the probability of observing the given category (ranging from 0%, pale colours, to 100%, deep colours). Note, the alarm trigger thresholds are marked with a star (*). For (a) low risk warnings, pL > 68%, for (b) medium risk warnings, pM > 32% and for (c) high risk warnings, pH > 18%. Colour bars are weighted, with increased saturation beyond the alarm trigger threshold to reflect the correct assignation of warnings.
Figure 5
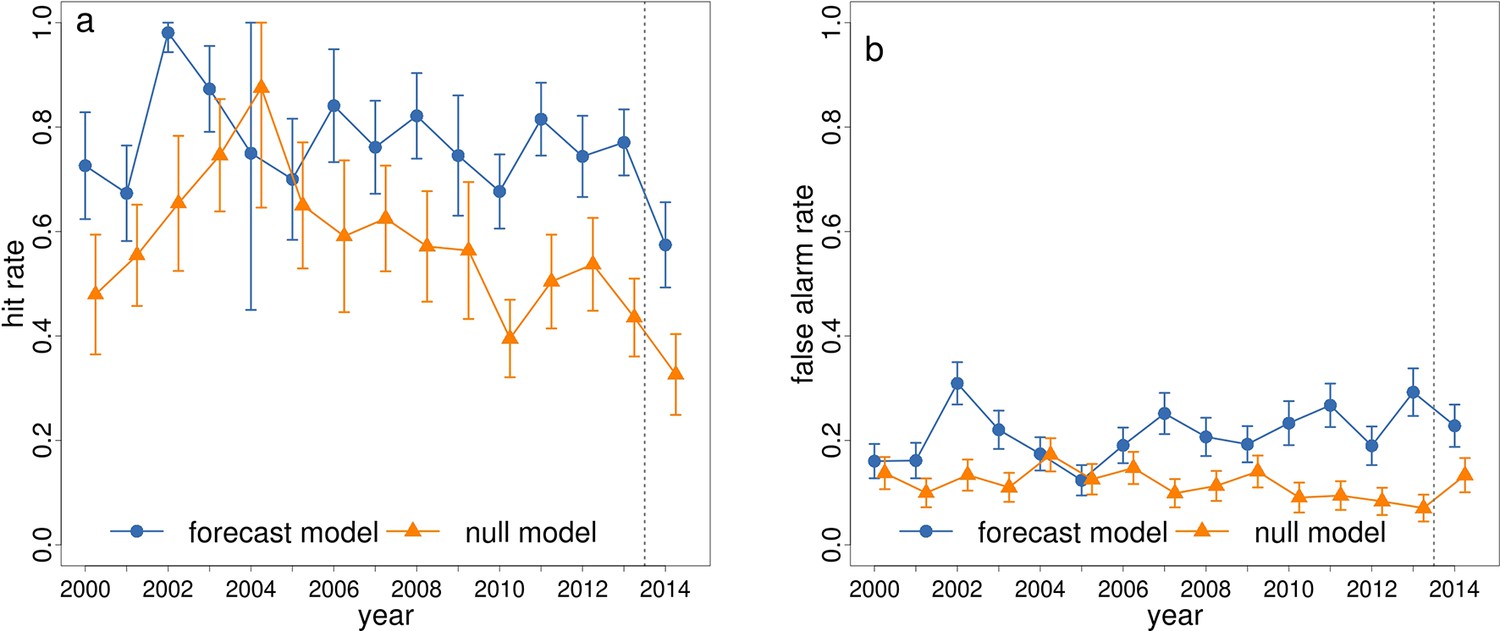
Hit rate and false alarm rate for predicting dengue in the high risk category for June 2000–2014 using the forecast model and null model.
Comparison of (a) hit rates and (b) false alarm rates for the event of observed DIR exceeding the high risk epidemic threshold (300 cases per 100,000 inhabitants) using the probabilistic category forecast model (blue circles) and the null model (orange triangles) for June 2000–2014. The vertical bars around each point represent the 95% confidence intervals. The vertical dotted line separates the leave-one-out cross validation results (2000–2013) from the true predicted results for 2014.
Figure 6
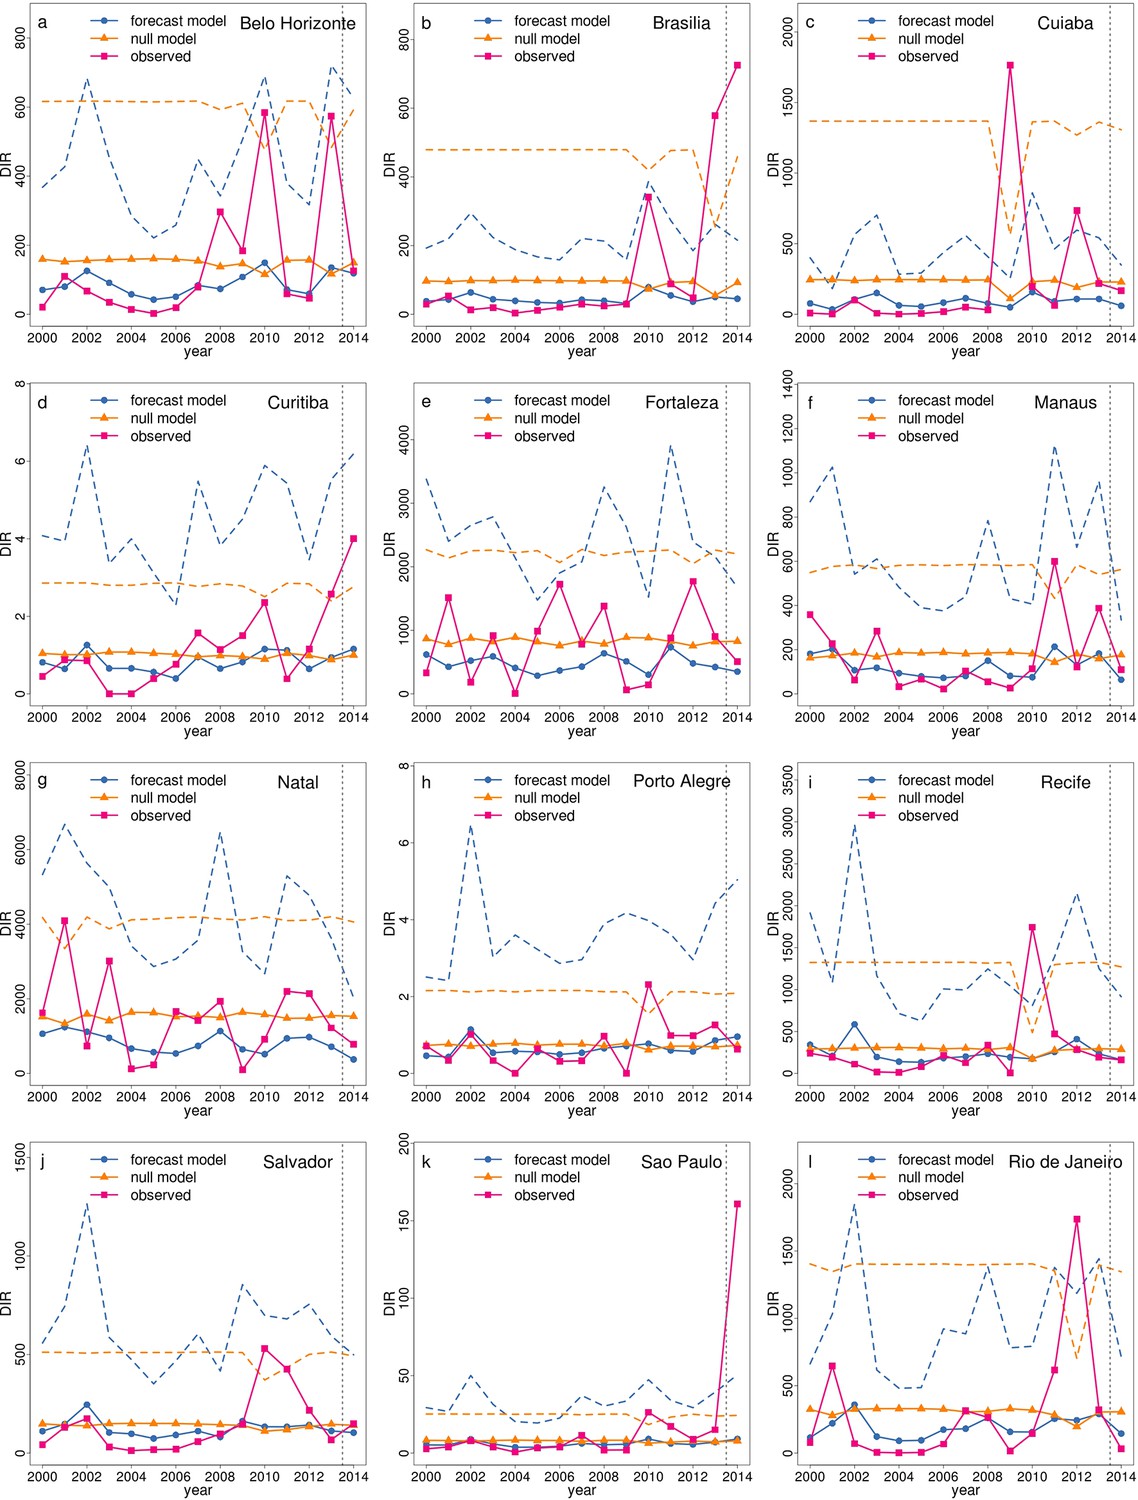
Time series of observed and predicted DIR for June 2000–2014 for host microregions.
Observed DIR (pink squares), posterior mean DIR (blue circles) and upper 95% prediction (credible) interval from forecast model (blue dashed line) and mean DIR (orange triangles) and upper 95% prediction interval (orange dashed line) from null model, June 2000–2014 in the host microregions (a) Belo Horizonte, (b) Brasília, (c) Cuiabá, (d) Curitiba, (e) Fortaleza, (f) Manaus, (g) Natal, (h) Porto Alegre, (i) Recife, (j) Salvador, (k) São Paulo and (l) Rio de Janeiro. The vertical dotted line separates the leave-one-out cross validation results (2000–2013) from the true predicted results for 2014.
Author response image 1
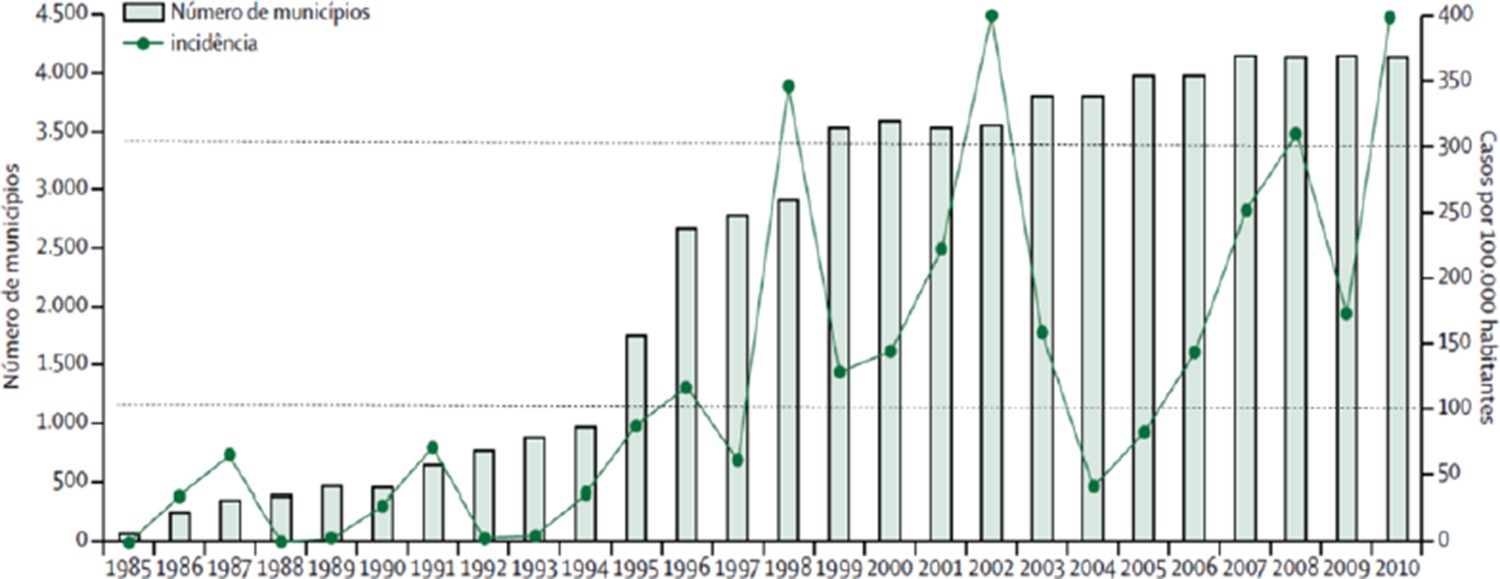
Dengue incidence and number of municipalities reporting dengue cases in Brazil, 1985-2010 (Source: Barreto et al., 2011).
https://doi.org/10.7554/eLife.11285.012Tables
Table 1
Dengue risk forecast warnings and corresponding observations for June, 2014 for host microregions. Dengue risk forecast warnings and observed category for June 2014, for the microregions hosting the World Cup tournament. Low risk was defined as fewer than 100 cases per 100,000 inhabitants, medium risk as between 100 and 300 cases per 100,000 inhabitants, and high risk as greater than 300 cases per 100,000 inhabitants. If the probability of low risk was less than 68%, a medium risk forecast warning was issued. If the probability of high risk was concurrently greater than 18%, the forecast warning was upgraded to high risk. The observed DIR value is included. Microregions where the observed DIR fell into the same category as forecast (e.g. the forecast warning category was high and the observed DIR category was high), are shaded.
| Microregion | Forecast warning | Probability (pL, pM, pH) | Observed DIR | Observed category |
|---|---|---|---|---|
| Belo Horizonte | Medium | p(65%, 24%, 11%) | 126 | Medium |
| Brasília | Low | p(73%, 20%, 7%) | 725 | High |
| Cuiabá | Low | p(71%, 22%, 7%) | 168 | Medium |
| Curitiba | Low | p(100%, 0%, 0%) | 4 | Low |
| Fortaleza | High | p(34%, 20%, 46%) | 507 | High |
| Manaus | Medium | p(63%, 25%, 12%) | 110 | Medium |
| Natal | High | p(32%, 20%, 48%) | 780 | High |
| Porto Alegre | Low | p(100%, 0%, 0%) | 1 | Low |
| Recife | High | p(57%, 24%, 19%) | 161 | Medium |
| Salvador | Medium | p(56%, 27%, 17%) | 149 | Medium |
| São Paulo | Low | p(99%, 1%, 0%) | 161 | Medium |
| Rio de Janeiro | Medium | p(62%, 25%, 13%) | 32 | Low |
Table 2
Summary of contingency table results for observed DIR exceeding the epidemic risk threshold. Summary of contingency table results for observed DIR exceeding the high risk epidemic threshold (300 cases per 100,000 inhabitants) using the probabilistic category forecast model and the null model (mean DIR, June 2000–2013) for June 2014.
| Performance measures | Forecast model probabilistic | Null model seasonal mean |
|---|---|---|
| Hit | 81 | 46 |
| False alarm (type I error) | 94 | 55 |
| Miss (type II error) | 60 | 95 |
| Correct rejection | 318 | 357 |
| Hit rate | 57% | 33% |
| False alarm rate | 23% | 13% |
| Miss rate | 43% | 67% |
Table 3
The four possible outcomes for categorical forecasts of a binary event.
Event observed | ||||
|---|---|---|---|---|
| Yes | No | Total | ||
Forecast warning issued | Yes | Hit (a) | False alarm (b) | a+b |
| No | Miss (c) | Correct rejection (d) | c+d | |
| Total | a+c | b+d | a+b+c+d=n | |
Download links
A two-part list of links to download the article, or parts of the article, in various formats.
Downloads (link to download the article as PDF)
Open citations (links to open the citations from this article in various online reference manager services)
Cite this article (links to download the citations from this article in formats compatible with various reference manager tools)
Evaluating probabilistic dengue risk forecasts from a prototype early warning system for Brazil
eLife 5:e11285.
https://doi.org/10.7554/eLife.11285


