Optimal level activity of matrix metalloproteinases is critical for adult visual plasticity in the healthy and stroke-affected brain
- University of Göttingen, Germany
- University Medical Center, Germany
- German Primate Center, Germany
Figures
Figure 1
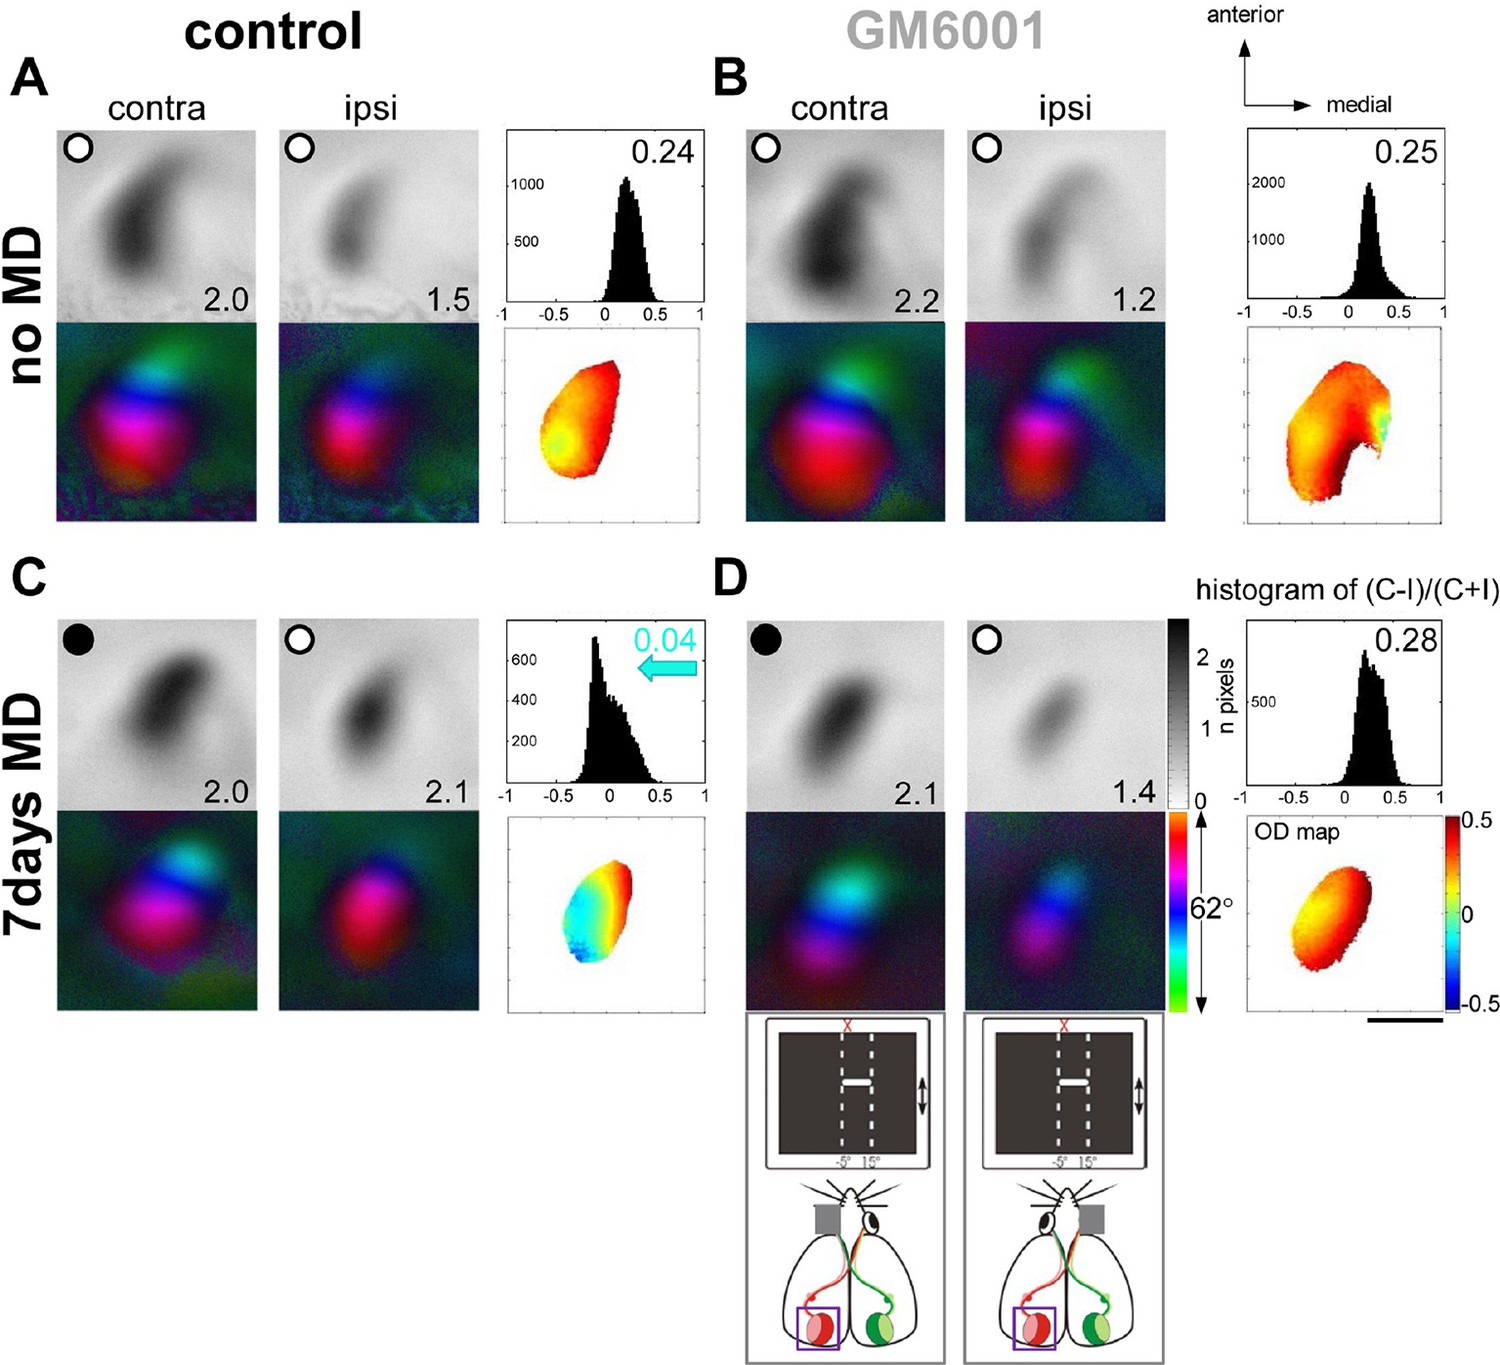
Treatment with the MMP-inhibitor GM6001 during MD period prevented OD-plasticity in adult mouse V1.
Representative examples of optically recorded activity and polar maps in V1 of both vehicle-treated mice (control, A, C) and animals treated with the MMP-inhibitor GM6001 (GM6001, B, D), before (no MD, A, B) and after monocular deprivation (7 days MD, C, D). V1-maps after visual stimulation of the contra- (contra) and ipsilateral (ipsi) eye in the binocular region of V1. Top panels (A–D) display grayscale-coded response magnitude maps (V1-activation) and their quantification on the right: histogram of (C-I)/(C+I). V1-activation is illustrated as fractional change in reflection ×10-4. Average V1-activation is illustrated as a number at the lower right corner of each magnitude map; the average OD-index (ODI) as a number in the upper right corner of the histograms. Bottom panels represent color-coded polar maps of retinotopy, and the color-coded OD-map. In both control and GM6001-treated mice without MD, V1-activity was dominated by input from the contralateral eye: activity patches after contralateral eye stimulation were darker than after ipsilateral eye stimulation, the average ODI was positive, and warm colors prevailed in the OD-map, illustrating contralateral dominance. After 7 days of MD, OD-plasticity occurred only in control (C) but not in GM6001-treated mice (D): in control mice, both eyes activated V1 rather equally strong, the OD-histogram was shifted to the left (blue arrow in C), and colder colors appeared in the OD-map. In contrast, in GM6001-treated mice, the deprived (contralateral) eye continued to dominate V1, the ODI was not reduced and warm colors still dominated the OD-map. Scale bar: 1mm.
Figure 2
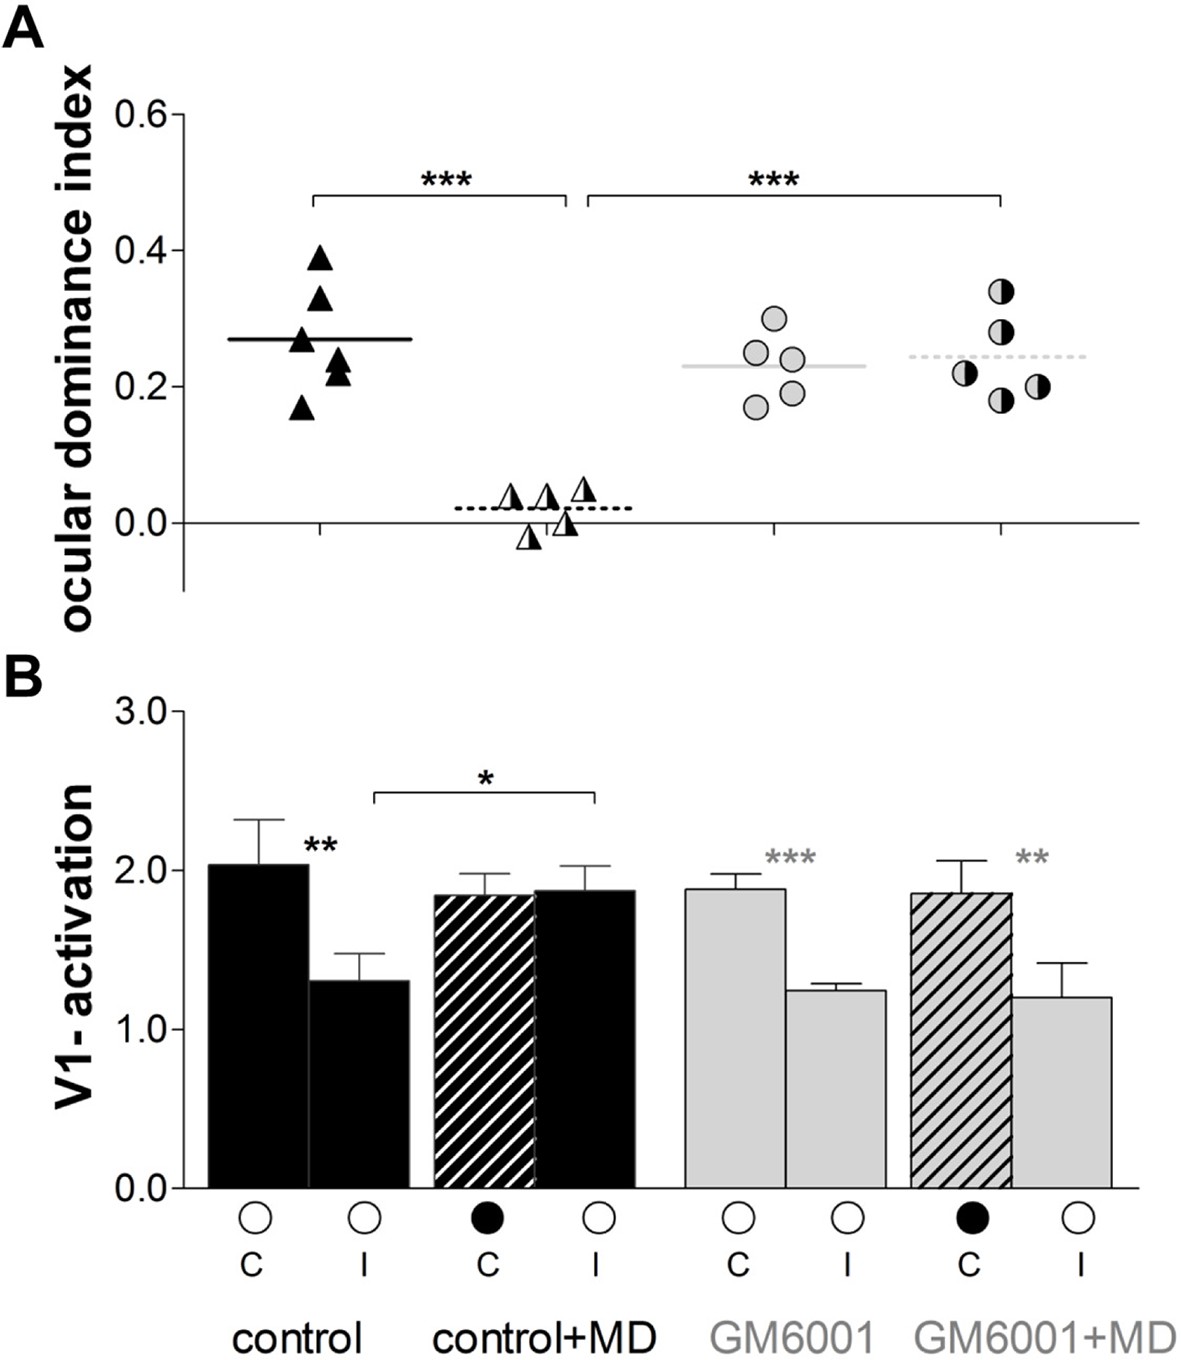
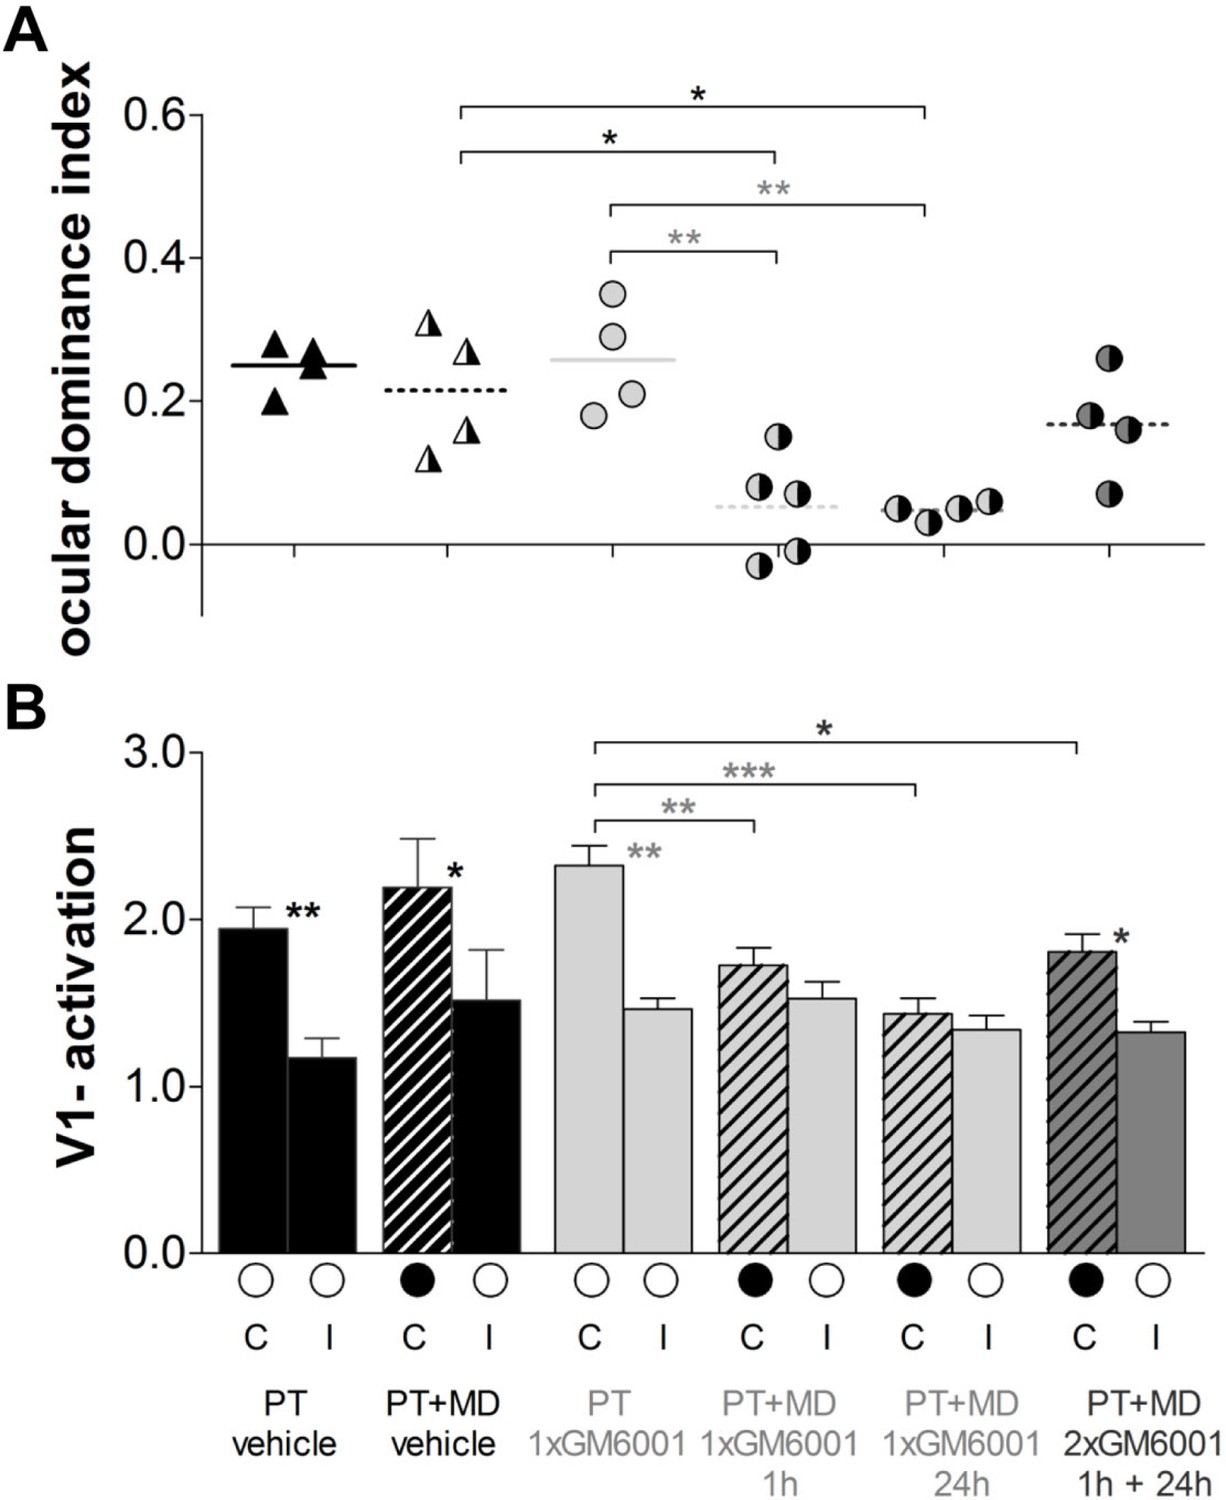
Inhibition of MMPs during the MD-period prevented adult OD-plasticity.
(A) Optically imaged OD-indices in animals without MD (solid symbols) and after 7 days of MD (right half of symbols is black) in control (vehicle-treated, black) and in GM6001-treated mice (grey). Symbols illustrate ODI-values of individual cases; means are marked by horizontal lines. (B) V1-activation elicited by stimulation of the contralateral (C) or ipsilateral (I) eye in animals before (open circles) and after MD (closed eye marked as a black filled circle, and striped bar). The OD-shift in control mice was mediated by an increase of open eye responses in V1, while no OD-shift and no changes in V1-actiavtion were observed in GM6001-treated mice after MD. Mean ± SEM, *p<0.05, **p<0.01, ***p<0.001. ANOVA followed by multiple comparisons with Bonferroni correction was used in A; two-tailed t-test was used in B.
-
Figure 2—source data 1
Ocular dominance index and V1-activation individual values for Figure 2.
- https://doi.org/10.7554/eLife.11290.005
Figure 3
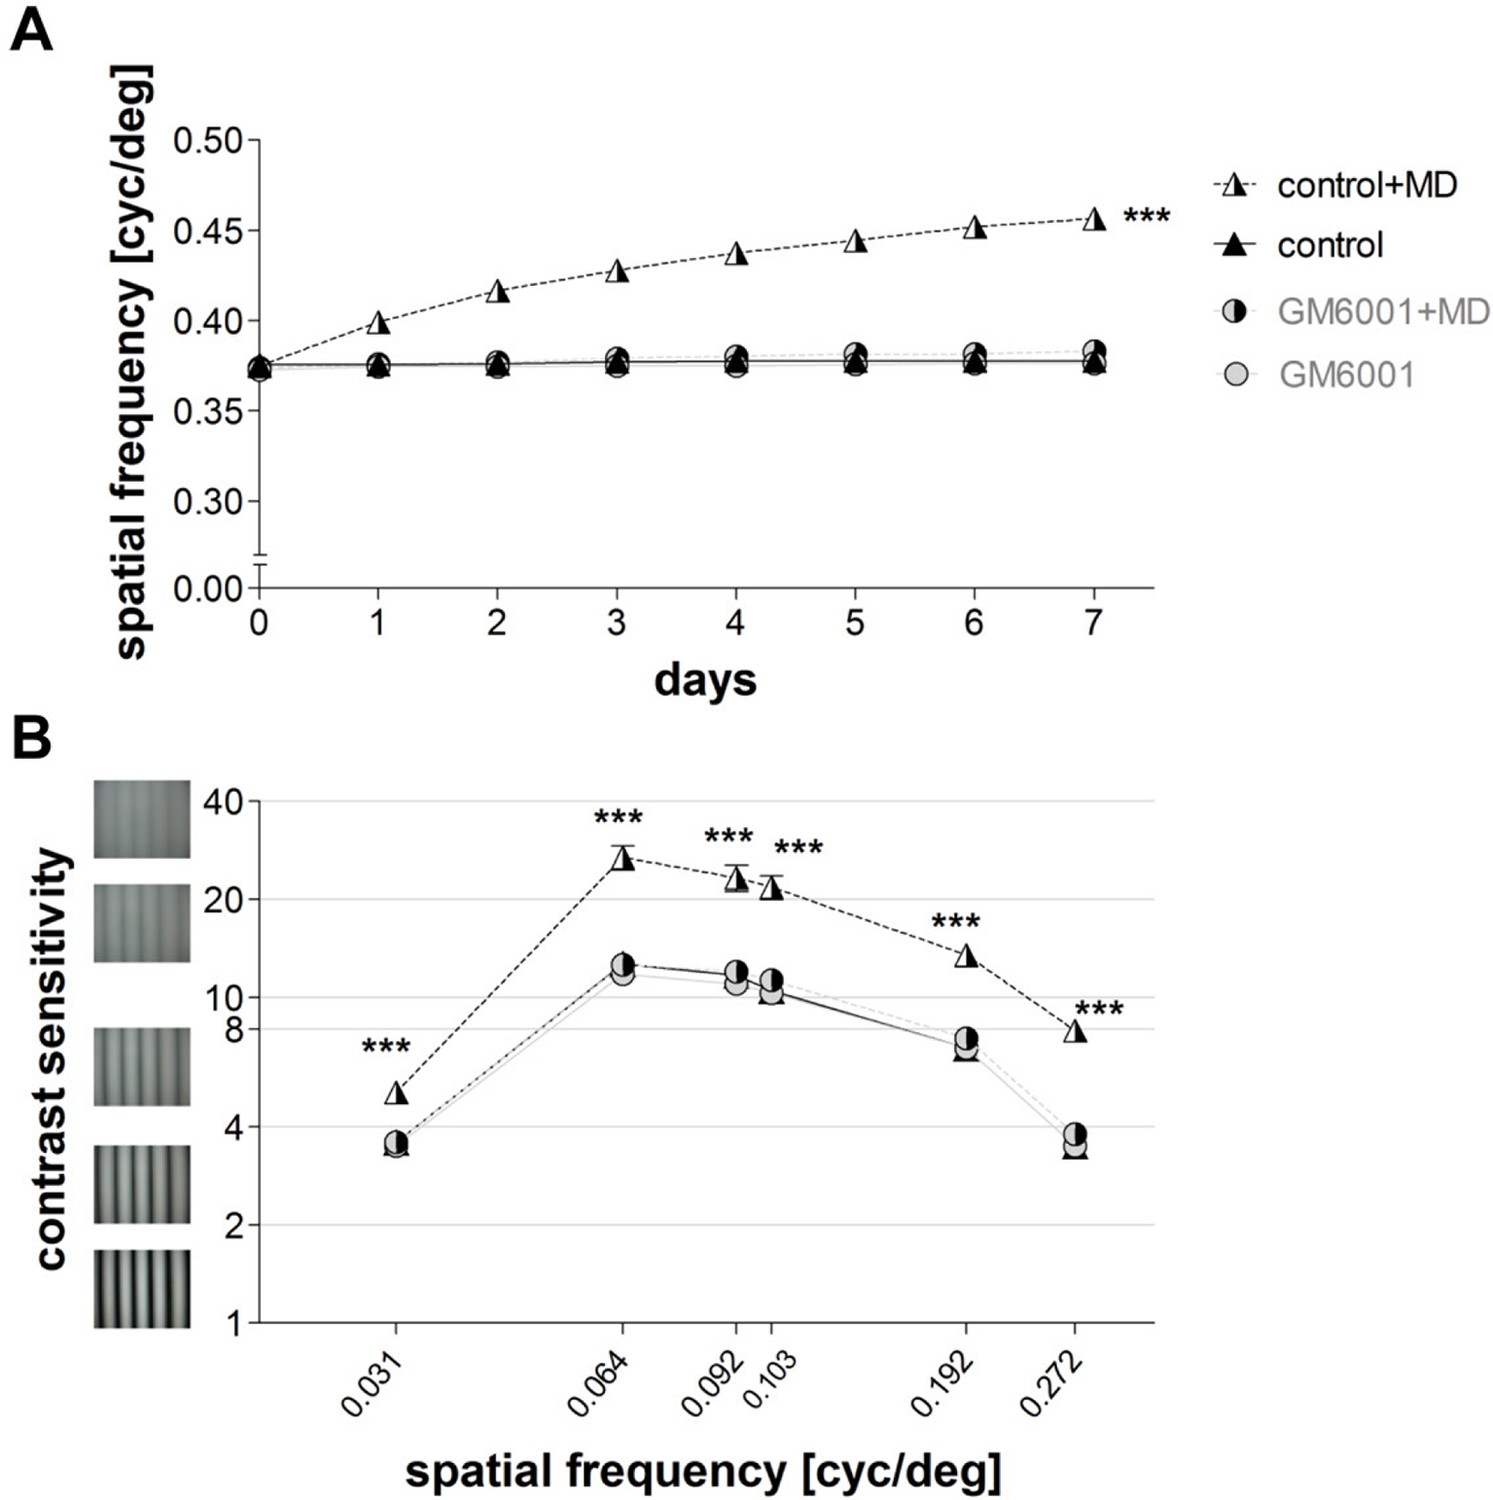
Inhibition of MMPs prevented experience-enabled enhancements of both the spatial frequency (A) and contrast sensitivity (B) thresholds of the optomotor reflex of the open eye in adult mice after MD.
Values of vehicle-treated (control) mice are displayed in black (triangles), values of GM6001-treated mice in grey (circles); values of animals with monocular deprivation (+MD) are marked by displaying the right half of the symbol in black. (A) Spatial frequency threshold values in cycles/degree (cyc/deg), measured in the optomotor setup plotted against days. (B) Contrast sensitivity values on day 7 at 6 different spatial frequencies. Mean ± SEM; ***p<0.001, ns p>0.05. ANOVA followed by multiple comparisons with Bonferroni correction was used; two-tailed t-test was used within the group analysis in A.
-
Figure 3—source data 1
Optomotry measured spatial frequency and contrast sensitivity thresholds individual values for Figure 3.
- https://doi.org/10.7554/eLife.11290.007
Figure 4
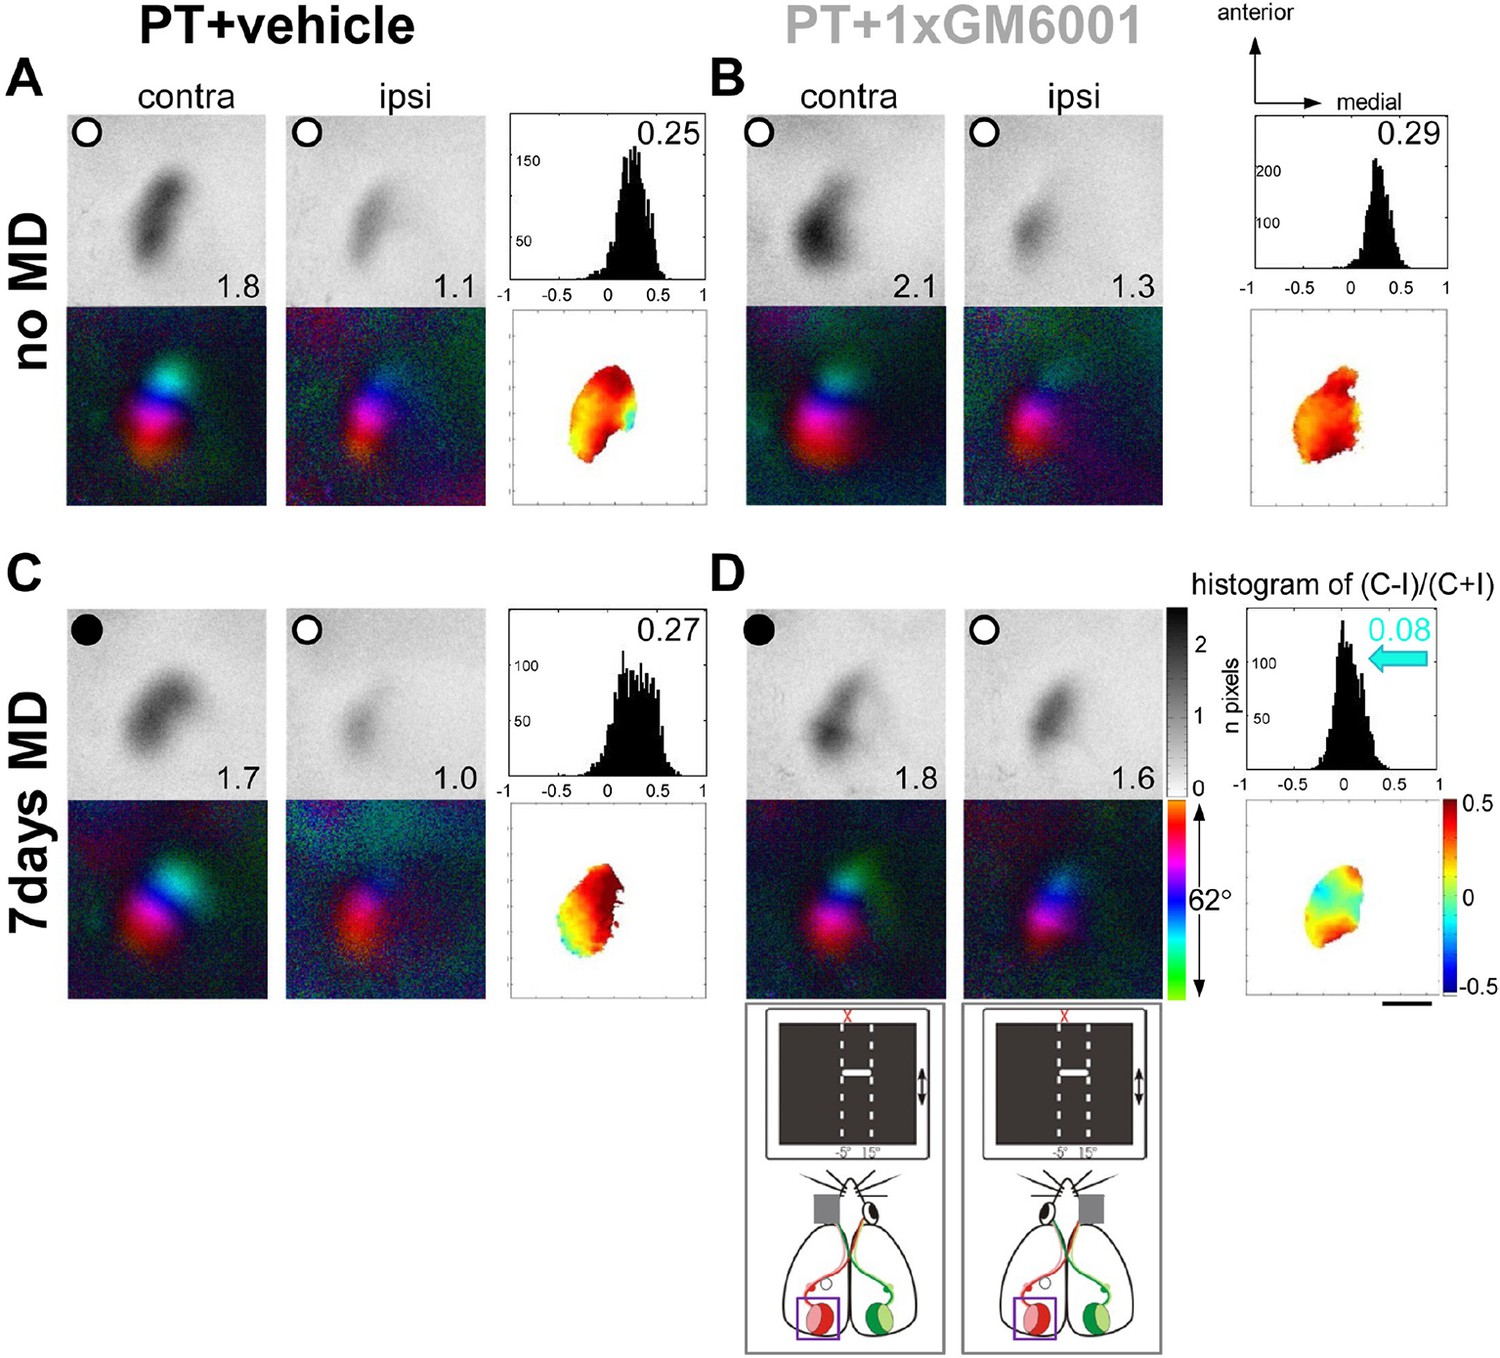
A single GM6001-treatment rescued OD-plasticity in V1 after a stroke in S1.
Representative examples of optically recorded activity and polar maps in V1 of both vehicle- (PT+vehicle, A, C) and single GM6001-treated mice (PT+1xGM6001, B, D), before (no MD, A, B) and after 7 days of MD (7days MD, C, D). V1-maps after visual stimulation of the contra- (contra) and ipsilateral (ipsi) eye in the binocular region in V1. Figure layout and data display as in Figure 1. In both vehicle- (A) and GM6001-treated PT-lesioned mice without MD (B), V1 activation was dominated by the contralateral eye: activity patches induced by contralateral eye stimulation were darker than after ipsilateral eye stimulation, the average ODI was positive, and warm colors dominated the OD-map. (C) While 7 days of MD did not induce an OD-shift in vehicle-treated PT mice, and deprived (contra) eye patches still dominated V1, a single treatment with GM6001 rescued OD-plasticity in PT mice (D): both eyes activated V1 about equally strong, the histogram of ODIs shifted to the left (blue arrow) and colder colors appeared in the OD-map. Scale bar: 1mm
Figure 5
Brief MMP-inhibition after a stroke in S1 rescued experience-dependent plasticity in V1.
Quantification of the imaging data, layout and data display as in Figure 2. (A) Optically imaged OD-indices in mice without MD and after 7 days of MD in vehicle-treated 1h after PT (black) mice and single GM6001-treated (PT 1xGM6001; PT+MD 1xGM6001 1 hr and PT+MD 1xGM6001 24 h, light grey) or two-times GM6001-treated (PT+MD 2xGM6001 1 h+24 h, dark grey) after PT mice. (B) V1-activation elicited by stimulation of the contralateral (C) or ipsilateral (I) eye in animals before (open circles) and after MD. V1-activation did not change after MD in vehicle-treated PT mice. In contrast, 1xGM6001 (either 1 h or 24 h) but not 2xGM6001 (1 h+24 h) treatment rescued OD-plasticity after the PT-lesion (A). There was a significant reduction in deprived eye responses in V1 in the GM6001- but not vehicle-treated mice after MD (B). Mean ± SEM, *p<0.05, **p<0.01, ***p<0.001. ANOVA followed by multiple comparisons with Bonferroni correction was used; two-tailed t-test was used within the group analysis in B.
-
Figure 5—source data 1
Ocular dominance indexes and V1-activation individual values for Figure 5.
- https://doi.org/10.7554/eLife.11290.011
Figure 6
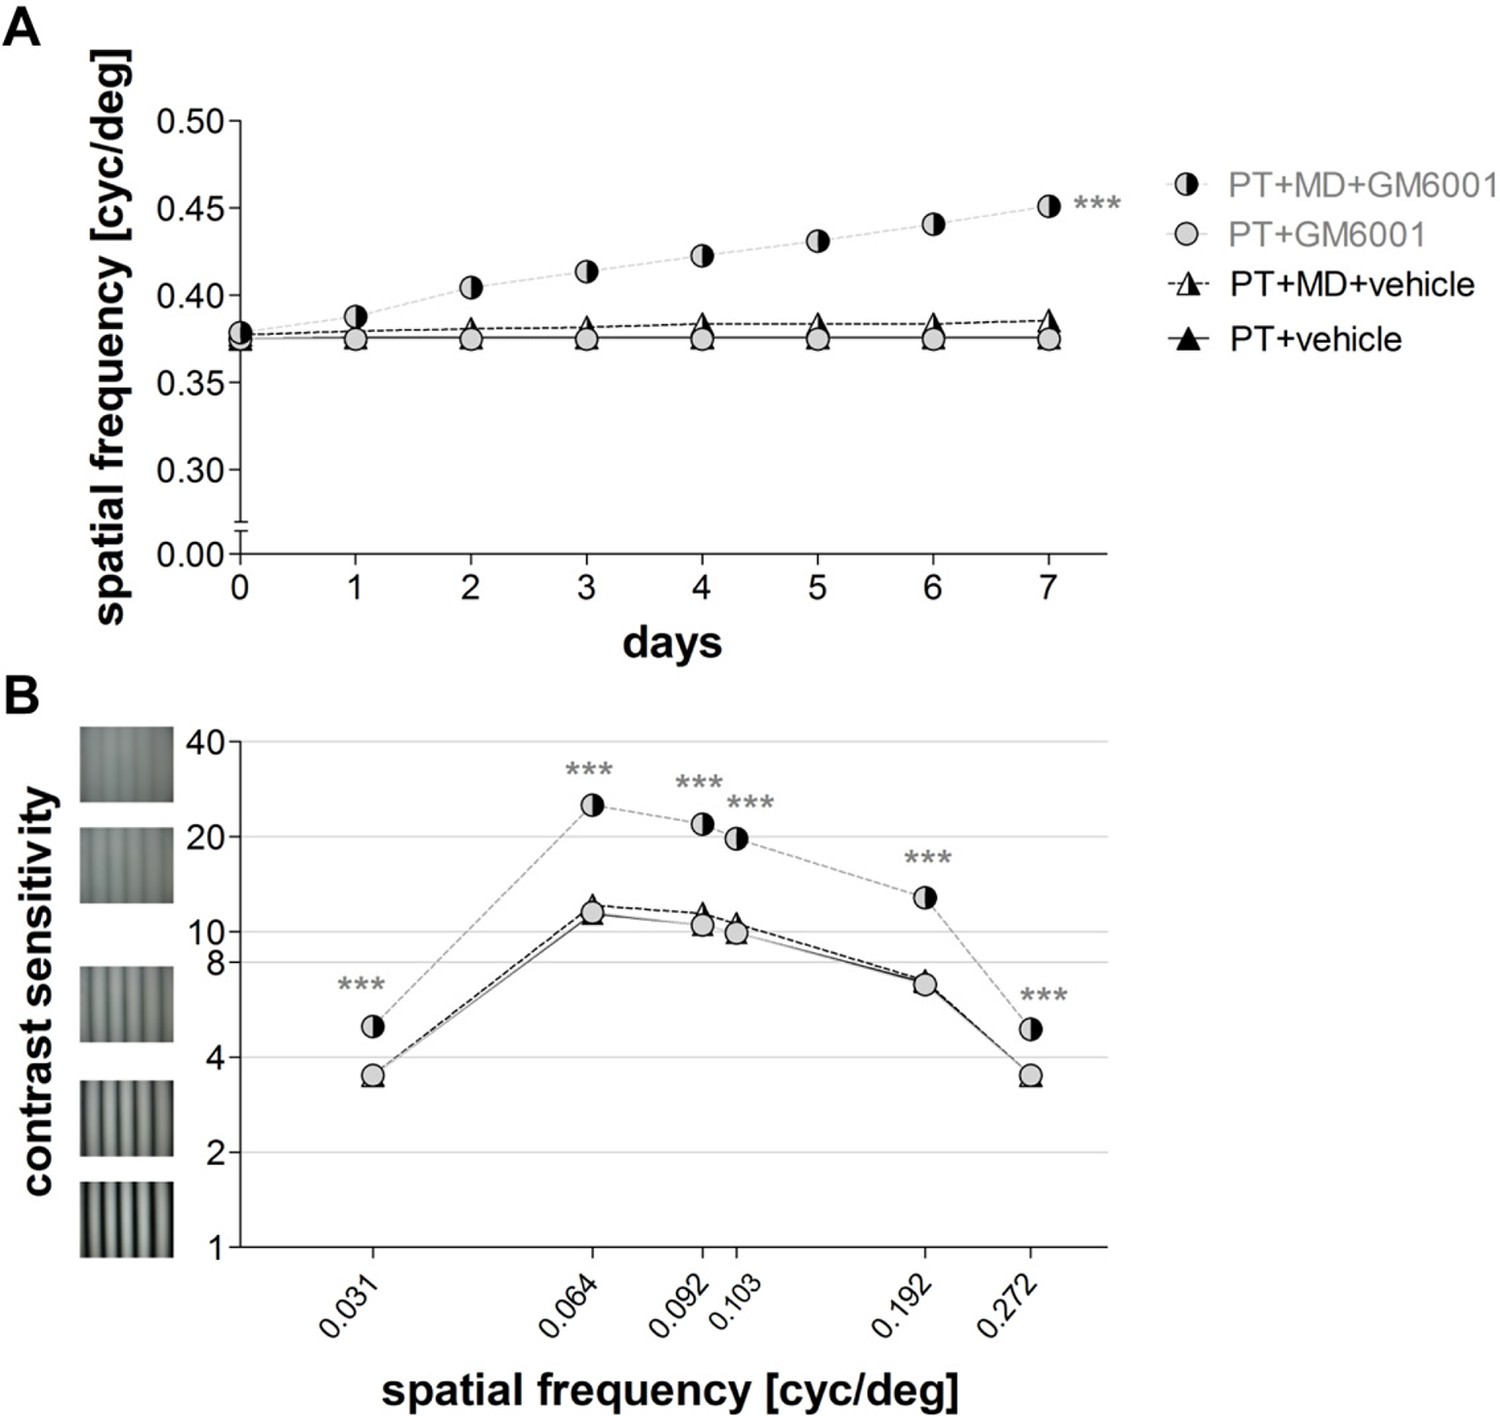
Brief inhibition of MMPs after induction of a photothrombotic lesion in S1 rescued experience-enabled enhancements of both the spatial frequency (A) and contrast sensitivity (B) thresholds of the optomotor reflex in adult mice.
Values of vehicle-treated PT-mice are shown in black and values of GM6001-treated mice in grey. Layout and data presentation as in figure 3. Mean ± SEM, ***p<0.001, ns p>0.05. ANOVA followed by multiple comparisons with Bonferroni correction and two-tailed t-test was used in A within the group analysis.
-
Figure 6—source data 1
Optomotry-measured the spatial frequency and contrast sensitivity individual values for Figure 6.
- https://doi.org/10.7554/eLife.11290.013
Tables
Table 1
Optomotry-measured contrast sensitivity improvements after MD
| Contrast sensitivity | ||||
|---|---|---|---|---|
| Day 0 | ||||
| Spatial frequency (cyc/deg) | Control | GM6001 | Control+MD | GM6001+MD |
| 0.031 | 3.6 ± 0.04 | 3.5 ± 0.02 | 3.5 ± 0.01 | 3.5 ± 0.01 |
| 0.064 | 12.7 ± 0.52 | 11.8 ± 0.16 | 11.6 ± 0.23 | 12.0 ± 0.15 |
| 0.092 | 11.7 ± 0.51 | 10.9 ± 0.18 | 10.7 ± 0.22 | 11.3 ± 0.17 |
| 0.103 | 10.3 ± 0.54 | 10.2 ± 0.10 | 10.0 ± 0.16 | 10.6 ± 0.12 |
| 0.192 | 6.9 ± 0.07 | 6.9 ± 0.12 | 7.0 ± 0.11 | 6.8 ± 0.05 |
| 0.272 | 3.5 ± 0.04 | 3.5 ± 0.02 | 3.5 ± 0.01 | 3.5 ± 0.01 |
| Day 7 | ||||
| 0.031 | 3.6 ± 0.04 | 3.5 ± 0.02 | 5.1 ± 0.17 | 3.6 ± 0.02 |
| 0.064 | 12.7 ± 0.47 | 11.8 ± 0.18 | 26.9 ± 2.35 | 12.6 ± 0.29 |
| 0.092 | 11.7 ± 0.44 | 11.0 ± 0.15 | 23.3 ± 2.17 | 12.0 ± 0.22 |
| 0.103 | 10.5 ± 0.49 | 10.3 ± 0.10 | 21.8 ± 1.83 | 11.3 ± 0.17 |
| 0.192 | 7.0 ± 0.08 | 7.0 ± 0.10 | 13.5 ± 1.08 | 7.5 ± 0.21 |
| 0.272 | 3.5 ± 0.04 | 3.5 ± 0.01 | 4.9 ± 0.17 | 3.8 ± 0.25 |
Table 2
Optomotry-measured contrast sensitivity improvements after MD
| Contrast sensitivity | ||||
|---|---|---|---|---|
| Day 0 | ||||
| Spatial frequency (cyc/deg) | PT+vehicle | PT+GM6001 | PT+MD vehicle | PT+MD GM6001 |
| 0.031 | 3.5 ± 0.02 | 3.5 ± 0.04 | 3.5 ± 0.02 | 3.5 ± 0.02 |
| 0.064 | 11.4 ± 0.35 | 11.4 ± 0.32 | 11.8 ± 0.57 | 11.8 ± 0.15 |
| 0.092 | 10.5 ± 0.36 | 10.5 ± 0.34 | 10.7 ± 0.39 | 11.0 ± 0.16 |
| 0.103 | 9.8 ± 0.26 | 9.9 ± 0.28 | 10.0 ± 0.37 | 10.0 ± 0.32 |
| 0.192 | 6.9 ± 0.12 | 6.7 ± 0.09 | 6.7 ± 0.13 | 6.5 ± 0.26 |
| 0.272 | 3.5 ± 0.03 | 3.5 ± 0.04 | 3.4 ± 0.01 | 3.5 ± 0.02 |
| Day 7 | ||||
| 0.031 | 3.5 ± 0.02 | 3.5 ± 0.04 | 3.5 ± 0.01 | 5.0 ± 0.11 |
| 0.064 | 11.4 ± 0.39 | 11.5 ± 0.32 | 12.1 ± 0.42 | 25.2 ± 1.53 |
| 0.092 | 10.5 ± 0.36 | 10.5 ± 0.34 | 11.4 ± 0.28 | 21.9. ± 1.14 |
| 0.103 | 9.9 ± 0.24 | 9.9 ± 0.28 | 10.6 ± 0.26 | 19.7 ± 1.25 |
| 0.192 | 6.9 ± 0.11 | 6.8 ± 0.07 | 7.0 ± 0.02 | 12.8 ± 0.91 |
| 0.272 | 3.5 ± 0.02 | 3.5 ± 0.04 | 3.5 ± 0.02 | 4.9 ± 0.12 |
Download links
A two-part list of links to download the article, or parts of the article, in various formats.
Downloads (link to download the article as PDF)
Open citations (links to open the citations from this article in various online reference manager services)
Cite this article (links to download the citations from this article in formats compatible with various reference manager tools)
Optimal level activity of matrix metalloproteinases is critical for adult visual plasticity in the healthy and stroke-affected brain
eLife 4:e11290.
https://doi.org/10.7554/eLife.11290


