ABHD17 proteins are novel protein depalmitoylases that regulate N-Ras palmitate turnover and subcellular localization
- University of British Columbia, Canada
Figures
Figure 1
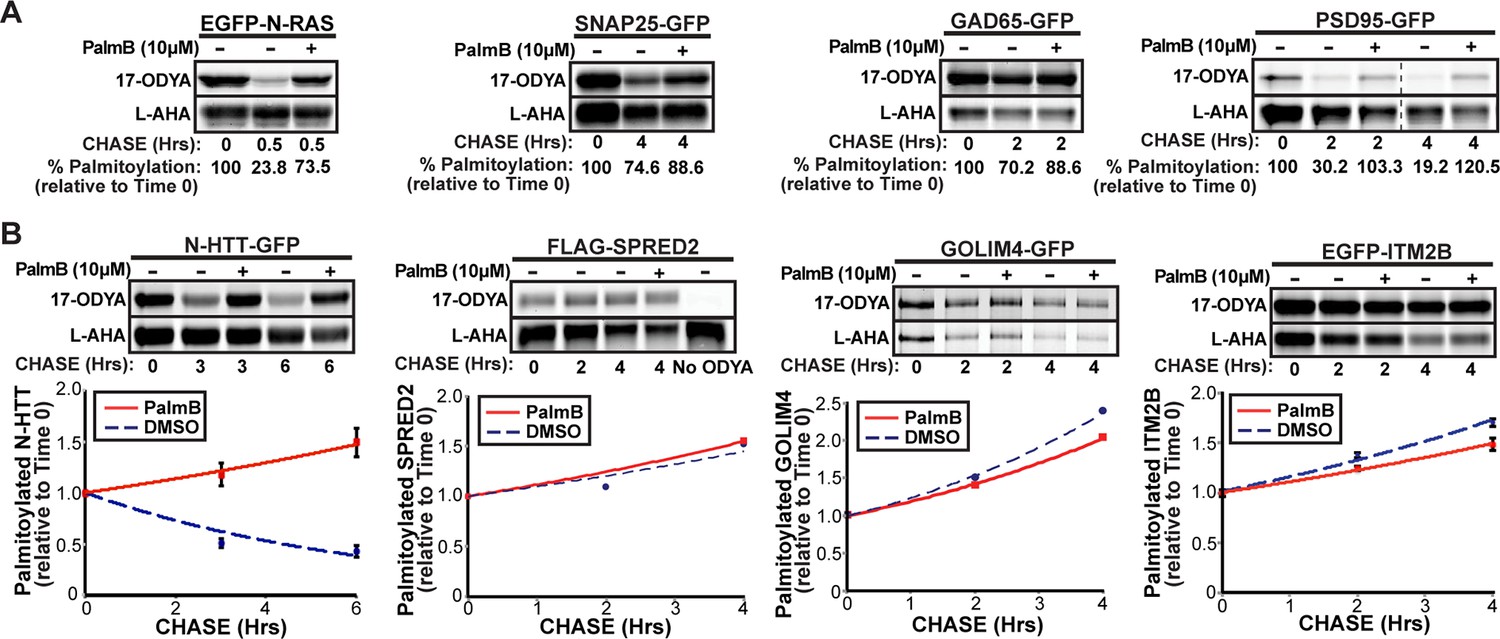
Dual-click chemistry labeling reveals differences in protein depalmitoylation dynamics.
(A) Pulse-chase analysis of established palmitoyl-proteins (N-Ras, SNAP25, GAD65, PSD95) by dual-click chemistry in the presence of DMSO (-) or 10 μM PalmB (+). Representative in-gel fluorescence scans illustrate dual detection of 17-ODYA (palmitate analogue) and L-AHA (methionine analogue) using Alexa Fluor 488 and Alexa Fluor 647, respectively. Dashed line indicates cropping of a single gel. n = 2 per substrate. (B) Pulse-chase analysis of palmitate turnover on N-HTT, SPRED2, GOLIM4, and ITM2B by dual-click chemistry as described in (A). Upper panels: representative in-gel fluorescence scans; Lower panels: Time course of substrate depalmitoyation in DMSO- and PalmB-treated cells after normalizing 17-ODYA to L-AHA signals at each chase time. n = 2, mean ± SEM. 17-ODYA, 17-octadecynoic acid; L-AHA, L-azidohomoalanine; SEM, standard error of the mean.
Figure 2 with 1 supplement
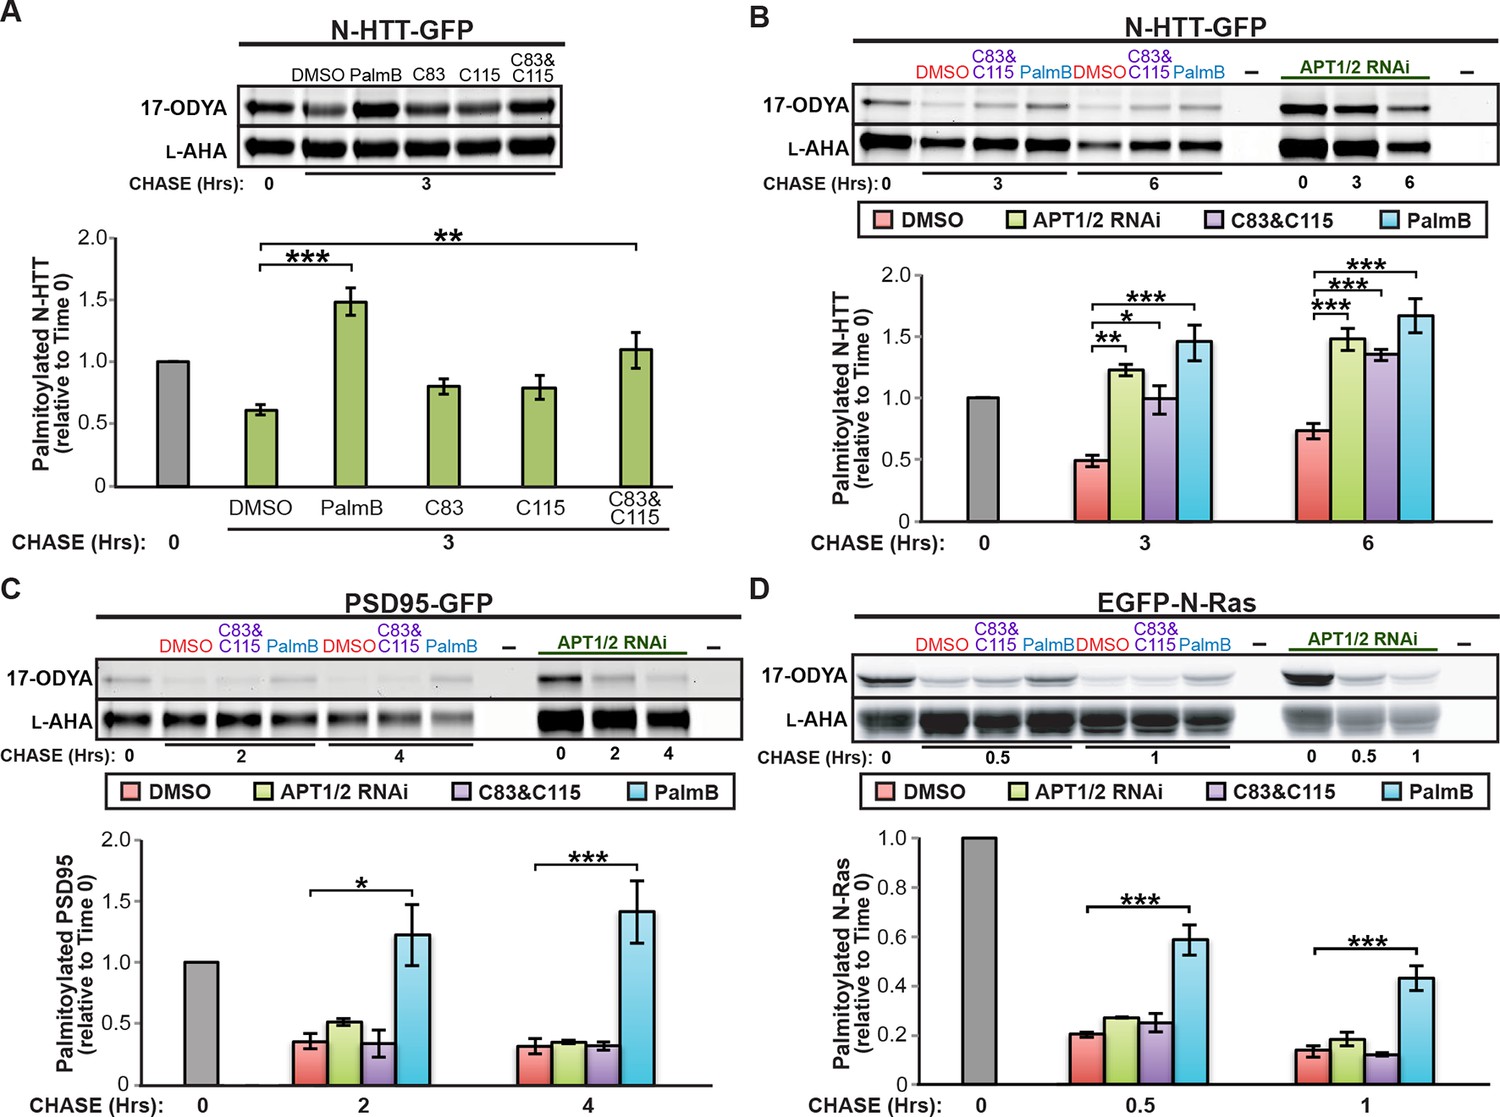
Downregulation of APT1 and APT2 inhibits HTT depalmitoylation but does not affect palmitate turnover on PSD95 or N-Ras.
(A) Pulse-chase analysis of N-HTT palmitoylation in the presence of DMSO, 10 μM PalmB, 10 μM APT1-selective inhibitor C83, and/or 10 μM APT2-selective inhibitor C115, as described in Figure 1. n = 3, mean ± SEM. (B-D) Pulse-chase analysis of (B) N-HTT, (C) PSD95, and (D) N-Ras after APT1 and APT2 knockdown (“APT1/2 RNAi”), treatment with DMSO, treatment with 10 μM C83 and 10 μM C115, or treatment with 10 μM PalmB, as described in Figure 1. n = 3, mean ± SEM. *p < 0.05; **p < 0.01; ***p < 0.001. SEM, standard error of the mean.
Figure 2—figure supplement 1
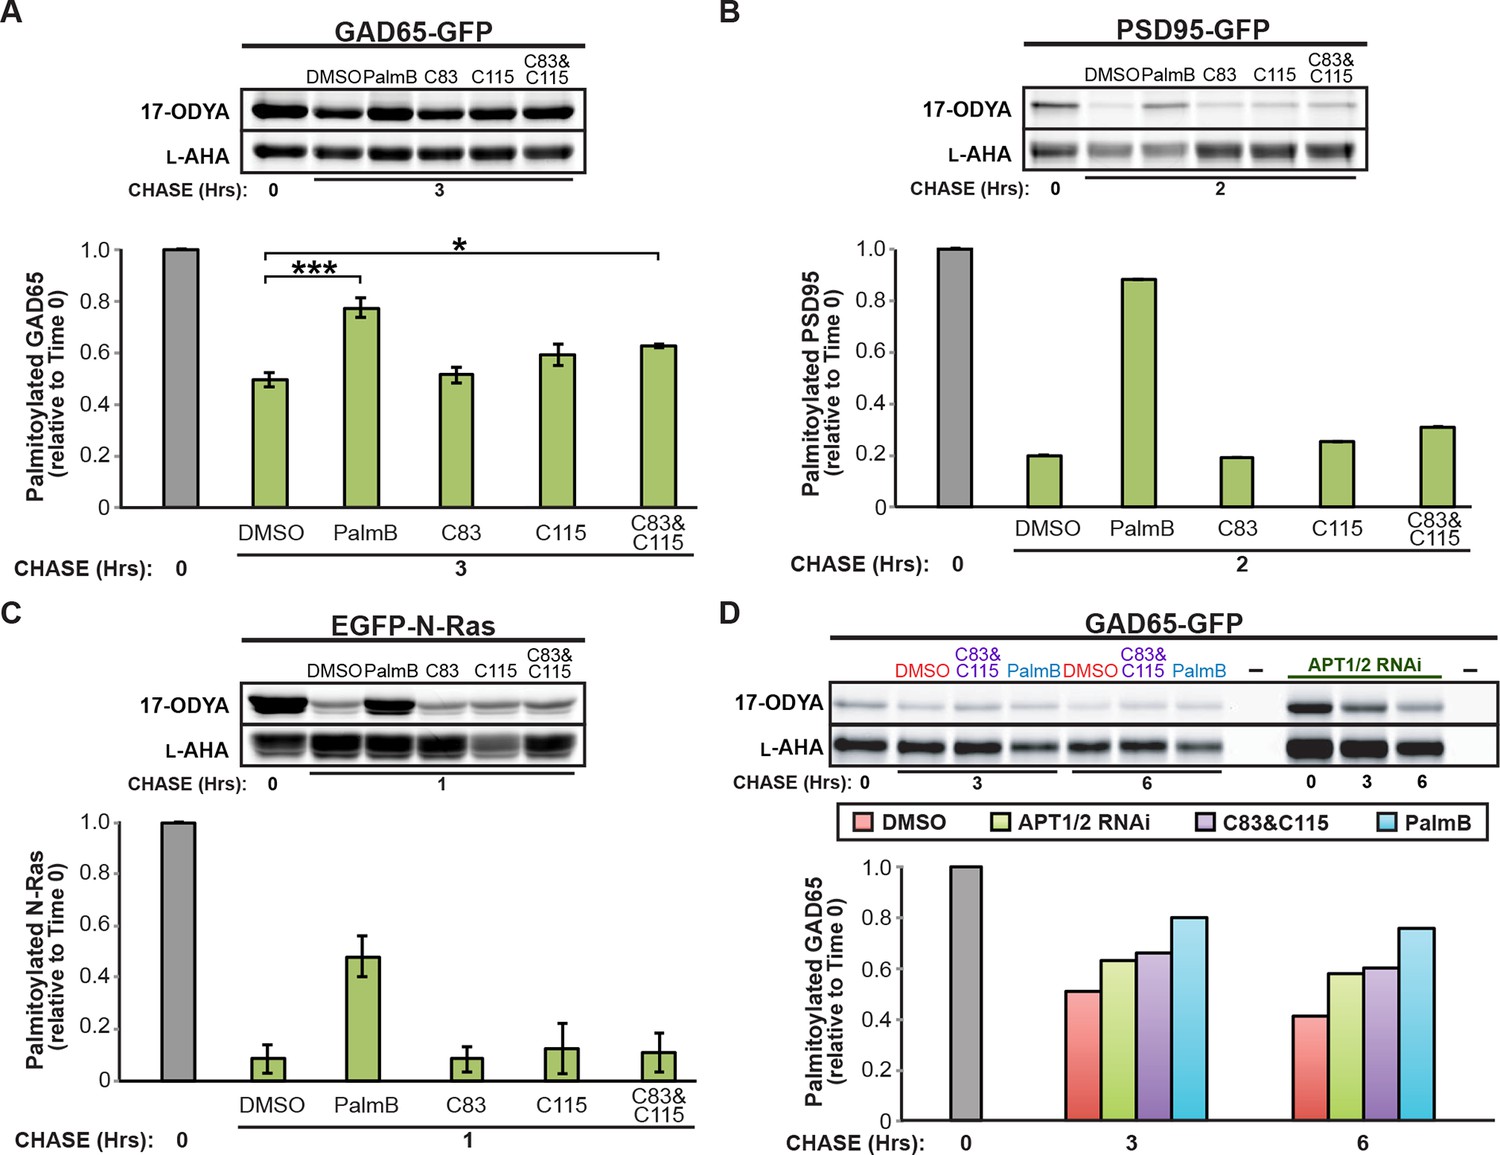
Downregulation of APT1 and APT2 inhibits GAD65 depalmitoylation but does not affect palmitate turnover on PSD95 or N-Ras.
(A-C) Pulse-chase analysis of (A) GAD65, (B) PSD95, and (C) N-Ras palmitoylation in the presence of DMSO, 10 μM PalmB, 10 μM APT1-selective inhibitor C83, and/or 10 μM APT2-selective inhibitor C115, as described in Figure 2. (D) Pulse-chase analysis of GAD65 after APT1 and APT2 knockdown (“APT1/2 RNAi”), treatment with DMSO, treatment with 10 μM C83 and 10 μM C115, or treatment with 10 μM PalmB, as described in Figure 2. *p < 0.05; ***p < 0.001.
Figure 3 with 1 supplement
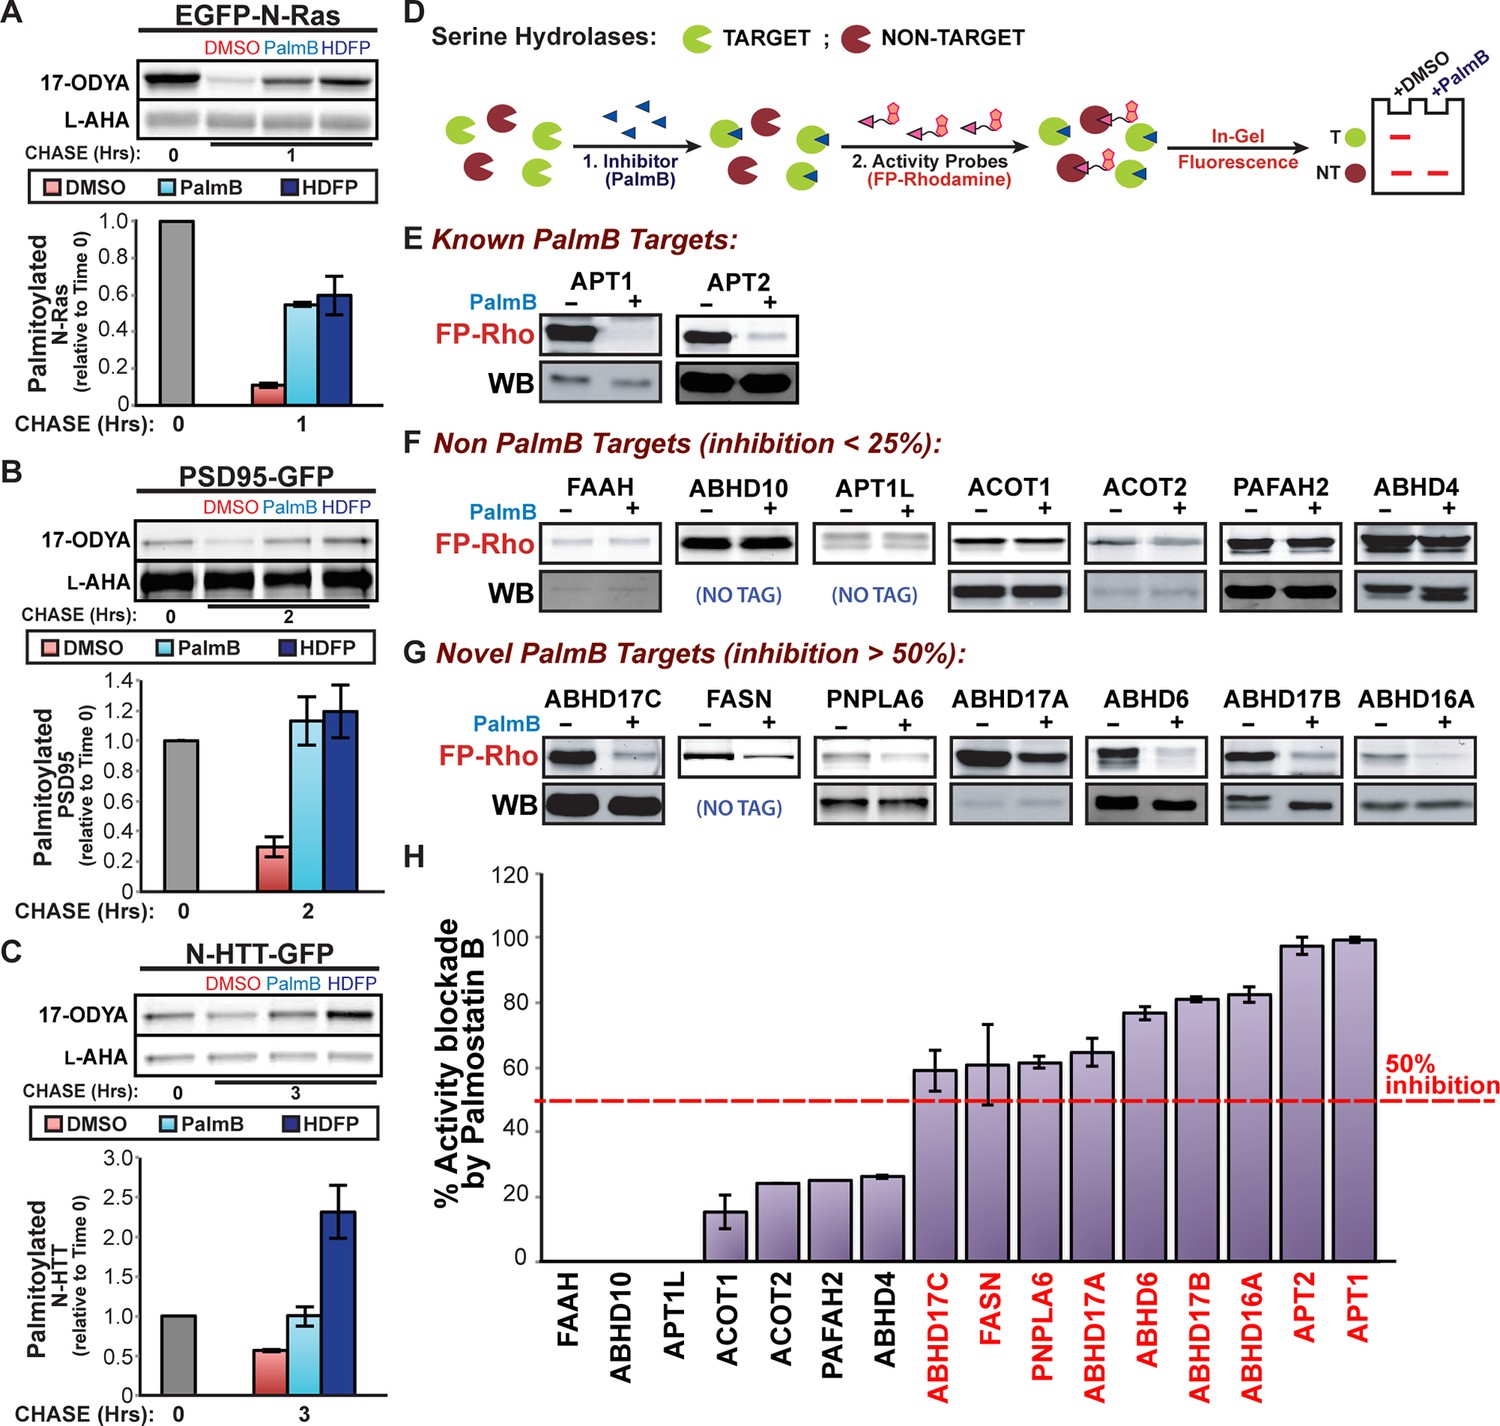
Shared targets of Palmostatin B and HDFP identified by competitive activity-based protein profiling.
(A-C) Pulse-chase analysis of (A) N-Ras, (B) PSD95, and (C) N-HTT in the presence of DMSO, 10 μM PalmB or 20 μM lipase inhibitor HDFP as described in Figure 1. n = 3 (DMSO and PalmB) or 2 (HDFP), mean ± SEM. (D) Schematic diagram of the competitive ABPP assay used in this study. (E-G) Competitive ABPP of PalmB by in-gel fluorescence (FP-Rho). 16 HDFP targets were incubated with 2 μM FP-Rho in the presence (+) or absence (-) of 10 μM PalmB. Western blots (WB) show reduced FP-Rho labeling is not due to protein loss. (H) Percent inhibition of each HDFP target by PalmB. n = 3, mean ± SEM. Candidate depalmitoylases (>50% inhibition by PalmB) are highlighted in red. SEM, standard error of the mean,
Figure 3—figure supplement 1
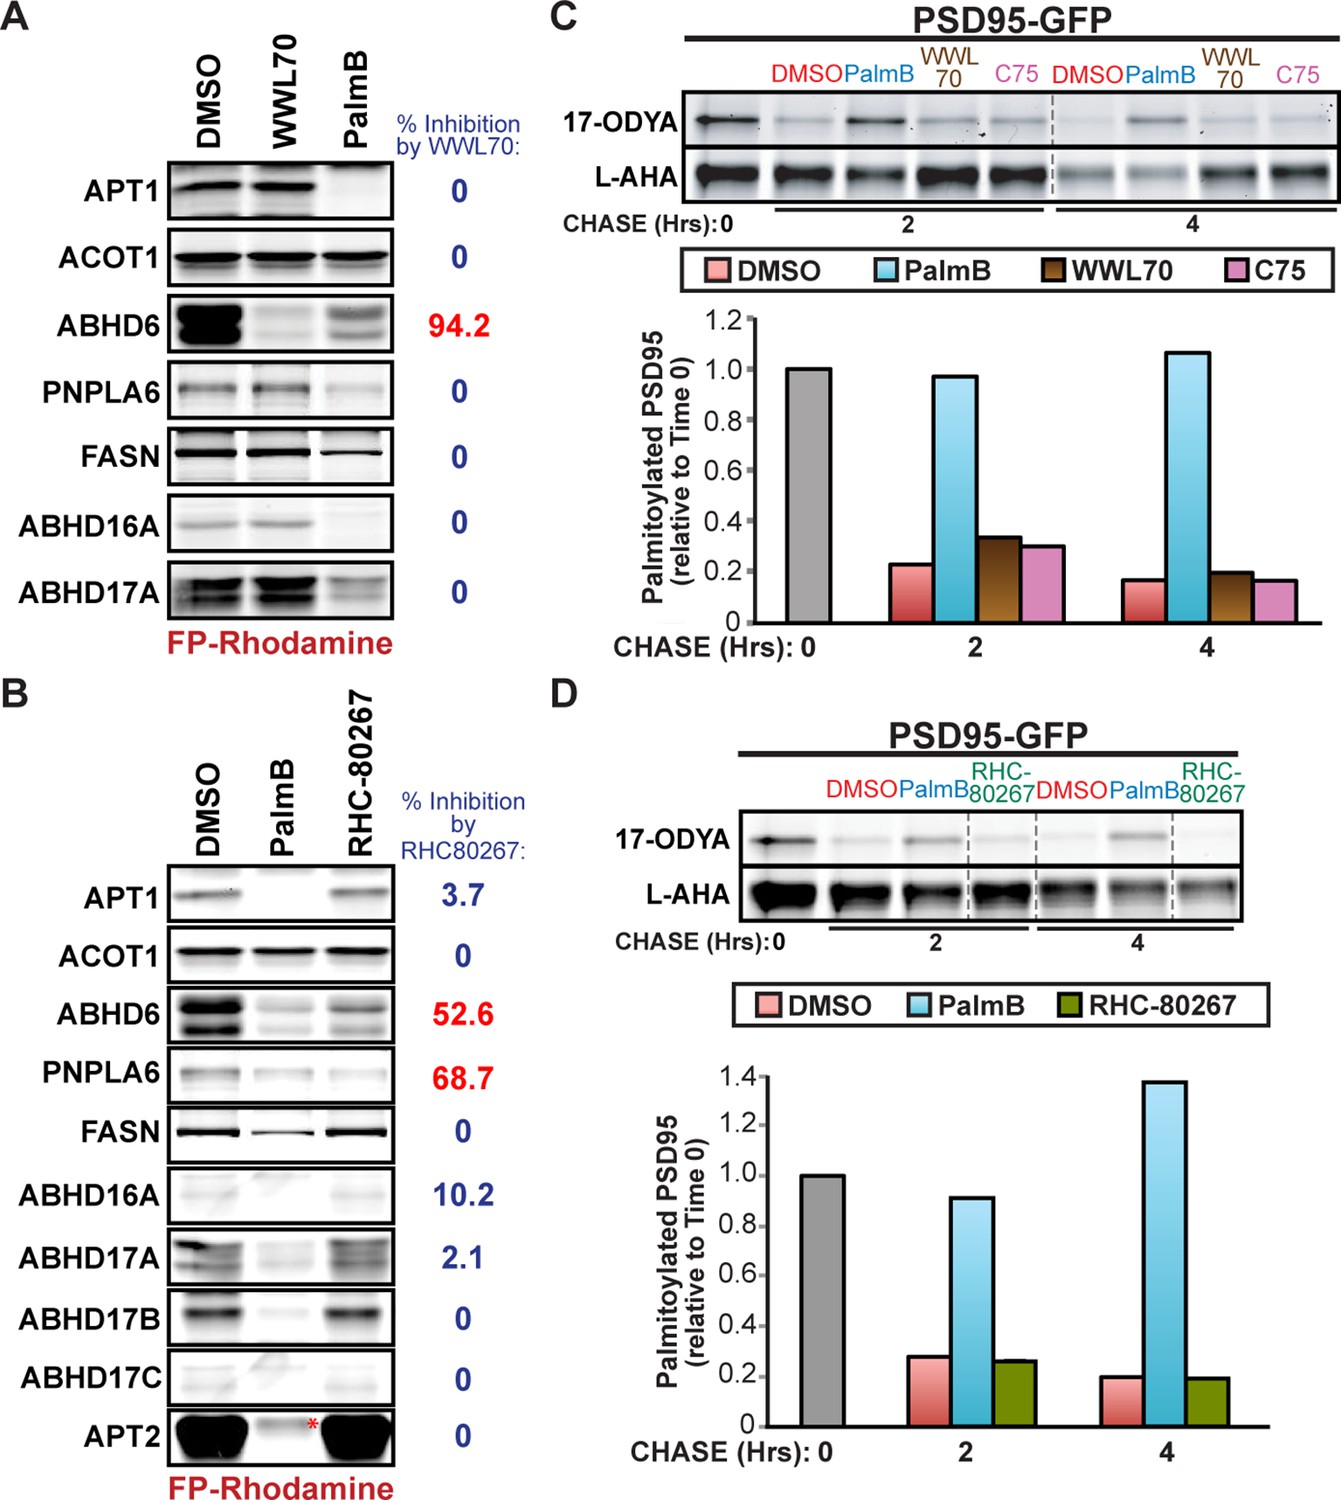
Treatment with serine hydrolase inhibitors WWL70, C75, and RHC-80267 does not affect PSD95 palmitate turnover.
(A-B) Competitive ABPP of 10 μM PalmB and (A) 10 μM WWL70 or (B) 20 μM RHC-80267 against candidate depalmitoylases and ACOT1. Percent inhibition of each enzyme is relative to DMSO. (C-D) Pulse-chase analysis of PSD95 palmitoylation in the presence of: (C) 10 μM PalmB, 10 μM WWL70, or 20 μM C75; and (D) 10 μM PalmB or 20 μM RHC-80267, as described in Figure 2. Dashed lines represent cropping of single gels. *, endogenous serine hydrolase activity unaffected by PalmB.
Figure 4 with 2 supplements
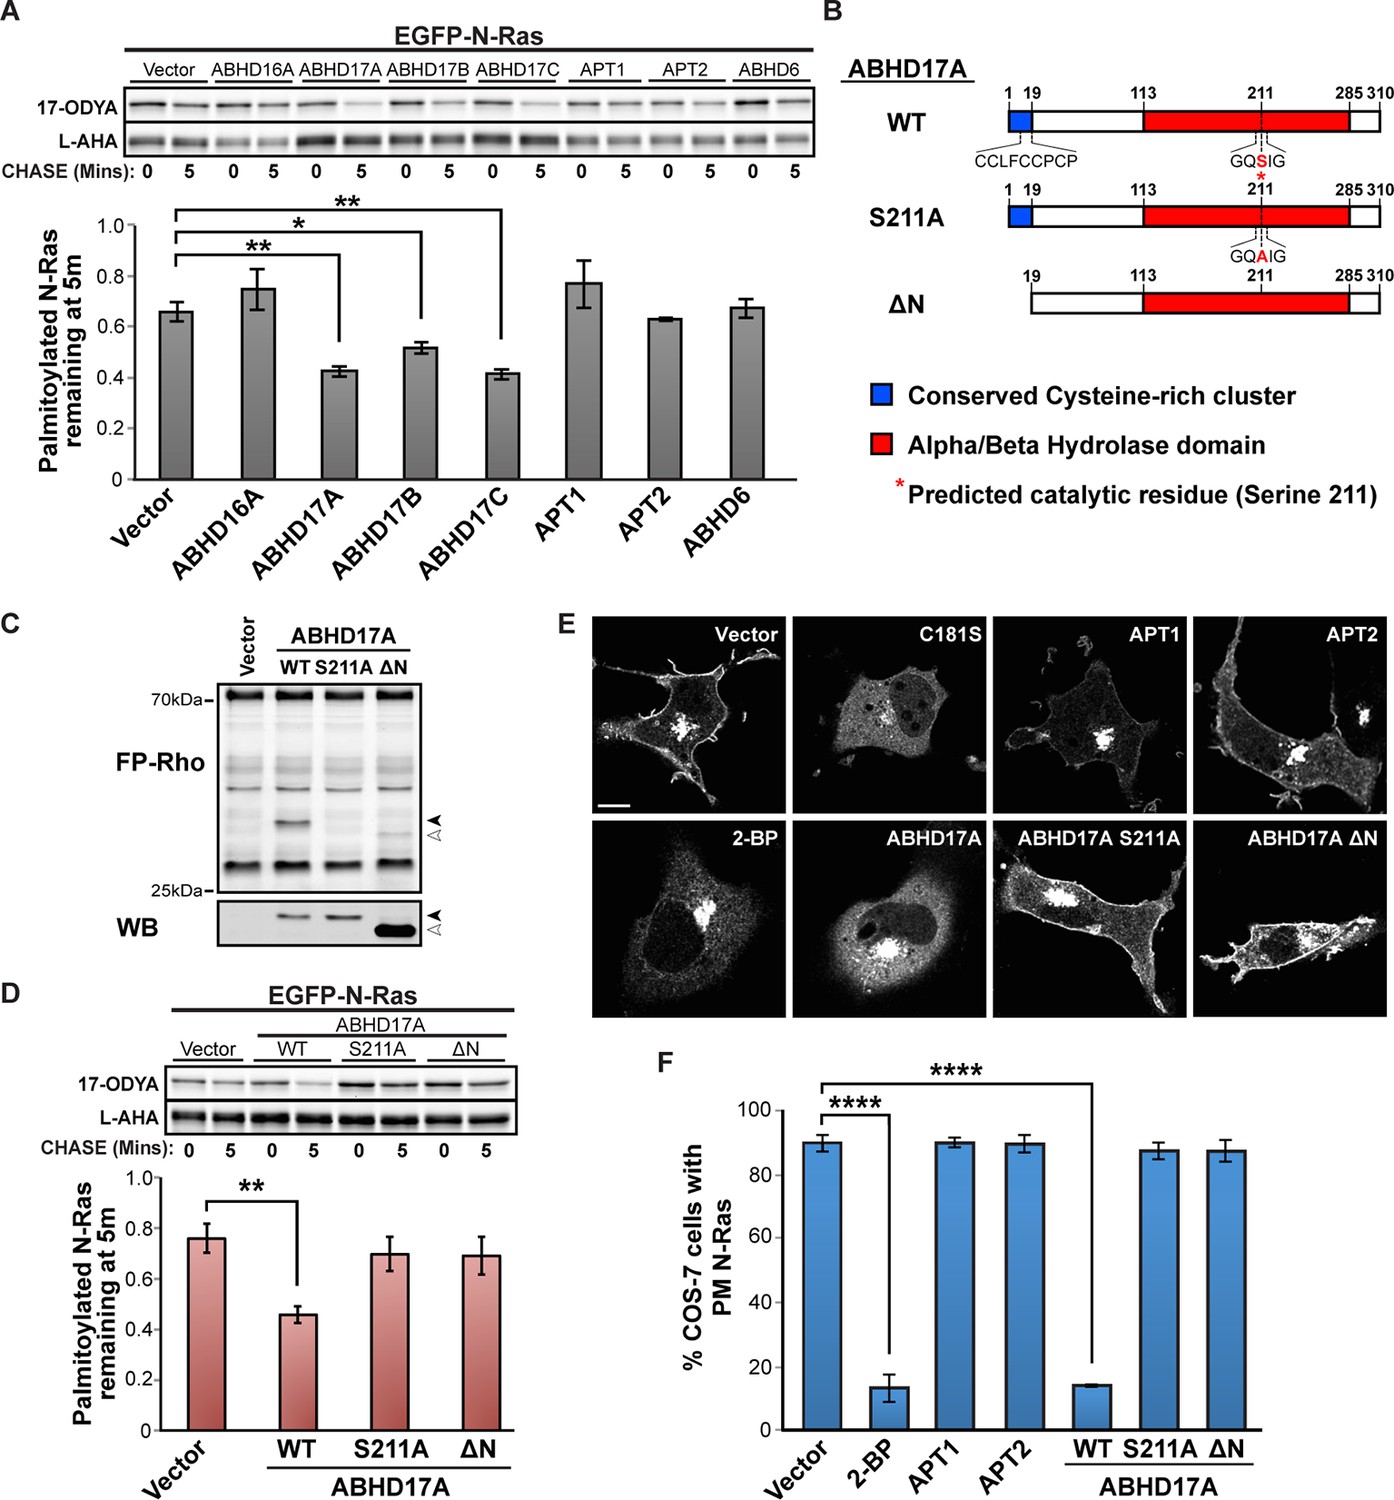
ABHD17A expression promotes N-Ras depalmitoylation and alters N-Ras subcellular localization.
(A) Pulse-chase analysis of N-Ras co-expressed with candidate mSHs as described in Figure 1. n = 3, mean ± SEM. (B) Schematic of the ABHD17A wild type, catalytically-inactive (S211A), and N-terminal truncation (ΔN) mutant proteins used in this study. (C) ABPP of ABHD17A wild type and mutant proteins by in-gel fluorescence (FP-Rho). Western blot (WB) shows proteins expressed in each condition. Filled arrowheads: ABHD17A WT and S211A; Open arrowheads: ABHD17A ΔN. (D) Pulse-chase analysis of N-Ras co-expressed with ABHD17A wild type and mutant proteins as described in Figure 1. n = 3, mean ± SEM. (E) Representative live confocal images of EGFP-N-Ras-C181S and EGFP-N-Ras localization in COS-7 cells treated with 100 μM 2-bromopalmitate (2-BP) or co-expressing the indicated thioesterases. Scale Bar = 10 μm. (F) Bar graph representing percentage of COS-7 cells with plasma membrane EGFP-N-Ras under each condition studied in (E). n = 3 (100 cells counted per trial), mean ± SEM. *p < 0.05; **p < 0.01; ****p < 0.0001. mSHs, metabolic serine hydrolases; SEM, standard error of the mean.
Figure 4—figure supplement 1
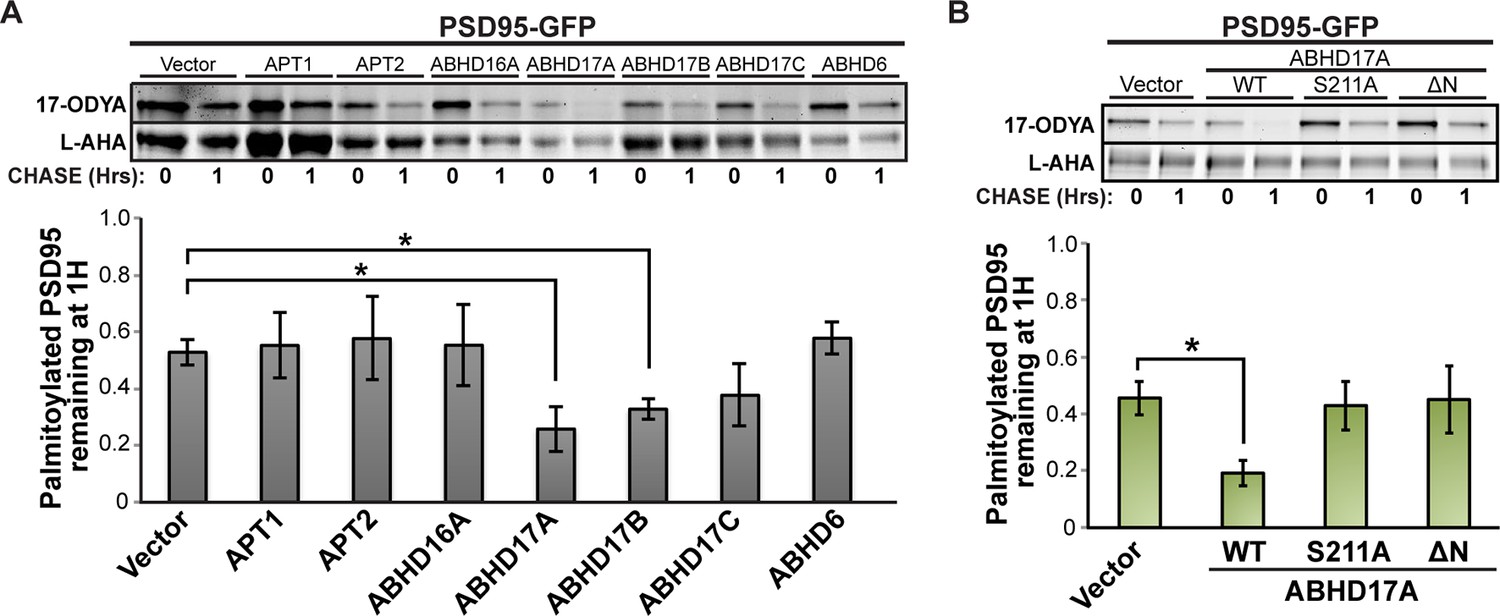
ABHD17 expression promotes PSD95 depalmitoylation.
(A) Pulse-chase analysis of PSD95 co-expressed with candidate mSHs as described in Figure 4A. n = 3, mean ± SEM. (B) Pulse-chase analysis of PSD95 co-expressed with ABHD17A wild type and mutant proteins as described in Figure 4D. n = 3, mean ± SEM. *p < 0.05. mSHs, metabolic serine hydrolases; SEM, standard error of the mean.
Figure 4—figure supplement 2
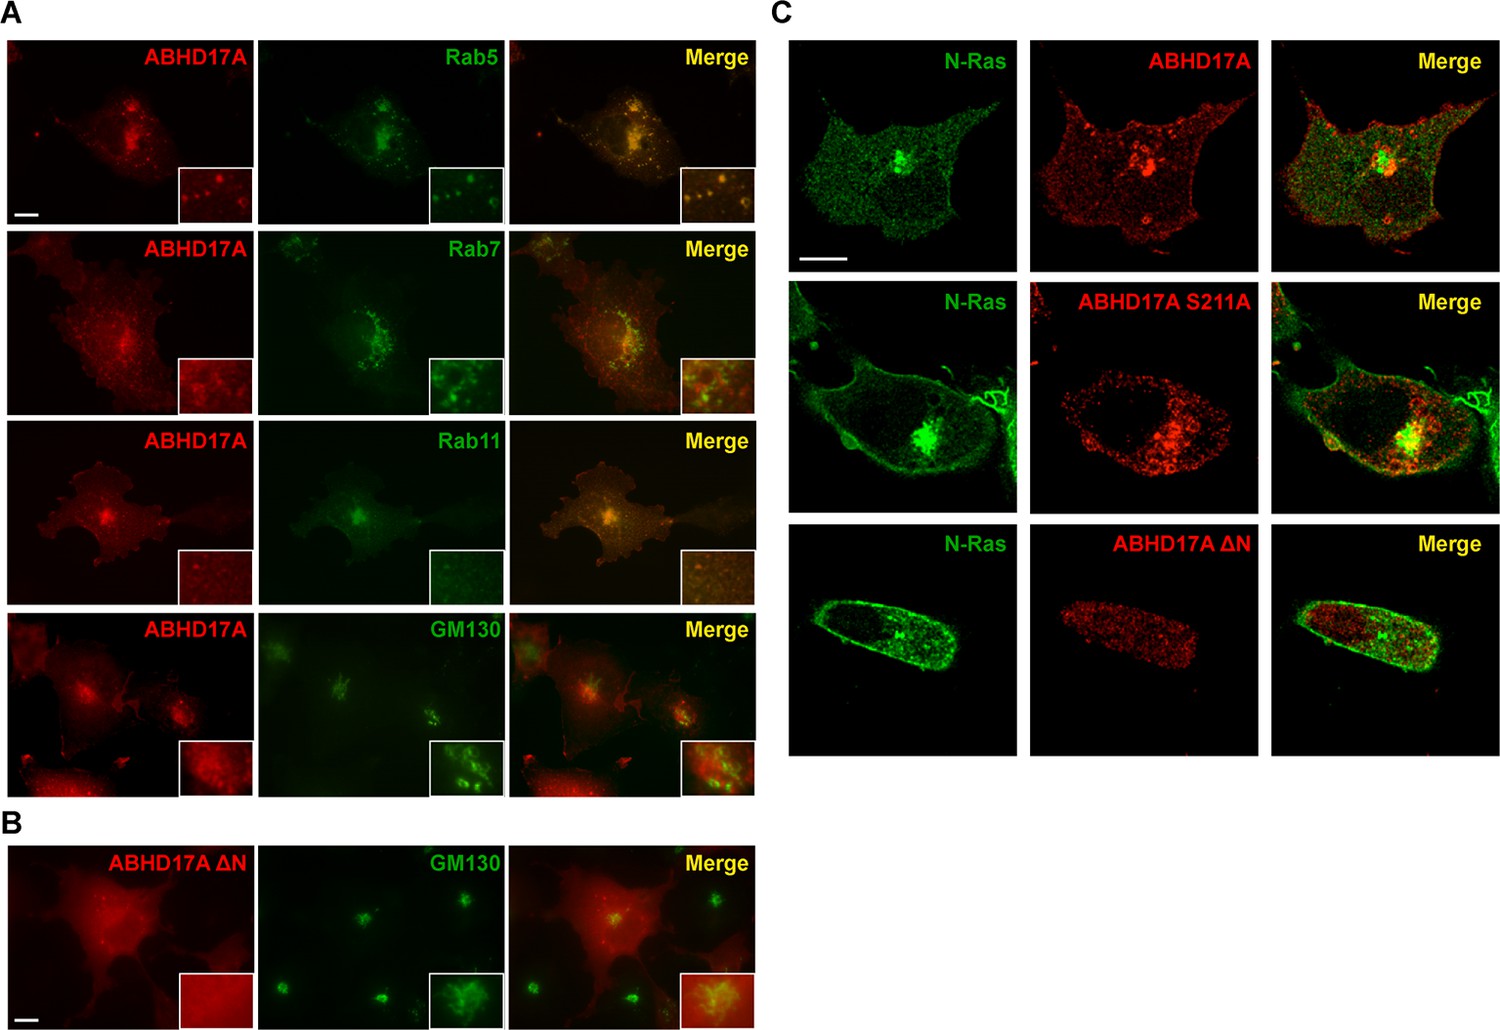
ABHD17A is localized to the plasma membrane and endosomal compartments.
(A) Localization of ABHD17A wild-type protein with markers of early endosomes (Rab5), late endosomes (Rab7), recycling endosomes (Rab11), and the Golgi apparatus (GM130) in COS-7 cells as determined by immunocytochemistry. Scale bar =10 μm. (B) Localization of ABHD17A ΔN in COS-7 cells relative to the Golgi marker GM130 by immunocytochemistry. Scale bar =10 μm. (C) Localization of mCherry-tagged ABHD17A wild type and mutant proteins co-expressed with EGFP-N-Ras in COS-7 cells by confocal microscopy. Scale bar =10 μm.
Figure 5

Simultaneous knockdown of ABHD17 isoforms inhibits N-Ras palmitate turnover.
(A) RT-qPCR of ABHD17A, ABHD17B, and ABHD17C transcript levels in HEK 293T cells treated with Non-Targeting siRNA (”NT”, black), ABHD17A siRNA alone (”A KD”, gray), or ABHD17A/ ABHD17B/ ABHD17C siRNAs (”Triple KD”, light gray) for 72 hr. n = 3, mean ± SEM. (B) Pulse-chase analysis of N-Ras palmitoylation in siRNA-transfected HEK 293T cells treated with vehicle (DMSO), 10 μM C83 and C115, or 10 μM PalmB as described in Figure 1. n = 3, mean ± SEM. **p < 0.01; ****p < 0.0001. SEM, standard error of the mean.
Author Response Image 1

Additional files
-
Supplementary File 1
List of Metabolic serine hydrolases inhibited by HDFP.
A summary table compiling the 29 serine hydrolases targeted by HDFP (>25% activity inhibition) as determined by cABPP-SILAC (Stable isotope labeling of amino acids in culture) in (Martin et al., 2011). LYPLAL1 (APT1L) was added to this list as a candidate enzyme for Palmostatin B testing (Tian et al., 2012).
- https://doi.org/10.7554/eLife.11306.012
-
Supplementary File 2
List of cloning oligos used in this study.
A table listing PCR primers used to subclone candidate serine hydrolases for cABPP, pulse-chase/click chemistry, and confocal imaging studies.
- https://doi.org/10.7554/eLife.11306.013
-
Supplementary File 3
List of gene-specific RT-qPCR primer pairs used in this study.
A table listing gene-specific primer pairs for verification of transcript levels in HEK293T cells by RT-qPCR in Figure 5A.
- https://doi.org/10.7554/eLife.11306.014
Download links
A two-part list of links to download the article, or parts of the article, in various formats.
Downloads (link to download the article as PDF)
Open citations (links to open the citations from this article in various online reference manager services)
Cite this article (links to download the citations from this article in formats compatible with various reference manager tools)
ABHD17 proteins are novel protein depalmitoylases that regulate N-Ras palmitate turnover and subcellular localization
eLife 4:e11306.
https://doi.org/10.7554/eLife.11306


