Multivariate analysis of electrophysiological diversity of Xenopus visual neurons during development and plasticity
- Brown University, United States
- Bard College, United States
Figures
Figure 1
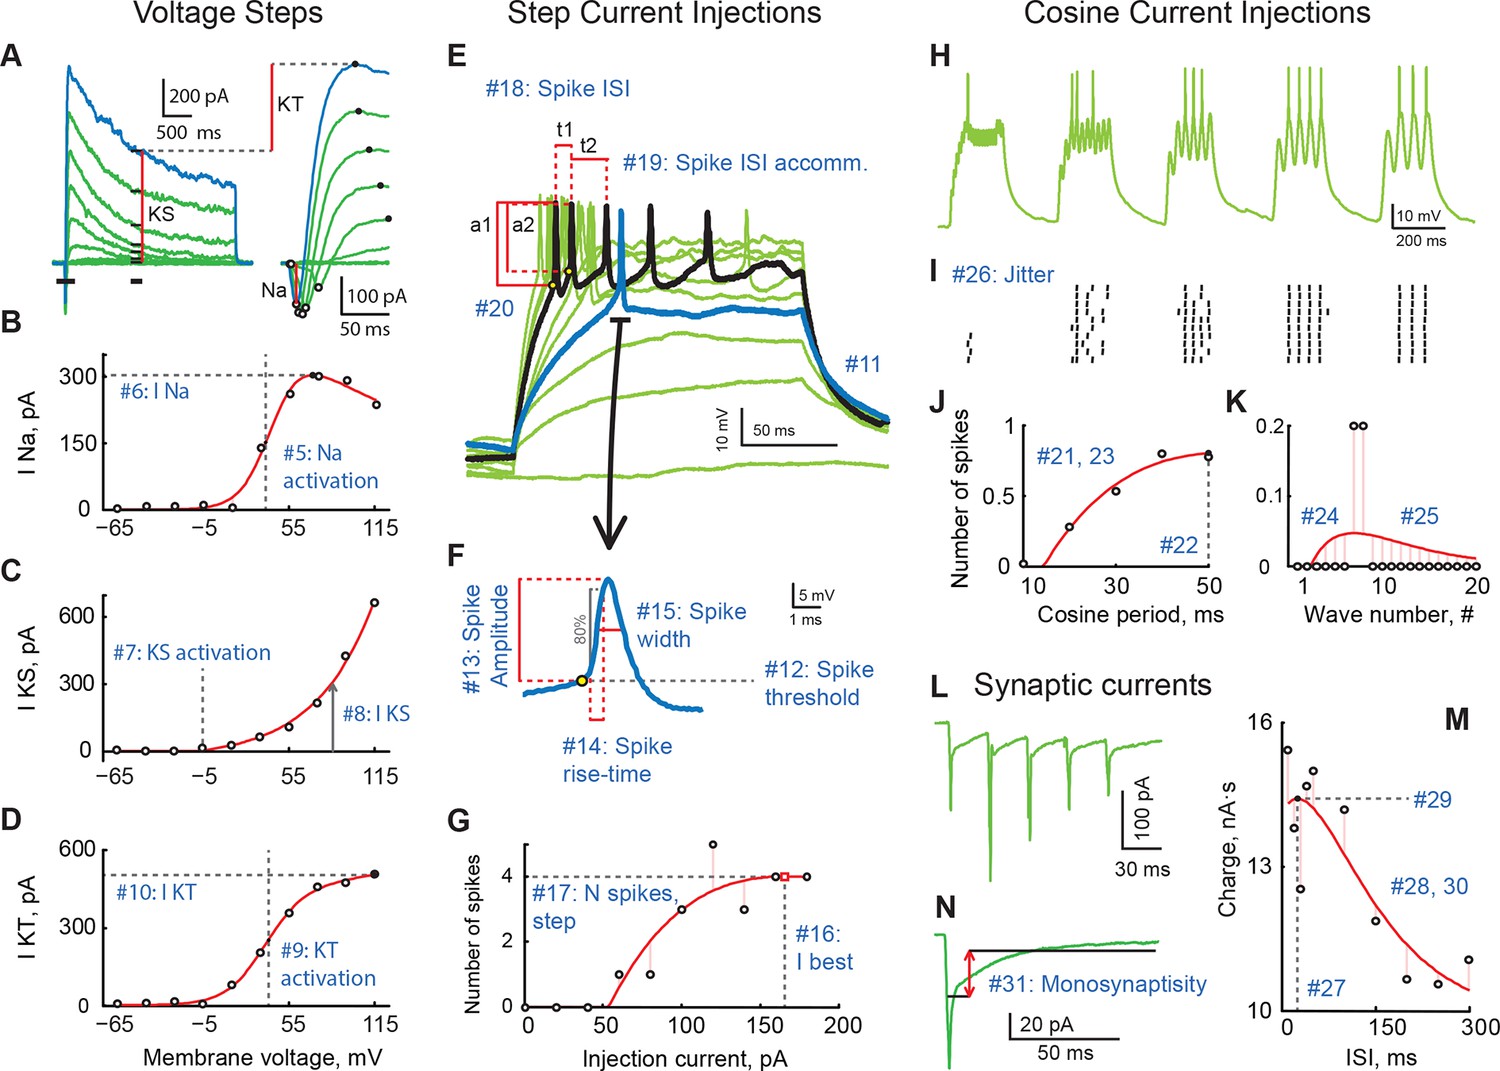
A review of cell properties characterized in this study (See methods for a detailed description of every measurement).
(A) Response to voltage clamp steps after passive current subtraction; full currents on the left, a zoom-in look at early active currents on the right. Red vertical lines show how voltage-gated sodium (INa), stable potassium (IKS), and transient potassium currents (IKT) were measured. (B) IV curve for INa. (C) IV curve for IKS. (D) IV curve for IKT. (E) Spiking responses to current step injections of different amplitudes; first response to produce a spike is shown in blue; response generating maximal number of spikes is shown in black. (F) An expanded look at the first spike produced by the cell in response to step current injections. (G) Number of spikes as a function of step current injection amplitude. (H) A trace of membrane potential recorded from the cell in response to cosine current injections of varying frequency. (I) Spike-raster of 10 consecutive responses to cosine injections shown in H. (J) Average number of spikes in response to a single cosine injection as a function of cosine period. (K) Average number of spikes per cosine wave in response to injections of shortest period (10 ms; leftmost group in panels H and I. (L) Sample trace of excitatory synaptic currents recorded in voltage clamp mode in response to optic chiasm stimulation with a 30 ms inter-stimulus interval. (M) Total postsynaptic charge as a function of inter-stimulus interval. (N) Average postsynaptic current showing time-windows that were used to build the "Monosynapticity ratio". Panels (A–D) originate from one cell; panels (E–M) were recorded in another cell; both from stage 49 animals.
Figure 2
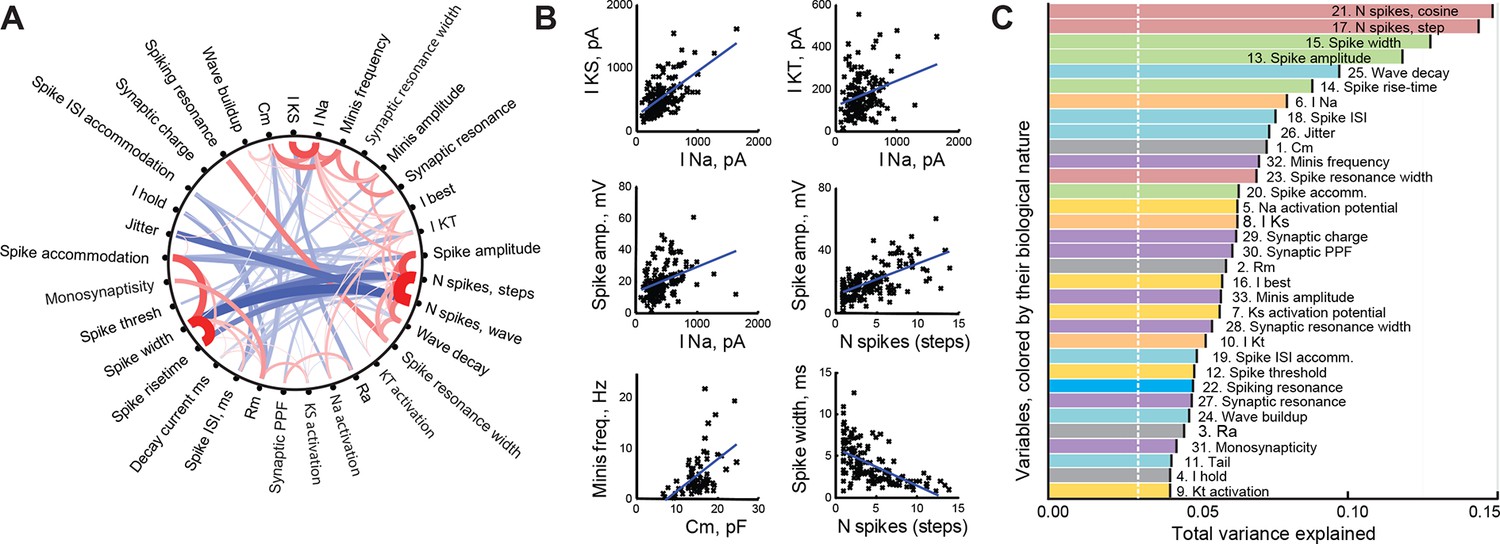
Correlations between cell properties.
(A) Diagram illustrating significant correlations and their strengths (r-values) for all pairs of cell properties measured. Positive correlations are shown in red; negative correlations in blue; the width and darkness of each line are proportional to respective r-value. (B) Selected significant correlations between cell variables. (C) Variables sorted by the total variance each of them can explain in the full dataset (amounts are not additive and do not add up to 100%). Colors indicate the biological nature of each variable (red for spiking, green for spike shape, blue for spike timing, orange for ionic currents, yellow for activation potentials, gray for passive properties, and purple for synaptic properties). The white dashed line shows the expected variance explained for an ideally uncorrelated variable.
Figure 3
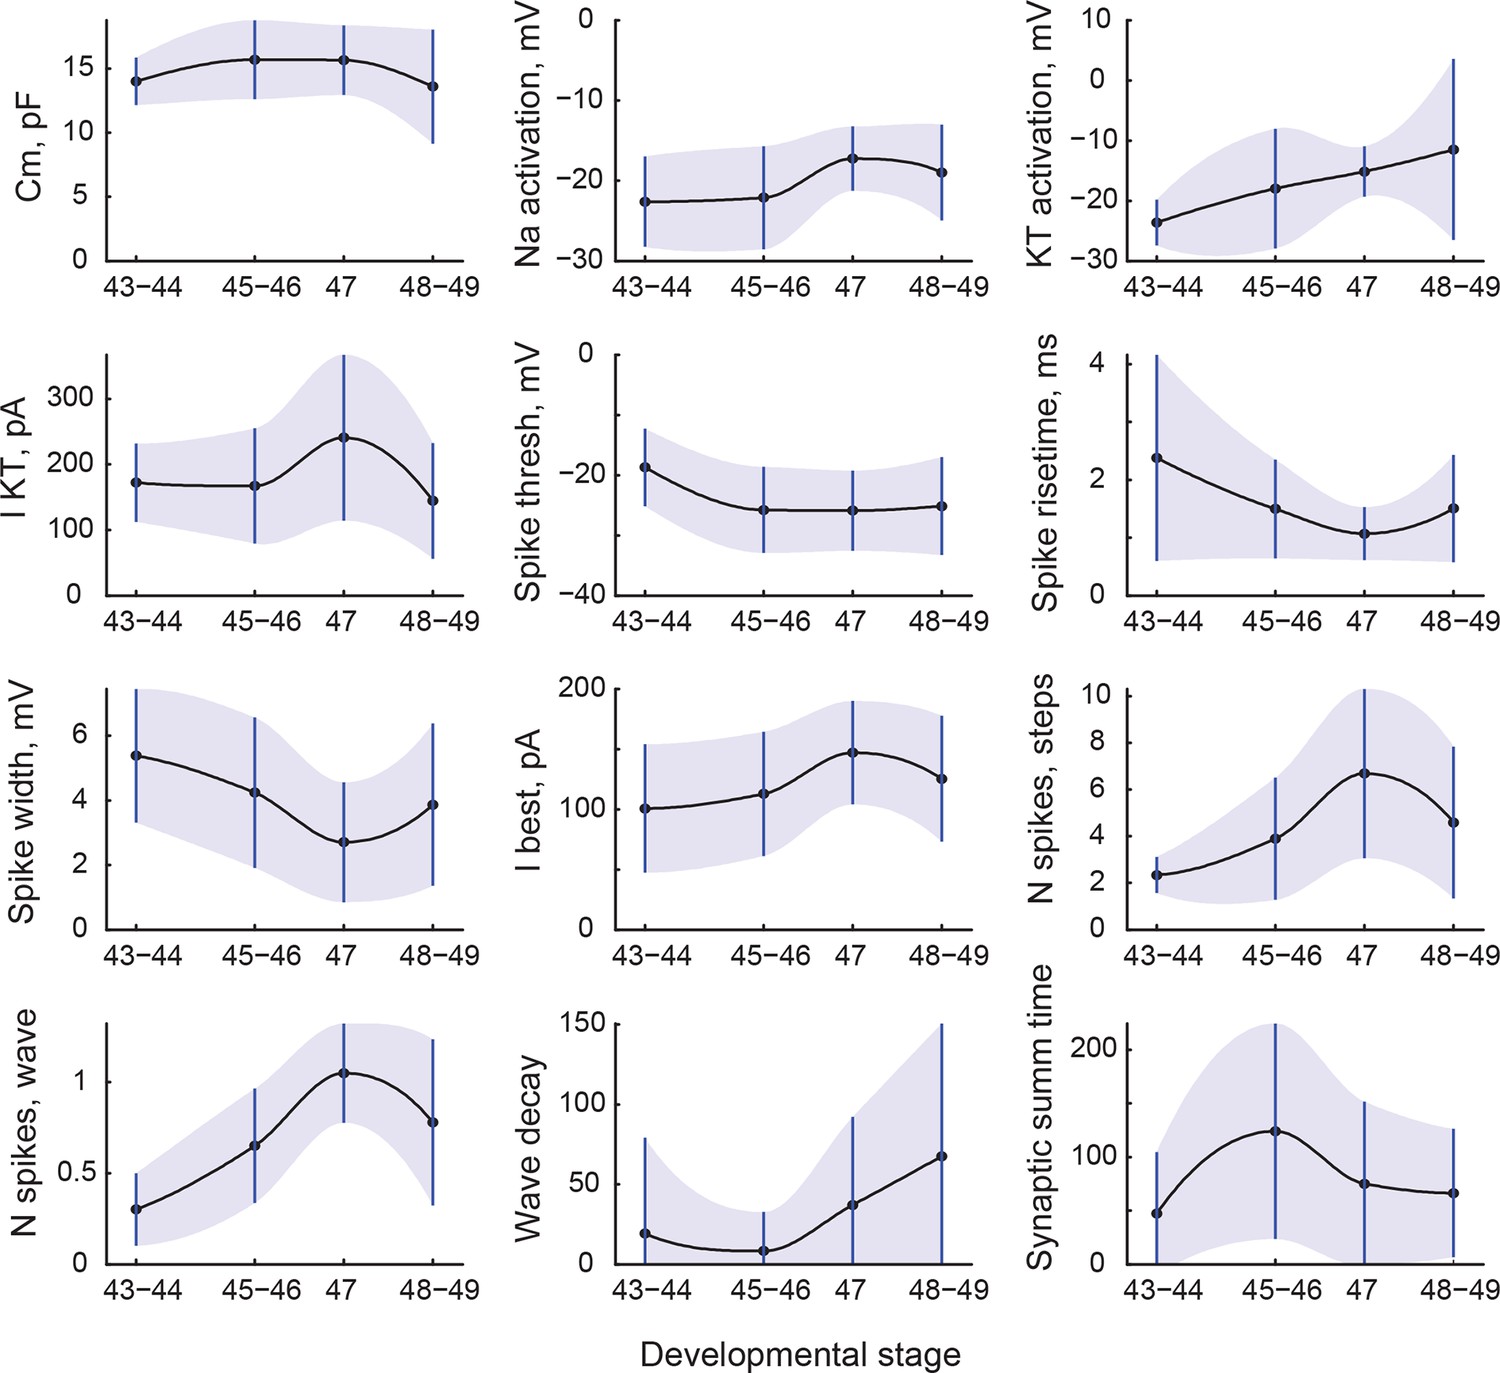
Changes in cell properties with age.
All cell properties that significantly changed with development are shown here as mean values (central line) and standard deviations (whiskers and shading). Transitions between points are shown as shape-preserving piecewise cubic interpolations.
Figure 4
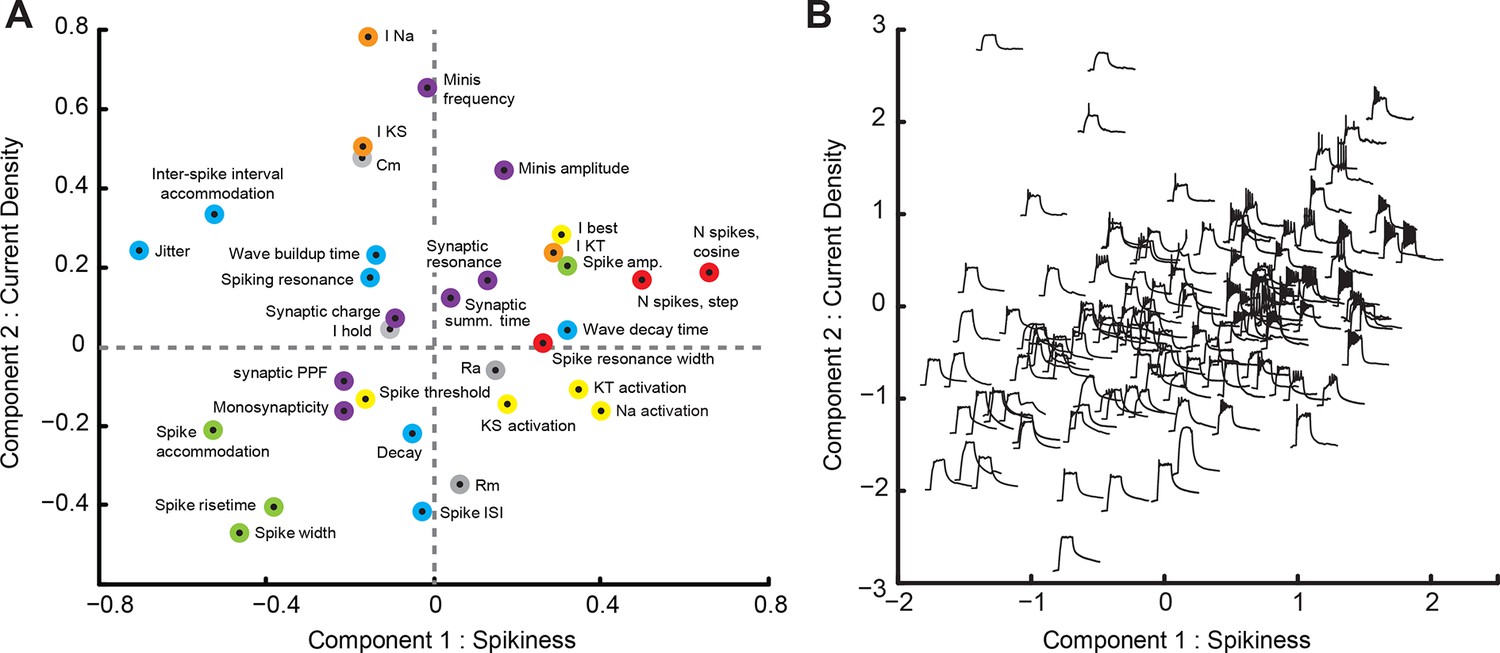
Principal Component Analysis (PCA).
(A) Loading-plot, presenting contribution of individual cell properties to the first two PCA components (see detailed description in the text). Points are colored with regards to how they describe the spikiness of the cell (red), shape of spikes (green), their temporal properties (blue), ionic currents (orange), passive electrical properties (gray), or synaptic properties of the cell (purple). (B) Modified score-plot showing how individual cells score on first two PCA components, with responses of respective cells to step current injections used instead of standard plot markers. Responses on the right are spikier that those on the left, while responses on the bottom have a greater passive component than responses on the top.
Figure 5

Evolution of PCA component scores with development.
(A) Score-plot of PCA scores for all cells from the main dataset, with cells colored by the developmental stage of the animal: from reds for stages 43–44, through yellows for stages 45–46, to blues for stages 48–49. Note that most red cells are located on the left, while most light blue cells (stage 47) are located on the right. (B) Isolated sub-clouds of points from panel (A), shown on the same axes as panel (A), and illustrating the progression of different stages through the score-plot (N points = 11, 64, 24, and 56). Estimated density kernels for sub-clouds are shown as colored backgrounds. Stages 43–47 illustrate that the cloud moved to the right, while at stages 48–49 it moved back to the center, and expanded at all directions (see quantification in the text).
Figure 6
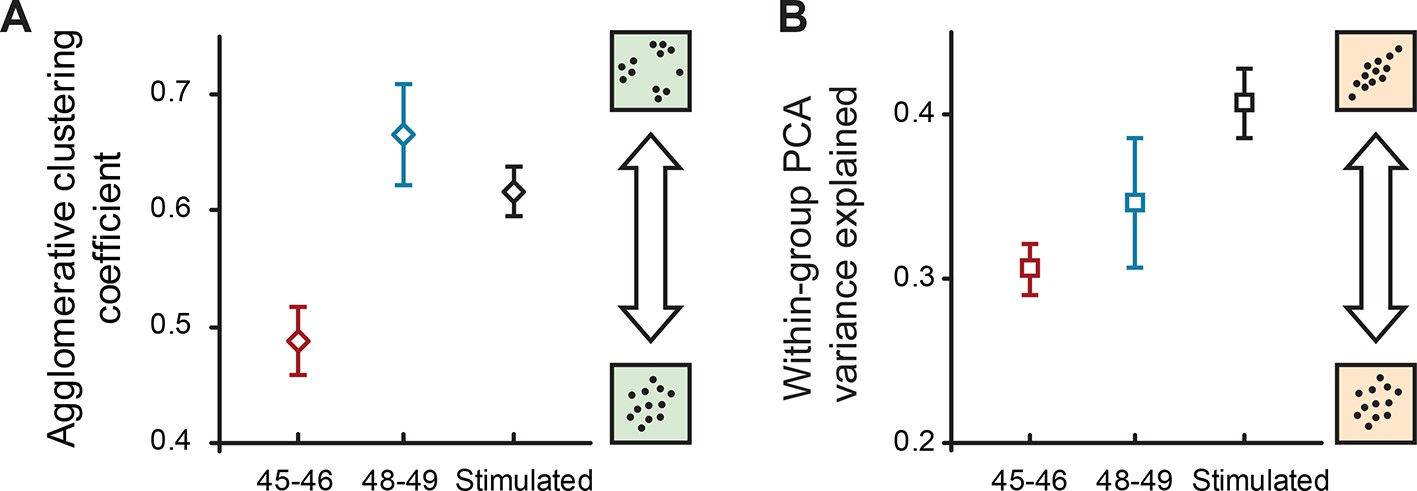
Internal structure of cell property distributions.
(A) Agglomerative clustering coefficients for properties of naïve cells at stages 45–46, 48–49, and cells after sensory stimulation (stage 49). Higher values correspond to higher levels of clustering (grouping); lower values correspond to more Gaussian-like unimodal distributions. (B) The amount of within-group variance explained by the first two components of PCA for the same groups of data. Higher values correspond to higher correlations between different electrophysiological variables in the set. Both plots show means ± standard deviations of results obtained in the original 33-dimensional space after multiple imputation with subsampling.
Figure 7
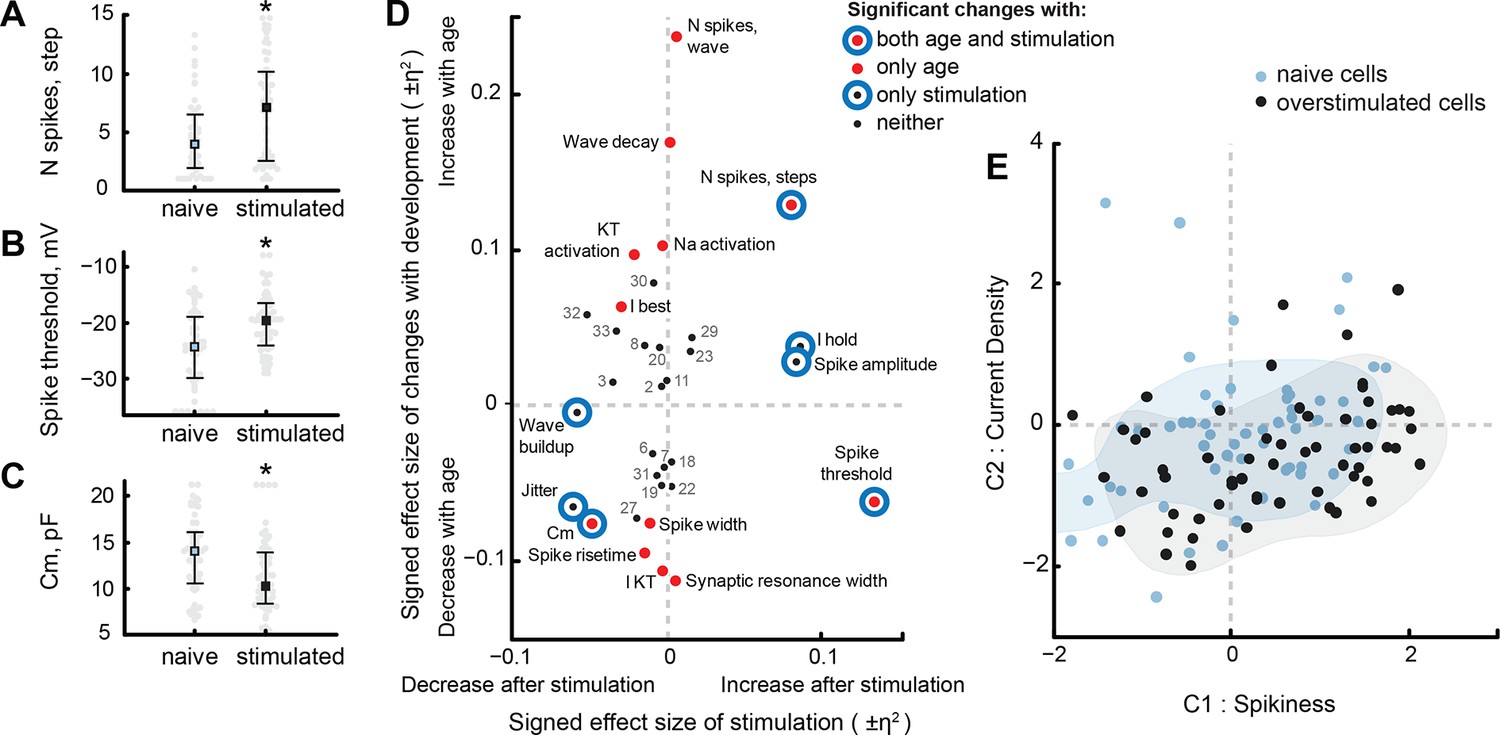
Visual stimulation changes some cell properties.
(A–C) Visual stimulation increased the spikiness of stage 49 cells in response to step current injections (A), increased spike threshold potential (B), and decreased membrane capacitance of tectal cells (C). (D) A survey of cell properties that significantly changed either during development (red filled markers), in response to visual stimulation (blue hollow circles), or to neither variable (small black markers). Properties that changed both in development and after stimulation are shown as red markers with blue circles surrounding them. The position of each marker on the plot is defined by the share of variability explained by developmental stage or visual stimulation, presented as η2 effect size value, and taken with a sign that reflects the direction of the change. Properties that did not change significantly are labeled by their number (see 'Materials and methods' or Supplementary file 3 for the full list). (E) Projection of cells from visually stimulated s49 animals (black) into PCA space defined by the analysis of naïve dataset, with naïve cells from s48-49 animals shown in blue. Shading shows estimated density kernels for respective groups.
Figure 8
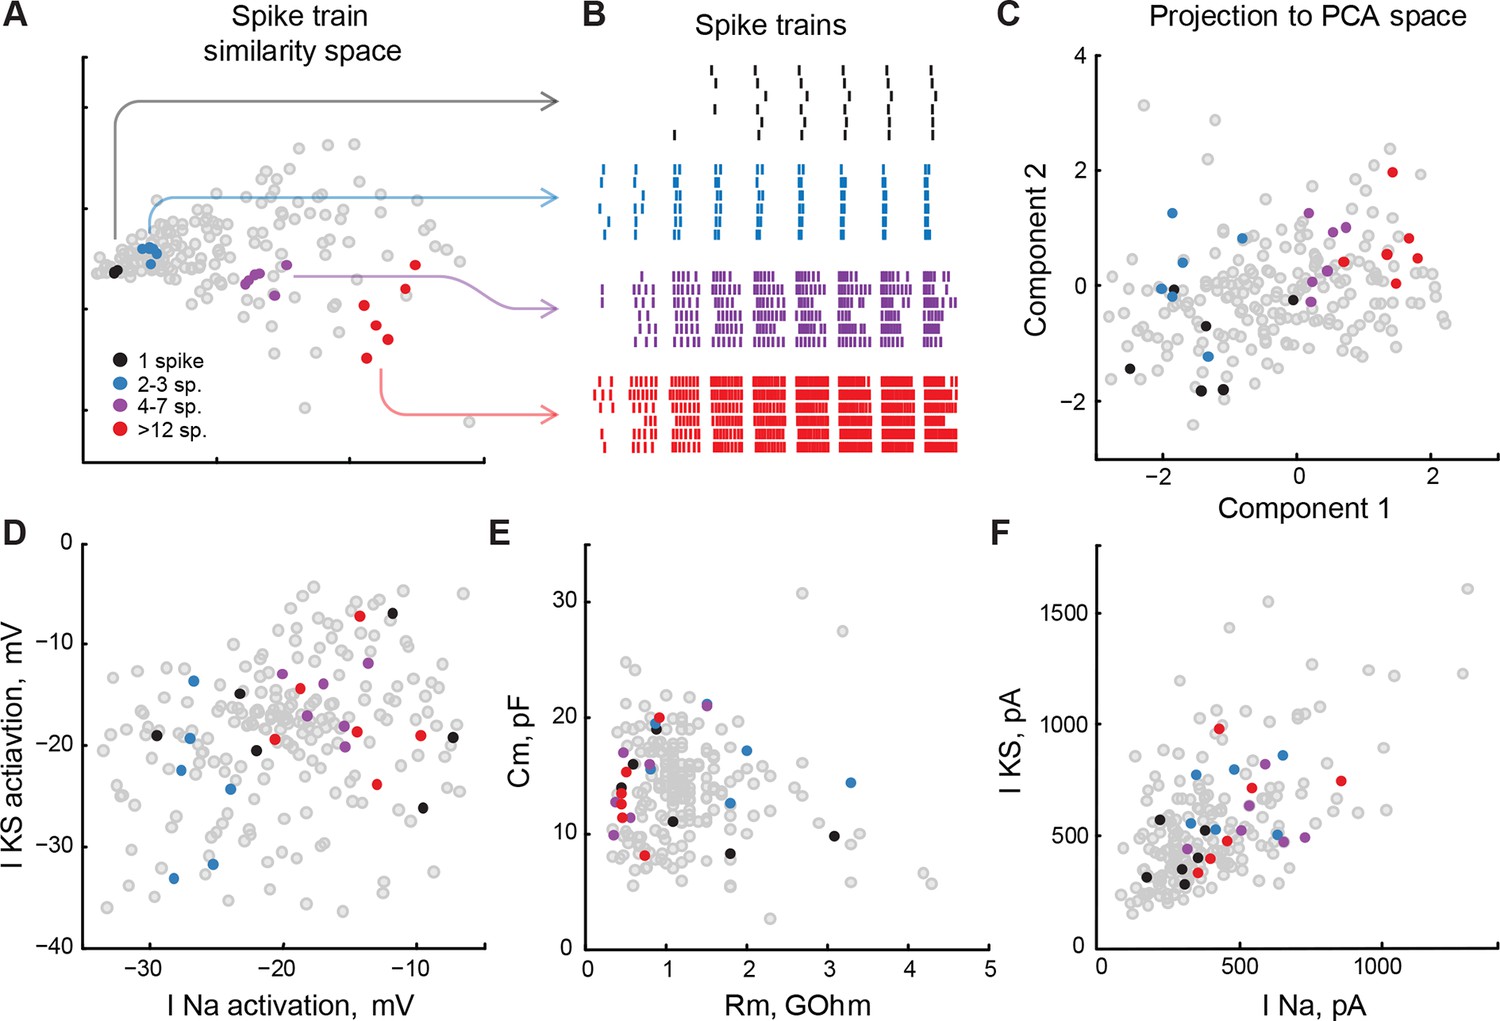
Low-level cell properties are a bad predictor for spiking output.
(A) Multidimensional scaling of differences between cell spiking outputs onto a 2D plane. Cells that produced similar trains of spikes in response to step current injections, both in terms of the total number of spikes, input-output curve, and spike latency, are located nearby. (B) Spike-raster for several subsets of 6 cells each shown in panel A. Spiking outputs of cells are very different between the groups, but are closely matched within each group. (C) Groups of cells from panels A and B, projected into PCA space that describes the full variability of cell properties. Clusters of cells are still visible, but they are no longer compact, and groups are partially overlapping. (D–F) The same groups of cells are shown on correlation plots for meaningful (both biologically and statistically; see text) pairs of cell properties: threshold potentials for voltage-gated sodium and stable potassium currents (D), membrane resistance and capacitance (E), and ionic currents amplitudes (F). The clusters are strongly overlapping, suggesting that cells in which a small subset of properties match can be tuned to produce strikingly different spiking outputs. Threshold data in panel D is renormalized to avoid overplotting (see 'Materials and methods').
Additional files
-
Supplementary file 1
Table describing the variables measured from each cell.
33 variables were extracted from this dataset, the table describes the name of the variables, units. average value and brief description. For more details about each variable please see Materials and methods.
- https://doi.org/10.7554/eLife.11351.011
-
Supplementary file 2
Spreadsheet containing data table of parameters extracted from every cell.
This spreadsheet contains the extracted parameters from every cell in this study. These data was used for generating principal component analysis and other statistical measures.
- https://doi.org/10.7554/eLife.11351.012
-
Supplementary file 3
Average values for different stages and experimental conditions.
The data in this table describes the average values of each measured variable across several cells grouped by developmental stage and experimental condition.
- https://doi.org/10.7554/eLife.11351.013
-
Source code 1
Matlab and R scripts used to analyze data.
This set of custom functions was not designed for public use, so many aspects of data analysis in these functions are hard-coded (usually as a global variable explicitly defined in the beginning of each script). Note also that at the submission stage we transformed all raw data for this paper from pClamp ABF files to Matlab MAT-file format, and this is how the data was uploaded to Dryad. The original scripts however worked with our original data files that were mostly stored in either ABF or Microsoft Excel formats.
- https://doi.org/10.7554/eLife.11351.014
Download links
A two-part list of links to download the article, or parts of the article, in various formats.
Downloads (link to download the article as PDF)
Open citations (links to open the citations from this article in various online reference manager services)
Cite this article (links to download the citations from this article in formats compatible with various reference manager tools)
Multivariate analysis of electrophysiological diversity of Xenopus visual neurons during development and plasticity
eLife 4:e11351.
https://doi.org/10.7554/eLife.11351


