An analysis toolbox to explore mesenchymal migration heterogeneity reveals adaptive switching between distinct modes
- Karolinska Institutet, Sweden
Figures
Figure 1 with 4 supplements
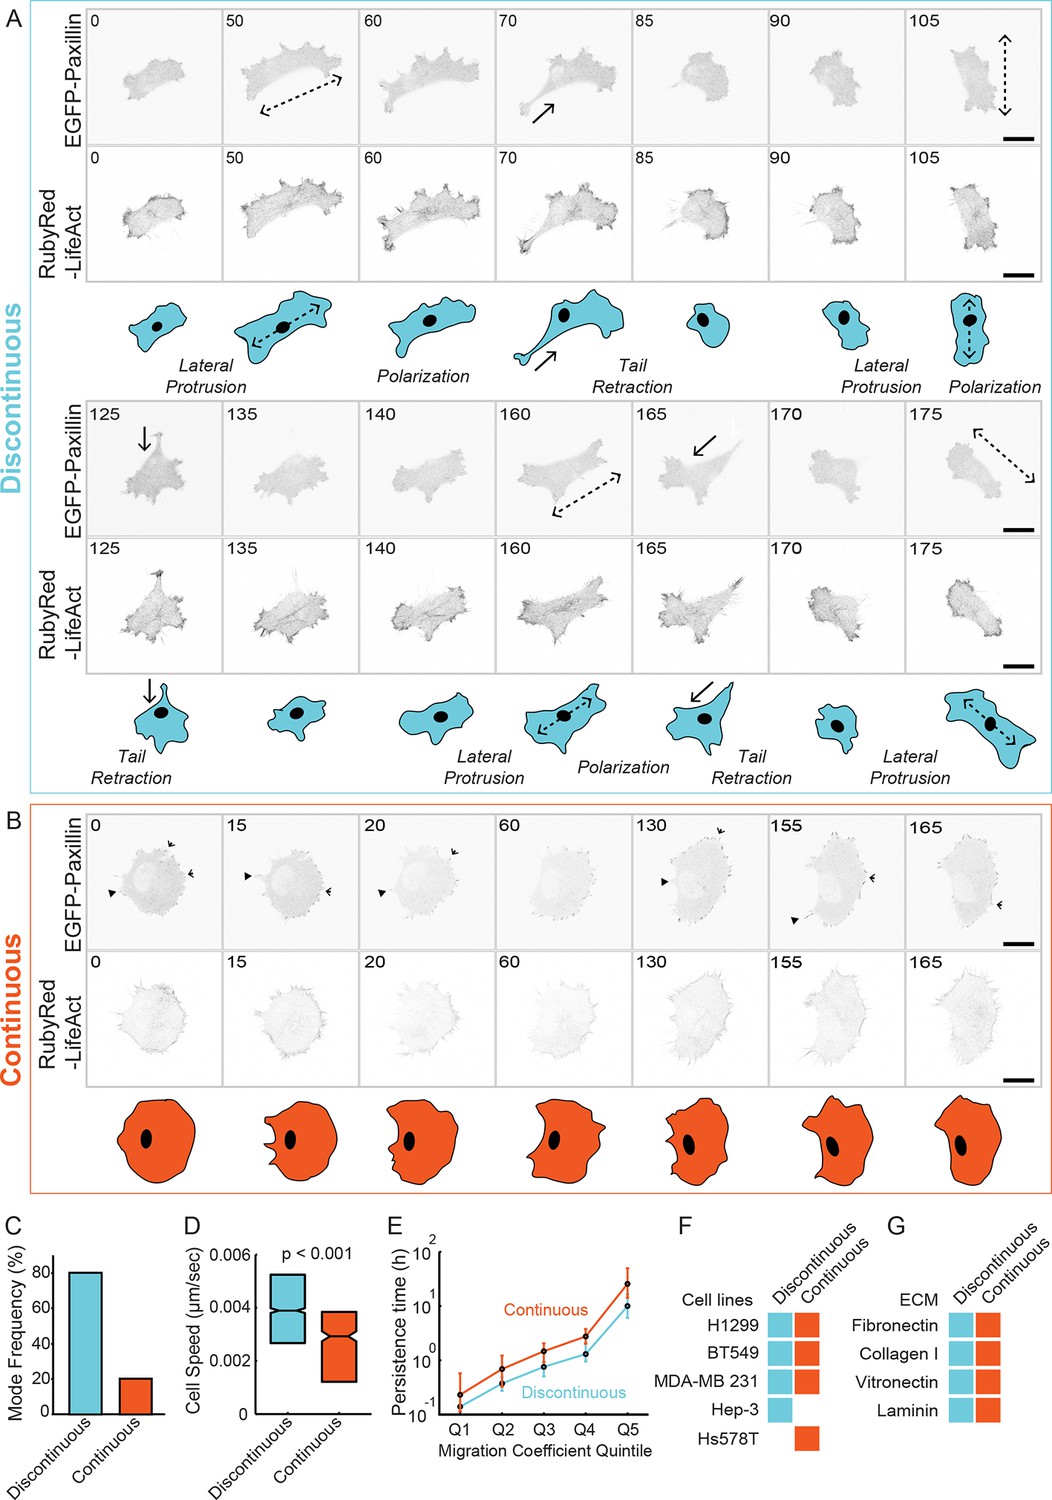
Classification of 'Discontinuous' and 'Continuous' modes of mesenchymal (lamellipodial) migration.
(A, B) Confocal image sequences of individual H1299 cells stably expressing EGFP-paxillin (cell-matrix adhesion complex [CMAC] marker; upper image panels) and RubyRed-LifeAct (F-actin marker; lower image panels) migrating in either Discontinuous (A) or Continuous (B) modalities on fibronectin (FN)-coated (2.5 µg/ml) glass. Images are displayed with gray-scale inverted. Numbers denote time (min). Schematics in blue (Discontinuous, A) and orange (Continuous, B) depict typical cell morphology changes associated with each migration mode. Note stepwise cycles of: lateral protrusion (in directions of dashed arrows); cell polarization; and tail retraction (in direction of solid arrows) that recur during Discontinuous migration, and that lateral protrusion tends to occur at 90° to the preceding tail retraction. During Continuous migration, cell morphology is relatively stable, with many small protrusion (open arrowheads) and retraction (closed arrowheads) events producing smooth movement. Movies corresponding to cells shown in A and B are available in supporting material (Videos 1,2). (C) Quantification of frequencies of Discontinuous and Continuous modes. (D) Box plots of cell speed (µm/sec) per migration mode. Boxplots show median values and inter-quartile ranges (IQR, 25% to 75%). Notches indicate median +/− 1.57 * IQR/√n (approximates 95% confidence interval of the median, n = number of cell observations, see 'Materials and methods'). Statistical discernibility assessed by Wilcoxon rank sum test, p < 0.001. (E) Cell trajectories in each mode were assessed via mean squared displacement (MSD) analysis and divided into quintiles (20% bins) according to their migration cefficient (related to speed of movement). Median values +/−1.57 * IQR/√n (n = number of cell observations) of a second MSD measure, persistence time (related to migration direction stability), are plotted per migration coefficient quintile. Number of observations per quintile: Discontinuous = ~ 402; Continuous = ~ 95. (F) A table summarizes results from visual inspection of several cell lines migrating on 2.5 µg/ml FN, confirming the emergence of either one or both Discontinuous and Continuous migration modes in these cell types. Example image sequences are presented in Figure 1—figure supplement 3. (G) A table summarizes results from visual inspection of H1299 cells migrating on several different extracellular matrix ligands, confirming the emergence of both migration modes under each condition. Example image sequences are presented in Figure 1—figure supplement 4. Scale bars = 20 µm.
Figure 1—figure supplement 1
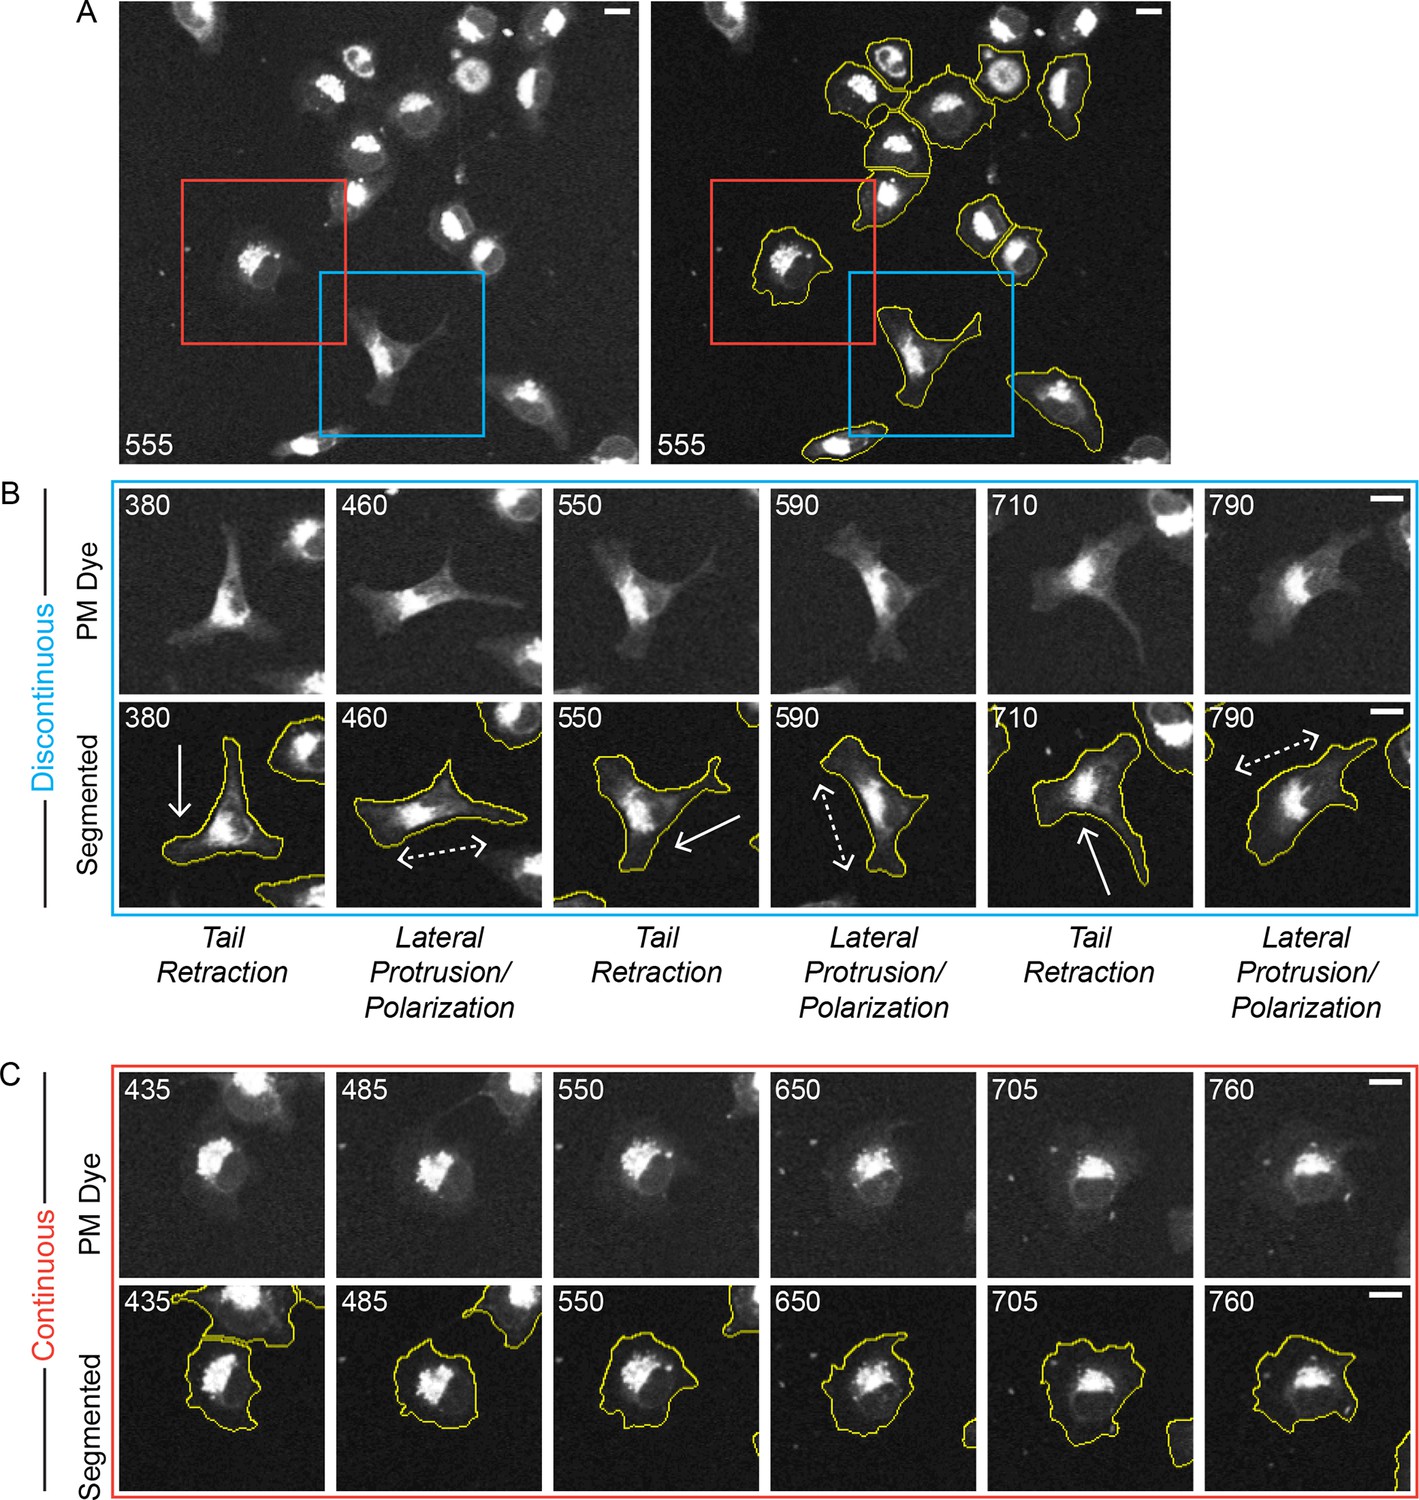
Discontinuous and Continuous migration modes emerge in parallel under uniform conditions.
A confocal image sequence showing the parallel emergence of Discontinuous and Continuous migration modes in H1299 P/L cells labeled with a far red membrane-dye on 5 µg/ml fibronectin-coated glass. (A) De-noised (left) and segmented (right) images show a selected region from within a 4 x 4 image montage. Based on observed cell dynamics (see Video 3), cells were classified as in either the Discontinuous (e.g. cell in blue box) or Continuous mode (e.g. cell in red box). (B) Stereotypical Discontinuous mode behaviors are displayed in a series of time points (numbers denote minutes) following the cell from the blue box in A. Specifically: Tail Retraction is denoted by solid arrows; Lateral Protrusion and Polarization are denoted by dashed double headed arrows; (C) The relatively stable morphology of Continuous mode migration is shown by the cell from the red box in A. It is noteworthy that both highlighted cells sequentially traverse the same region of the coated substrate while maintaining distinct migration modes (see Video 3), indicating that potential inconsistencies in the local environment could not be responsible for the parallel emergence of distinct modes. Scale bars = 10 µm.
Figure 1—figure supplement 2
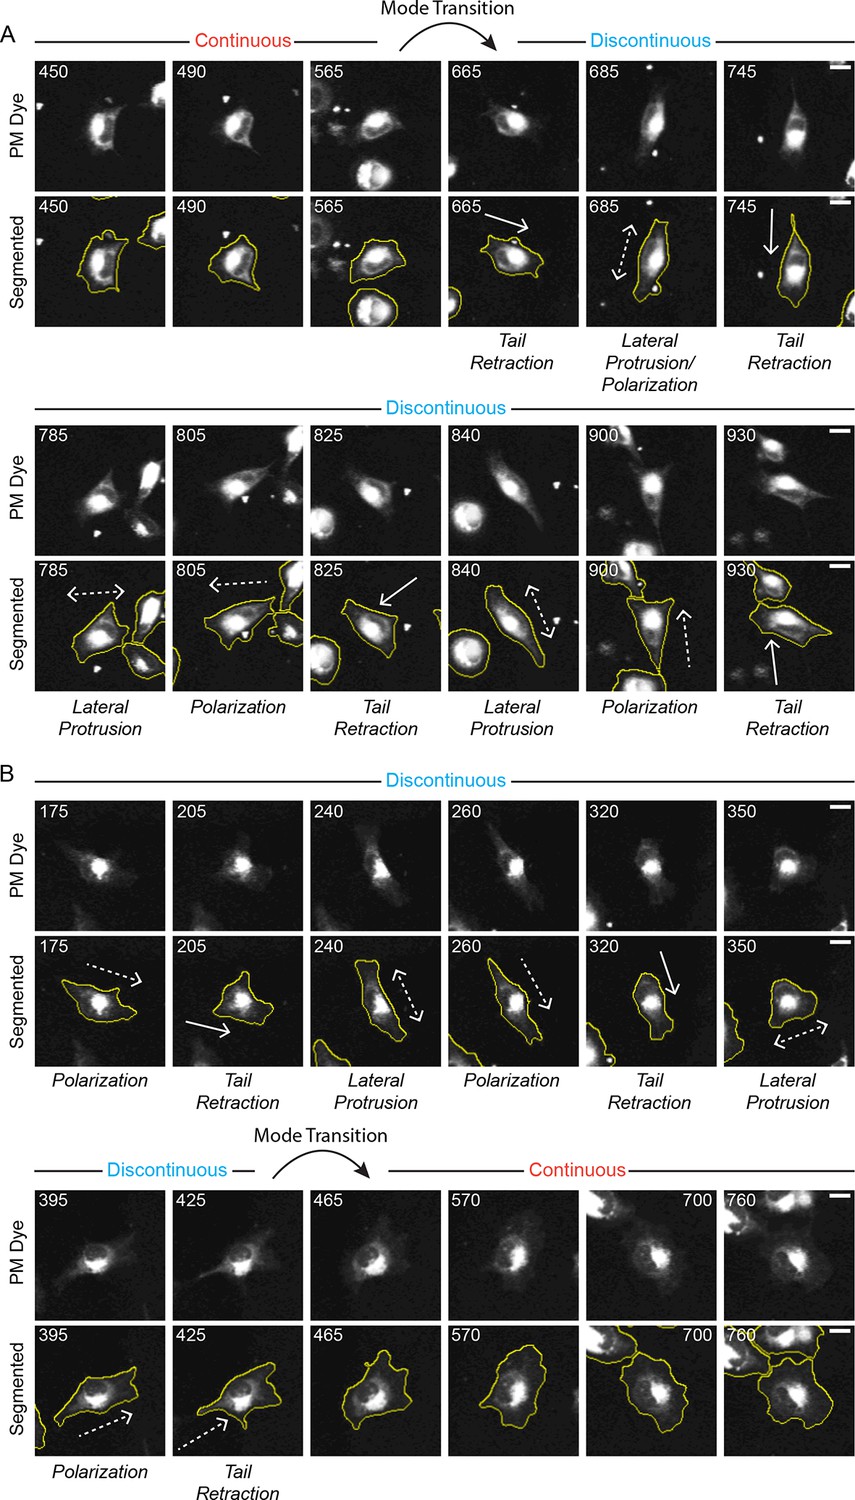
Discontinuous and Continuous migration modes can spontaneously inter-convert (mode switching).
Confocal image sequences show the spontaneous inter-conversion between Discontinuous and Continuous migration modes by H1299 P/L cells labeled with a far red membrane-dye on 5 µg/ml fibronectin-coated glass. (A) De-noised (upper) and segmented (lower) time sequences (numbers denote minutes) of a single cell spontaneously transitioning (switching) from the Continuous migration mode to the Discontinuous migration mode (see tracked cell in Video 4). The approximate timing of the Mode Transition is indicated. (B) De-noised (upper) and segmented (lower) time sequences of a single cell spontaneously transitioning (switching) from the Discontinuous migration mode to the Continuous migration mode (see tracked cell in Video 5). The approximate timing of the Mode Transition is indicated. Scale bars = 10 µm.
Figure 1—figure supplement 3
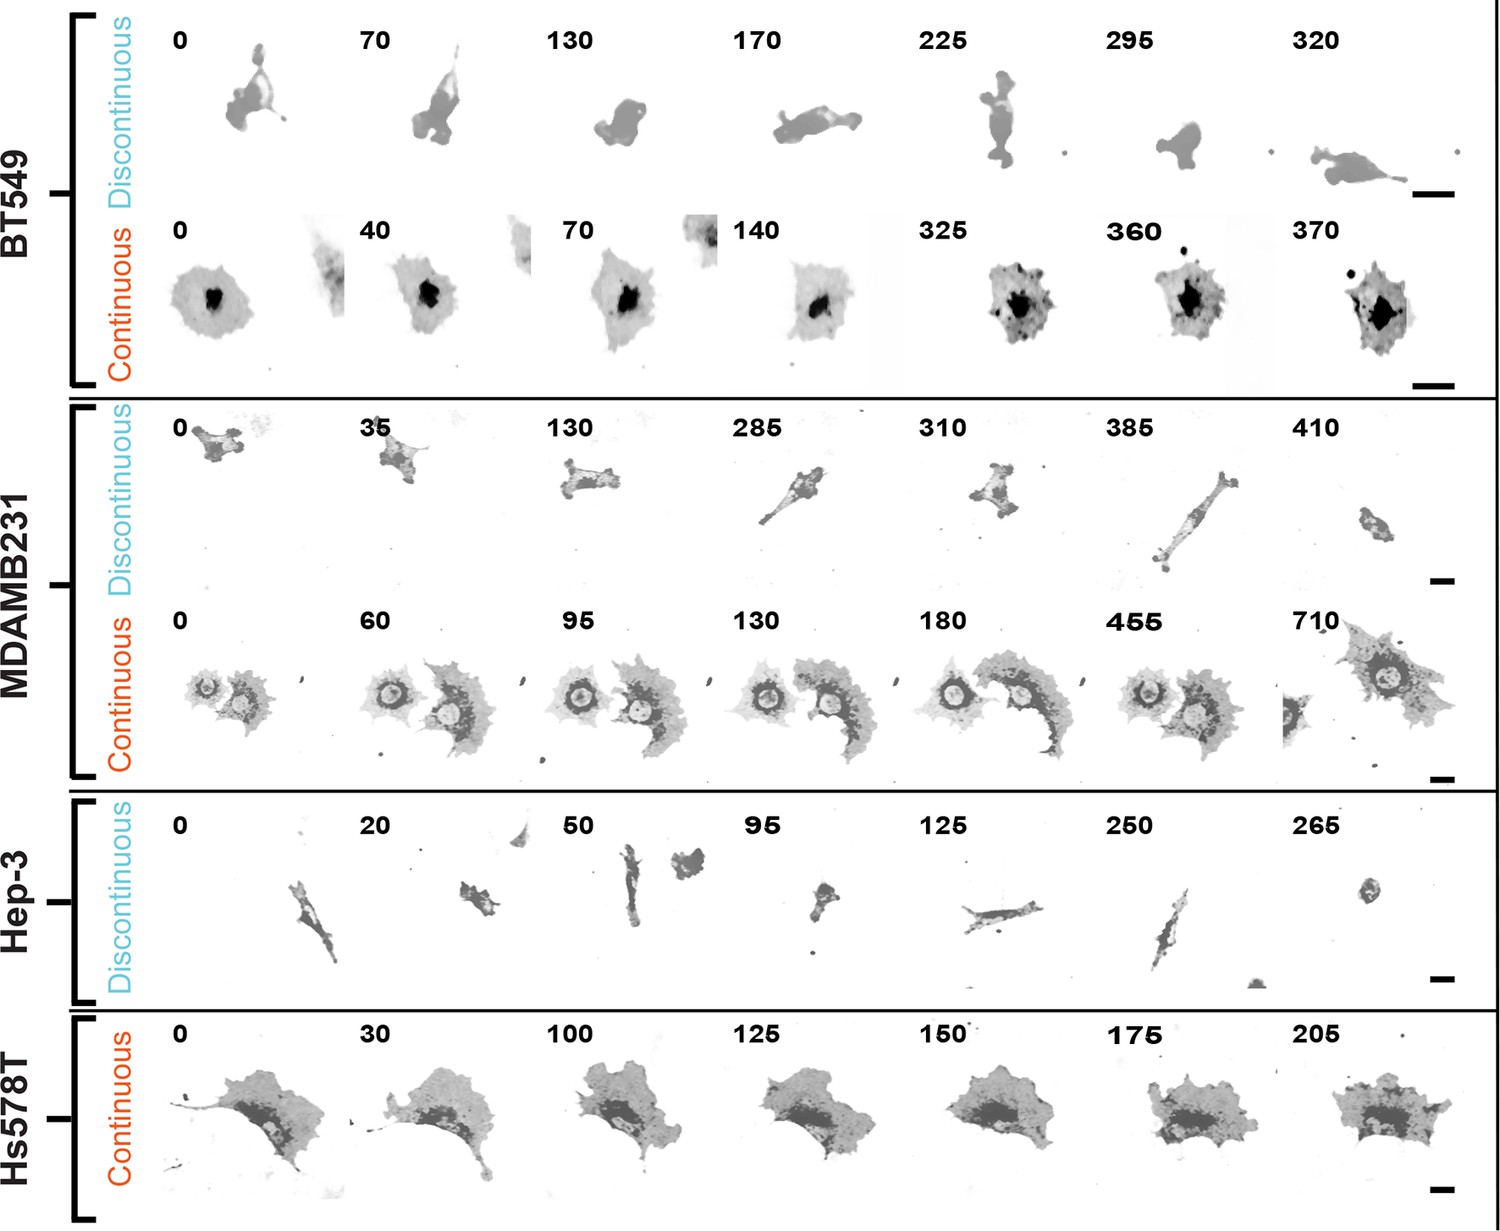
Discontinuous and/or Continuous migration modes recur in multiple cell types.
Confocal image sequences exemplifying Discontinuous and/or Continuous migration on 2.5 µg/ml fibronectin-coated glass by several cell types, including: BT549 (breast epithelial [ductal carcinoma]); MDA-MB-231 (breast epithelial [adenocarcinoma]); Hep-3 (hepatocellular carcinoma); and HS578T (breast epithelial [carcinoma]). Cells were labeled with a membrane dye and imaged at 5-min intervals. Images are displayed with gray-scale inverted. Numbers denote time (min). Movies corresponding to image sequences (in the order shown) are available in supporting material (Videos 6–11, respectively). Scale bars = 20 µm.
Figure 1—figure supplement 4
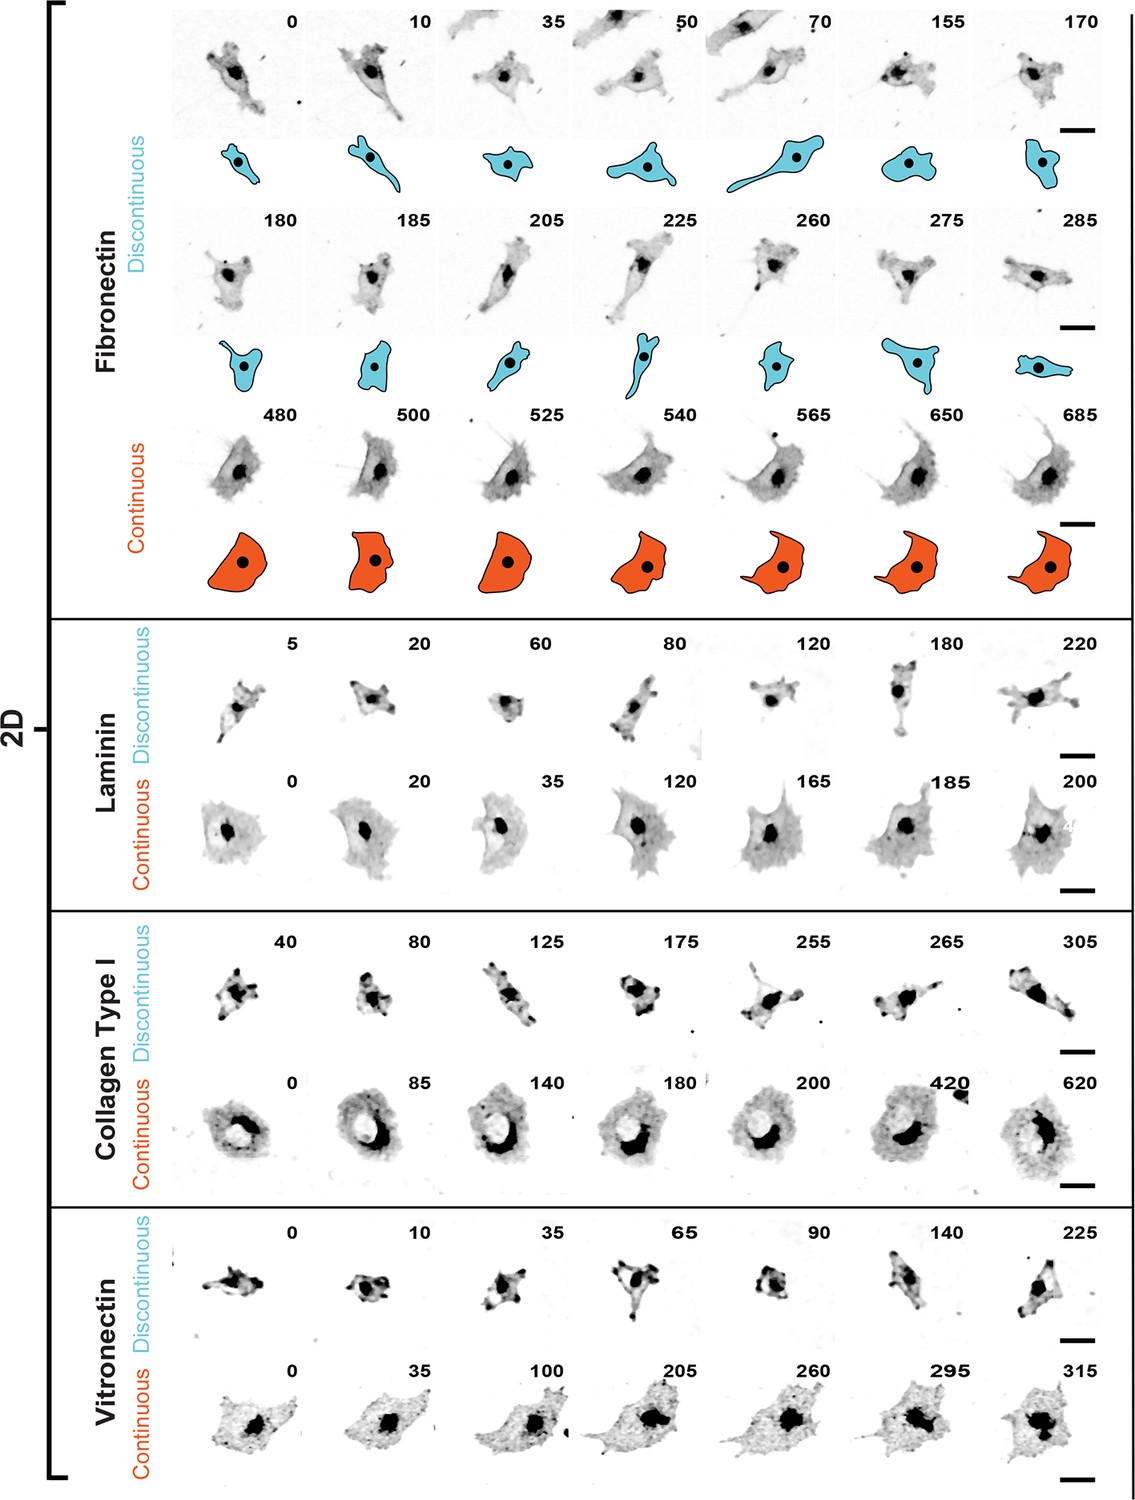
Discontinuous and Continuous migration modes recur in H1299 cells adhering to multiple extracellular matrix ligands.
Confocal image sequences exemplifying H1299 cell migration in Discontinuous and Continuous modes on glass coated with various purified extracellular matrix ligands, including: fibronectin (FN); Laminin; Collagen Type 1; and Vitronectin. Cells were labeled with a membrane dye and imaged at 5-min intervals. Images are displayed with gray-scale inverted. Numbers denote time (min). Schematics of sequences on FN detail the characteristic movement and morphology changes associated with each mode, as shown in Figure 1. See movies corresponding to image sequences (in the order shown but excluding fibronectin sequences; as this is shown in Videos 1,2) (Videos 12–17, respectively). Scale bars = 20 µm.
Figure 2
Membrane protrusion and retraction dynamics are temporally decoupled and less coordinated during Discontinuous migration.
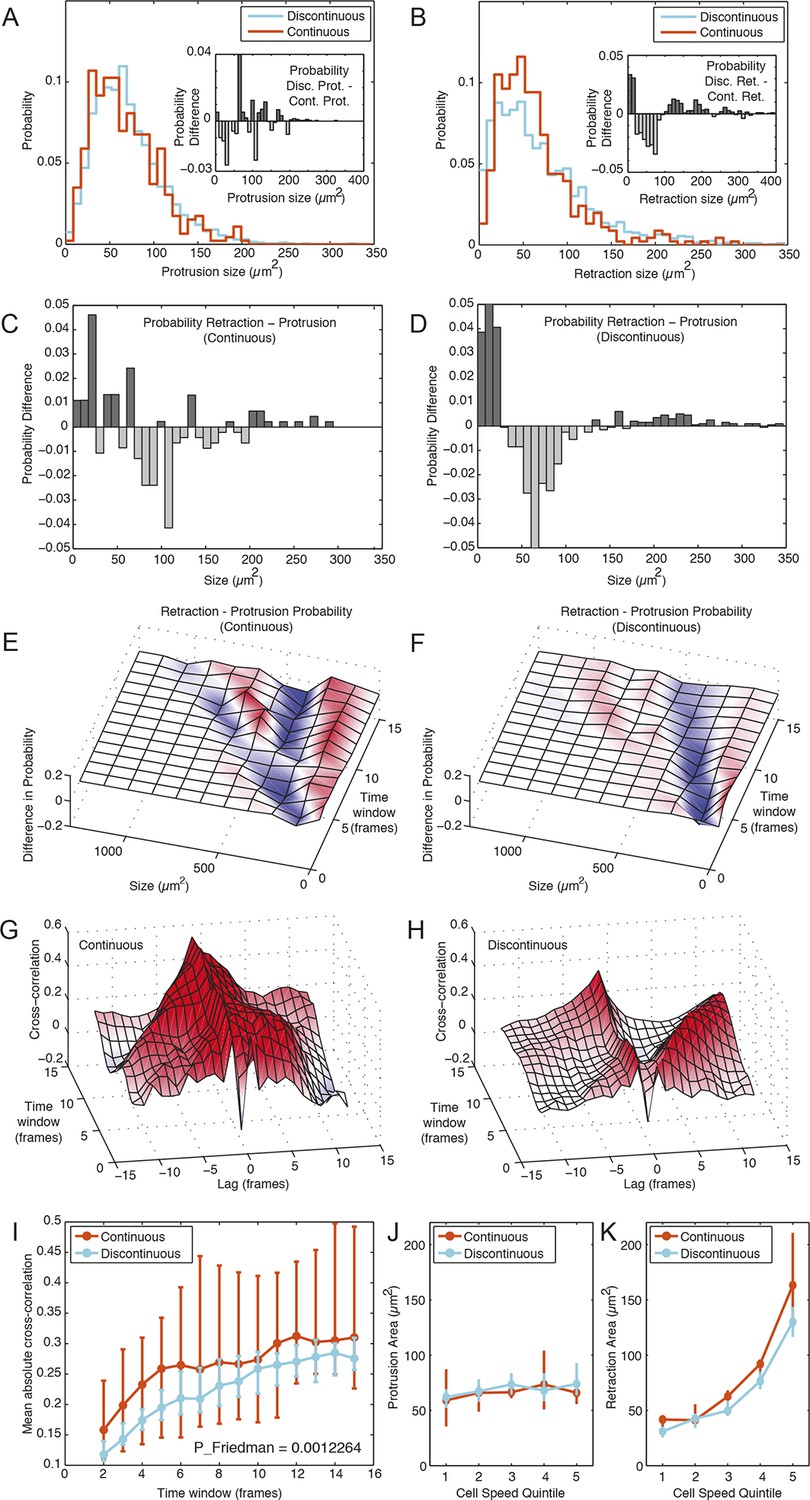
(A) Probability distribution of membrane protrusion sizes (µm2) per 5-min interval during Discontinuous (blue) and Continuous (orange) migration. Subtraction of the Continuous from Discontinuous protrusion size probability distribution (inset) reveals no substantial or structured difference in these distributions (probability difference, Y axis). (B) Probability distribution of membrane retraction sizes (µm2) per 5-min interval during Discontinuous (blue) or Continuous (orange) migration. Subtraction of the Continuous from Discontinuous retraction size probability distribution (inset) reveals that retraction sizes tend to be more extreme (frequently small or large, rarely moderate) in cells during Discontinuous migration (probability difference, Y axis). (C) Subtraction of the protrusion from retraction size probability distribution (5 min intervals only) during Continuous migration reveals little structure in probability differences. (D) Subtraction of the protrusion from retraction size probability distribution (5 min intervals only) during Discontinuous migration reveals that retractions in this mode are consistently more extreme in size (frequently small or large, rarely moderate) than protrusions. (E) Surface plotting of probability differences (retraction minus protrusion probability, per size) over various time windows (1 to 15 frames; 5 to 75 min) in cells during Continuous migration. Surface color-coding indicates where protrusions (blue) or retractions (red) are more common at a particular size. (F) Surface plotting of probability differences (retraction minus protrusion probability, per size) over various time windows (1 to 15 frames; 5 to 75 min) in cells during Discontinuous migration. (G) Signal cross-correlation was calculated between protrusion size and retraction size fluctuations per cell during Continuous migration. Mean cross-correlation values (Y axis, red = positive, blue = negative) plotted as a surface, per time lag (-12 to 12 frames, negative values indicate protrusion leads retraction, positive values indicate retraction leads protrusion), per time window (ranging from 1 to 15 frames; 5 to 75 min). (H) Signal cross-correlation was calculated between protrusion size and retraction size fluctuations per cell during Discontinuous migration. Mean cross-correlation values (Y axis, red = positive, blue = negative) plotted as a surface, per time lag (-12 to 12 frames, -ve values indicate protrusion leads retraction, +ve values indicate retraction leads protrusion), per time window (ranging from 1 to 15 time points; 5 to 75 min). (I) Mean (over all lags, per time window) absolute cross-correlation values for Continuous (orange) and Discontinuous (blue) migration, /- 95% confidence intervals, n = number of cells (see Materials and Methods). Statistical discernibility assessed by Friedman testing, p = 0.0012. (J) Cells in each migration mode were divided into quintiles (20% bins) based on instantaneous cell speed, and median protrusion areas /- 1.57 * interquartile range (IQR, 25% to 75%) / √n (approximates 95% confidence interval of the median, n = number of cell observations, see Materials and Methods) were calculated per quintile. (K) Median retraction areas /- 1.57 * IQR/ / √n (n = number of observations) were calculated per cell speed quintile.
Figure 3 with 1 supplement
Discontinuous and Continuous migration modes reflect quantitatively distinct cell states with unique signatures of underlying organization.
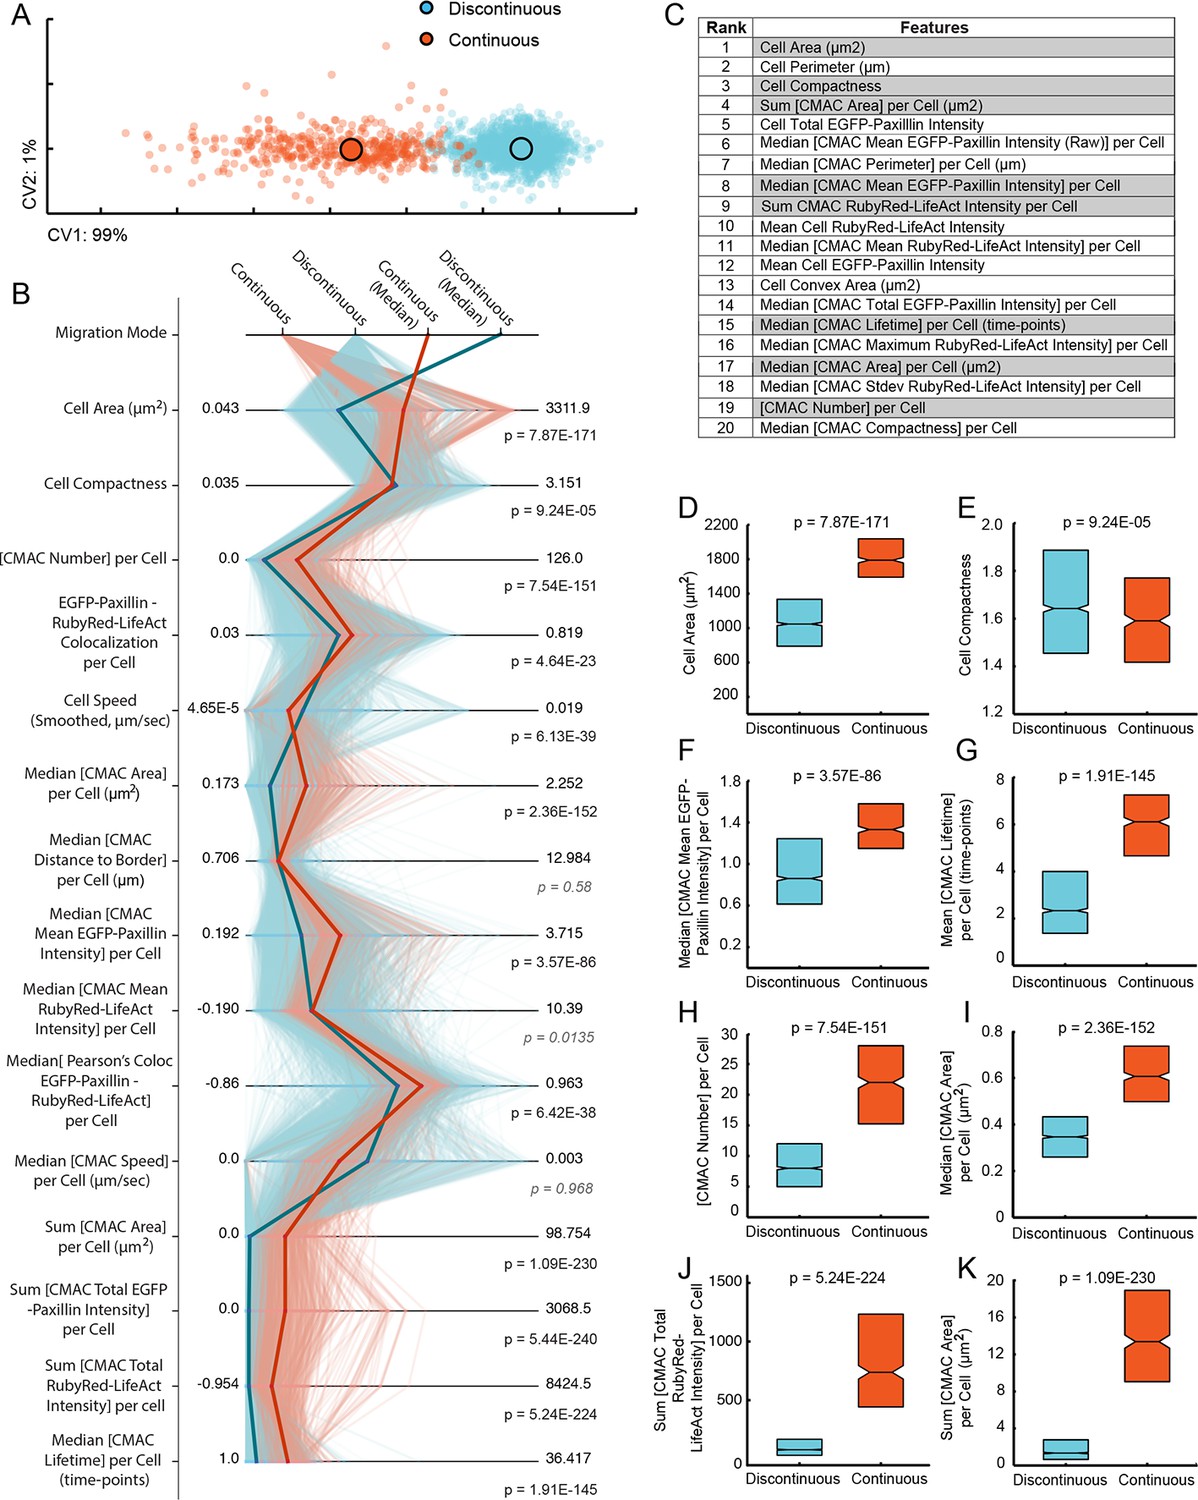
(A) Canonical vectors analysis (CVA)-based multivariate clustering (based on all 55 organizational features (see Figure 3—figure supplement 1), canonical vectors (CVs) 1 and 2 displayed, percentages indicate proportion of total variance per CV) of cell observations (see Materials and Methods) during Discontinuous (blue) or Continuous (orange) migration show modes to be quantitatively distinct. Large circles with black outlines indicate population centers of mass. (B) Parallel coordinate mapping of key organizational feature values (per cell observation) detail the multivariate signatures associated with cells during Discontinuous (light blue) or Continuous (light orange) migration. Points of difference between these multivariate signatures are emphasized by plotting of median values for Discontinuous (blue) and Continuous (orange) modes. Wilcoxon rank sum testing (per feature) assessed statistically discernable differences (p < 0.001), except where shown in gray italics. (C) A list of organizational features ranked by their contribution (coefficient values in canonical vector 1, which contains 99% of total variance) to the separation of migration modes in the canonical vectors space shown in (A). Gray backgrounds highlight features for which value distributions are compared between Discontinuous (blue) and Continuous (orange) modes in (D-K). (D-K) Features compared indicated on boxplot Y-axes. Boxplots show median values and inter-quartile ranges (IQR, 25% to 75%). Notches indicate median /- 1.57 * IQR/ / √n (approximates 95% confidence interval of the median, n = number of cell observations, as in (A). P values reflect Wilcoxon rank sum testing as in (B).
Figure 3—figure supplement 1
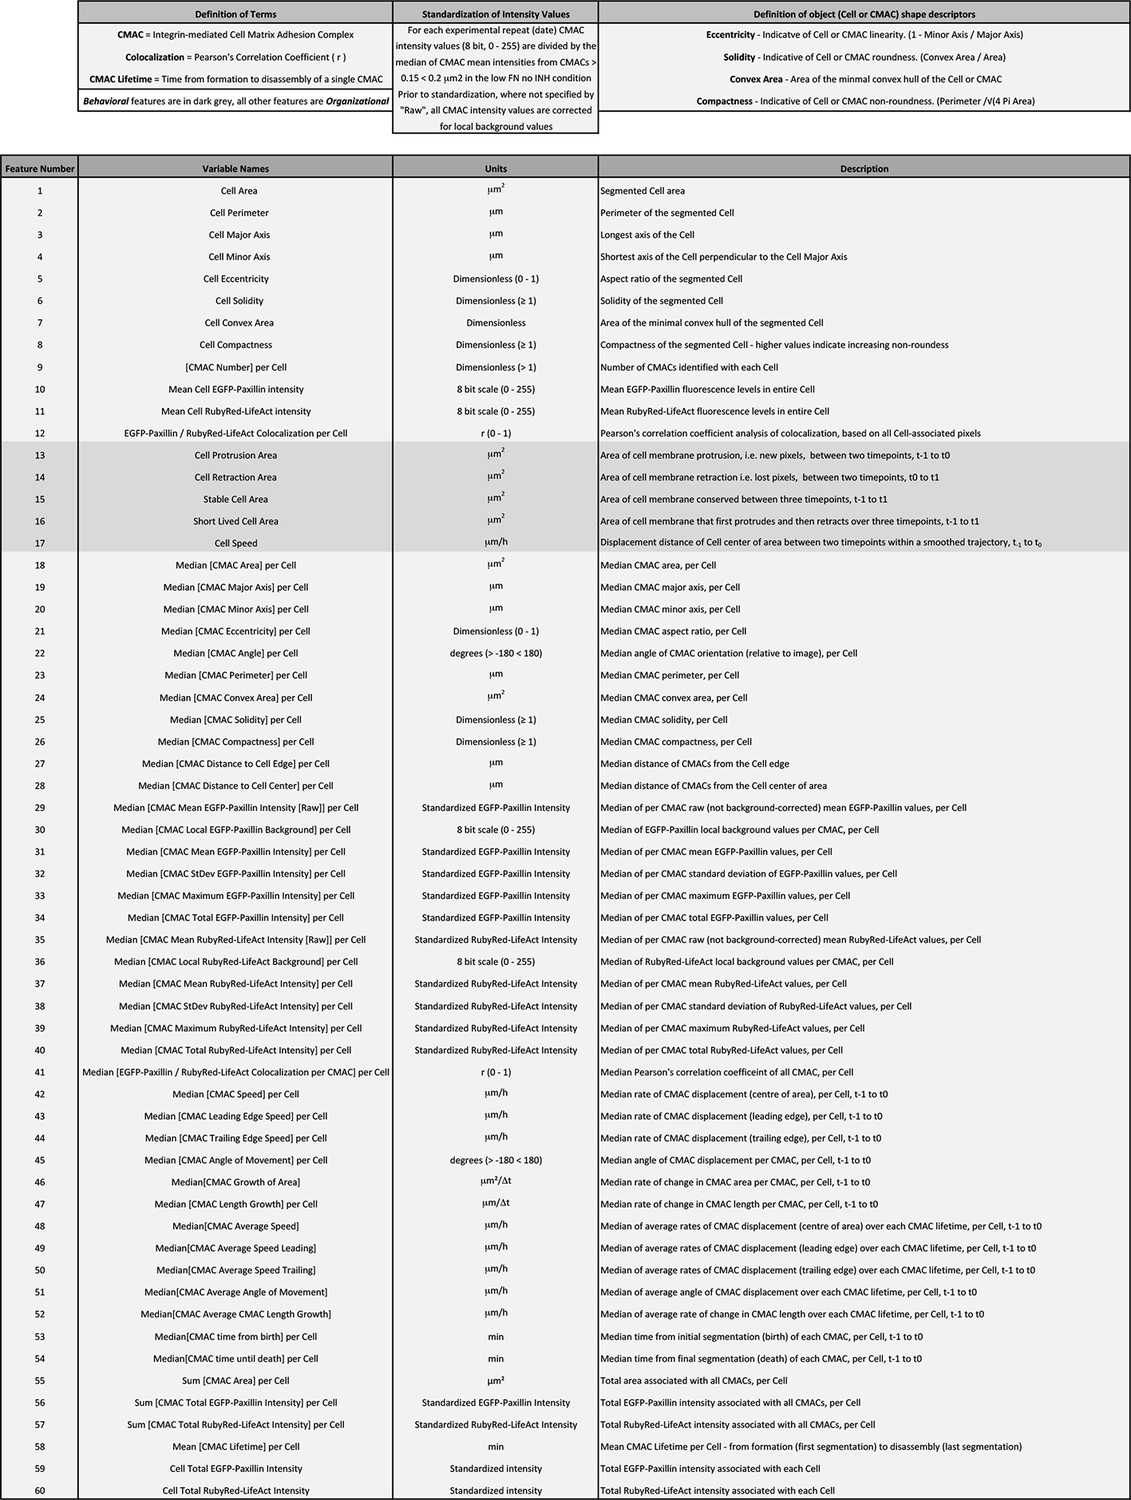
Definition of organizational and behavioral features.
This table defines the names, relevant measurement units, and a brief description of quantitative features derived through multiscale image analysis. Features are numbered 1-60 in correspondence with the order and numbering presented in Spearman's correlation heatmaps in Figure 4. Note, of these 60 features, 55 define Organizational features (light gray, used in multivariate clustering analyses), while 5 define the Behavioral features assessed herein (dark gray). Additional terms are defined above relevant columns.
Figure 4
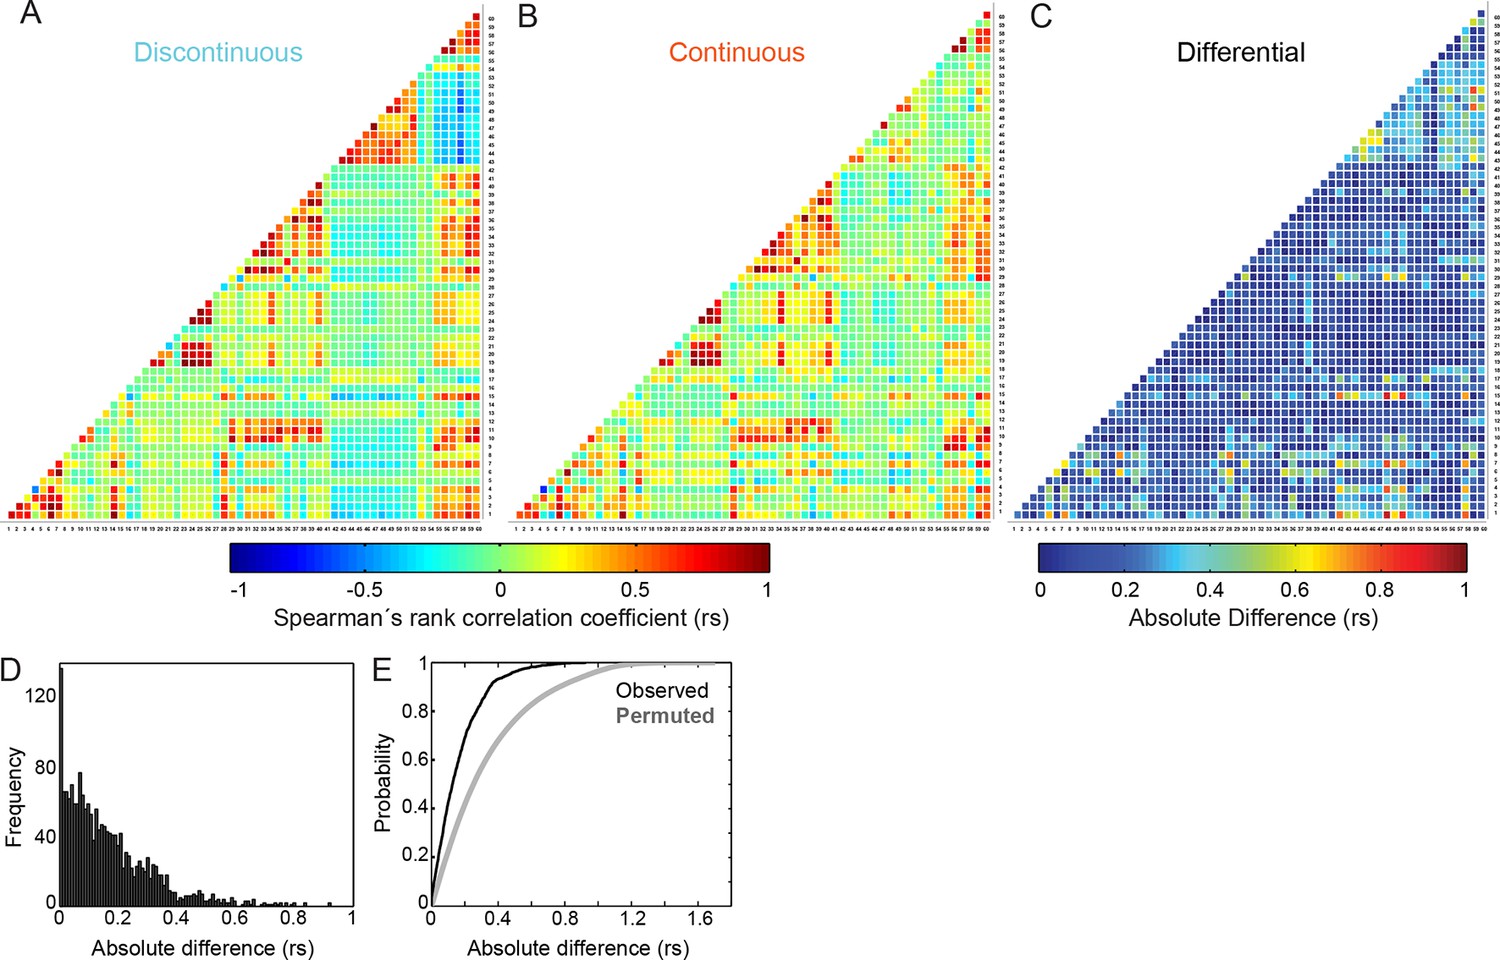
Differences in inter-feature relationships between Discontinuous and Continuous migration modes appear highly selective.
(A, B) Heatmaps of Spearman's rank correlation coefficients (rs) for all pairwise combinations between 60 features (55 organizational and 5 behavioral), derived from cells during (A) Discontinuous or (B) Continuous migration. Individual correlation coefficient values are color-coded as depicted in the color bar (blue = negative; red = positive; green = near zero). Numbers on X and Y axes (1 to 60) correspond to the identities of features, as defined in Feature Number column of Figure 3—figure supplement 1. (C) A heatmap summarizes absolute differences in correlation coefficient values, per feature pair, between Discontinuous and Continuous migration modes. Difference values are color-coded as depicted in the color bar (blue = no difference; red = large difference). (D) A histogram shows the frequency distribution of absolute differences in correlation coefficient values between Continuous and Discontinuous migration modes. (E) A plot of cumulative distribution functions (CDFs) comparing the observed distribution of absolute differences in correlation coefficient values (between Discontinuous and Continuous modes as in [C] and [D], black line) and the differences in coefficient values obtained following randomized permutation of Spearman's correlation pairs (gray line). The permuted distribution (repeated 100 times for all relationships, all values included in CDF) shows the expected distribution of coefficient differences if inter-feature correlation changes occur randomly. Comparison of observed and permuted CDFs suggests that observed differences in inter-feature Spearman's correlation values are far more selective than randomly expected.
Figure 5
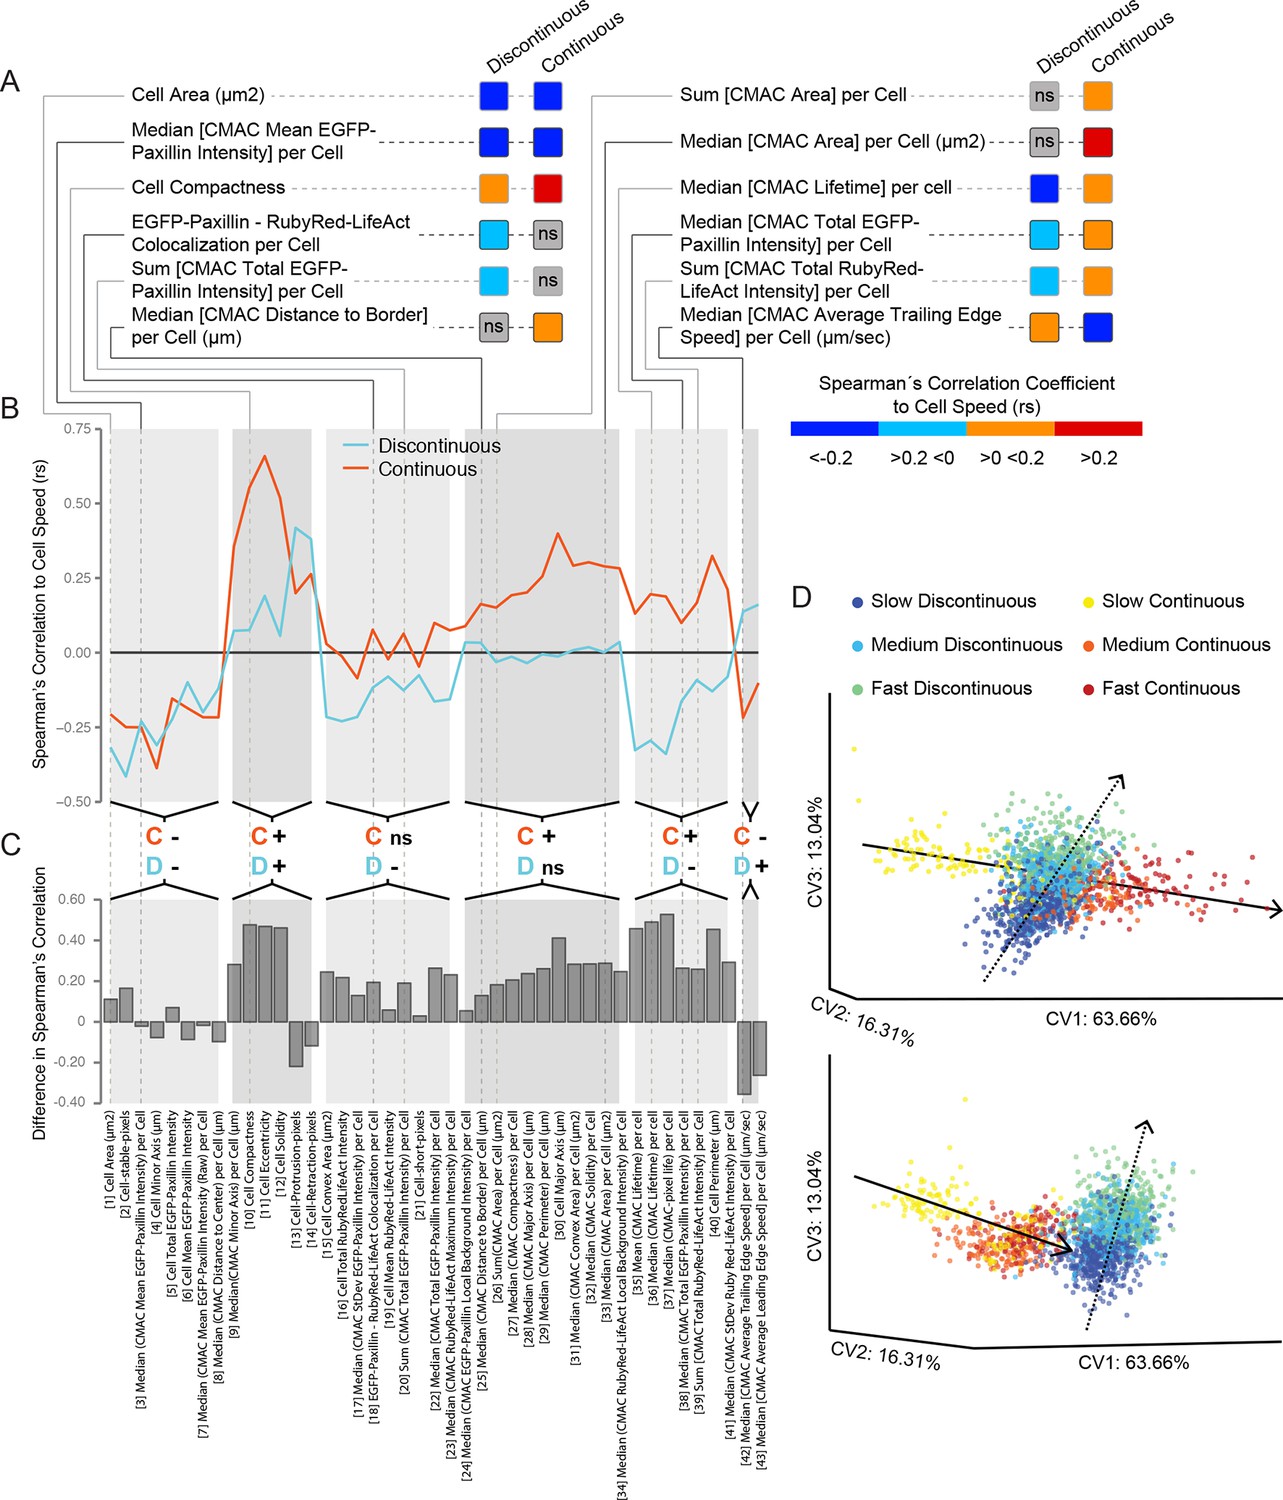
Cell speed variation is coupled to distinct patterns of remodeling in underlying features and inter-feature relationships within each migration mode.
(A) A selection of Spearman's correlation coefficient values (rs) for organizational feature relationships to cell speed are depicted (color-coded as in color bar). Values reflect medians of populations values. Correlations are considered non-significant (ns) if zero is included in the range of the median +/−1.57 * inter-quartile range (IQR, 25% to 75%)√n (approximates 95% confidence interval of the median, n = number of cell observations, see 'Materials and methods'). This highlights correlations to cell speed that: are equivalent between modes (e.g. Cell Area, negative correlation in both modes); exist in only one mode (e.g. Median [cell-matrix adhesion complex (CMAC) Area] per Cell, ns in Discontinuous vs positive in Continuous); or are opposite between modes (e.g. Median [CMAC Lifetime] per Cell, negative in Discontinuous vs positive in Continuous). Examples in A are linked to an extensive analysis of cell speed-to-organizational feature correlations in B and C. (B) Parallel coordinate mapping of median cell speed-to-organizational feature correlations in Discontinuous (blue) and Continuous (orange) modes. Relationships are categorized by correlation value similarity or difference between modes, as indicated by the orange; C' (denotes Continuous) and blue 'D' (denotes Discontinuous) followed by '−'; (negative rs) or '+' (positive rs) or 'ns' (non-significant rs). (C) Bar graphs depict the magnitude of differences in median cell speed-to-organizational feature correlation values from the Discontinuous to the Continuous mode. Correlations tend to be stronger and more positive in cells during Continuous migration. (D) Canonical vectors analysis (CVA)-based multivariate clustering (using all 55 organizational features, canonical vectors [CV] 1, 2, and 3 displayed, percentages indicate proportion of total variance per CV) of cell observations during: slow Discontinuous (0–33.33% of Discontinuous migration speed values, blue); medium Discontinuous (33.34–66.66%, cyan); fast Discontinuous (66.67–100%, green); slow Continuous (0–33.33% of Continuous migration speed values, yellow); medium Continuous (33.34–66.66%, orange); or fast Continuous (66.67–100%, red) migration. Two orientations of the same three-dimensional clustering are depicted (upper and lower), revealing the separate clustering of each migration mode. Within each mode, progressive differences in cell speed correspond to similarly progressive variations in the position of observations within the multivariate organizational feature (or cell state) space. These speed-dependent trends in clustering define trajectories in the cell state space along which cells evolve as cell speed changes. Remarkably, these trajectories are completely distinct when comparing Discontinuous (dashed lines) and Continuous (solid lines) migration modes.
Figure 6 with 1 supplement
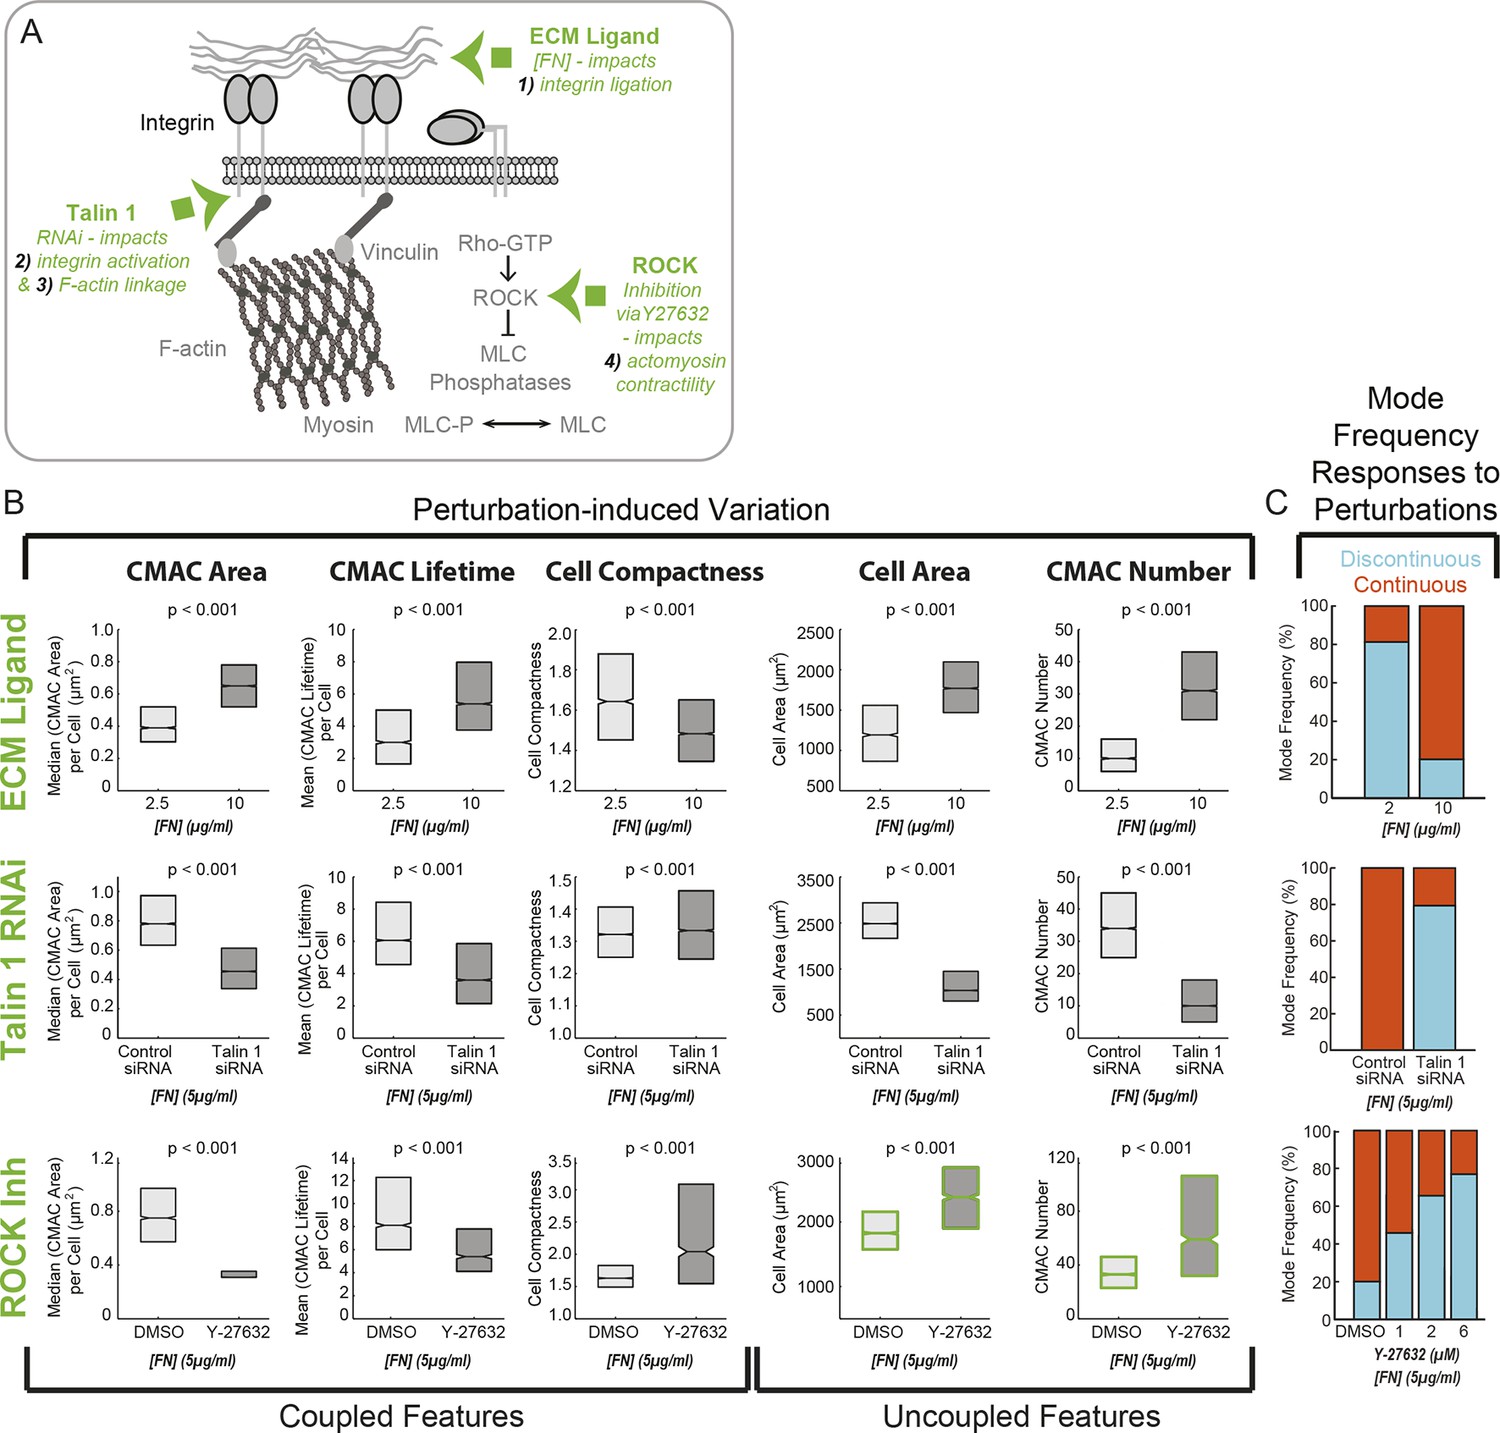
Cell-matrix adhesion and actomyosin contractility control the equilibrium between Continuous and Discontinuous migration modes.
(A) Schematic summary of molecular mechanisms (green) associated with the ECM – adhesion – F-actin axis (gray) targeted here for perturbation to modulate implicated organizational features and, potentially, corresponding migration mode frequencies. Specifically, altering ECM ligand density (fibronectin concentration, [FN]) impacts mechanism 1) - integrin ligation and subsequent cell-matrix adhesion complex (CMAC) formation and maturation. RNAi-mediated knockdown of talin 1 limits both mechanism 2) - integrin activation and mechanism 3) - integrin-F-actin linkage, thereby also affecting CMAC formation, maturation and stability. Y-27632-mediated inhibition of ROCK disrupts mechanism 4) - actomyosin contractility, affecting F-actin dynamics and CMAC maturation. Images exemplifying the effects of each molecular perturbation are presented in Figure 6—figure supplement 1. (B) Boxplots summarizing the response of the same selection of organizational features to: ECM ligand modulation (2.5 µg/ml FN vs 10 µg/ml FN, upper row); talin 1 RNAi (control siRNA vs talin 1 siRNA, 5 µg/ml FN, middle row); or ROCK inhibition (DMSO vs 6 µM Y-27632, 5 µg/ml FN, lower row). All boxplots in B show median values per condition and inter-quartile ranges (IQR, 25% to 75%). Notches show the median +/−1.57 * IQR/ / √n (approximates 95% confidence interval of the median, n = number of cell observations, see 'Materials and methods'). In each case, statistically discernable differences were assessed by Wilcoxon rank sum testing, with resulting p values <0.001. (C) Migration mode frequency responses to each perturbation are depicted (Discontinuous, blue; Continuous, orange). Additional conditions were included for ROCK inhibition (low panel), showing a progressive response to 1 µM, 2 µM, and 6 µM Y-27632 as compared to DMSO vehicle control. Note: in addition to depicting specific perturbation-dependent trends, the matrix of results presented in B and C is used, together with spontaneous feature variations depicted in Figure 3D,E,G–I, to logically parse organizational features that are consistently coupled, or just occasionally correlated, with migration mode identity.
Figure 6—figure supplement 1
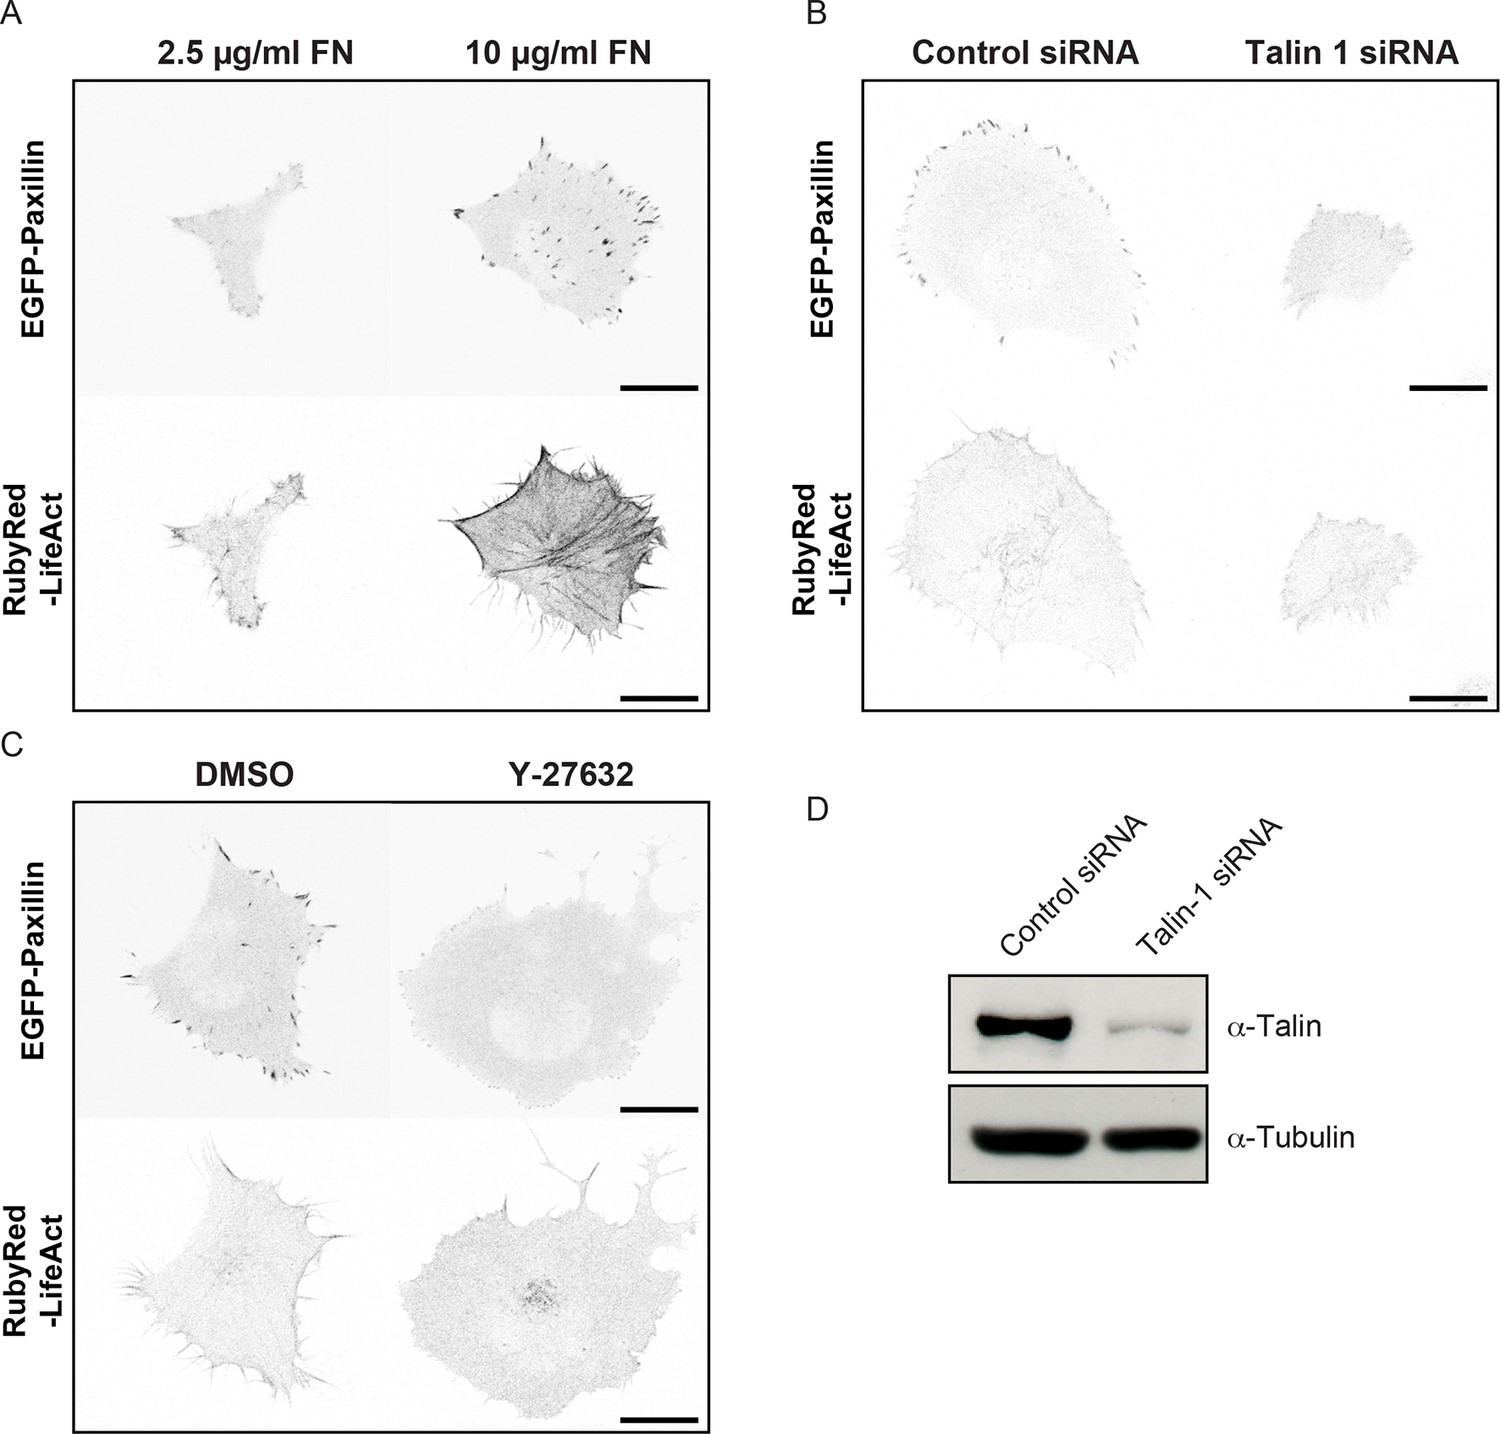
Comparison of cell, adhesion complex and F-actin morphologies following perturbations targeting the ECM – adhesion – F-actin axis.
Confocal images of H1299 cells comparing: (A) low concentration (2.5 µg/ml) fibronectin (FN)-coated glass (left) vs high concentration (10 µg/ml) FN-coated glass (right); (B) control siRNA treatment (left) vs talin 1 siRNA treatment (right); and (C) control (DMSO) treatment (left) vs ROCK inhibitor (Y-27632, 6 µM) treatment (right). EGFP-paxillin (upper panels) and RubyRed-LifeAct (lower panels) signals are shown to demarcate cell-matrix adhesion complexes (CMACs) and F-actin, respectively. Images are displayed with gray-scale inverted. (D) Talin 1 knockdown was confirmed by immunoblotting. Scale bars = 20 µm.
Figure 7 with 1 supplement
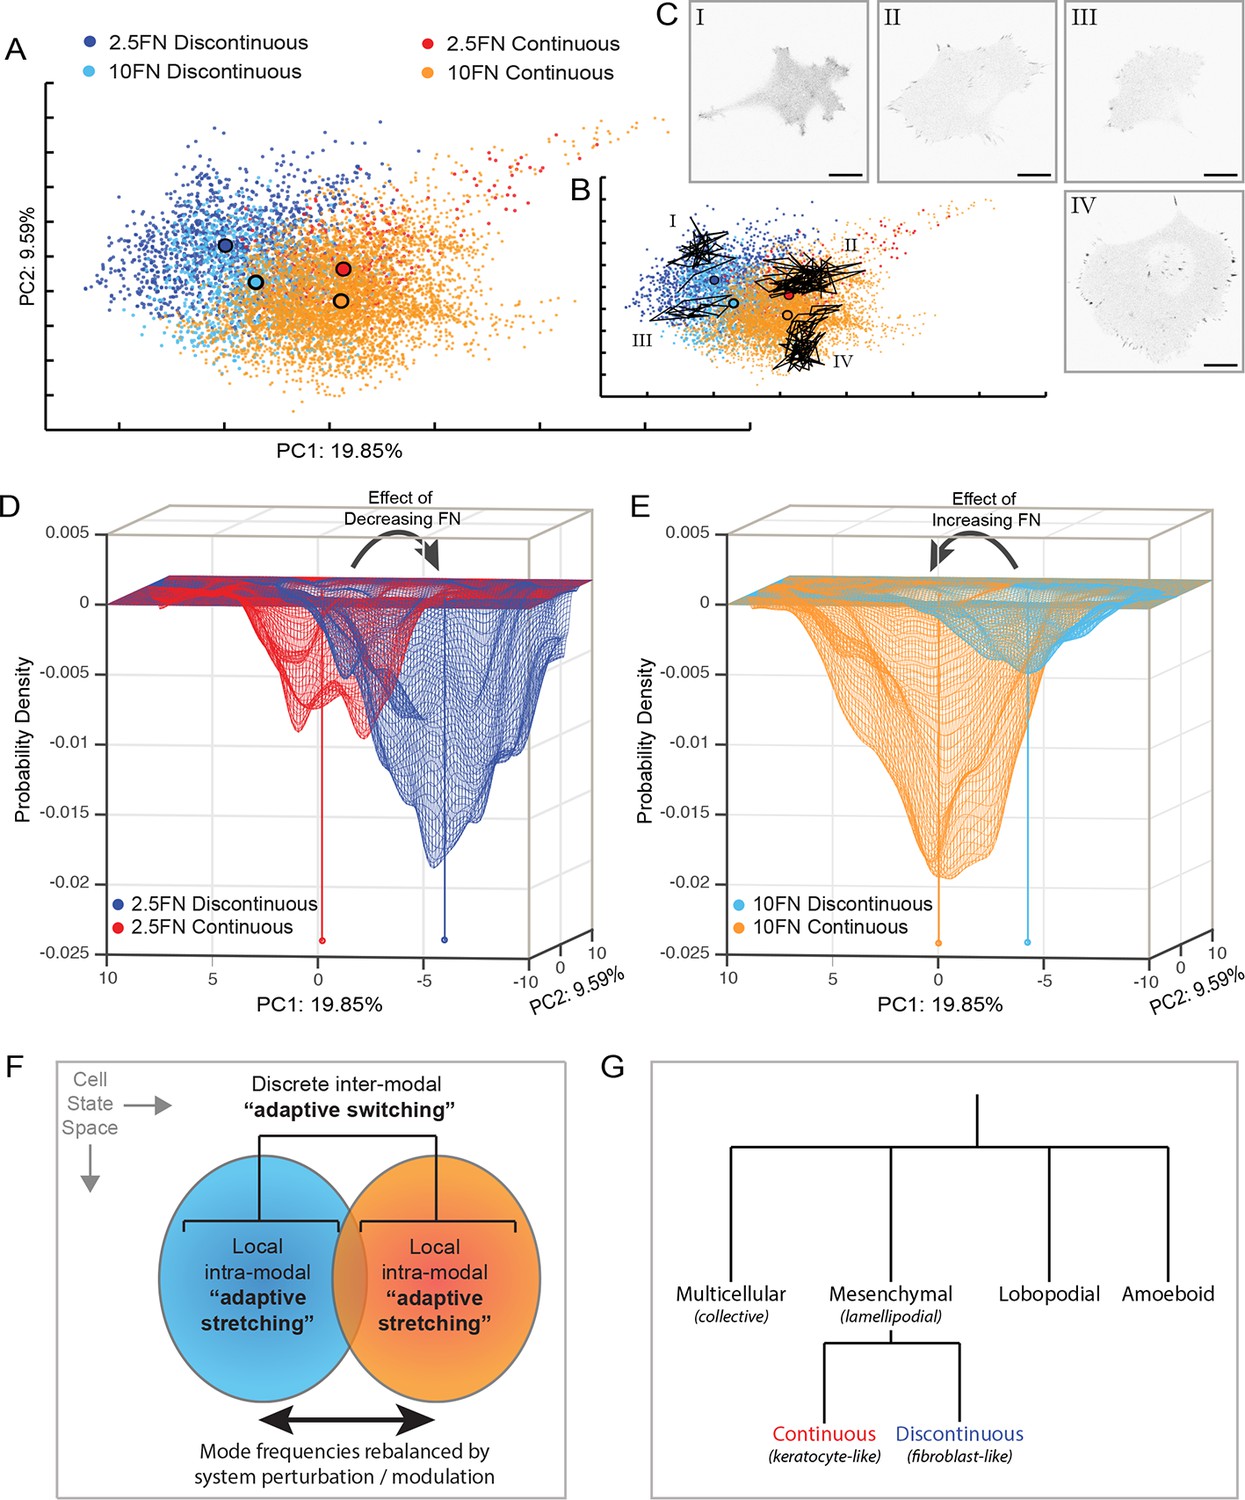
Adaptive switching between migration modes is the dominant perturbation response rather than intra-modal remodeling.
(A) Principal component analysis (PCA)-based clustering of cell observations (based on all 55 organizational features), principal components (PC) 1 and 2 displayed, percentages indicate proportion of total variance per PC, color-coded by migration mode and experimental condition: Discontinuous mode on 2.5 µg/ml FN (dark blue); Discontinuous mode on 10 µg/ml FN (light blue); Continuous mode on 2.5 µg/ml FN (red); Continuous mode on 10 µg/ml FN (orange). Large black outlined circles indicate population centers of mass. Note that, despite FN variation exerting large effects on cell organization, differences between migration modes are much larger that differences between conditions within the same mode. (B) PCA clustering as in (A), overlaid by the heterogeneous trajectories over time of 4 cells (I–IV) within the PCA-based multivariate state space. Cells I–IV belong to the spatially corresponding cell populations defined in (A) and are relatively constrained within their respective regions of the cell state space. (C) Single time point confocal images of EGFP-paxillin from Cells I–IV from (B). Images are displayed with gray-scale inverted. Corresponding image sequence selections are presented in Figure 7—figure supplement 1. Scale bars = 20 µm. (D) A probability density map based on the coordinates in PCA space of cell observations from the 2.5 µg/ml FN condition in (A) (view orientation relative to A is rotated 180 degrees). Cells in the Discontinuous mode (dark blue) define a deep probability valley that partially overlaps with but is largely distinct from a shallow probability valley defined by cells in the Continuous mode (red). The sum of probabilities equals 1. (E) A probability density map based on the coordinates in PCA space of cell observations from the 10 µg/ml FN condition in (A) (view orientation relative to A is rotated 180 degrees). Cells in the Continuous mode (orange) define a deep probability valley that overlaps with but is partly distinct from a shallow probability valley defined by cells in the Discontinuous mode (light blue). The sum of probabilities equals 1. Centers of mass for each population in (D) and (E) are indicated by capped vertical lines of matching colors. Arrows in (D) and (E) signify how decreasing or increasing FN concentration, respectively, causes 'switching' from one probability valley (migration mode) to the other. (F) Schematic summary of the dual adaptive strategies employed by cells, with respect to mesenchymal migration. Modulation of intracellular or extracellular conditions can cause the remodeling of cellular and macromolecular organization locally within a given mode ('adaptive stretching'). However, the much larger and more frequent response to such perturbations is 'adaptive switching' between discrete migration modes, resulting in substantial rebalancing of Discontinuous and Continuous migration mode frequencies. (G) Dendogram (qualitative) indicating the major recognized archetypes of cell migration (top row) and the new modalities of Continuous and Discontinuous mesenchymal migration described herein (bottom row). Italicized names in brackets correspond to similar/analogous migration modes/terms.
Figure 7—figure supplement 1
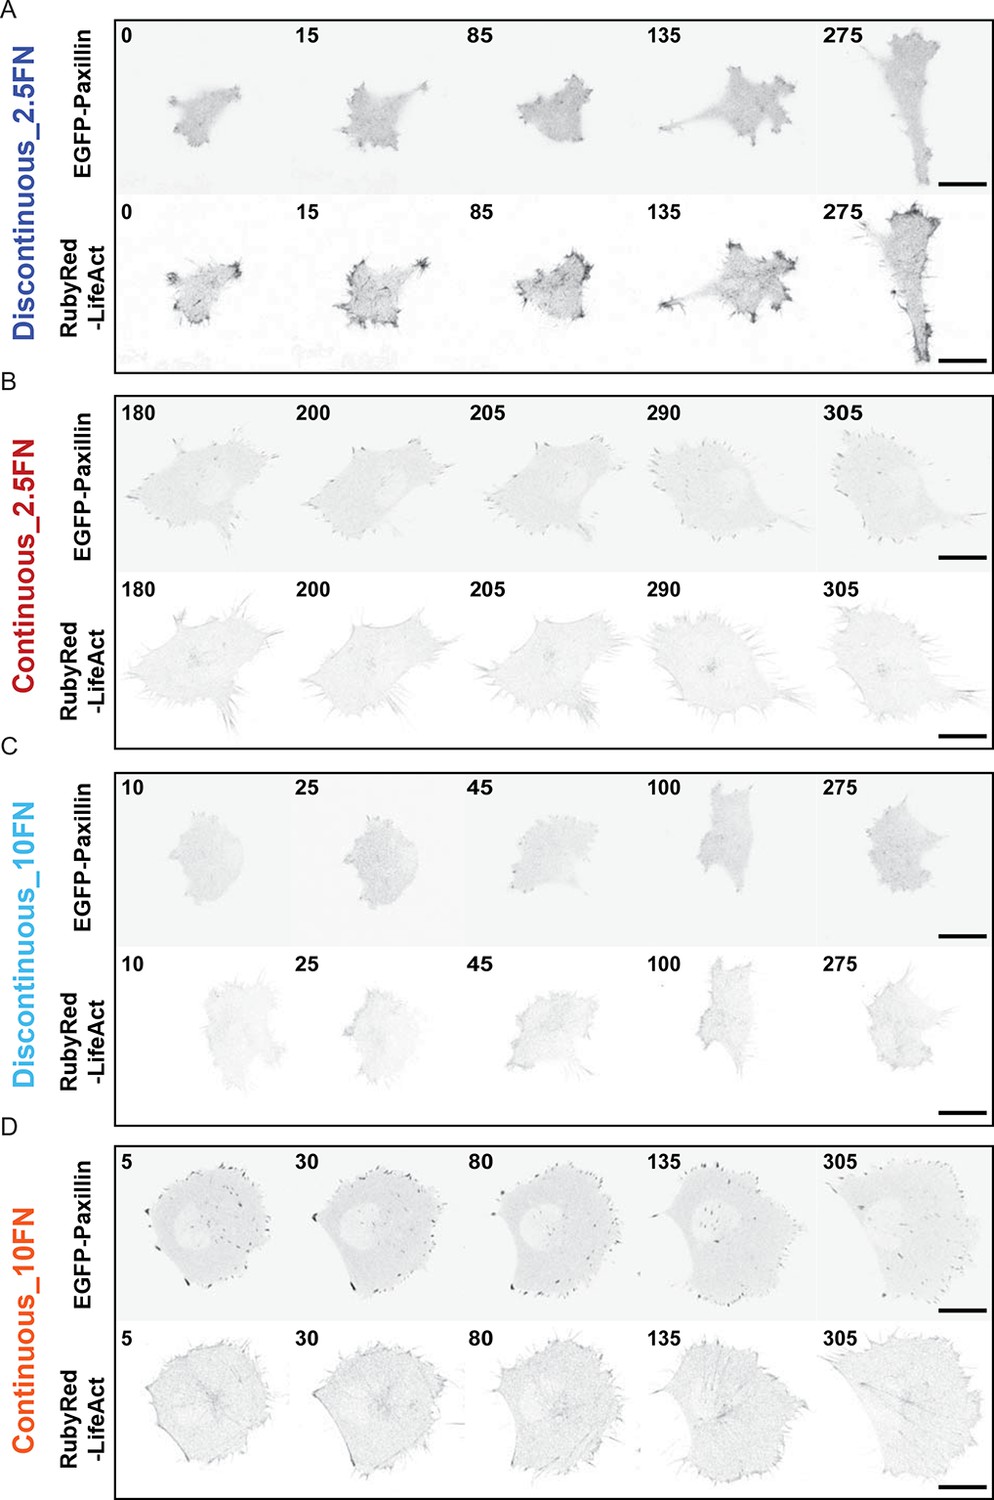
Confocal image sequences of cells during Discontinuous and Continuous mode migration on glass coated with low or high fibronectin concentrations.
Confocal image sequences of H1299 cells during migration on low concentration (2.5 µg/ml) fibronectin (FN)-coated glass (A and B) or high concentration (10 µg/ml) FN-coated glass (C and D). EGFP-paxillin (upper panels) and RubyRed-LifeAct (lower panels) signals are shown to demarcate cell-matrix adhesion complexes (CMACs) and F-actin, respectively. Images are displayed with gray-scale inverted. Numbers denote time (min). Scale bars = 20 µm.
Videos
Video 1
H1299 P/L cell migration in the Discontinuous mode.
High-resolution multiscale imaging of a single H1299 P/L cell expressing EGFP-paxillin (green, CMAC marker) and RubyRed-LifeAct (red, F-actin marker) during migration in the Discontinuous mode on 2.5 µg/ml fibronectin. Time in minutes shown.
Video 2
H1299 P/L cell migration in the Continuous mode.
High-resolution multiscale imaging of a single H1299 P/L cell expressing EGFP-paxillin (green, CMAC marker) and RubyRed-LifeAct (red, F-actin marker) during migration in the Continuous mode on 2.5 µg/ml fibronectin. Time in minutes shown.
Video 3
Parallel emergence of Discontinuous and Continuous modes in H1299 P/L cells.
Low-resolution imaging of H1299 P/L cells labeled with a membrane dye shows the parallel emergence of both Discontinuous (e.g. dark blue outline, trajectory shown) and Continuous (e.g. light blue outline, trajectory shown) modes under uniform conditions.
Cells have been segmented and tracked to highlight morphologies and trajectories. Note that two cells in the Continuous mode (yellow and lilac outlines) pass through the substrate region traversed by the Discontinuous mode cell (dark blue), yet these cells remain in the Continuous mode. This implies that these migration modes are not simply determined by (possible) local variations in, for example, ECM substrate (5 µg/ml fibronectin). Time in minutes shown.
Video 4
Migration mode transition from Continuous to Discontinuous motility.
Low-resolution imaging of H1299 P/L cells labeled with a membrane dye, during random migration on 5 µg/ml fibronectin. Cells have been segmented and tracked to highlight morphologies and trajectories. Note that the cell with light green outline (trajectory shown) transitions from Continuous to Discontinuous migration during the course of imaging. Time in minutes shown.
Video 5
Migration mode transition from Discontinuous to Continuous motility.
Low-resolution imaging of H1299 P/L cells labeled with a membrane dye, during random migration on 5 µg/ml fibronectin. Cells have been segmented and tracked to highlight morphologies and trajectories. Note that the cell with light green outline (trajectory shown) transitions from Discontinuous to Continuous migration during the course of imaging. Time in minutes shown.
Video 6
BT549 cell migration in the Discontinuous mode.
A single BT549 cell migrating in the Discontinuous mode. Cropped from a larger image montage. Cells labeled with a membrane dye during random migration on 2.5 µg/ml fibronectin. Image intensity scale inverted and brightness linearly adjusted for visualization (note: intensity data are not quantified). Time in minutes shown.
Video 7
BT549 cell migration in the Continuous mode.
A single BT549 cell migrating in the Continuous mode (upper centre cell). Cropped from a larger image montage (note, montage stitching can cause observable intensity boundaries in image; however, these have no effect on interpretation). Cells labeled with a membrane dye during random migration on 2.5 µg/ml fibronectin. Image intensity scale inverted and brightness linearly adjusted for visualization (note: intensity data are not quantified). Time in minutes shown.
Video 8
MDA-MB-231 cell migration in the Discontinuous mode.
A single MDA-MB-231 cell migrating in the Discontinuous mode. Cropped from a larger image montage. Cells labeled with a membrane dye during random migration on 2.5 µg/ml fibronectin. Image intensity scale inverted and brightness linearly adjusted for visualization (note: intensity data are not quantified). Time in minutes shown.
Video 9
MDA-MB-231 cell migration in the Continuous mode.
MDA-MB-231 cells migrating in the Continuous mode. Cropped from a larger image montage. Cells labeled with a membrane dye during random migration on 2.5 µg/ml fibronectin. Image intensity scale inverted and brightness linearly adjusted for visualization (note: intensity data are not quantified). Time in minutes shown.
Video 10
Hep3 cell migration in the Discontinuous mode.
Hep3 cells migrating in the Discontinuous mode. Cropped from a larger image montage (note, montage stitching can cause observable intensity boundaries in image; however, these have no effect on interpretation). Cells labeled with a membrane dye during random migration on 2.5 µg/ml fibronectin. Image intensity scale inverted and brightness linearly adjusted for visualization (note: intensity data is not quantified). Time in minutes shown.
Video 11
HS578T cell migration in the Continuous mode.
A single HS578T cell migrating in the Continuous mode. Cropped from a larger image montage. Cells labeled with a membrane dye during random migration on 2.5 µg/ml fibronectin. Image intensity scale inverted and brightness linearly adjusted for visualization (note: intensity data are not quantified). Time in minutes shown.
Video 12
H1299 P/L cell migration in the Discontinuous mode on laminin.
H1299 P/L cells migrating in the Discontinuous mode. Cropped from a larger image montage. Cells labeled with a membrane dye during random migration on 2 µg/ml laminin. Image intensity scale inverted and brightness linearly adjusted for visualization (note: intensity data are not quantified). Time in minutes shown.
Video 13
H1299 P/L cell migration in the Continuous mode on laminin.
A single H1299 P/L cell migrating in the Continuous mode. Cropped from a larger image montage. Cells labeled with a membrane dye during random migration on 50 µg/ml laminin. Image intensity scale inverted and brightness linearly adjusted for visualization (note: intensity data are not quantified). Time in minutes shown.
Video 14
H1299 P/L cell migration in the Discontinuous mode on collagen type 1.
H1299 P/L cells migrating in the Discontinuous mode. Cropped from a larger image montage. Cells labeled with a membrane dye during random migration on 2 µg/ml collagen type 1. Image intensity scale inverted and brightness linearly adjusted for visualization (note: intensity data are not quantified). Time in minutes shown.
Video 15
H1299 P/L cell migration in the Continuous mode on collagen type 1.
H1299 P/L cells migrating in both Discontinuous and Continuous modes. Cropped from a larger image montage. Cells labeled with a membrane dye during random migration on 5 µg/ml collagen type 1. Image intensity scale inverted and brightness linearly adjusted for visualization (note: intensity data are not quantified). Time in minutes shown.
Video 16
H1299 P/L cell migration in the Discontinuous mode on vitronectin.
A single H1299 P/L cell migrating in the Discontinuous mode. Cropped from a larger image montage. Cells labeled with a membrane dye during random migration on 1 µg/ml vitronectin. Image intensity scale inverted and brightness linearly adjusted for visualization (note: intensity data are not quantified). Time in minutes shown.
Video 17
H1299 P/L cell migration in the Continuous mode on vitronectin.
A single H1299 P/L cell migrating in the Continuous mode. Cropped from a larger image montage. Cells labeled with a membrane dye during random migration on 1 µg/ml vitronectin. Image intensity scale inverted and brightness linearly adjusted for visualization (note: intensity data are not quantified). Time in minutes shown.
Download links
A two-part list of links to download the article, or parts of the article, in various formats.
Downloads (link to download the article as PDF)
Open citations (links to open the citations from this article in various online reference manager services)
Cite this article (links to download the citations from this article in formats compatible with various reference manager tools)
An analysis toolbox to explore mesenchymal migration heterogeneity reveals adaptive switching between distinct modes
eLife 5:e11384.
https://doi.org/10.7554/eLife.11384


