Ret function in muscle stem cells points to tyrosine kinase inhibitor therapy for facioscapulohumeral muscular dystrophy
- King's College London, United Kingdom
- University College London, United Kingdom
- Berlin Institute of Health, Germany
- Charite Universitatsmedizin Berlin, Germany
Figures
Figure 1
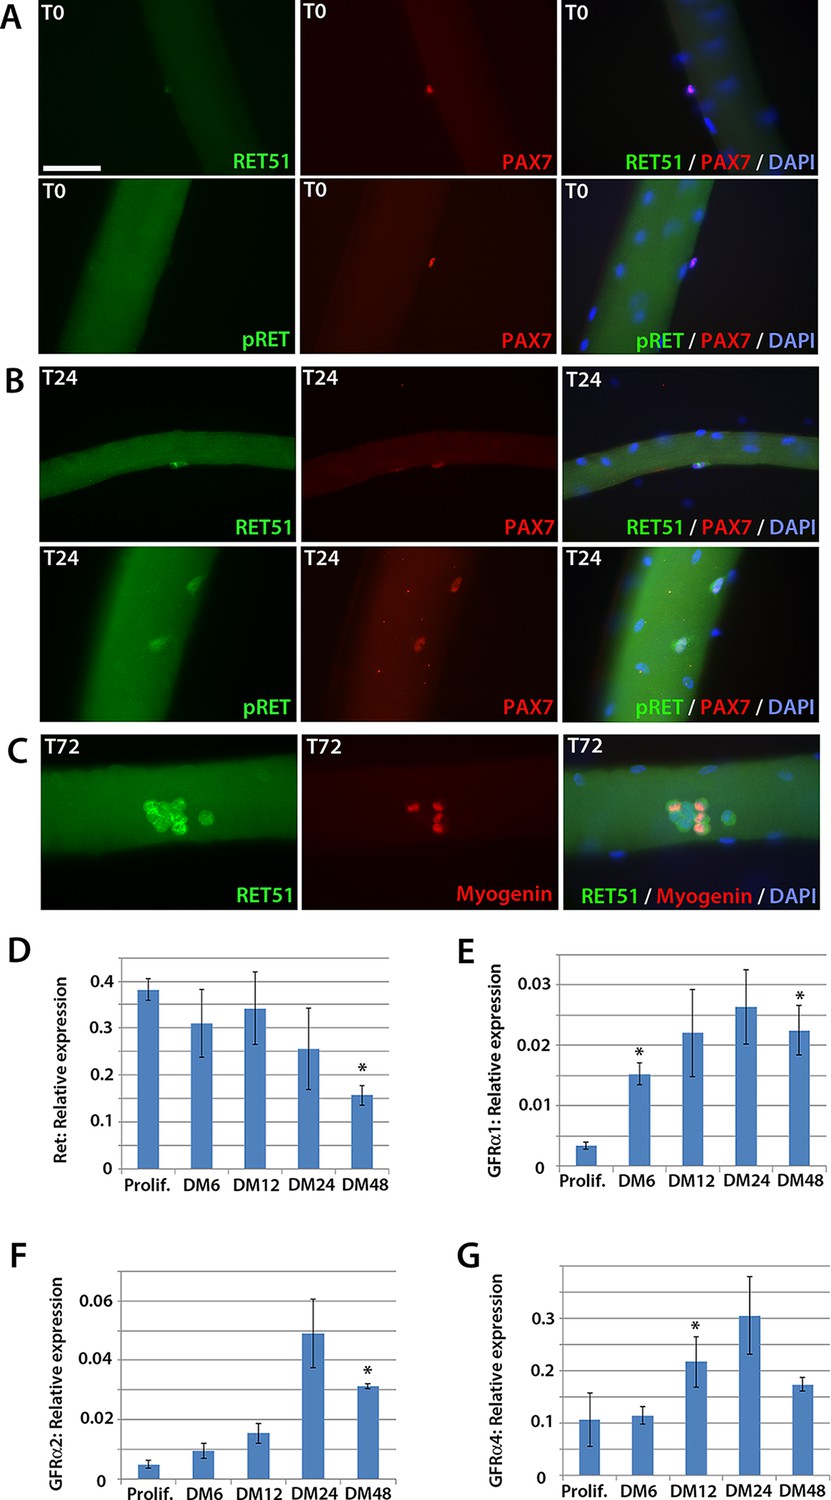
Expression dynamics of Ret and Gfrα co-receptors during myogenic progression in murine satellite cell-derived myoblasts.
Co-immunolabelling of Ret in satellite cells associated with isolated myofibres. (A–C) Expression of Ret51 and phosphorylated (Y1062) Ret (pRet) in quiescent (T0) Pax7-positive satellite cells (A), Pax7-positive satellite cells cultured for 24 hr (T24) (B) and expression of Ret51 in differentiation-committed Myogenin-positive and Myogenin-negative satellite cells (C). DAPI (blue) was used as a nuclear counterstain. (D–G) Relative expression dynamics of Ret and its co-receptors Gfrα1, Gfrα2 and Gfrα4 during satellite cell proliferation (prolif.) and through differentiation (DM 6–48 hr), normalised to Tbp. Data is mean ± SEM from 3 independent experiments using 3 mice. An asterisk denotes significant difference (p<0.05) from the expression level in proliferating cells, as determined using a paired Student’s t-test. Scale bar equals 50 µm.
Figure 2
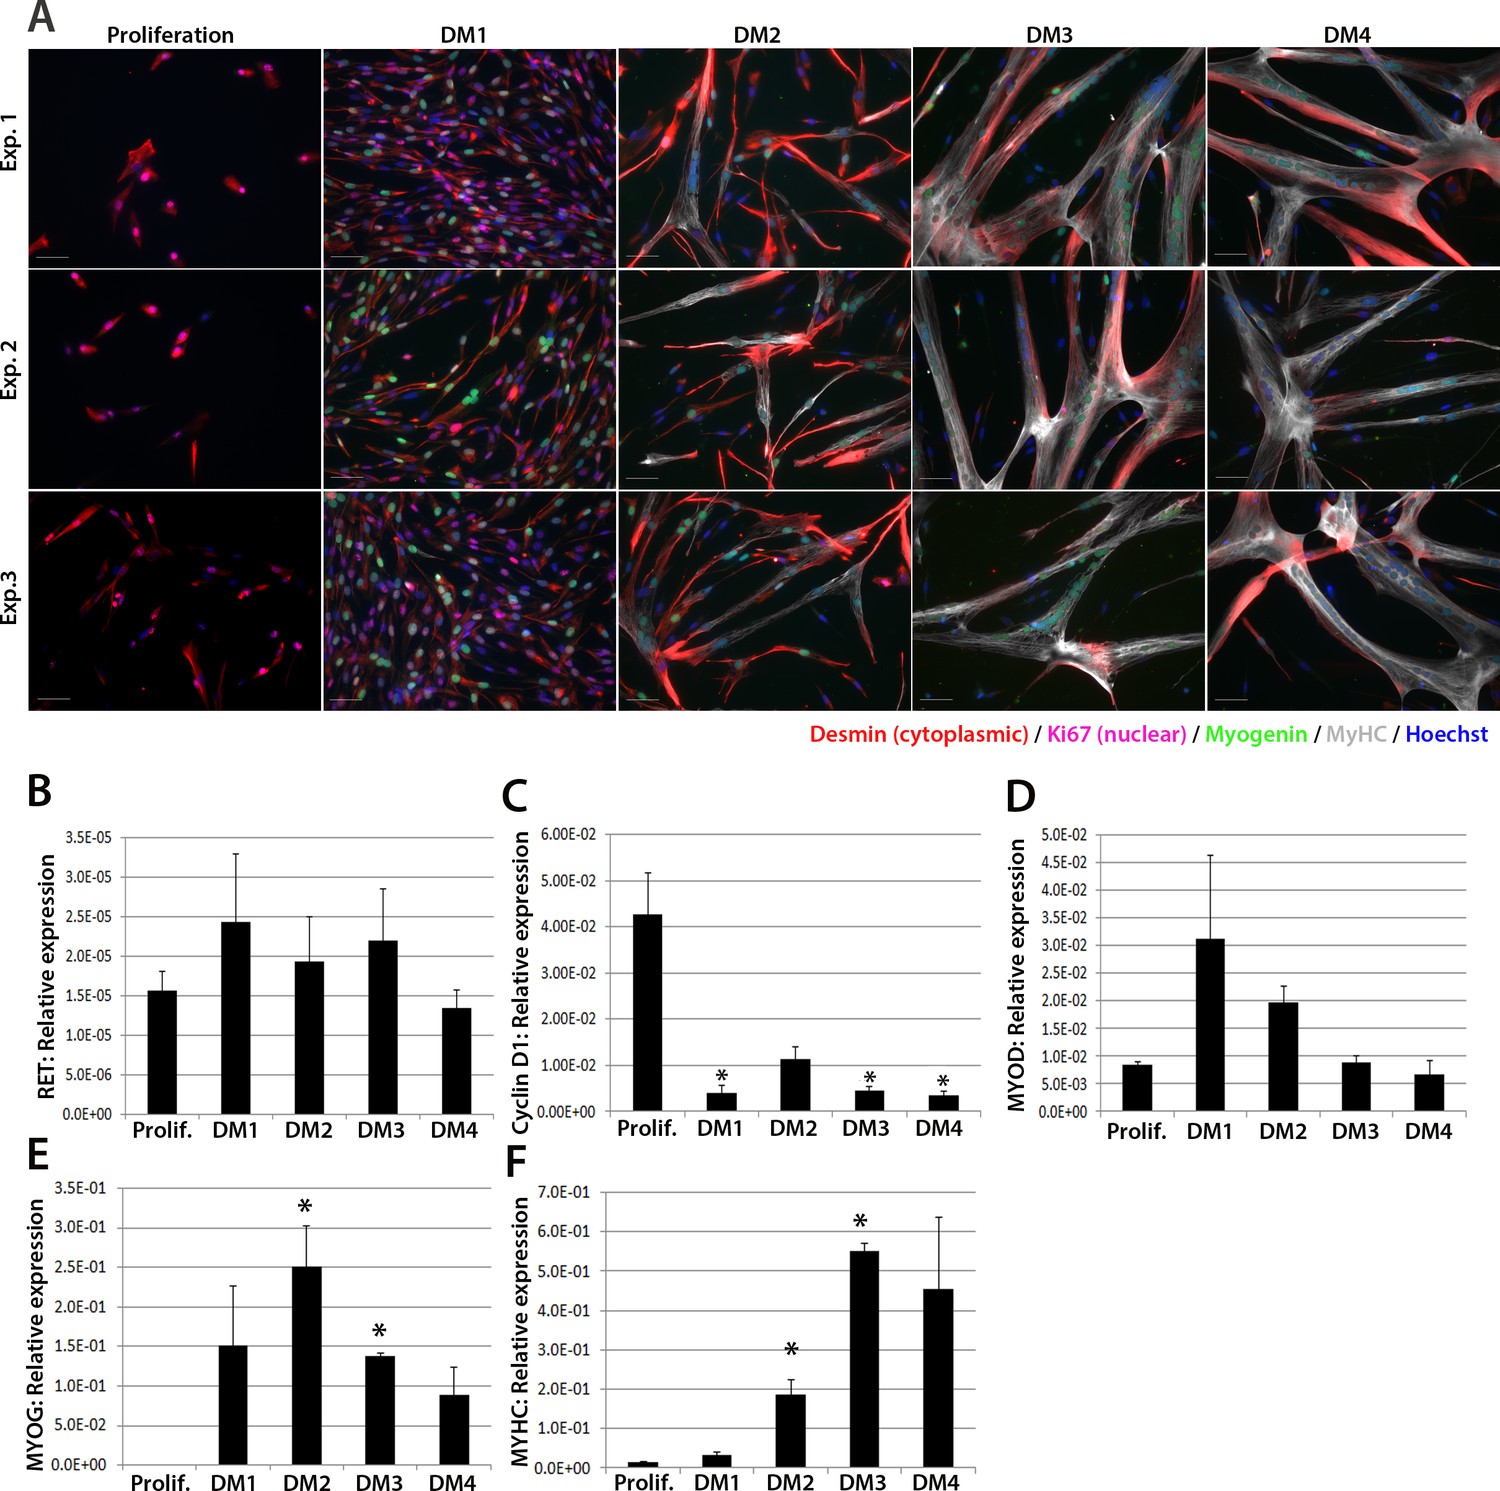
RET is expressed in proliferating and differentiating primary human satellite cell-derived myoblasts.
(A) Immunolabelling of primary human myoblasts extracted from the vastus lateralis of 3 individuals (Exp. 1 to 3) co-immunolabelled for Desmin (red – cytoplasmic), Ki67 (mauve – nuclear), Myogenin (green – nuclear), MyHC (grey – cytoplasmic) and counterstained with DAPI (blue – nuclear). (B–F) Relative expression of (B) RET, (C) Cyclin D1, (D) MYOD, (E) MYOG and (F) MYHC transcription during proliferation (Prolif.) and after 1, 2, 3 and 4 days in differentiation medium (DM1-4), measured by RT-qPCR and normalised to RPLPO housekeeping gene. Data is mean ± SEM where an asterisk denotes significant difference (p<0.05) from the expression level in proliferating cells, as determined using a paired Student’s t-test. Scale bar equals 50 µm.
Figure 3

Knockdown of Ret enhances myogenic differentiation of satellite cells.
(A) Satellite cell-derived myoblasts transfected with control or Ret siRNA for 48 hr and pulsed for 2 hr with EdU (red) to measure the proliferation rate, and immunolabelled for Pax7 (green) and counterstained with DAPI (blue), quantified in (B and D). (C) Quantification of satellite cell-derived myoblasts transfected with control or Ret siRNA and labelled with phospho-Histone H1/H3. Cells were grouped according to their cell cycle stage. (E–G) RT-qPCR analysis of the relative expression of Pax7, MyoD and Myf5 in satellite cell-derived myoblasts transfected with control or Ret siRNA for 48 hr, with expression normalised to Gapdh. (H and I) Satellite cell-derived myoblasts transfected with Ret or control siRNA and incubated in differentiation medium for 48 hr, immunolabelled with Myogenin (red) and counterstained with DAPI (blue) (H) or Myosin Heavy Chain (MyHC - green) and counterstained with DAPI (blue) (I), quantified in (J–L). (L) Quantification of the relative proportion of small (2 > 4 nuclei), medium (5 > 9 nuclei), large (10 > 24 nuclei) and very large (25+ nuclei) myotubes. Data is mean ± SEM from 3–4 mice in each case, where statistical difference (p<0.05) from control siRNA was determined using a paired Student’s t-test and denoted by an asterisk. Scale bars equal 50 µm (A) and 200 µm (H and I).
Figure 4
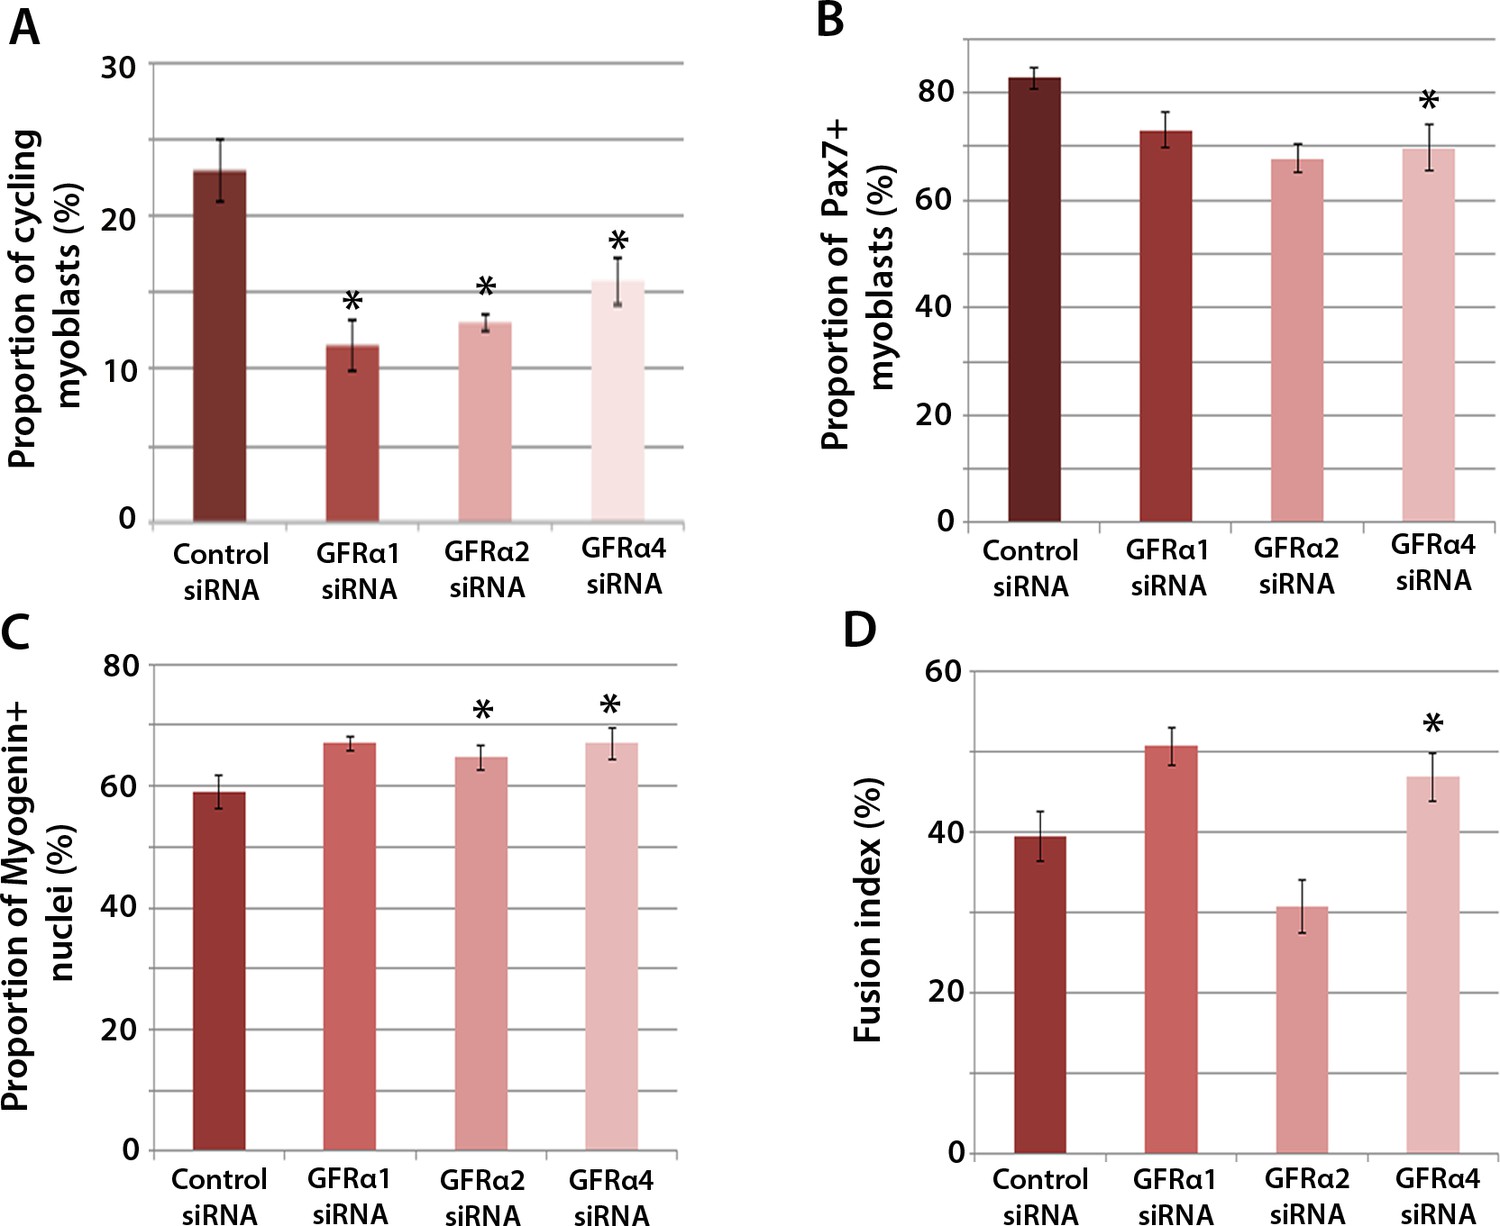
Gfrα1, Gfrα2 and Gfrα4 affect myoblast proliferation and myogenic differentiation.
(A–D) Quantification of satellite cell-derived myoblasts transfected with control or Gfrα1, Gfrα2 or Gfrα4 siRNA for 48 hr in proliferation medium (A and B) or differentiation medium (C and D). Immunolabelling of cells was performed to quantify the proportion in the cell cycle using anti-phospho-Histone H1 and H3 (A), the proportion containing immunosignal for Pax7 (B), Myogenin (C) and the proportion of nuclei in multinucleated myotubes (fusion index) (D). Data is mean ± SEM from 3 independent experiments using 3 mice, where statistical difference (p<0.05) from control siRNA was assessed using a paired Student’s t-test and denoted by an asterisk.
Figure 5

Active RET signalling drives satellite cell-derived myoblast proliferation.
(A) Immunoblot analysis of the RET protein in HEK 293T cells transfected with plasmids encoding human RET 9, RET 51, CA RET9 and CA RET51 for 24 hr. Equal quantities of total protein extracts were run on 4–20% gradient PAGE-SDS gels, transferred and blotted with antibodies recognising both RET isoforms (pan-RET, top band and RET51, middle band). Bands of 170 kDa were detected in HEK 293T cells transfected with RET-encoding plasmids, but not in cells transfected with control plasmid. β-Tubulin was used as a loading control. (B–K) Satellite cell-derived myoblasts transduced with control retrovirus encoding eGFP alone, or retroviruses encoding RET 9, RET 51, CA RET9 or CA RET51, together with GFP. mRNA was prepared (B–C) or myoblasts immunolabelled for eGFP (to identify transduced cells) and assayed for EdU incorporation (D and E) or co-immunolabelled for eGFP and either Pax7 (F and G), Myogenin (H and I) or MyHC (J–K). (B–C) RT-qPCR to measure expression of the human versions of RET (B) and endogenous murine Ret (C). (D and E) Quantification of the proportion of eGFP+ satellite cell-derived myoblasts incorporating EdU after a 2 hr exposure. (F–K) Quantification of the proportion of eGFP-expressing satellite cell-derived myoblasts containing Pax7 (F and G), Myogenin (H and I) and the fusion index (J and K). RT-qPCR and quantification of immunolabelling is presented as mean ± SEM from 3 or 4 independent experiments using 3–4 mice, where statistical difference (p<0.05) to transduction with control retrovirus was assessed using a paired Student’s t-test and denoted by an asterisk. Scale bar equals 50 µm (D and F) or 200 µm (H and J).
Figure 6
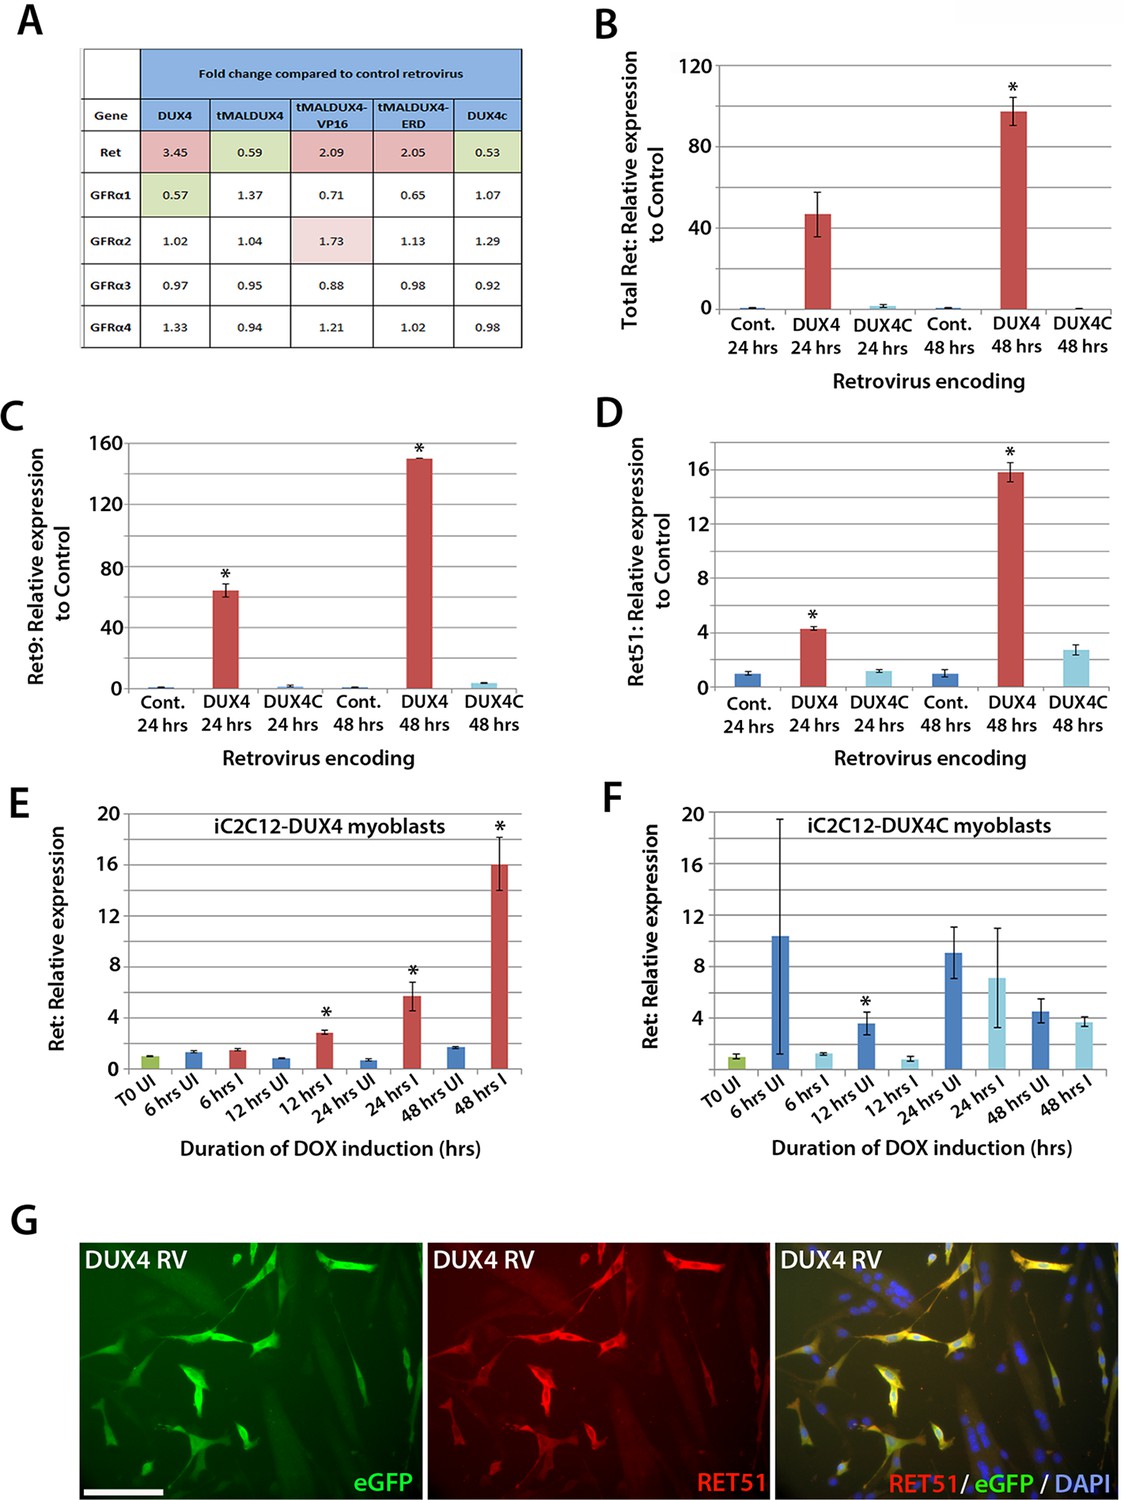
DUX4 expression induces Ret in satellite cell-derived myoblasts.
(A) Microarray data of expression levels of Ret and Ret co-receptors Gfrα1–4 in murine satellite cell-derived myoblasts transduced for 20 hr with retroviruses encoding either DUX4, truncated DUX4 (tMALDUX4), constitutively active DUX4 (tMALDUX4-VP16), dominant-negative DUX4 (tMALDUX4-ERD) or DUX4c (Banerji et al., 2015). Red highlights increased expression while green highlights reduced expression (fold change) compared to transduction with control retrovirus. (B–D) Quantification of total Ret, Ret9 and Ret51 expression by RT-qPCR in satellite cell-derived myoblasts transduced with DUX4, DUX4c or control retroviruses at 24 and 48 hr post-infection. (E–F) Ret expression in iC2C12-DUX4 myoblasts (E) and iC2C12-DUX4c myoblasts (F) following 200ng/ml doxycycline (DOX) induction. (G) Satellite cell-derived myoblasts transduced with DUX4-encoding retrovirus for 24 hr and immunolabelled for eGFP (green) to identify transduced cells and anti-RET51 (red), with a DAPI counterstain (blue). Data is mean ± SEM from 3 independent experiments using 3 mice for (B–D) where statistical difference (p<0.05) from transduction with control retrovirus was assessed using a paired Student’s t-test and denoted by an asterisk. For E and F , unpaired Student's t-tests were used to assess significance (p<0.05) compared to uninduced cells at each time point. UI = un-induced, I = induced by doxycycline. Scale bar equals 100 µm (G).
Figure 7
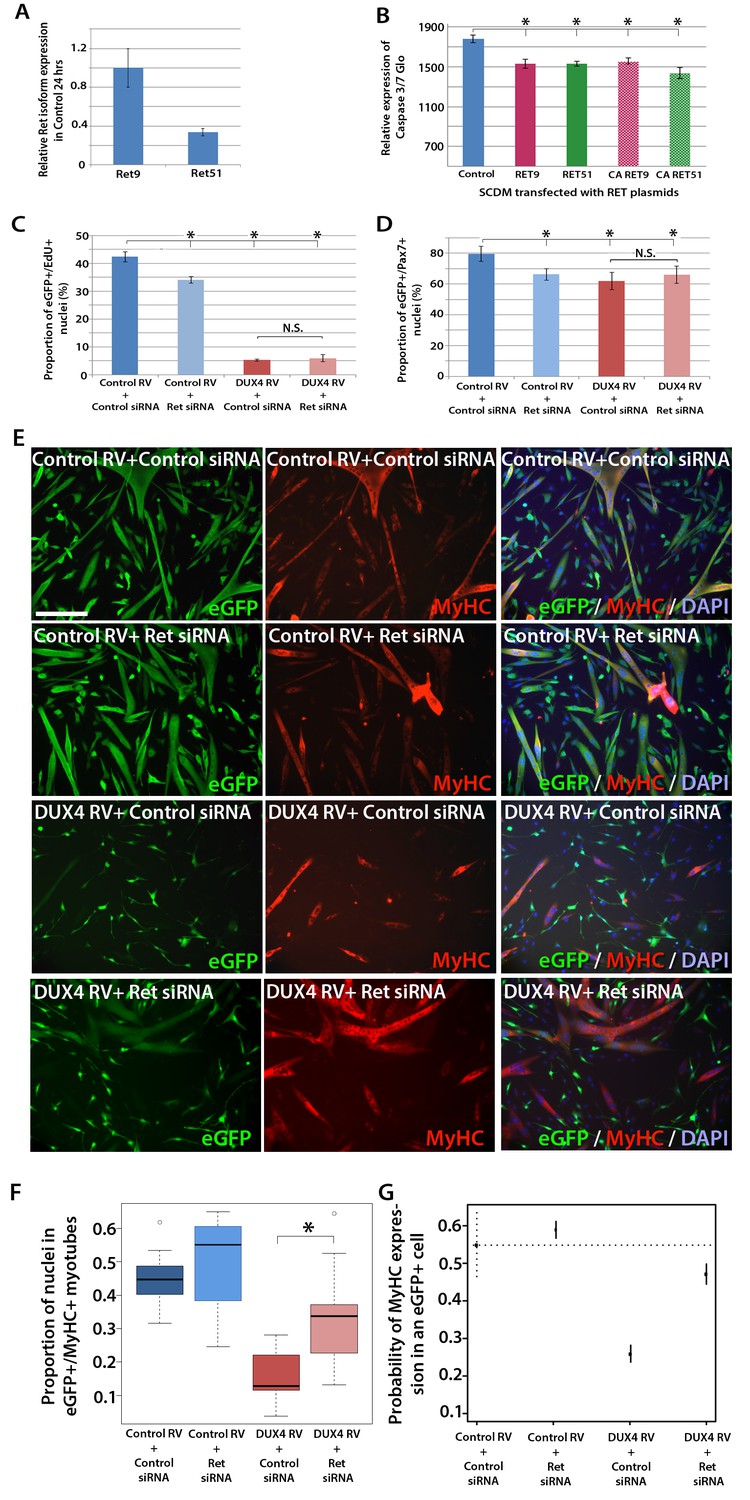
Knockdown of Ret rescues DUX4-mediated inhibition of myogenic differentiation.
(A) Relative expression of Ret9 and Ret51 in myoblasts infected with control retrovirus after 24 hr. (B) Quantification of a caspase 3/7 Glo assay to measure apoptosis in satellite cell-derived myoblasts transfected with control plasmid encoding GFP, or RET 9, RET 51, CA RET9 or CA RET51 encoding plasmids. (C–D) Quantification of proliferation by EdU incorporation (C) and Pax7 expression (D) in eGFP-expressing myoblasts transduced with control or DUX4-encoding retrovirus and then transfected with control or Ret siRNA for 48 hr. Data is mean ± SEM from 3 mice where statistical difference (p<0.05) to control plasmid (B) or control retrovirus + control siRNA (C and D) was assessed using a paired Student’s t-test and denoted by an asterisk. Bar is comparison between indicated conditions, where N.S. denotes non-significant difference. (E) Immunolabelling of satellite cell-derived myoblasts transduced with control or DUX4-encoding retrovirus and transfected with control or Ret siRNA following culture for 24 hr in differentiation medium. Transduced cells were detected by immunolabelling for eGFP and examined for MyHC to identify terminally differentiated myotubes. (F) The fusion index was calculated for eGFP-positive cells expressing control or DUX4-encoding retrovirus and transfected with control or Ret siRNA. Bar represents statistical test significance, where an asterisk denotes p<0.01. (G) Plot of probability that a cell has MyHC immunoreactivity derived from binomial models (Figure 7—source data 1). Error bars represent 95% confidence intervals. Four replicates were counted for each condition and repeated using 3 mice. Scale bar equals 200 µm (E).
-
Figure 7—source data 1
Maximum likelihood parameters for a logistic model containing an interaction term, and a random effect term describing the probability of a nucleus being present in a MyHC+ cell.
(a) Maximum likelihood parameters for a logistic model containing an interaction term, and a random effect term (the mouse) describing the probability of a nucleus being present in a MyHC+ cells. (b) Corresponding ratios computed from the model, for all 4 tested conditions with the ratio representing the probability of a GFP+ cell expressing MyHC. In all condition but the control (Intercept), the error contribution of the baseline (Intercept) has been omitted when computing the confidence intervals (C.I.). y represents the log-of-odds of the fusion index. µ represents the intercept parameter (representing the control: MIG control retrovirus, control siRNA), β are the parameters representing the effects of each treatment, or the interaction as specified and δ indicates whether the effect is present or absent.
- https://doi.org/10.7554/eLife.11405.009
Figure 8
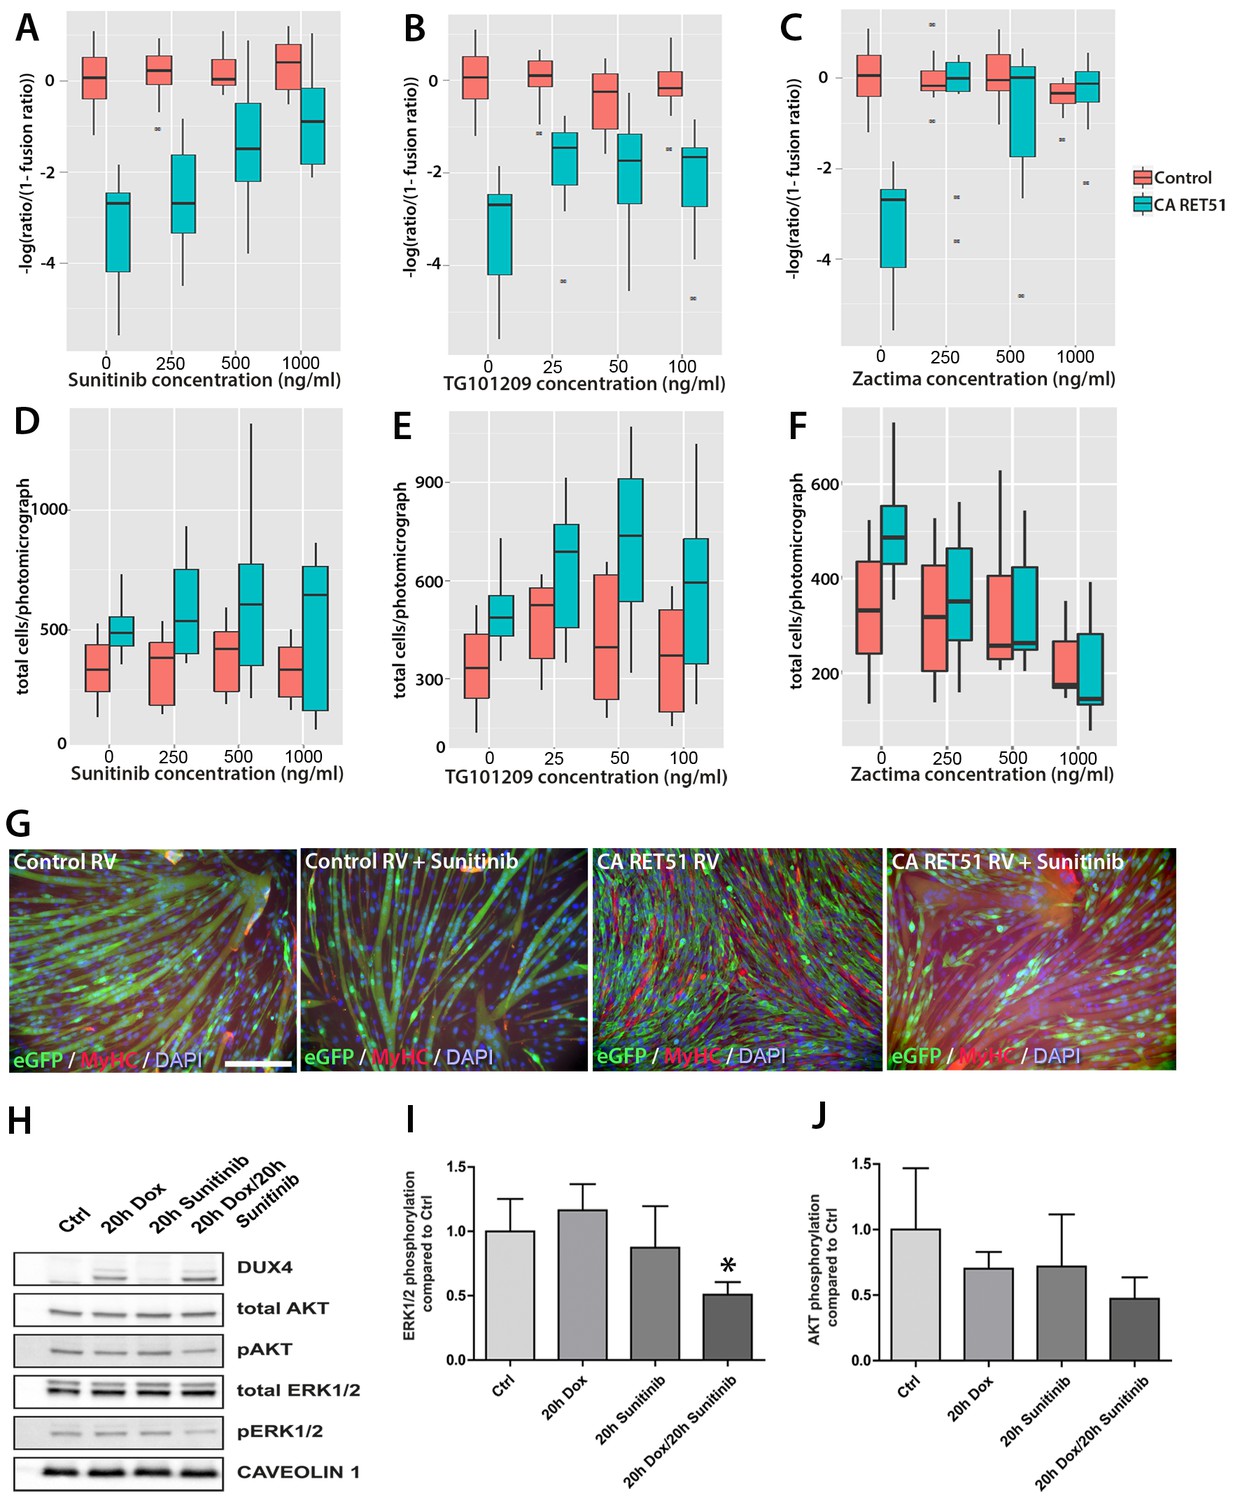
Sunitinib blocks the RET-induced phenotype in murine myoblasts.
(A–C) Quantification of the fusion index of C2C12 myoblasts transduced with control (red) or CA RET51-encoding retrovirus (blue) and treated with Sunitinib, TG101209 or Zactima at varying doses is shown as a statistical model fitted to the –log of the odds ratio of the fusion index (-log ratio/(1-ratio)) (Figure 8—source data 1). (D–F) Quantification of the number of C2C12 myoblasts transduced with control (red) or CA RET51-encoding retrovirus (blue) when treated with Sunitinib, TG101209 or Zactima at varying doses (Figure 8—source data 2). (G) C2C12 myoblasts transduced with control or CA RET51-encoding retrovirus and induced to differentiate for 60 hr in the presence of either 1 µg/ml Sunitinib or DMSO vehicle control, before co-immunolabelling with antibodies to eGFP (green) to detect transduced cells and MyHC (red), with a DAPI nuclear counterstain (blue). All quantification represents an average of three independent experiments. Scale bar equals 200 µm. (H) Representative immunoblot of proteins extracted from un-induced iC2C12-DUX4 myoblasts, or cells induced with 500ng/ml doxycycline (Dox) to express DUX4, 250 ng/ml Sunitinib or both doxycycline and Sunitinib. Probed with antibodies against DUX4, total AKT, phosphorylated (p) AKT, total ERK1/2 and phosphorylated (p) ERK1/2, with Caveolin-1 used as a loading control. All bands shown were visualised on the same membrane. (I and J) Protein band intensity was quantified with the ChemiDoc MP System and normalised to housekeeping protein Caveolin-1. The ratios of pERK1/2: total ERK1/2 and pAKT: total AKT in the treated groups were compared to the ratios in the control group. Quantification of the ratio between pERK1/2: total ERK1/2 compared to control shows that Sunitinib suppresses DUX4-mediated pERK1/2 signalling. Data is mean ± SEM from 3 independent experiments, where an asterisk denotes a significant difference (p<0.05) from Control using an unpaired Student’s t-Test.
-
Figure 8—source data 1
Maximum likelihood parameters for a logistic model containing an interaction term and a random effect (mouse) to describe the effect of CA RET51 (RET51-MENA) expression and Sunitinib, TG101209 or Zactima on fusion in C2C12 myoblasts.
(a) Maximum likelihood parameters for a logistic model containing an interaction term and a random effect (mouse) to describe the effect of RET51-MENA expression and Sunitinib, TG101209 or Zactima on fusion in C2C12 myoblasts. (b) Maximum likelihood parameters for a logistic model containing an interaction term for RET51-MEN2A and Sunitinib (RET51CA:Sunitinib), Ret51-MEN2A with TG101209 (RET51CA: TG101209) or Ret5-MEN2A with Zactima (RET51CA:Zactima) that reveals the gradient of response of myoblast fusion. Significance of interaction effects relative to the baseline (MIG control retrovirus infected cells with no drug present) is indicated by p values. y represents the log of the odds of the fusion index, µ represents the intercept parameter (representing the control treatment: MIG control retrovirus with no drug), β are the parameters representing the effects of each treatment, or the interaction as specified, c is a parameter representing the effect of concentration of a drug and δ indicates whether the effect is present or absent.
- https://doi.org/10.7554/eLife.11405.011
-
Figure 8—source data 2
Quasi-Poisson model parameters for a fixed-effects factorial model incorporating a parameter to account for the replicate effects (Batch) on the number of cells expressing CA RET51 (RET51-MEN2A) or control when treated with different concentrations of Sunitinib, TG101209 or Zactima.
The significance of each effect and combined effects relative to the baseline (control (MIG) infected cells from Batch A with no drug present) is indicated by p values. y represents the log of the number of cells, µ represents the intercept parameter (representing the control treatment: MIG control retrovirus with no drug), β are the parameters representing the effects of each treatment, or the interaction as specified and δ indicates whether the effect is present or absent.
- https://doi.org/10.7554/eLife.11405.012
Figure 9
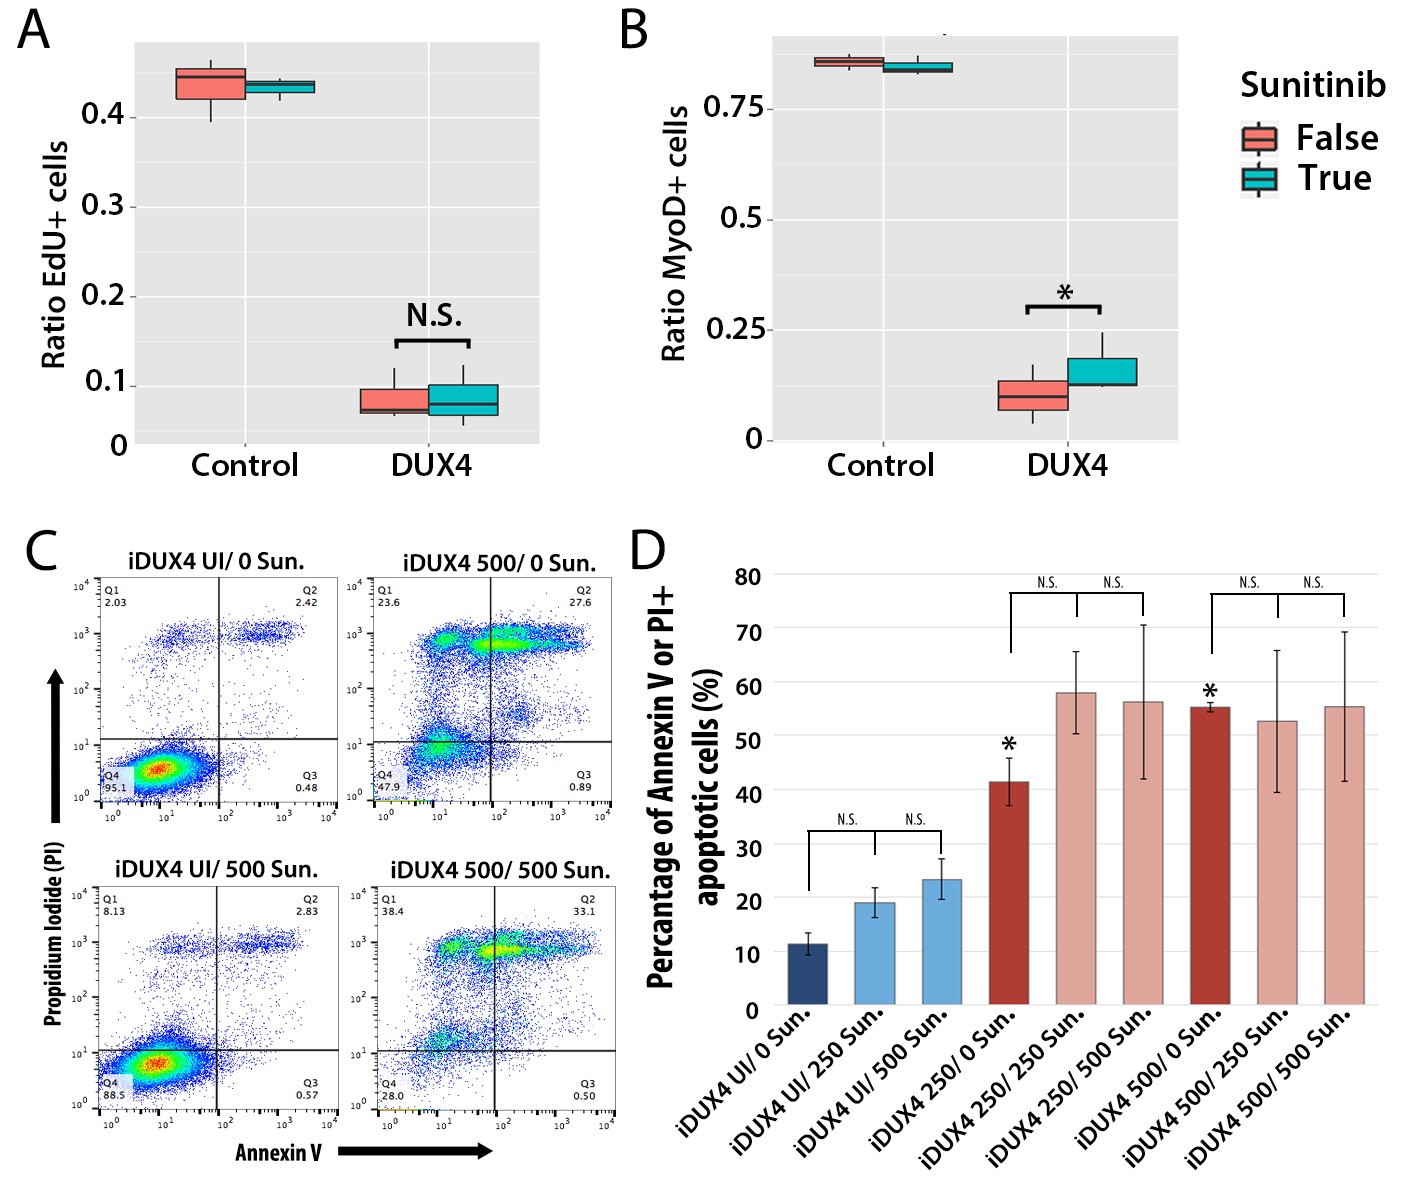
Sunitinib does not prevent apoptosis in DUX4-expressing myoblasts.
(A–B) Quantification of murine satellite cell-derived myoblasts transduced with control or DUX4-encoding retrovirus and treated with either 250 ng/ml Sunitinib (blue) or DMSO vehicle control (red). Cells were cultured at low density and incubated in proliferation medium prior to immunolabelling to detect eGFP and either EdU (A) or MyoD (B). The ratio represents the proportion of cells with EdU (A and Figure 9—source data 1) or MyoD (B and Figure 9—source data 2) labelling in the presence (True, blue), or absence of Sunitinib (False, red). Bar represents statistical test significance, where an asterisk denotes p<0.01 or N.S. means non-significant.(C) FACS analysis of murine iC2C12-DUX4 myoblasts cultured in control medium (UI) or induced to express DUX4 with 250 ng/ml or 500 ng/ml doxycycline and untreated (0), or exposed to 250 ng/ml or 500 ng/ml Sunitinib for 24 hr. (D) Quantification of the mean proportion of apoptotic iC2C12-DUX4 myoblasts based upon the expression of Annexin V and propidium iodide (PI). As a control, an asterisk denotes increased apoptosis by DOX-mediated induction of DUX4 compared to un-induced cells (all without Sunitinib treatment). An average of 3 independent experiments, where statistical difference to myoblasts not exposed to Sunitinib at each concentration of doxycycline was tested using an unpaired two-tailed Student t-test, where p<0.05 represents significance (*).
-
Figure 9—Source data 1
Maximum likelihood parameters for a logistic model containing an interaction term, and a random effect term (the mouse) that describes the proportion of myoblasts transduced with DUX4 or control retrovirus and incorporating EdU when exposed to Sunitinib or DMSO.
(a) Maximum likelihood parameters for a logistic model containing an interaction term, and a random effect term (the mouse) that describes the proportion of myoblasts incorporating EdU transduced with DUX4 or control (MIG) retrovirus when exposed to Sunitinib or DMSO. y represents the probability of EdU incorporation. µ represents the intercept parameter (representing the control treatment: MIG control retrovirus with no drug), β are the parameters representing the effects of each treatment, or the interaction as specified and δ indicates whether the effect is present or absent. (b) Corresponding log of odds ratios computed from the model, for all 4 tested conditions.
- https://doi.org/10.7554/eLife.11405.014
-
Figure 9—Source data 2
Maximum likelihood parameters for a logistic model containing an interaction term, and a random effect term (the mouse) that describes the proportion of cells transduced with DUX4 or control retrovirus and expressing MyoD when exposed to Sunitinib or DMSO.
(a) Maximum likelihood parameters for a logistic model containing an interaction term, and a random effect term (the mouse) that describes the proportion of cells expressing MyoD transduced with DUX4 or MIG control retrovirus when exposed to Sunitinib or DMSO. y represents the probability of MyoD expression. µ represents the intercept parameter (representing the control treatment: MIG control retrovirus with no drug), β are the parameters representing the effects of each treatment, or the interaction as specified and δ indicates whether the effect is present or absent. (b) Corresponding log of odds ratios computed from the model, for all 4 tested conditions.
- https://doi.org/10.7554/eLife.11405.015
Figure 10

Sunitinib rescues differentiation of DUX4-expressing myoblasts.
(A) Satellite cell-derived myoblasts induced to differentiate in the presence of varying doses of Sunitinib, and immunolabelled for MyHC (red) and counterstained with DAPI (blue). (B and C) Immunolabelling of satellite cell-derived myoblasts transduced with retrovirus encoding DUX4 and GFP (green) to detect MyHC (red) following treatment with varying doses of Sunitinib in differentiation medium. (C) Fusion index calculated as the ratio of nuclei in eGFP+/MyHC+ multinucleate cells/total nuclei (Figure 10—source data 1). (D) Satellite cell-derived myoblasts transduced with control GFP or DUX4 and GFP-encoding retrovirus in the presence of 250 ng/ml Sunitinib or DMSO at high density and induced to differentiate for 24 hr before co-immunolabelling with eGFP (green), MyHC (red) and counterstained with DAPI (blue). (E) Fusion index quantified with myoblasts exposed to DMSO (False: red) or 250 ng/ ml Sunitinib (True: blue) (Figure 10—source data 2). (F and G) Quantification of satellite cell-derived myoblasts transduced with control GFP or retrovirus encoding DUX4 and GFP and treated with either 250 ng/ml Sunitinib (blue) or DMSO (red). Cultured at low density in differentiation medium for 24 or 48 hr (D1, D2) to form unfused myocytes and co-immunolabelled with eGFP to identify transduced cells and either Myogenin (F and Figure 10—source data 3) or MyHC (G and Figure 10—source data 4). All experiments were independently performed 3 times. The statistical significance of differences described in Figure 10—source data 1–4. Bar represents statistical test significance, where an asterisk denotes p<0.01. Scale bar equals 200 µm.
-
Figure 10—source data 1
Maximum likelihood parameters for a logistic model containing an interaction term between DUX4 and Sunitinib that describes the fusion index of satellite-cells grown at high density with or without DUX4 transduction.
(a) Maximum likelihood parameters for a logistic model containing an interaction term between DUX4 expression and Sunitinib during fusion of satellite-cells grown at high density and transduced with DUX4-expressing retrovirus or control (MIG). y represents the log-of-odds of the fusion index. µ represents the intercept parameter (representing the control treatment: no retrovirus, with no drug present), β are the parameters representing the effects of each treatment, or the interaction as specified and δ indicates whether the effect is present or absent. (b) Corresponding log of odds ratios computed from the model for all 4 tested conditions.
- https://doi.org/10.7554/eLife.11405.017
-
Figure 10—source data 2
Maximum likelihood parameters for a logistic model containing an interaction term, and a random effect term (the mouse) that describes the fusion index of myoblasts transduced with DUX4 or control retrovirus and grown at high density when exposed to Sunitinib or DMSO.
(a) Maximum likelihood parameters for a logistic model containing an interaction term, and a random effect term (the mouse) that describes the fusion index of cells infected with DUX4 or MIG control retrovirus and grown at high density when exposed to Sunitinib or DMSO. y represents the log-of-odds of the fusion index. µ represents the intercept parameter (representing the control treatment: MIG control retrovirus with no drug), β are the parameters representing the effects of each treatment, or the interaction as specified and δ indicates whether the effect is present or absent. (b) Corresponding log of odds ratios computed from the model, for all 4 tested conditions.
- https://doi.org/10.7554/eLife.11405.018
-
Figure 10—source data 3
Maximum likelihood parameters for a logistic model containing an interaction term, and a random effect term (the mouse) to describe MyoG expression in satellite cell-derived myoblasts expressing DUX4 or control retrovirus and exposed to Sunitinib or DMSO, when grown at low density.
(a) Maximum likelihood parameters for a logistic model containing an interaction term, and a random effect term (the mouse) to describe MyoG expression in SCs exposed to Sunitinib or DMSO and expressing DUX4 or control (MIG) retrovirus at 1 or 2 days of culture when grown at low density. y represents the probability of MyoG expression. µ represents the intercept parameter (representing the control treatment: MIG control retrovirus with no drug), β are the parameters representing the effects of each treatment (e.g. β1 at day 1, β2 at day 2), or the interaction as specified and δ indicates whether the effect is present or absent. (b) Corresponding ratios computed from the model, for all 4 tested conditions.
- https://doi.org/10.7554/eLife.11405.019
-
Figure 10—source data 4
Maximum likelihood parameters for a logistic model containing an interaction term, and a random effect term (the mouse) to describe MyHC expression in satellite cell-derived myoblasts expressing DUX4 or control retrovirus and exposed to Sunitinib or DMSO, when grown at low density.
(a) Maximum likelihood parameters for a logistic model containing an interaction term, and a random effect term (the mouse) to describe the MyHC expression in SCs exposed to Sunitinib or DMSO and expressing DUX4 or control (MIG) retrovirus at 1 or 2 days of culture when grown at low density. y represents the probability of MyHC expression. µ represents the intercept parameter (representing the control treatment: MIG control retrovirus with no drug), β are the parameters representing the effects of each treatment (e.g. β1 at day 1, β2 at day 2), or the interaction as specified and δ indicates whether the effect is present or absent. (b) Corresponding ratios computed from the model, for all 4 tested conditions.
- https://doi.org/10.7554/eLife.11405.020
Figure 11
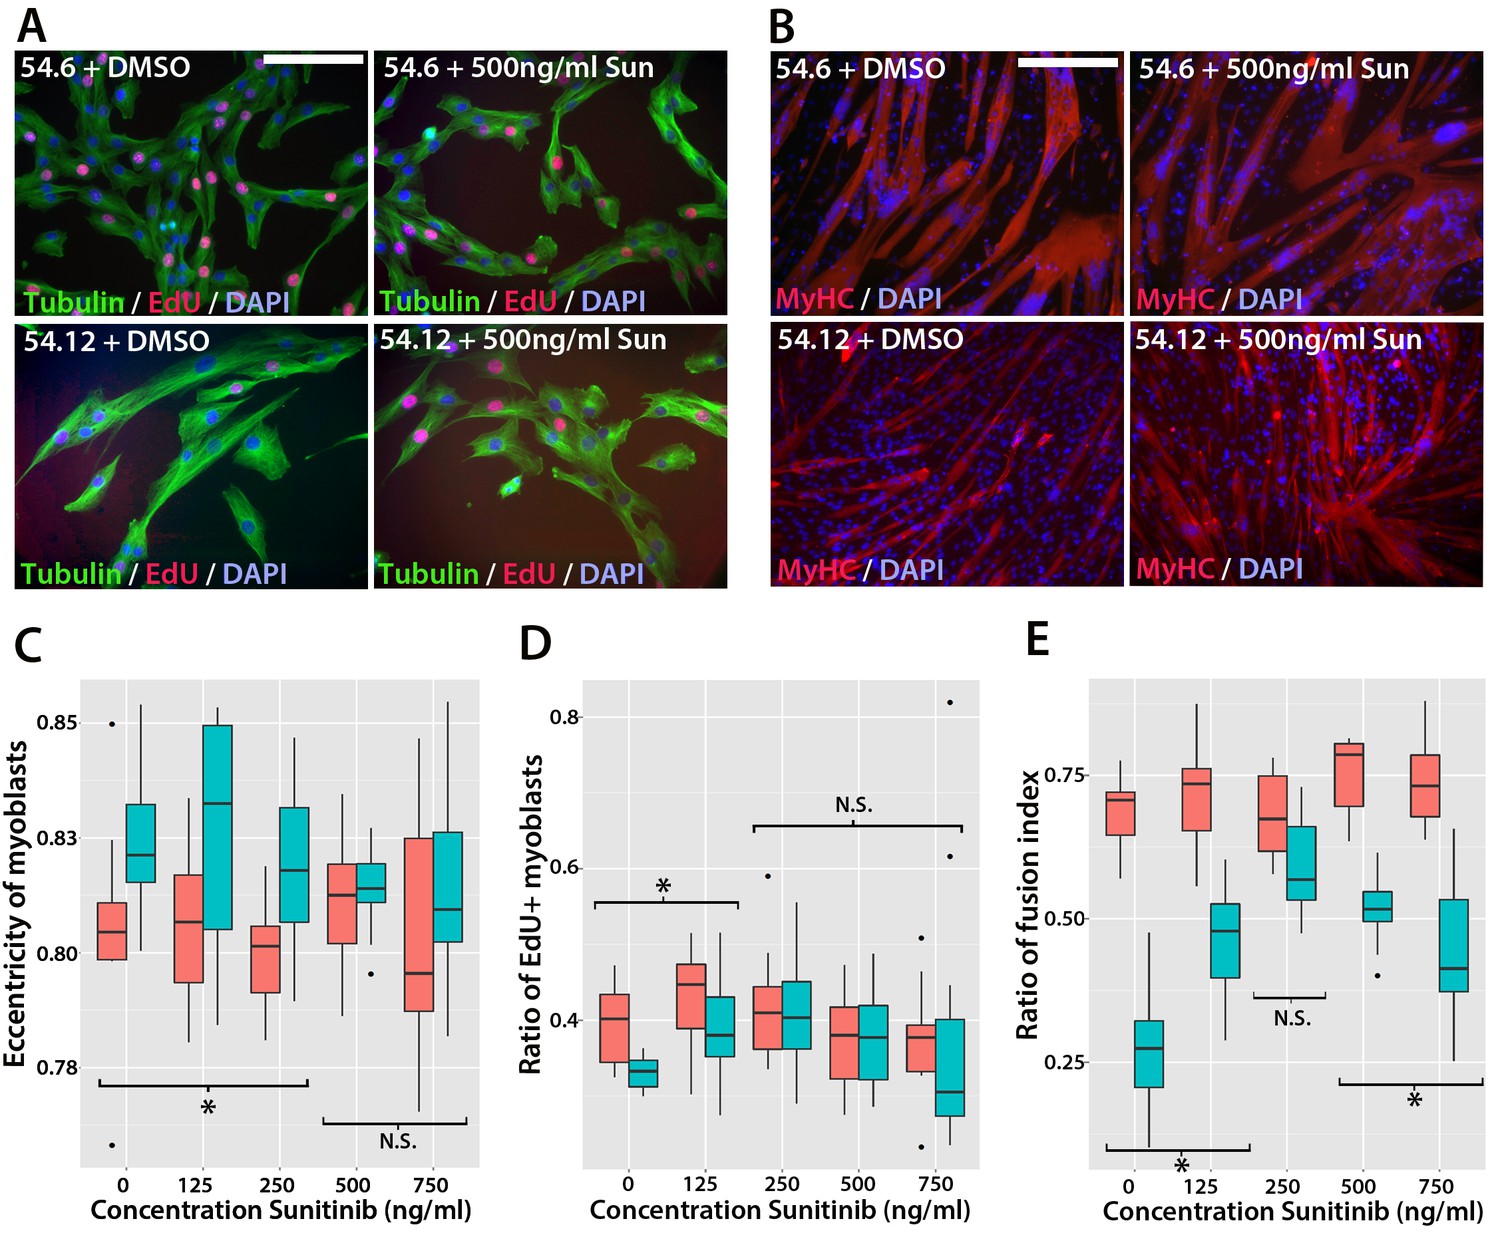
Sunitinib improves the pathogenic phenotype of FSHD myoblasts.
(A) Immunolabelling of mosaic FSHD patient-derived myoblast cell lines 54.6 (control) and 54.12 (FSHD) exposed to DMSO vehicle control or 500 ng/ml Sunitinib. EdU incorporation (red) was revealed using the Click-iT assay and myoblasts immunolabelled for β-TUBULIN (green) with a DAPI nuclear counterstain (blue). (B) Immunolabelling of MYHC (red) in myoblasts grown at high density in differentiation medium with either DMSO vehicle control or 500 ng/ml Sunitinib. (C–E) Quantification of cell shape (eccentricity) assessed using β-TUBULIN immunolabelling (C and Figure 11—source data 1), EdU incorporation (D and Figure 11—source data 2) and fusion index (E and Figure 11—source data 3) plotted relative to varying Sunitinib concentrations in 54.6 control (red) and 54.12 FSHD (blue) myoblasts. Statistical analysis described in Figure 11—source data 1–3. All experiments were independently performed 3 times. Bar represents statistical test significance at each concentration of Sunitinib, where an asterisk denotes p<0.01, while N.S. means non-significant. Scale bars equal 50 µm (A) 200 µm (B).
-
Figure 11—source data 1
A linear model that describes the relationship between the shape (eccentricity) of control 54.6 and FSHD 54.12 human myoblasts relative to different doses of Sunitinib.
The model is a linear model that describes the relationship between the shape (eccentricity) of 54.6 (control) and 54.12 (FSHD) cells relative to different doses of Sunitinib. P values are approximate and are based on the t-value and represent the probability that there is a difference in cell shape at a specific concentration of Sunitnib. y represents cell eccentricity, µ represents the intercept parameter (representing the control treatment: 54.6 cells with no drug), β are the parameters representing the effects of each treatment, or the interaction as specified and δ indicates whether the effect is present or absent.
- https://doi.org/10.7554/eLife.11405.022
-
Figure 11—source data 2
A binomial model that tests the relationship between the proliferation of control 54.6 and FSHD 54.12 human myoblasts with different doses of Sunitinib.
(a) Maximum likelihood parameters for a logistic model containing an interaction term between the cell line and sunitinib and incorporating a random effect term (the experiment). The model is a binomial model that tests the relationship between the proliferation of 54.6 (control) and 54.12 (FSHD) cells relative to different doses of Sunitinib. P values represent the probability of a difference in proliferation between the control cells with varying doses of Sunitinib and between control and FSHD cells at different doses of Sunitinib. y represents the proliferation index. µ represents the intercept parameter (representing the control treatment: 54.6 cells with no drug), β are the parameters representing the effects of each treatment, or the interaction as specified and δ indicates whether the effect is present or absent. (b) Corresponding log of odds ratios computed from the model, for all 4 tested conditions.
- https://doi.org/10.7554/eLife.11405.023
-
Figure 11—source data 3
A binomial model that tests the relationship between the fusion of control 54.6 and FSHD 54.12 human myoblasts relative to different doses of Sunitinib.
(a) Maximum likelihood parameters for a logistic model containing an interaction term between the cell line and Sunitinib and incorporating a random effect term (the experiment). The model is a binomial model that tests the relationship between the fusion of 54.6 (control) and 54.12 (FSHD) cells relative to different doses of Sunitinib. Estimate represents the relative change in fusion between conditions. p values represent the probability of a difference in fusion between the control cells with varying doses of Sunitinib and between control and FSHD cells at different doses of Sunitinib. y represents the log-of-odds of the fusion index. µ represents the intercept parameter (representing the control treatment: 54.6 cells with no drug), β are the parameters representing the effects of each treatment, or the interaction as specified and δ indicates whether the effect is present or absent. (b) Corresponding log of odds ratios computed from the model, for all 4 tested conditions.
- https://doi.org/10.7554/eLife.11405.024
Figure 12
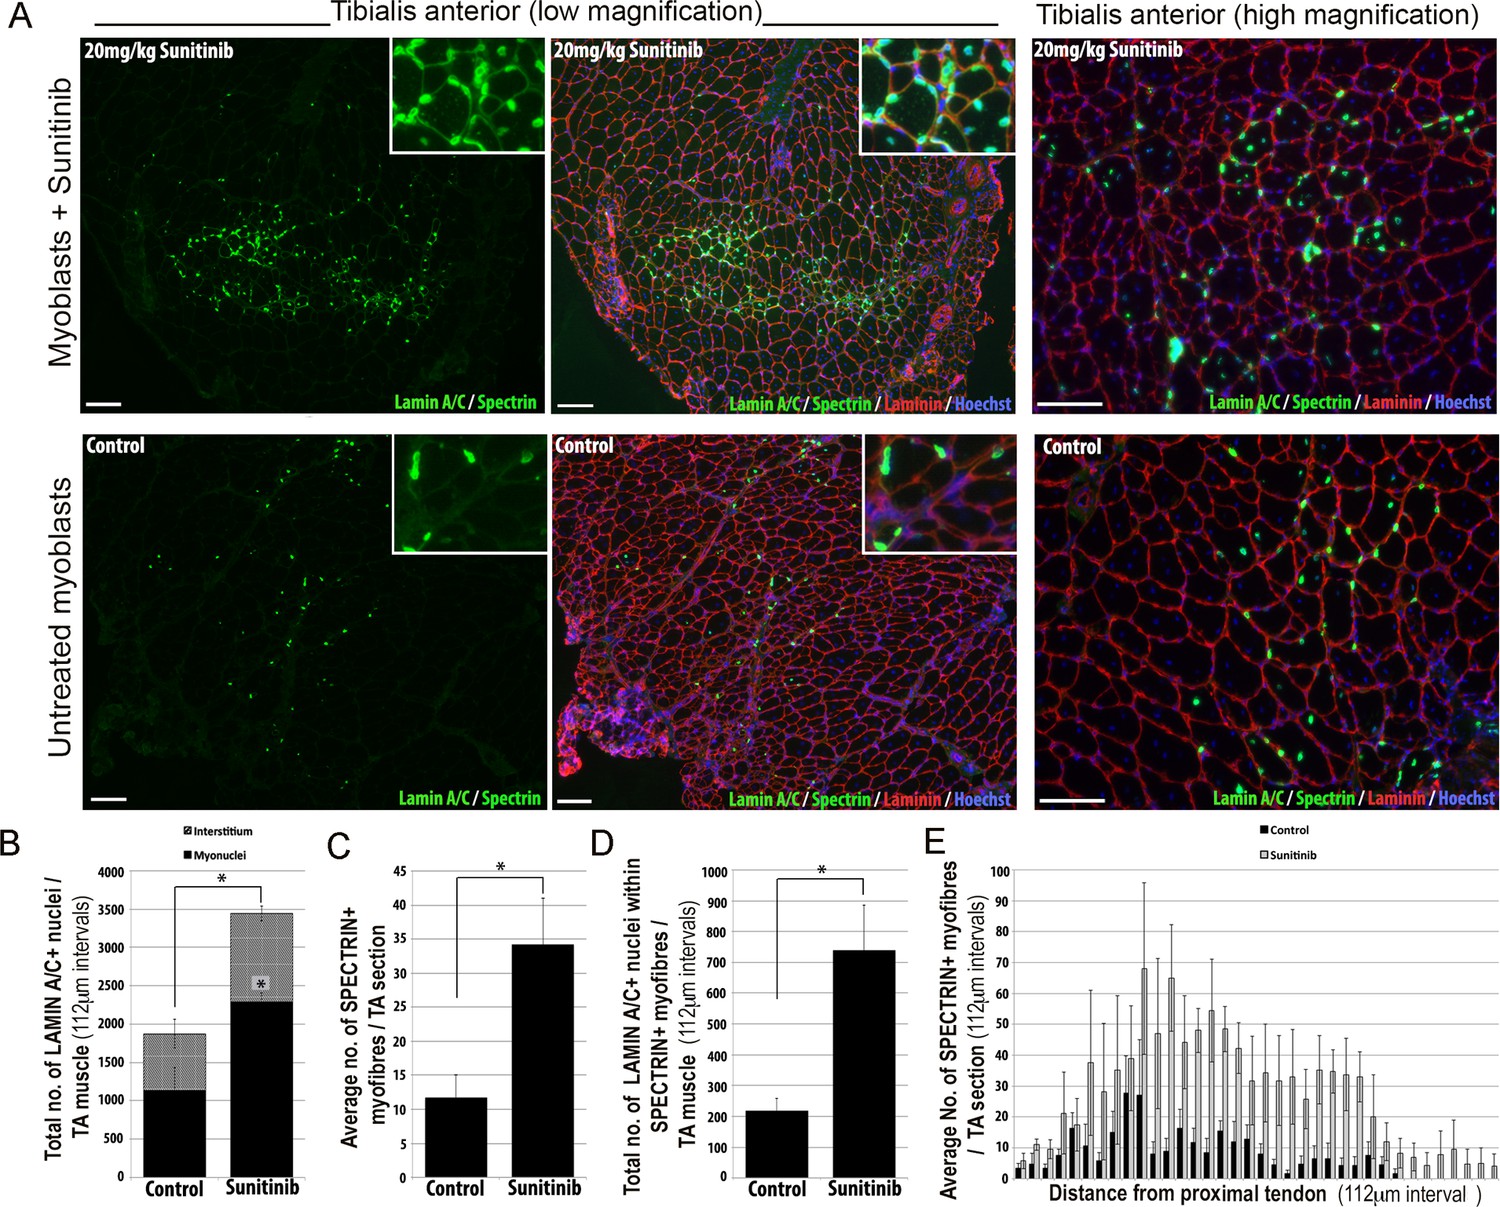
Sunitinib improves engraftment and differentiation of human FSHD myoblasts in murine skeletal muscle.
(A) Representative 8 μm thick cryosections from the tibialis anterior (TA) muscle of immunodeficient mice transplanted with 1 × 10⁶ human 54.12 FSHD myoblasts per muscle, and dosed with 20 mg/kg/day Sunitinib or PBS (control) for 3 weeks. Immunofluorescence for human-specific LAMIN A/C (green) and SPECTRIN (green) reveal the location and fate of transplanted cells, murine Laminin (red) delimits all myofibres and Hoechst (blue) reveals total nuclei. (B) Quantification of the total number of LAMIN A/C cells from each section per TA, subdivided into cells located in the interstitum (grey hatched) and nuclei (myonuclei) within myofibres (black) (also see Figure 12—source data 1). (C) Quantification of the mean number of human SPECTRIN positive myofibres per TA section (also see Figure 12—source data 2). (D) Quantification of the total number of human SPECTRIN positive myofibres containing at least one human LAMIN A/C positive cell. (E) The mean number of SPECTRIN-positive myofibres per TA section along the length of the muscle. Data is mean ± SEM from 4 control and 4 Sunitinib-treated mice, with statistical significance (p<0.05) tested against control mice using an unpaired Student’s t-test and indicated with an asterisk. Further statistical analysis is described in Figure 12—source data 1 and 2. Scale bar represents 100 μm.
-
Figure 12—source data 1
A binomial model evaluating whether the proportion of LAMIN A/C+ nuclei derived from grafted FSHD 54.12 human myoblasts in a muscle fibre is significantly affected by exposure to Sunitinib.
(a) Maximum likelihood parameters for a logistic model containing a random effect term (the mouse) describing the probability of a human LAMIN A/C+ nuclei being present in a murine muscle fibre. (b) Corresponding ratios computed from the model for 2 conditions with the ratio representing the probability of a LAMIN A/C+ nuclei occurring in a muscle fibre. In all condition but the control (Intercept), the error contribution of the baseline (Intercept) has been omitted when computing the confidence intervals (C.I.). y represents the log-of-odds of the LAMIN A/C+ nuclei occurring in a muscle fibre relative to all LAMIN A/C+ nuclei. µ represents the intercept parameter (representing the control treatment: PBS), β are the parameters representing the effects of each treatment and δ indicates whether the effect is present or absent.
- https://doi.org/10.7554/eLife.11405.026
-
Figure 12—source data 2
A binomial model evaluating whether the proportion of muscle fibres containing SPECTRIN and LAMIN A/C derived from grafted FSHD 54.12 human myoblasts is significantly affected by exposure to Sunitinib.
(a) Maximum likelihood parameters for a logistic model containing a random effect term (the mouse) describing the probability of a SPECTRIN+ murine muscle fibre containing LAMIN A/C+ nuclei . (b) Corresponding ratios computed from the model for 2 conditions with the ratio representing the probability of a SPECTRIN+ murine muscle fibre containing LAMIN A/C+ nuclei. In all condition but the control (Intercept), the error contribution of the baseline (Intercept) has been omitted when computing the confidence intervals (C.I.). y represents the log-of-odds of a SPECTRIN+ muscle fibre containing LAMIN A/C+ nuclei. µ represents the intercept parameter (representing the control treatment: PBS), β are the parameters representing the effects of each treatment and δ indicates whether the effect is present or absent.
- https://doi.org/10.7554/eLife.11405.027
Download links
A two-part list of links to download the article, or parts of the article, in various formats.
Downloads (link to download the article as PDF)
Open citations (links to open the citations from this article in various online reference manager services)
Cite this article (links to download the citations from this article in formats compatible with various reference manager tools)
Ret function in muscle stem cells points to tyrosine kinase inhibitor therapy for facioscapulohumeral muscular dystrophy
eLife 5:e11405.
https://doi.org/10.7554/eLife.11405


