The magnesium transporter A is activated by cardiolipin and is highly sensitive to free magnesium in vitro
- Nordic EMBL Partnership University of Oslo, Norway
- Oslo University Hospital, Norway
Figures
Figure 1 with 2 supplements
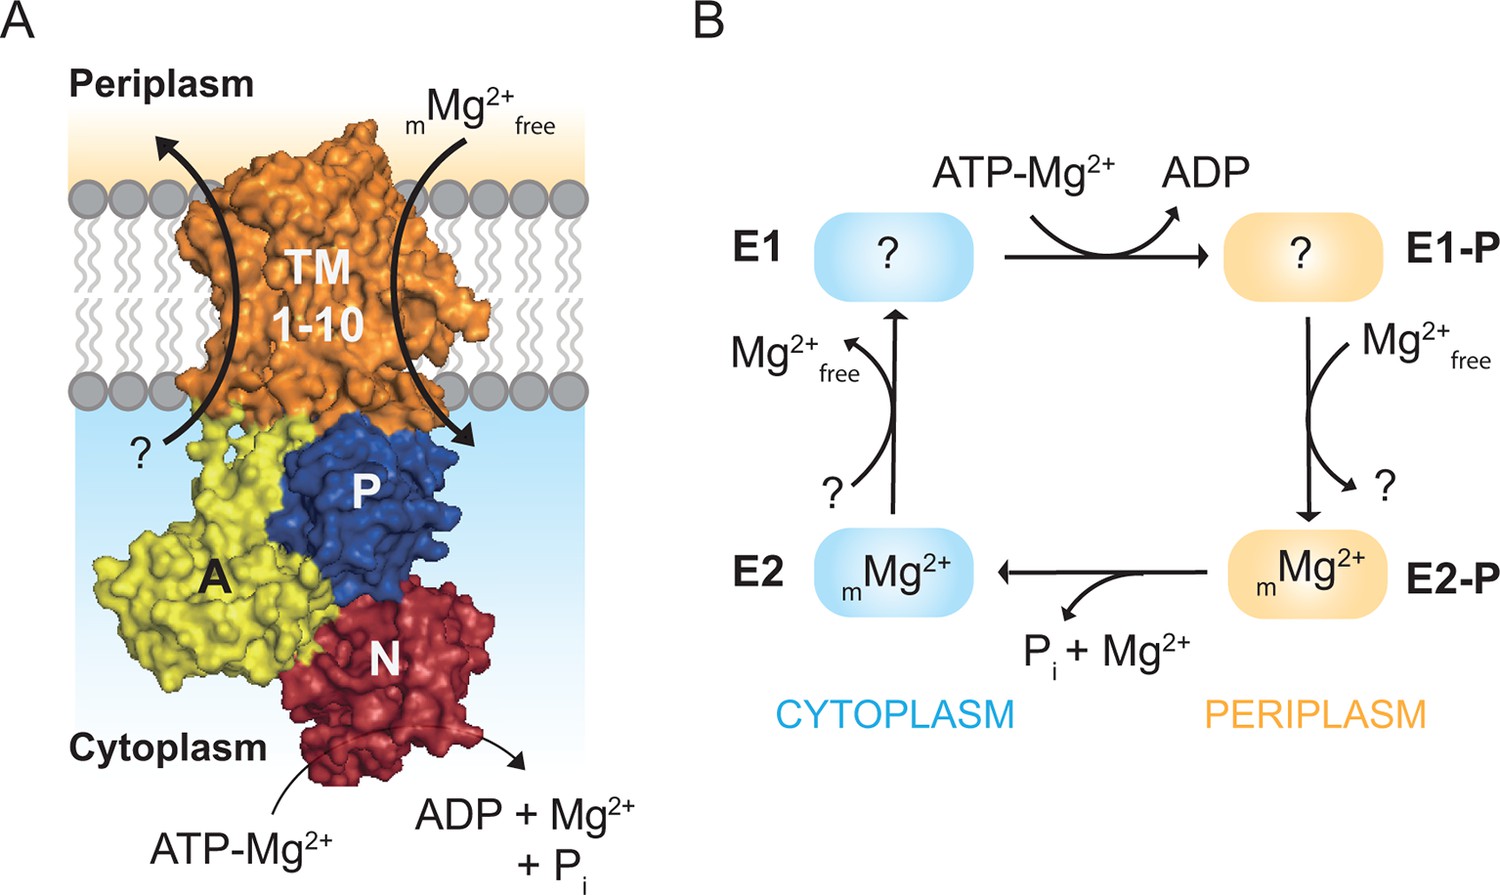
Magnesium uptake scheme for MgtA.
(A) Cartoon representation of MgtA showing transmembrane domain (TM), actuator domain (A), phosphorylation domain (P) and nucleotide binding domain (N). MgtA transports Mg2+ ions into cytoplasm as a function of ATP hydrolysis, (m) represent the unknown stoichiometry. (B) Proposed Post-Albers reaction scheme (Albers, 1967; Post et al., 1969) adapted for MgtA.
Figure 1—figure supplement 1
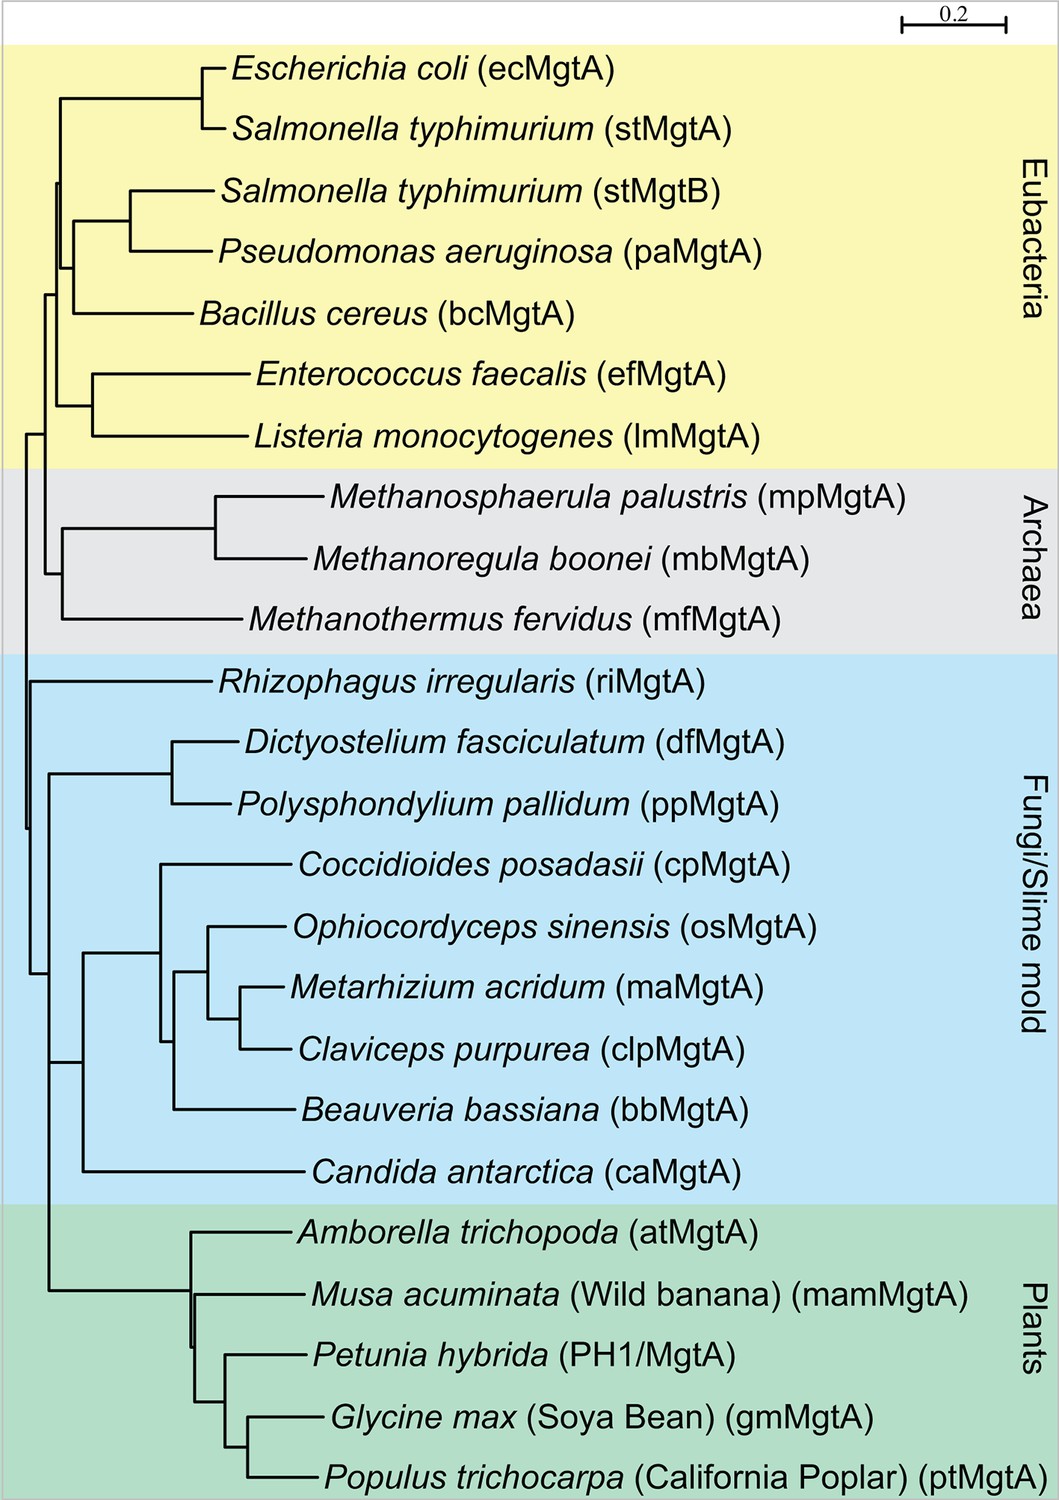
Phylogenetic tree showing distribution of MgtA homologs among four kingdom of life: eubacteria (yellow), archaea (grey), fungi and slime mold (blue) and the plant kingdom (green).
Sequences that had >35% sequence identity were selected for the analysis. Tree was made with Seaview, using BioNJ algorithm.
Figure 1—figure supplement 2
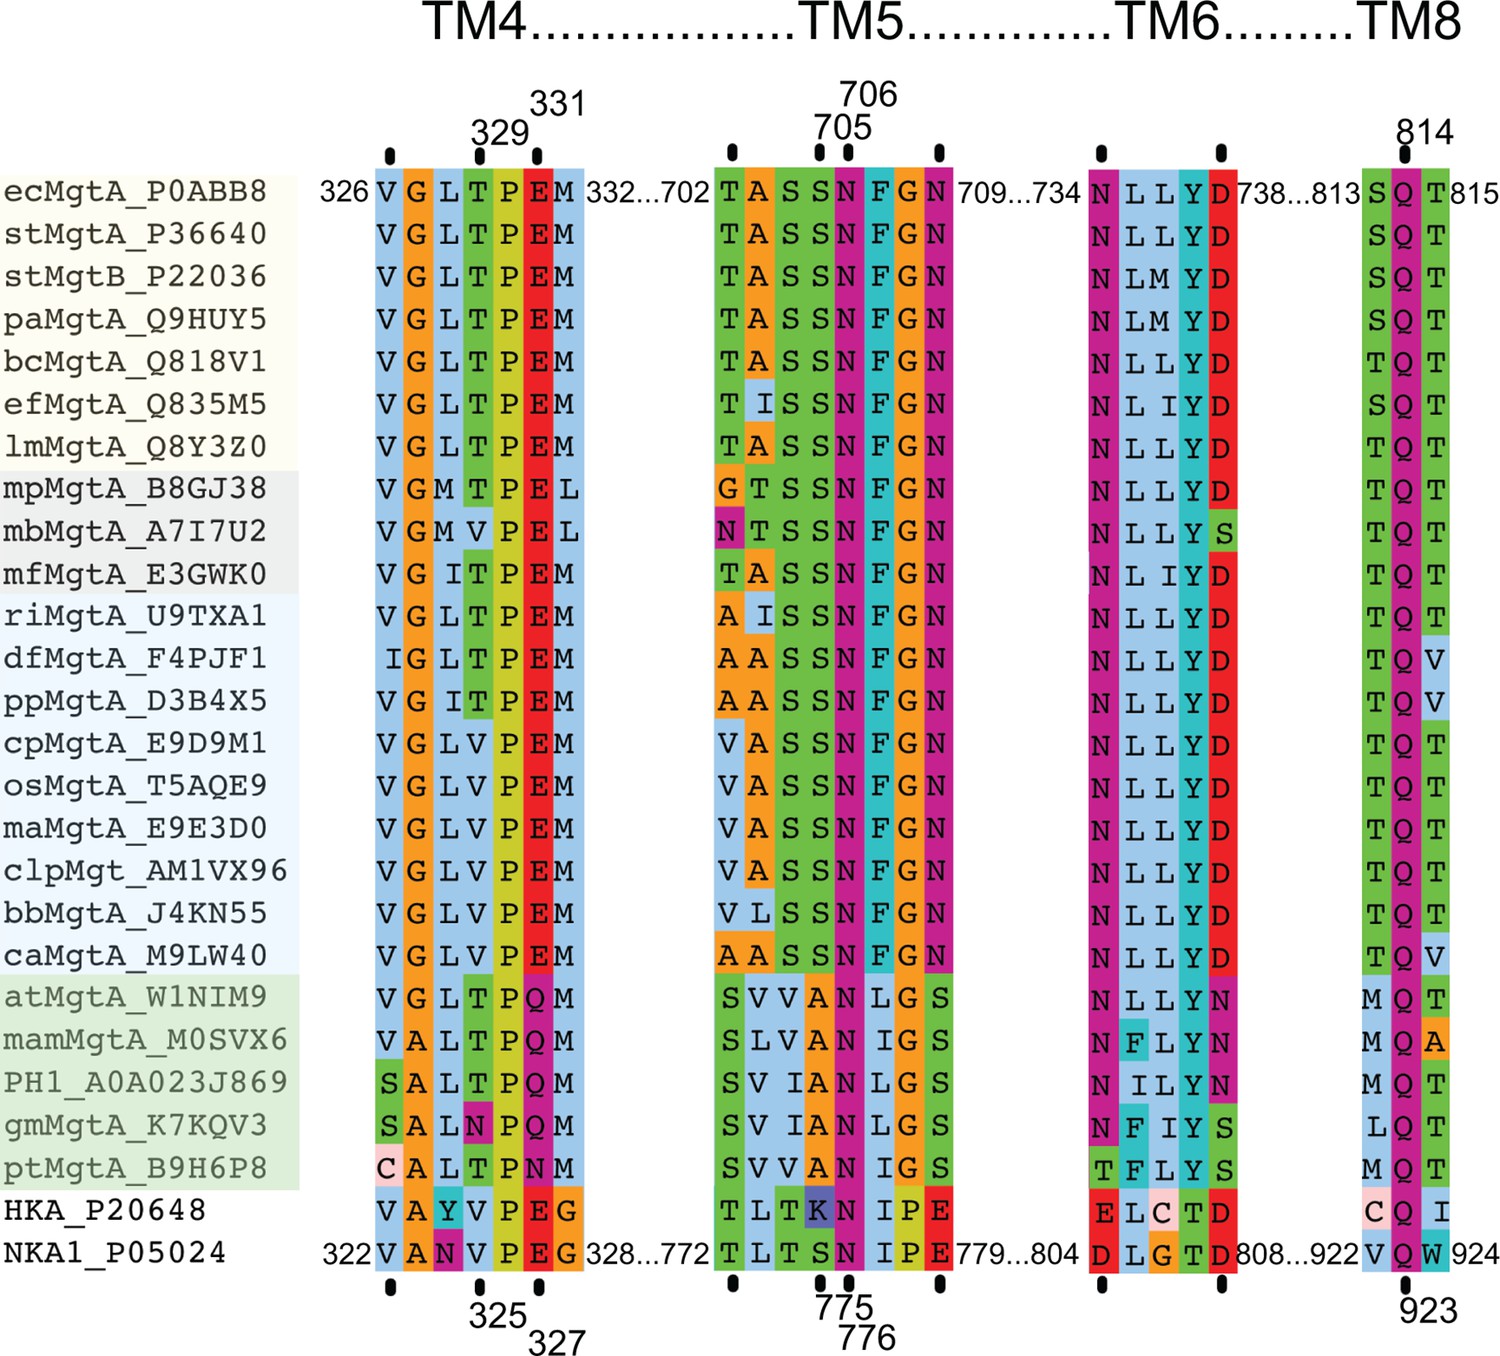
Multiple sequence alignment of selected MgtA homologs including the pig Na+/K+-ATPase (NKA1) and the human H+/K+-ATPase.
Subsets of selected sequences are shown from pathogenic bacteria (yellow background), archaeal (gray), slime molds and fungi (blue) and plants (green). Only ecMgtA and stMgtA share more than 90% sequence identity (SI), ecMgtA and the remainder of the bacterial sequences share between 50–55% SI. Archeae, slime mold/fungi and plant share between 33–45% SI. Each selected sequence is shown as a short abbreviation (equivalent to the name given in Figure 1—figure supplement 1) followed by MgtA and corresponding UniProt number. Each black line indicates residues in direct contact with the counter ion, potassium, in the porcine Na+/K+-ATPase. Val 322 and Val 325 contribute with its backbone carbonyl (Morth et al., 2007). The equivalent numbers in ecMgtA are given at the top. Each sequential segment belongs to the four transmembrane helices 4, 5, 6 and 8 as written above. The following coloring scheme is used according to the chemical functionality of the residues: Aliphatic MLIV (light blue); aromatic HFWY (cyan), amide group NQ (purple), hydroxyl group ST (green), negatively charged DE (red), positively charged KR (dark blue), small sidechain AG (orange), P (yellow) and C (light pink).
Figure 2 with 4 supplements
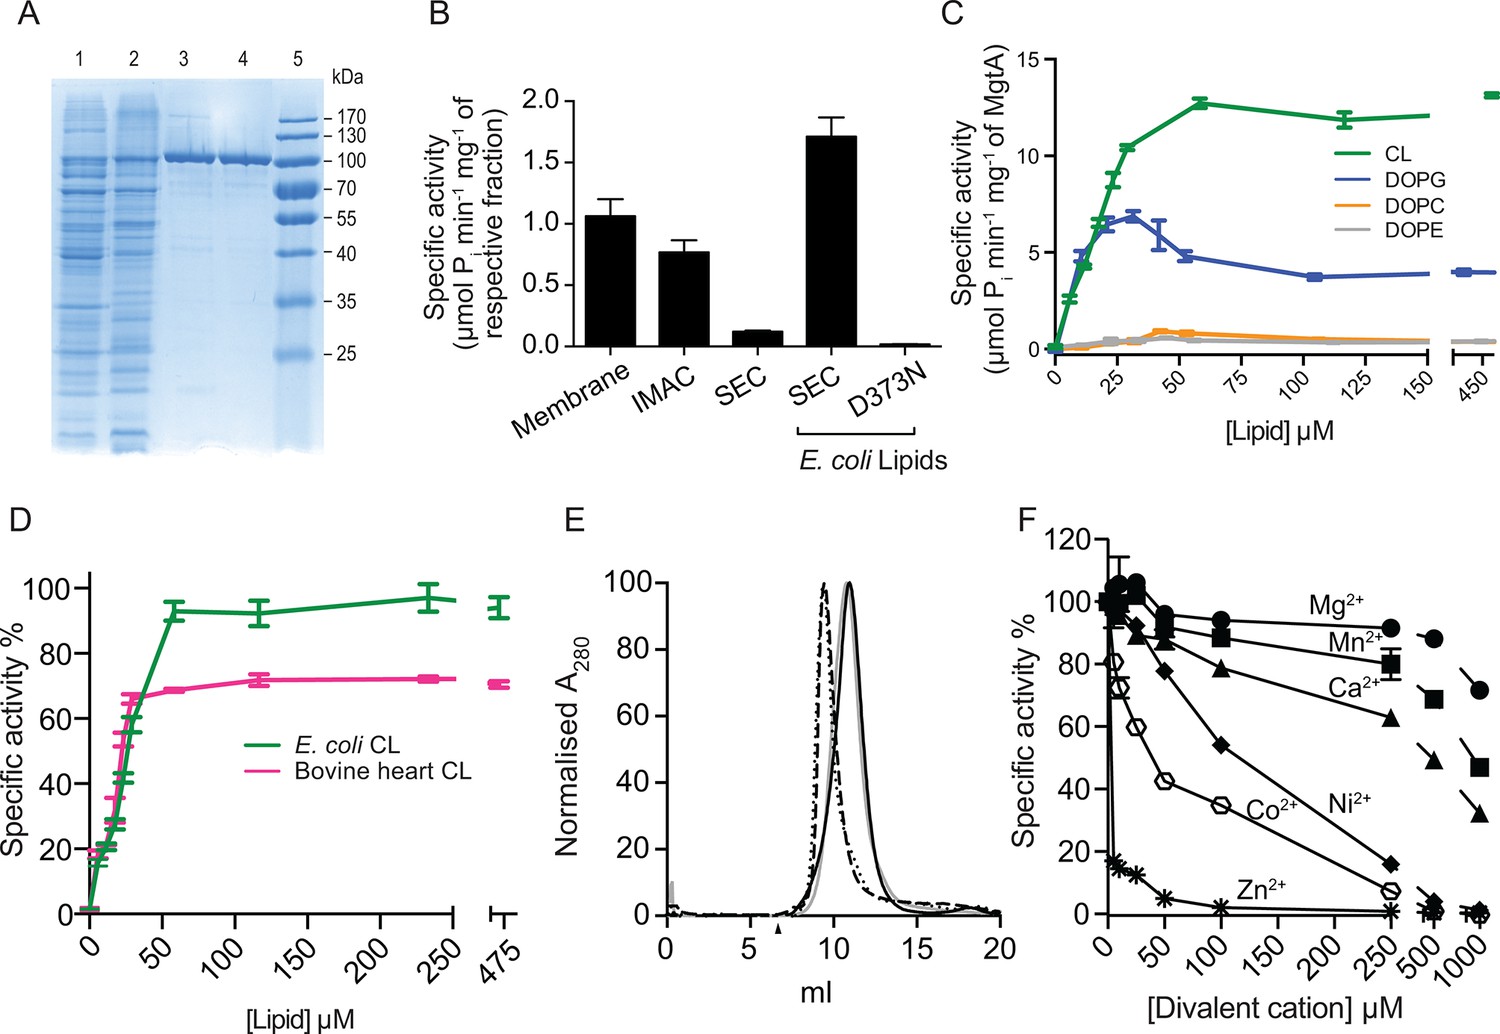
Biochemical characterization and cardiolipin depencency.
(A) Samples taken throughout the purification process were subjected to SDS-PAGE. Lane 1- Cell lysate, Lane 2- Membrane fraction, Lane 3- Ni2+ column elute, Lane 4- SEC fractions. (B) An ATPase assay was performed with samples (5 μg) collected at each purification step. Total E. coli lipids (10 μg) were added to the SEC fraction. The inactive D373N mutant purified as wild-type MgtA and served as negative control. (C) Concentration-dependent activation of ATPase activity by the individual lipid component of E. coli inner membrane. Lipids prepared as described in the methods section were added to MgtA at indicated concentrations and phosphate release was measured. (D) Comparison of the ATPase activity induced by E. coli CL and bovine heart CL. 100% Specific activity represents 13 µM min-1 mg-1 of MgtA. (E). SEC profile of MgtA in the presence of CL and Mg2+. MgtA (—); MgtA with 5.0 mM MgCl2(—); MgtA with CL (−−); MgtA with CL and 5.0 mM MgCl2 (…). MgtA and CL were mixed at 1: 3500 molar ratio and incubated on ice for 30 min before SEC. The closed arrow indicates void volume. (F) Effect of divalent cations on ATP hydrolysis by MgtA. Mg2+(●), Mn2+(■), Ca2+(▲), Ni2+(♦), Zn2+( ), Co2+(
 ). All the conditions with cations have a basal concentration of 3 mM Mg2+ and 3 mM ATP. B, C, E, F – Values plotted are mean ± SD (n = 3).
-
Figure 2—source data 1
The values represented in the figure are given in excel and the corresponding figure numbers are marked as the sheet name.
- https://doi.org/10.7554/eLife.11407.007
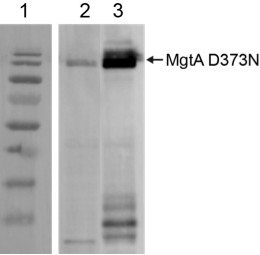
Figure 2—figure supplement 1
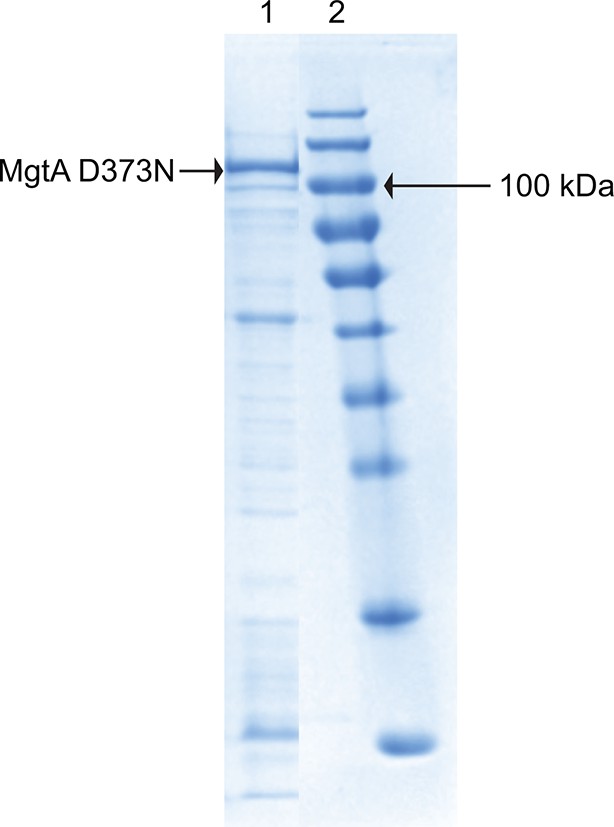
Purification of MgtA D373N: D373N mutant, which cannot be phosphorylated served as negative control.
Lane1 shows the fraction from Ni2+ purification. The prominent band marked with the arrow is MgtA D373N. Lane 2 is the protein marker.
Figure 2—figure supplement 2
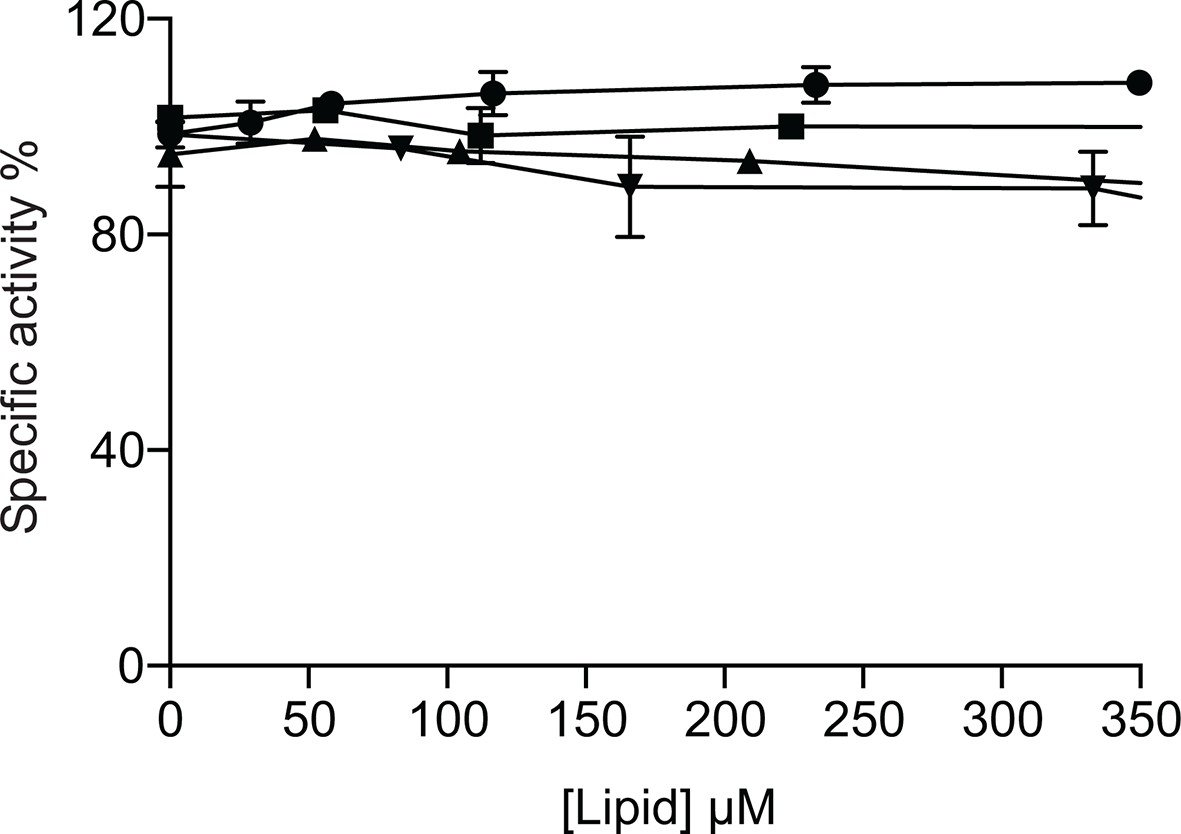
Effect of DOPE and DOPG on CL activated MgtA.
MgtA was pre-incubated with CL for 30 min before adding the following lipids. CL (●), DOPE (■), DOPG (▲) and C12E8 (♦). Values plotted are mean ± SD (n = 3).
Figure 2—figure supplement 3
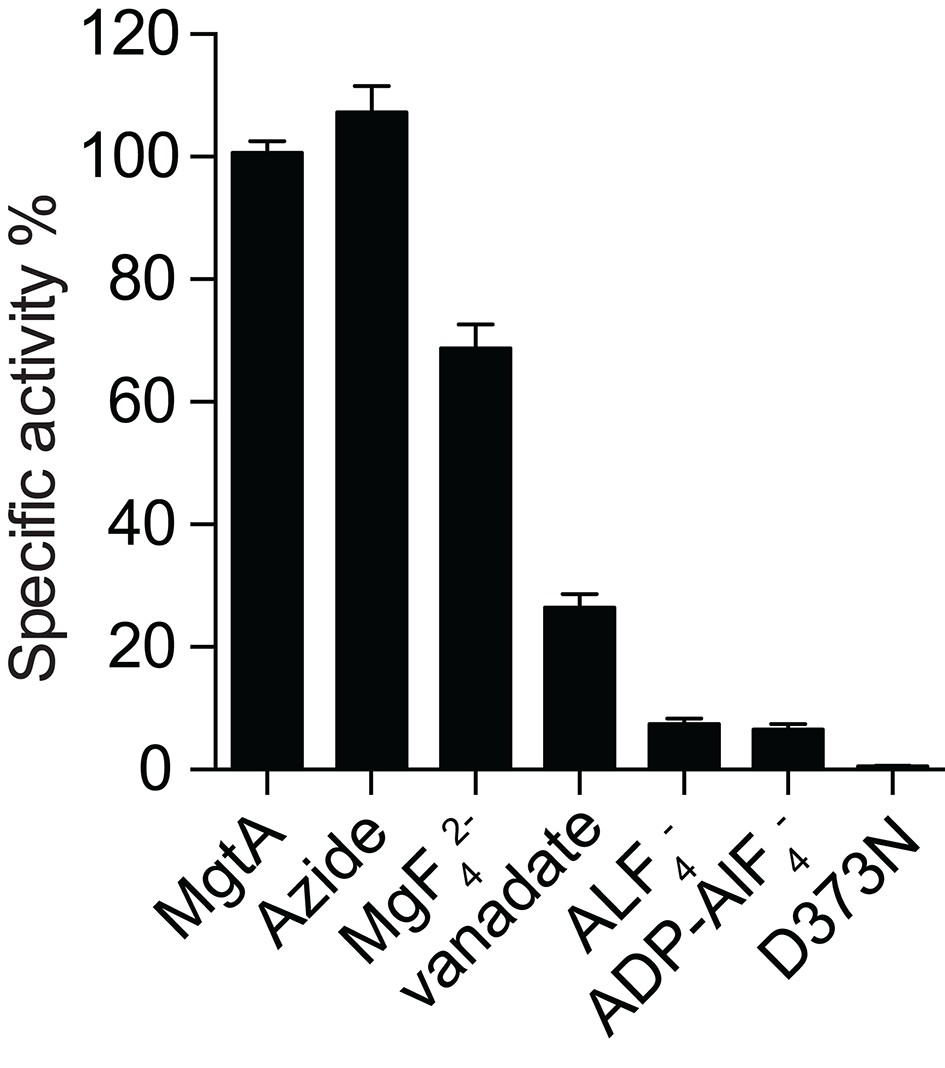
MgtA ATPase activity in the presence of inhibitors.
ATPase activity with inhibitors were normalized to the ATPase activity in the absence of inhibitor. Azide at 5.0 mM concentration (a common F-type ATPase) did not inhibit the ATPase activity while the presence of 1.0 mM known P-Type ATPase inhibitors (MgF42-, vanadate AlF4-, ADP-AlF4-) reduced the ATPase activity. The D373N mutant served as negative control. Values plotted are mean ± SD (n = 3).
Figure 2—figure supplement 4

Influence of Ni2+ on Mg2+total induced ATPase activity of MgtA.
Ni2+ at 0 μM (●), 5 μM (■), 50 μM ( ), 250 μM(♦) were added to indicated concentration of Mg2+total. 3mM ATP was used to all conditions. Values plotted are mean ± SD (n = 3).
Figure 3 with 1 supplement
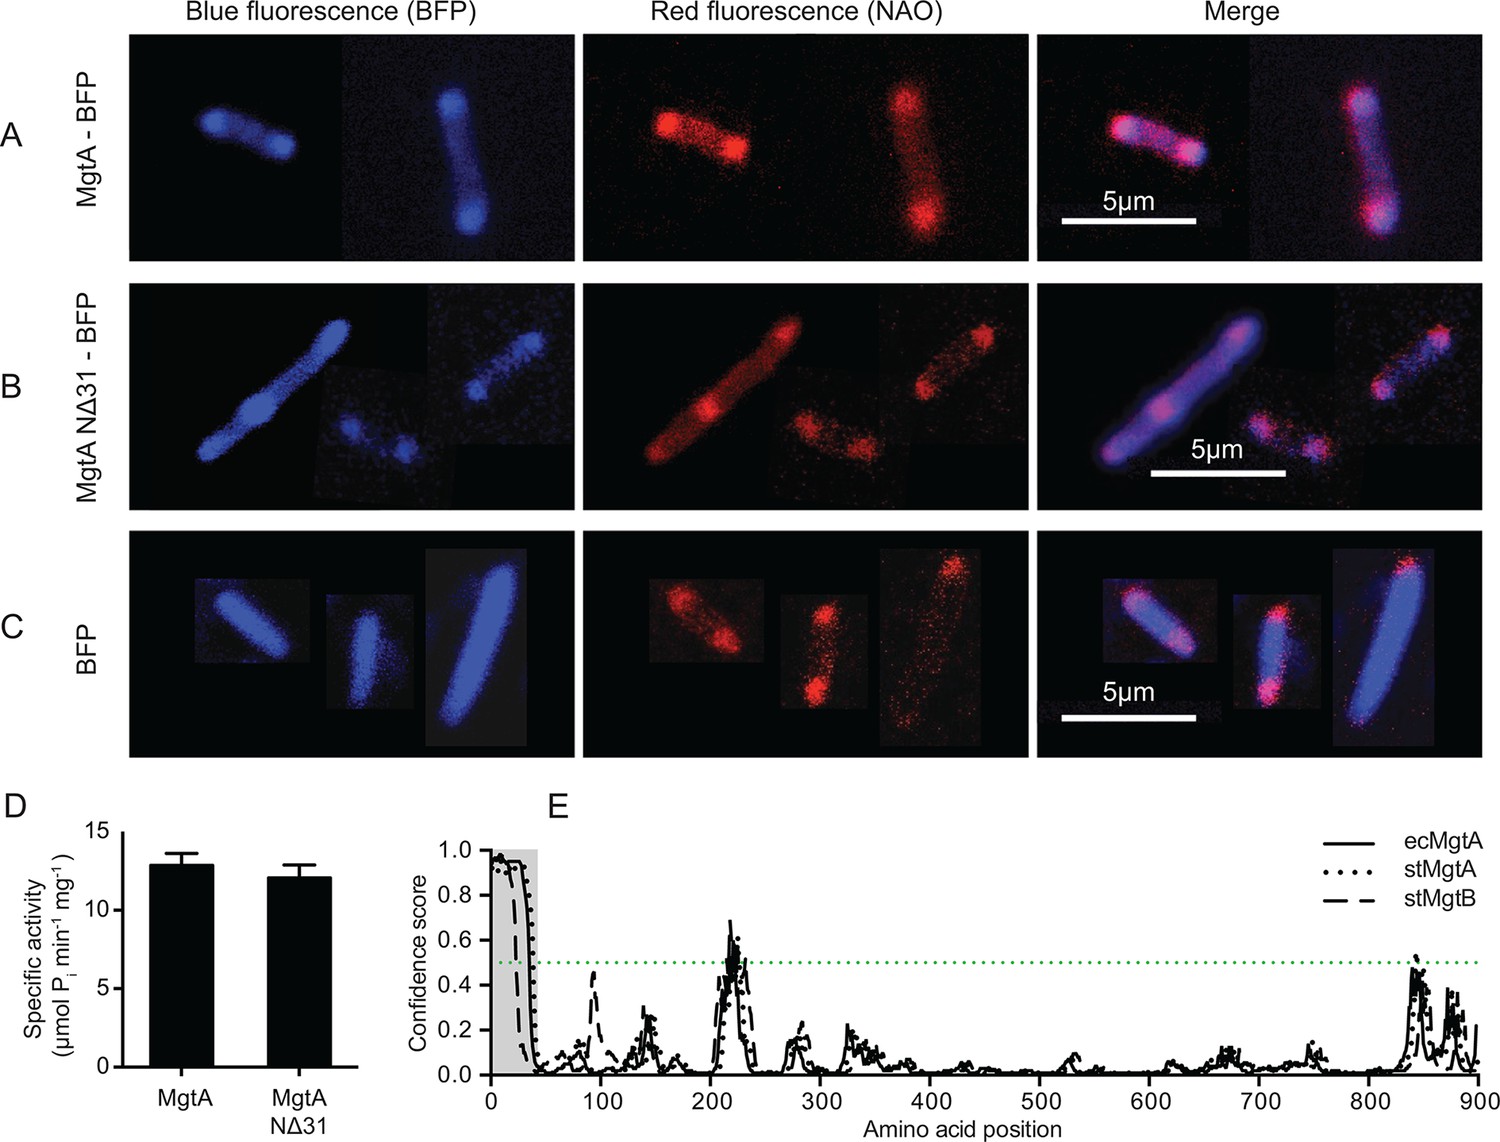
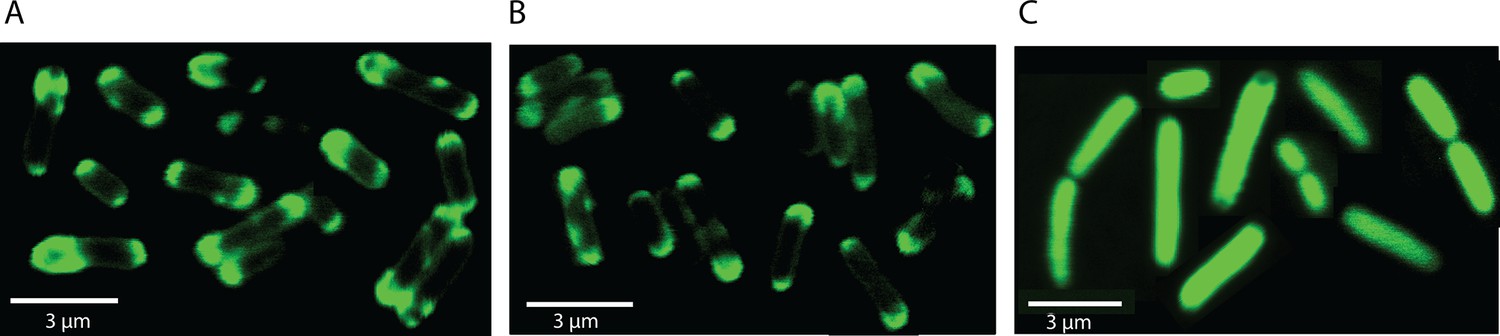
Colocalization of MgtA and CL. in E. coli C43(DE3).
(A) Colocalization of MgtA–BFP with CL. (B) Colocalization of MgtA-NΔ31–BFP with CL. (C) BFP and NAO stained CL. (D) ATPase activity of MgtA and MgtA NΔ31 measured in the presence of 125 μM CL. No significant difference in the ATPase activity was observed. (E) Disordered regions predicted using DISOPRED3 (Jones and Cozzetto, 2015). The polypeptide chain is considered disordered when the prediction is above a confidence score of 0.5. Residues 1–35, marked in grey box shows the disordered region. D, Values plotted are mean ± SD (n = 3).
-
Figure 3—source data 1
The values represented in the figure is given in excel and the corresponding figure numbers are marked as the sheet name.
- https://doi.org/10.7554/eLife.11407.014
Figure 3—figure supplement 1
Localisation of wtMgtA and the non-phosphorylatable mutant D373N in E.coli C43(DE3) cells.
GFP was fused to the C-terminus of wt or D373 and images were captured as mentioned in the materials and methods. (A) wtMgtA-GFP, (B) D373N-GFP, (C) GFP.
Figure 4 with 1 supplement

Mg2+and pH dependency of MgtA.
(A) ATP hydrolysis was measured with increasing concentration Mg2+ at fixed ATP concentrations. Irrespective of the ATP concentration used, maximum ATPase activity was observed at around 13 μM Pi min-1 mg-1 and increasing Mg2+ concentration decreases the ATPase activity. (B) Data from [A] was plotted against Mg2+free in assay condition determined using MAXC as mentioned in the methods section. (C) Data from [B] was plotted in the range from 0 to 120 μM Mg2+free and used for kinetic calculations summarized in Table 1. (D) ATP hydrolysis was measured with increasing ATP concentration at various fixed Mg2+ concentrations. Since ATP acts as Mg2+ chelator, the Mg2+free concentration decreases with increasing ATP concentration. (E) ATP hydrolysis measured at various fixed pH conditions while increasing the Mg2+ concentration. Bis-tris propane at indicated pH values was used as buffer. (F) Data from [E] was plotted against calculated Mg2+free. A-F, Values plotted are mean ± SD (n = 3).
-
Figure 4—source data 1
The values represented in the figure is given in excel and the corresponding figure numbers are marked as the sheet name.
- https://doi.org/10.7554/eLife.11407.017
Figure 4—figure supplement 1
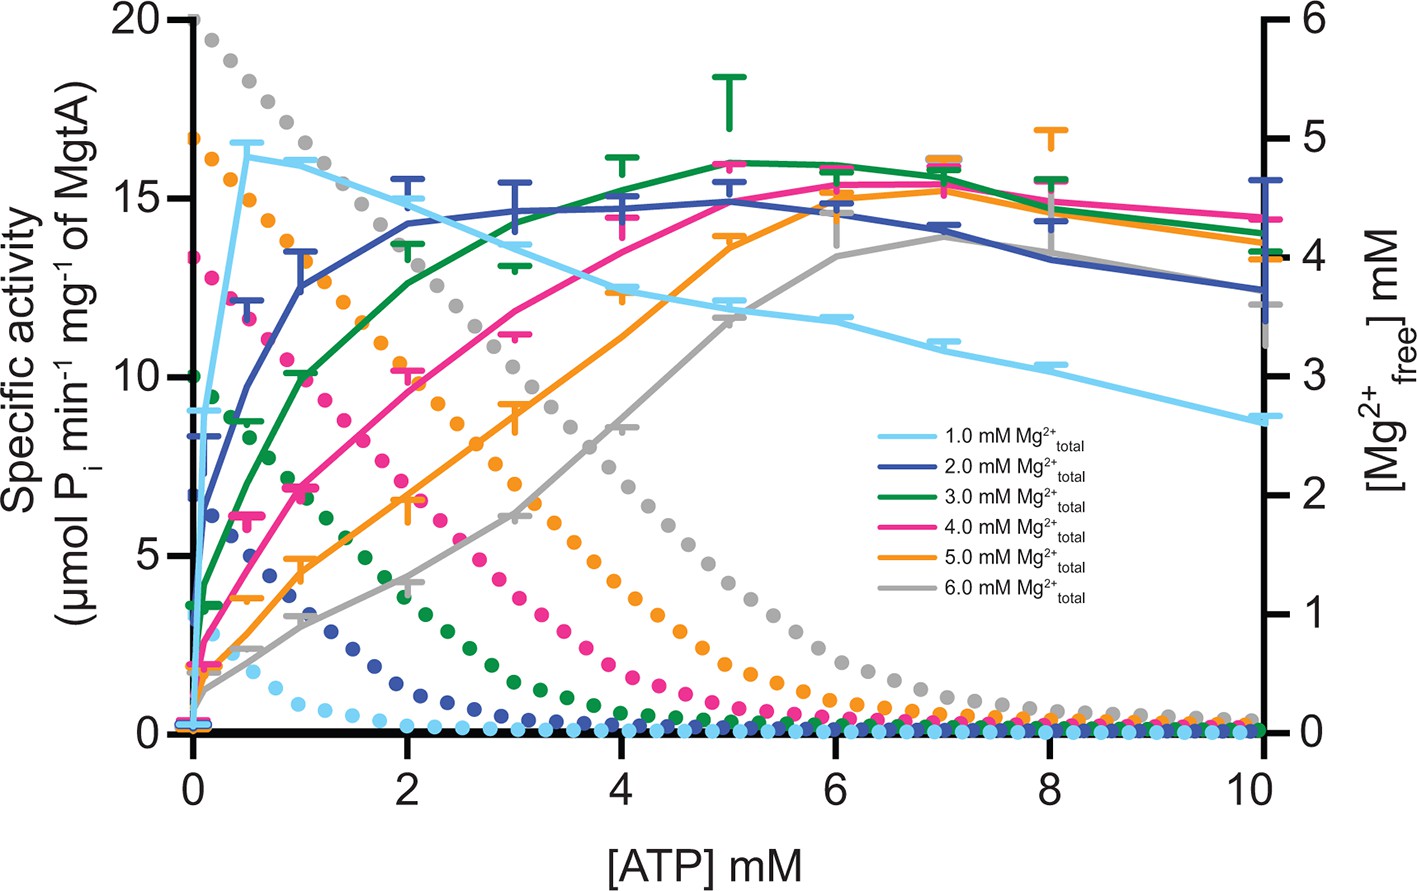
ATP dependency of MgtA at fixed Mg2+ concentration.
Solid line represents the ATPase activity of MgtA and dotted line represents the Mg2+free available at corresponding ATP concentrations. Colour of the dotted line corresponds to the concentration of Mg2+total used to calculate Mg2+free. The graph shows that MgtA achieves maximum activity when the Mg2+free concentration in the assay setup is below 50 μM. Values plotted are mean ± SD (n = 3).
Figure 5
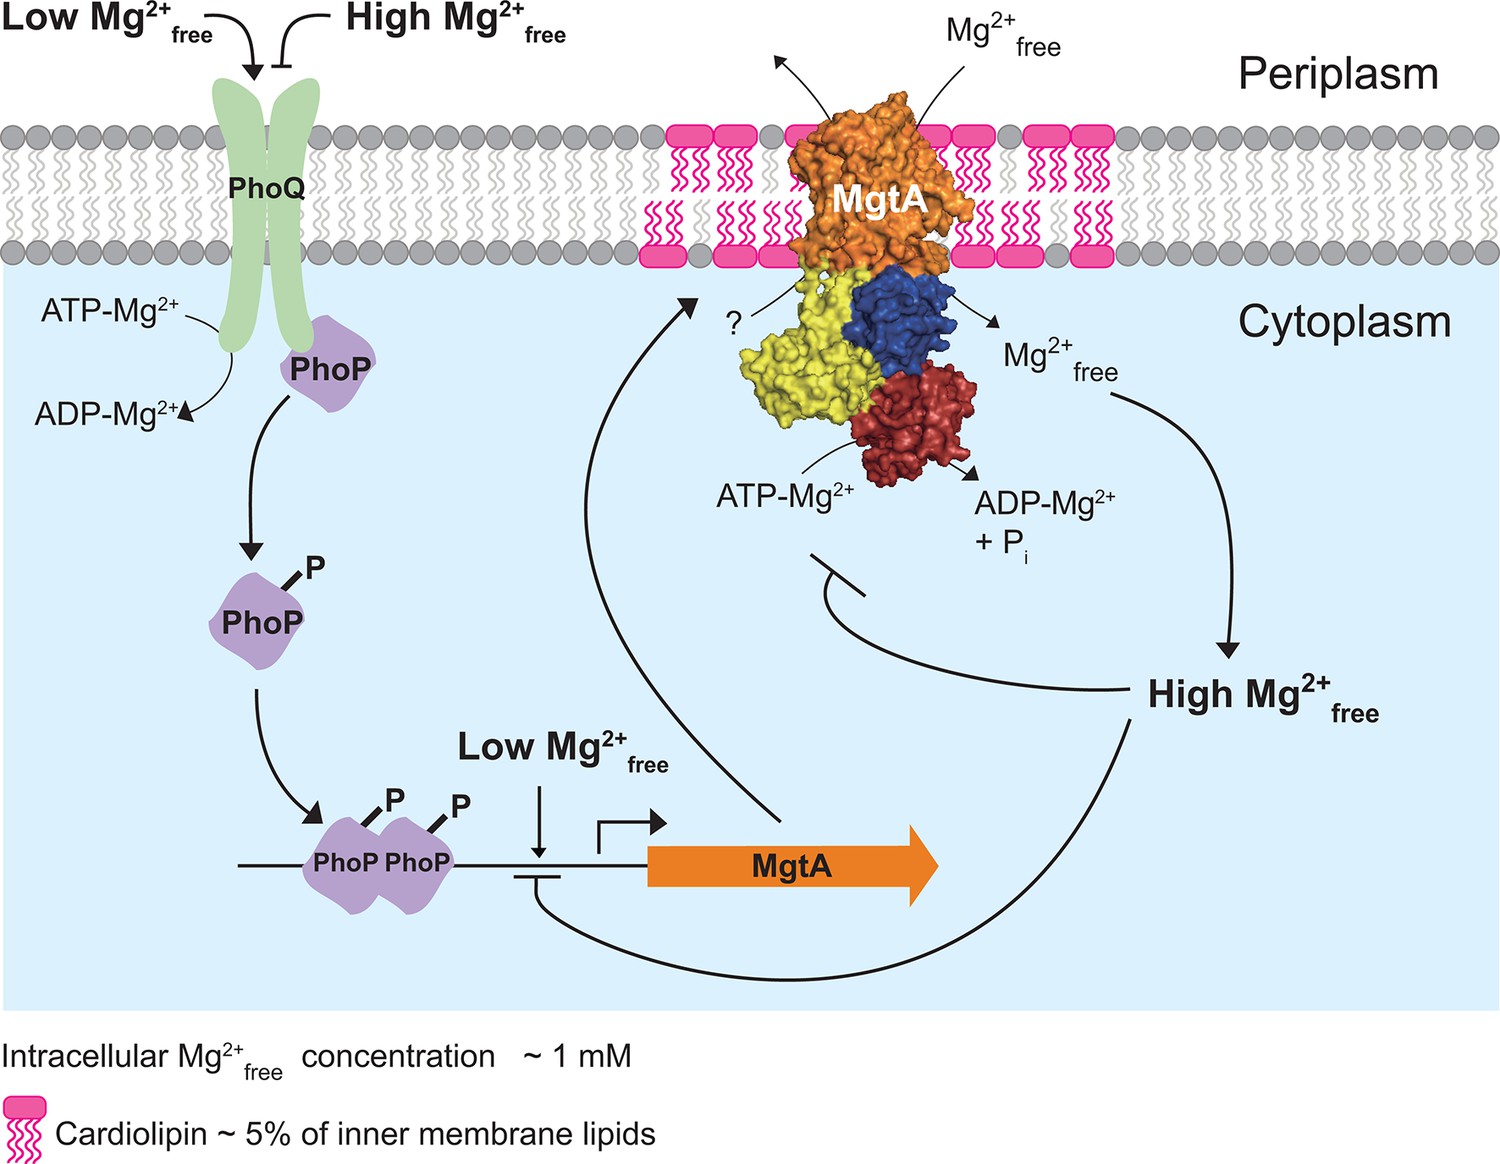
Model illustrating the regulation of Mg2+ uptake by MgtA.
When PhoQ senses low Mg2+free (<50 μM) in periplasm, it phosphorylates PhoP. This activates PhoP and it promotes transcription of the mgtA gene. MgtA protein is targeted to CL-rich region in bacterial inner membrane. Association of MgtA with CL is essential for its activity. MgtA imports Mg2+free available in periplasm to the cytoplasm of bacteria, thereby increasing cytoplasmic Mg2+free concentration. When the cytoplasmic Mg2+free concentration reaches a threshold (~1 mM), MgtA is inhibited both at the transcriptional and the post-translational level.
Author response image 1
Overexpression of MgtA D373-BFP, and MgtA D373N-GFP in E. coli analysed by Western blotting.
Equivalently overexpressed C43(DE3) cells were normalized to OD600nm = 1 and 5µl of the cell lysate was used for western blotting. Blot was developed with Penta-His HRP conjugate antibody (Qiagen). Lane1 – Marker, lane 2 – MgtA D373N BFP, Lane 3 – MgtA D373N GFP. The expression level of the BFP tagged construct is markedly lower than the GFP tagged construct.
Tables
Table 1
Kinetic property of purified MgtA. The apparent Vmax,Km, and the turnover number (Kcat) values were determined by least squares fit of the data from Figure 4C, as described in materials and methods.
| Parameters | 1 mM ATP | 3 mM ATP | 6 mM ATP |
|---|---|---|---|
| Vmax (μmol min-1 mg-1) | 14.0 ± 0.2 | 13.7 ± 0.2 | 14.5 ± 0.2 |
| Km (μM) | 15 ± 0.6 | 10 ± 0.6 | 10 ± 0.6 |
| Kcat (s-1) | 23 ± 0.3 | 22 ± 0.8 | 24 ± 0.2 |
Download links
A two-part list of links to download the article, or parts of the article, in various formats.
Downloads (link to download the article as PDF)
Open citations (links to open the citations from this article in various online reference manager services)
Cite this article (links to download the citations from this article in formats compatible with various reference manager tools)
The magnesium transporter A is activated by cardiolipin and is highly sensitive to free magnesium in vitro
eLife 5:e11407.
https://doi.org/10.7554/eLife.11407


