Quantitative imaging reveals real-time Pou5f3–Nanog complexes driving dorsoventral mesendoderm patterning in zebrafish
- A*STAR, Singapore
- European Molecular Biology Laboratory, Germany
- National University of Singapore, Singapore
Figures
Figure 1 with 3 supplements
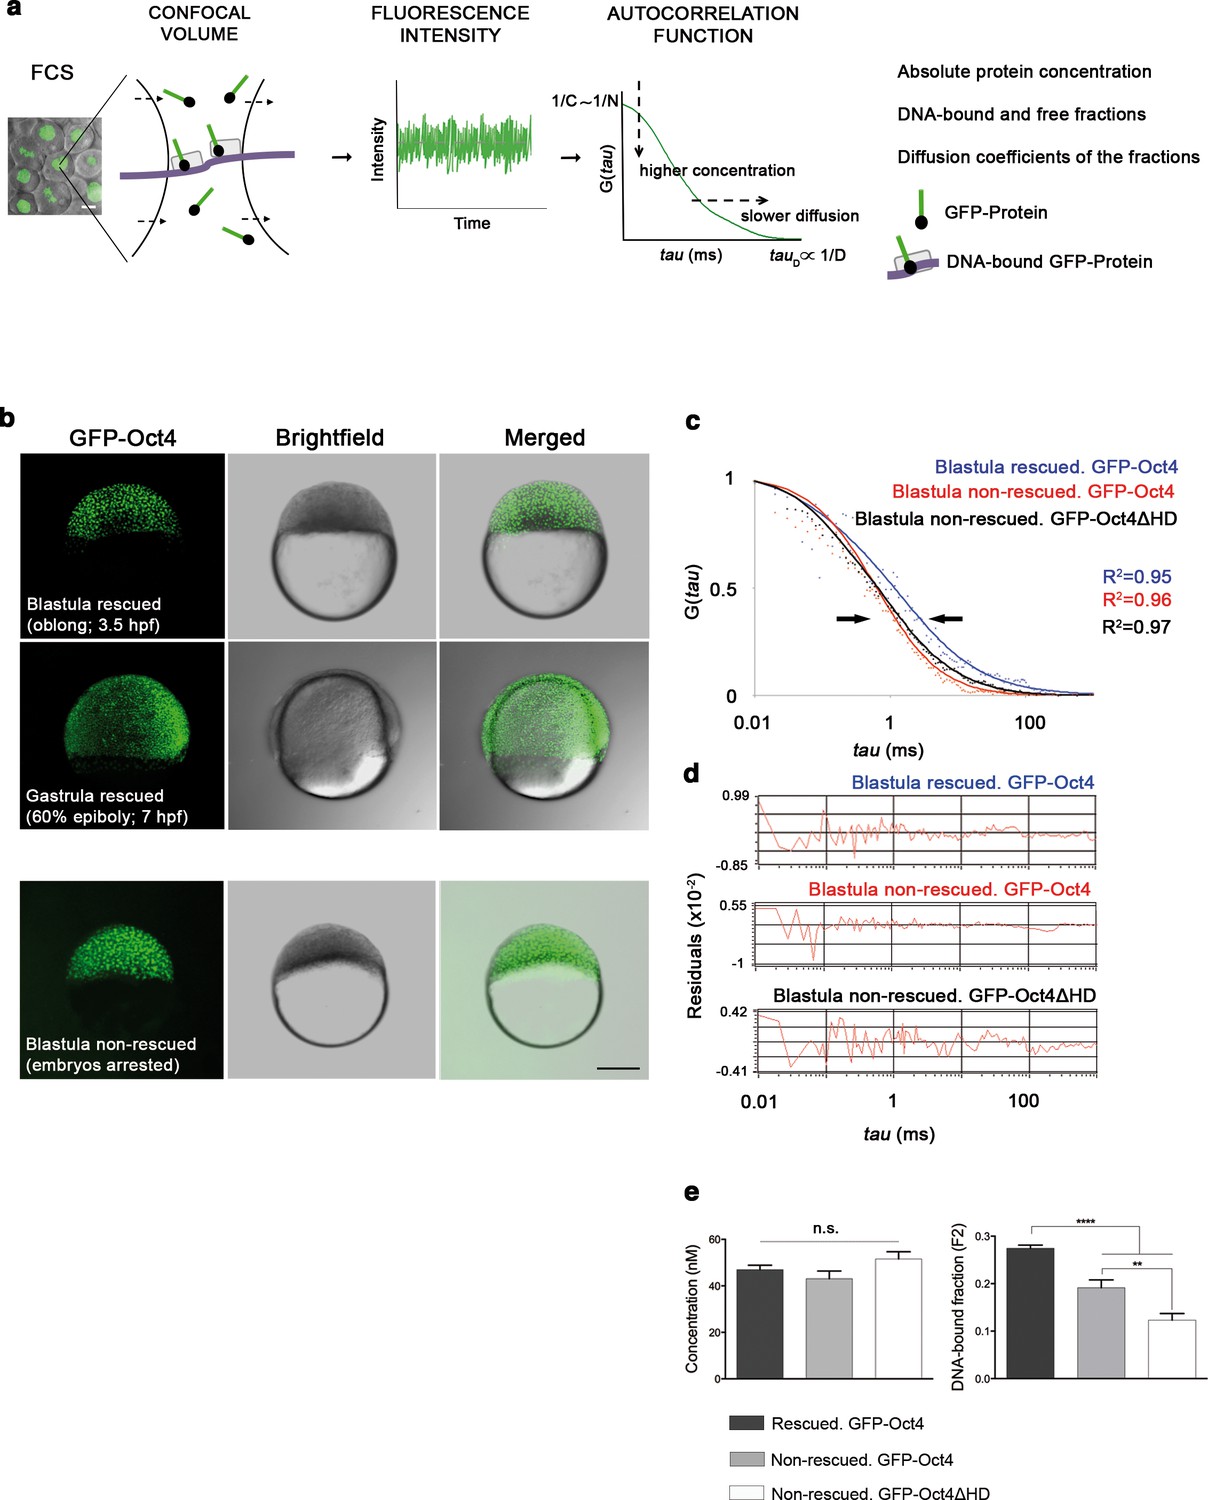
Oct4 DNA-bound active fraction controls zebrafish gastrulation.
(a) Schematic diagram of fluorescence correlation spectroscopy (FCS). GFP-tagged nuclear protein is localized in the nucleus of embryonic cells. Fluorescence molecules diffuse through a confocal volume (<1 μm3) within a single-cell nucleus and generate fluctuating fluorescence intensity. The autocorrelation function (ACF) of the fluctuation is fit to obtain the absolute protein concentration (C) and the diffusion coefficient (D), where N is the number of molecules. Scale bar: 10 μm. (b) Lateral view of pou5f3 morphant embryos expressing GFP-Oct4 rescued by GFP-Oct4 mRNA at the blastula [3.5 hr post-fertilization (hpf)] and gastrula (7 hpf) stages and non-rescued embryos (arrested) at the blastula stage. The non-rescued embryos also express GFP-Oct4 but remain at the blastula stage and do not develop further. Scale bar: 200 μm. (c) ACF of the intensity traces of GFP-Oct4 and GFP-Oct4ΔHD in rescued and non-rescued embryos at the blastula stage. The ACF were fit by two-component anomalous diffusion model. Curves are normalized to compare differences in protein activity (indicated by arrows). (d) Raw data of residuals from fit curves shown in c. (e) Concentration and DNA-bound fraction levels derived from the FCS measurements in c. Values represent the mean ± SEM of data from three to five independent experiments (n = 39–125 cell nuclei from 10 to 15 embryos ****p<0.0001; **p<0.01). n.s. over bars indicates non-significant differences. See also Figure 1—figure supplements 1–3, Figure 1—source data 1 and Materials and methods.
-
Figure 1—source data 1
Quantification of GFP-Oct4 concentration and activity in zebrafish rescued and non-rescued embryos.
Values for concentration and diffusion parameters were derived from the analysis of FCS data with the ACFs fit by two-component anomalous diffusion model. D1, D2: Diffusion coefficients of the fast and slow diffusion components, respectively. F2: Slow component fraction. α1, α2: anomalous parameters of the fast and slow diffusion components, respectively. Values represent mean ± SEM of data from three to five independent experiments (n represents the number of cell nuclei from 10 to 15 embryos; ****p<0.0001; **p<0.01; *p<0.05). Details of the rescue and the FCS analyses are shown in Figure 1—figure supplements 1–3 and Material and methods.
- https://doi.org/10.7554/eLife.11475.004
Figure 1—figure supplement 1
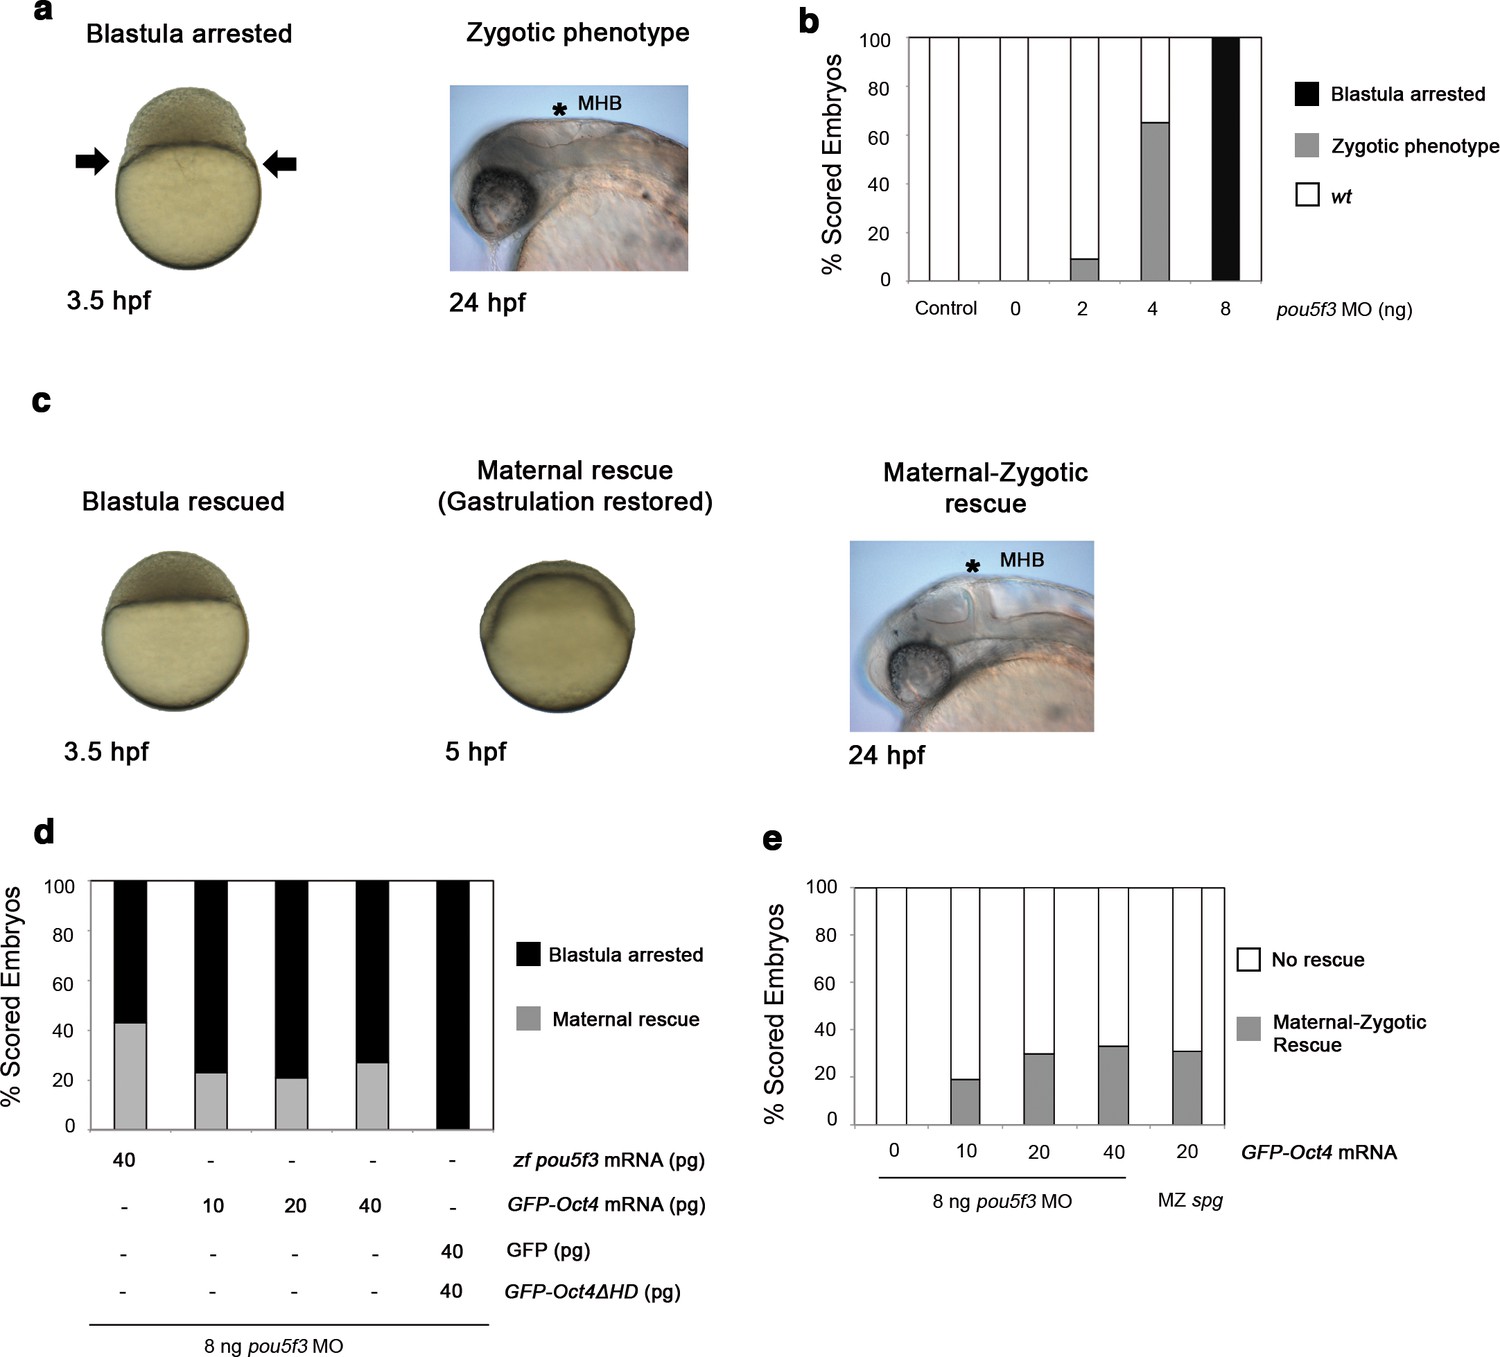
GFP-Oct4 rescues zebrafish Pou5f3 function.
(a) Phenotypes of pou5f3 knockdown using morpholino (MO) antisense. Arrows show a constriction in the interface between the yolk and the blastoderm, prohibiting gastrulation in embryos arrested at the blastula stage after MO injection. Embryos not arrested show zygotic phenotype: they do not develop the mid–hindbrain boundary (*MHB) at the 24-hpf stage. (b) Relative percentages of different phenotypes according to the dose of pou5f3 MO injected. Phenotypes are expressed as a percent of whole (n = 150–400 embryos per condition). As a control, a mismatch MO sequence was injected resulting in 100% of embryos with wt phenotype. 100% of embryos were arrested at the blastula stage using 8 ng of MO. Lower-dosed 4-ng and 2-ng embryos continued through gastrulation but did not develop the MHB, according to the percentages shown. (c) Phenotypes of rescued embryos. Rescue of maternal pou5f3 function, as shown by restoring normal gastrulation. Rescue of maternal-zygotic pou5f3 function, as shown by MHB formation at 24 hpf. (d and e) Relative percentages of (d) maternal and (e) maternal-zygotic rescue according to different amounts of injected mRNA. Phenotypes of the rescued embryos are expressed as a percent of whole (n = 170–400 embryos per condition).
Figure 1—figure supplement 2
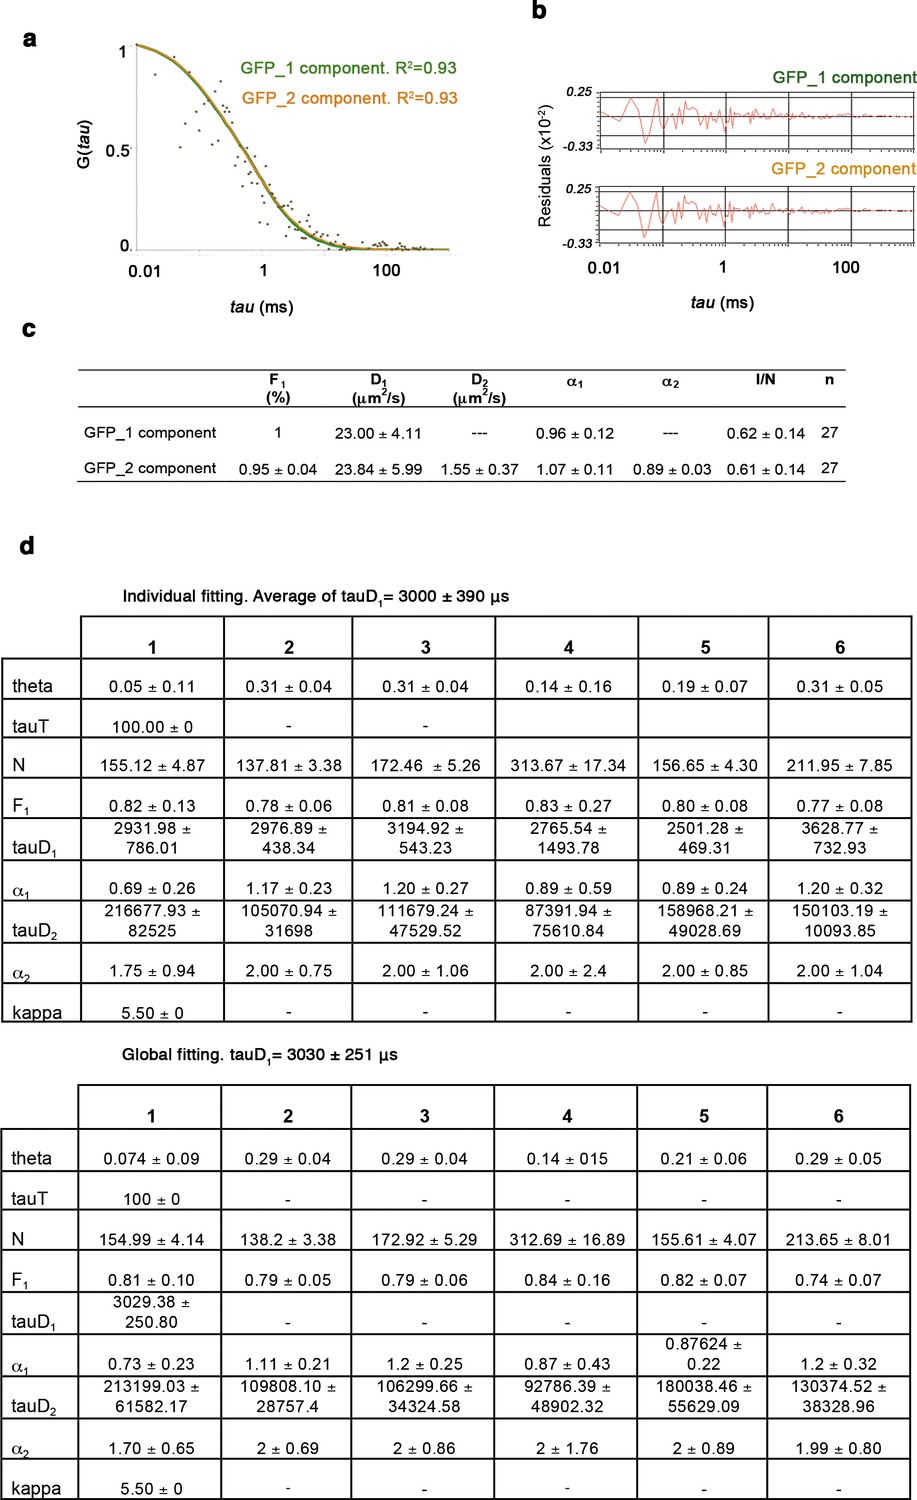
One- and two-component anomalous diffusion model for GFP and GFP-Oct4.
(a) Autocorrelation function (ACF) of free GFP fit by two- and one-component anomalous diffusion models. Two-component anomalous diffusion model converged to effective one-component anomalous diffusion for a real one-component system, such as free GFP. (b) Raw data of residuals from fit curves shown in a. (c) Quantitative parameters derived from the ACFs. F1: Fast component fraction. D1, D2: Diffusion coefficients of the fast and slow diffusion components, respectively. α1, α2: anomalous parameters of the fast and slow diffusion components, respectively. I/N: Ratio of mean intensity extracted directly from the time traces and the mean number of molecules in the focus extracted from the fit, referred to as molecular brightness. n: number of cells. (d) The GFP-Oct4-free diffusion coefficient (D1) determined by global fitting and averaging individual fits yields provides similar diffusion time, tauD1. Values represent mean ± SEM of data from three independent experiments.
Figure 1—figure supplement 3
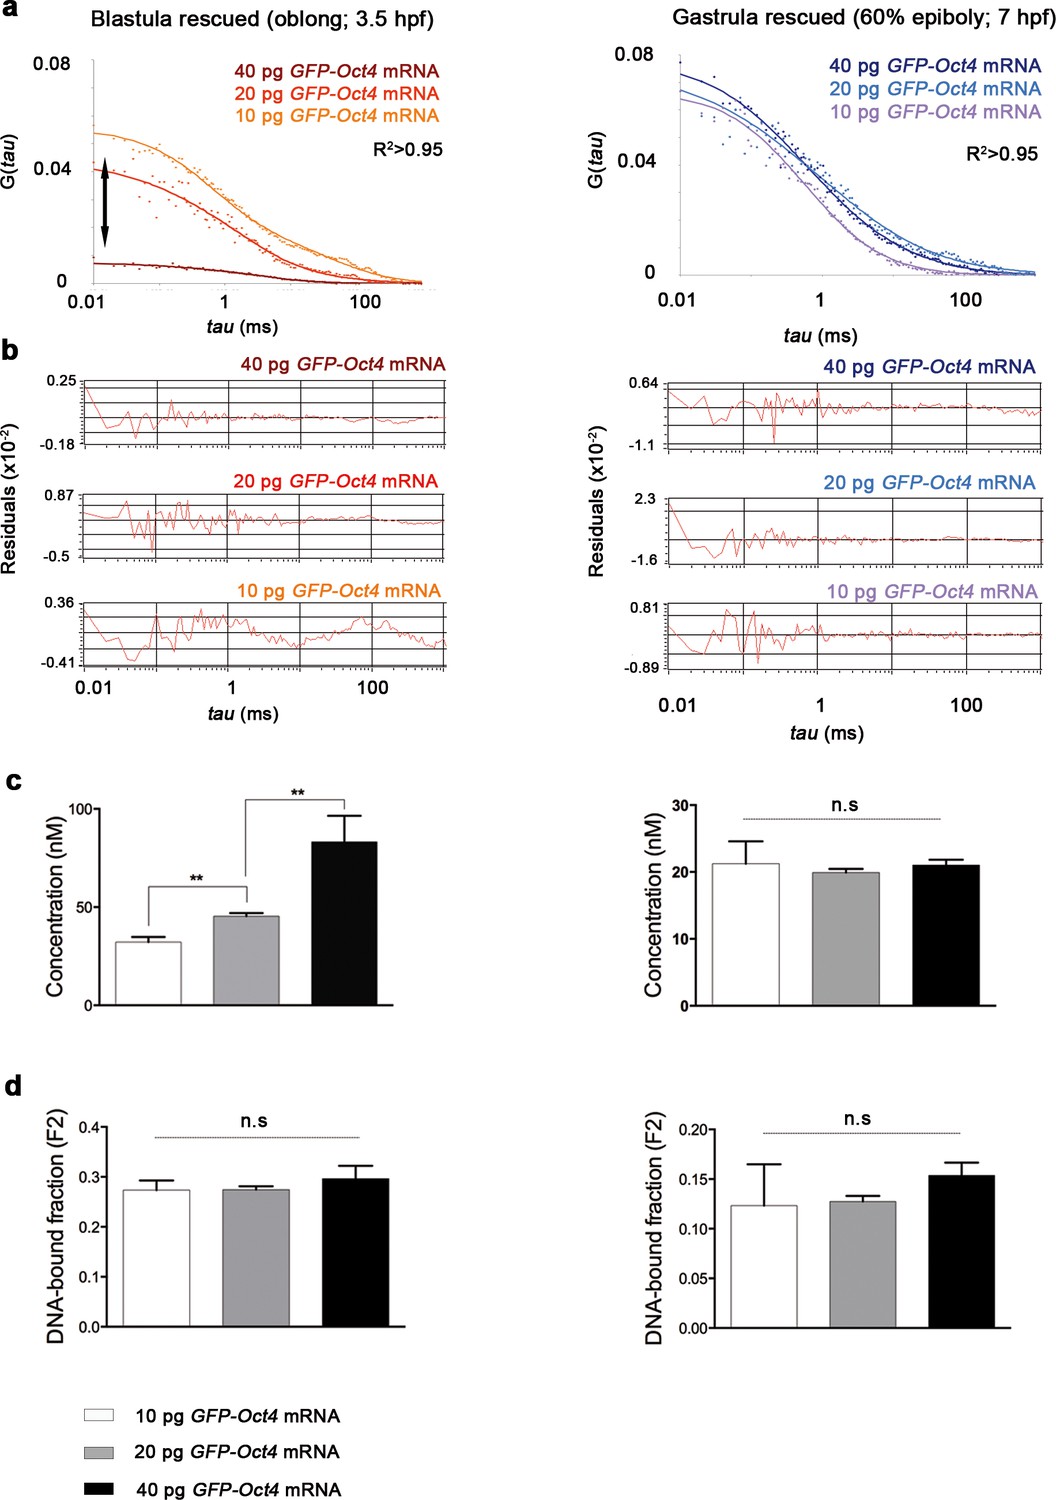
Oct4 concentration and DNA-bound active fraction in embryos rescued with different amount of GFP-Oct4 mRNA.
(a) Autocorrelation function (ACF) of the intensity traces of GFP-Oct4 by the two-component fit anomalous diffusion model in rescued embryos with different amounts of GFP-Oct4 mRNA at blastula (oblong; 3.5 hpf) and gastrula (60% epiboly; 7 hpf) stages. Double-headed arrow in the graph indicates the difference in the amplitude of the curves, which corresponds to the difference in protein concentrations. (b) Raw data of residuals from fit curves shown in a. (c, d) Concentration (c) and DNA-bound fraction (d) derived from the FCS measurements in a. Changes in the GFP-Oct4 concentration at oblong stage in rescued embryos were concordant with the proportion of mRNA injected. However, the Oct4 DNA-bound fraction did not significantly change with varying concentrations. Concentration and Oct4 DNA-bound fraction remained similar in rescued embryos at 60% epiboly. Values represent mean ± SEM of data from three independent experiments (n > 35 cell nuclei from 10 to 15 embryos; **p<0.01). n.s. over bars indicates non-significant differences. See also Figure 1—source data 1.
Figure 2 with 4 supplements
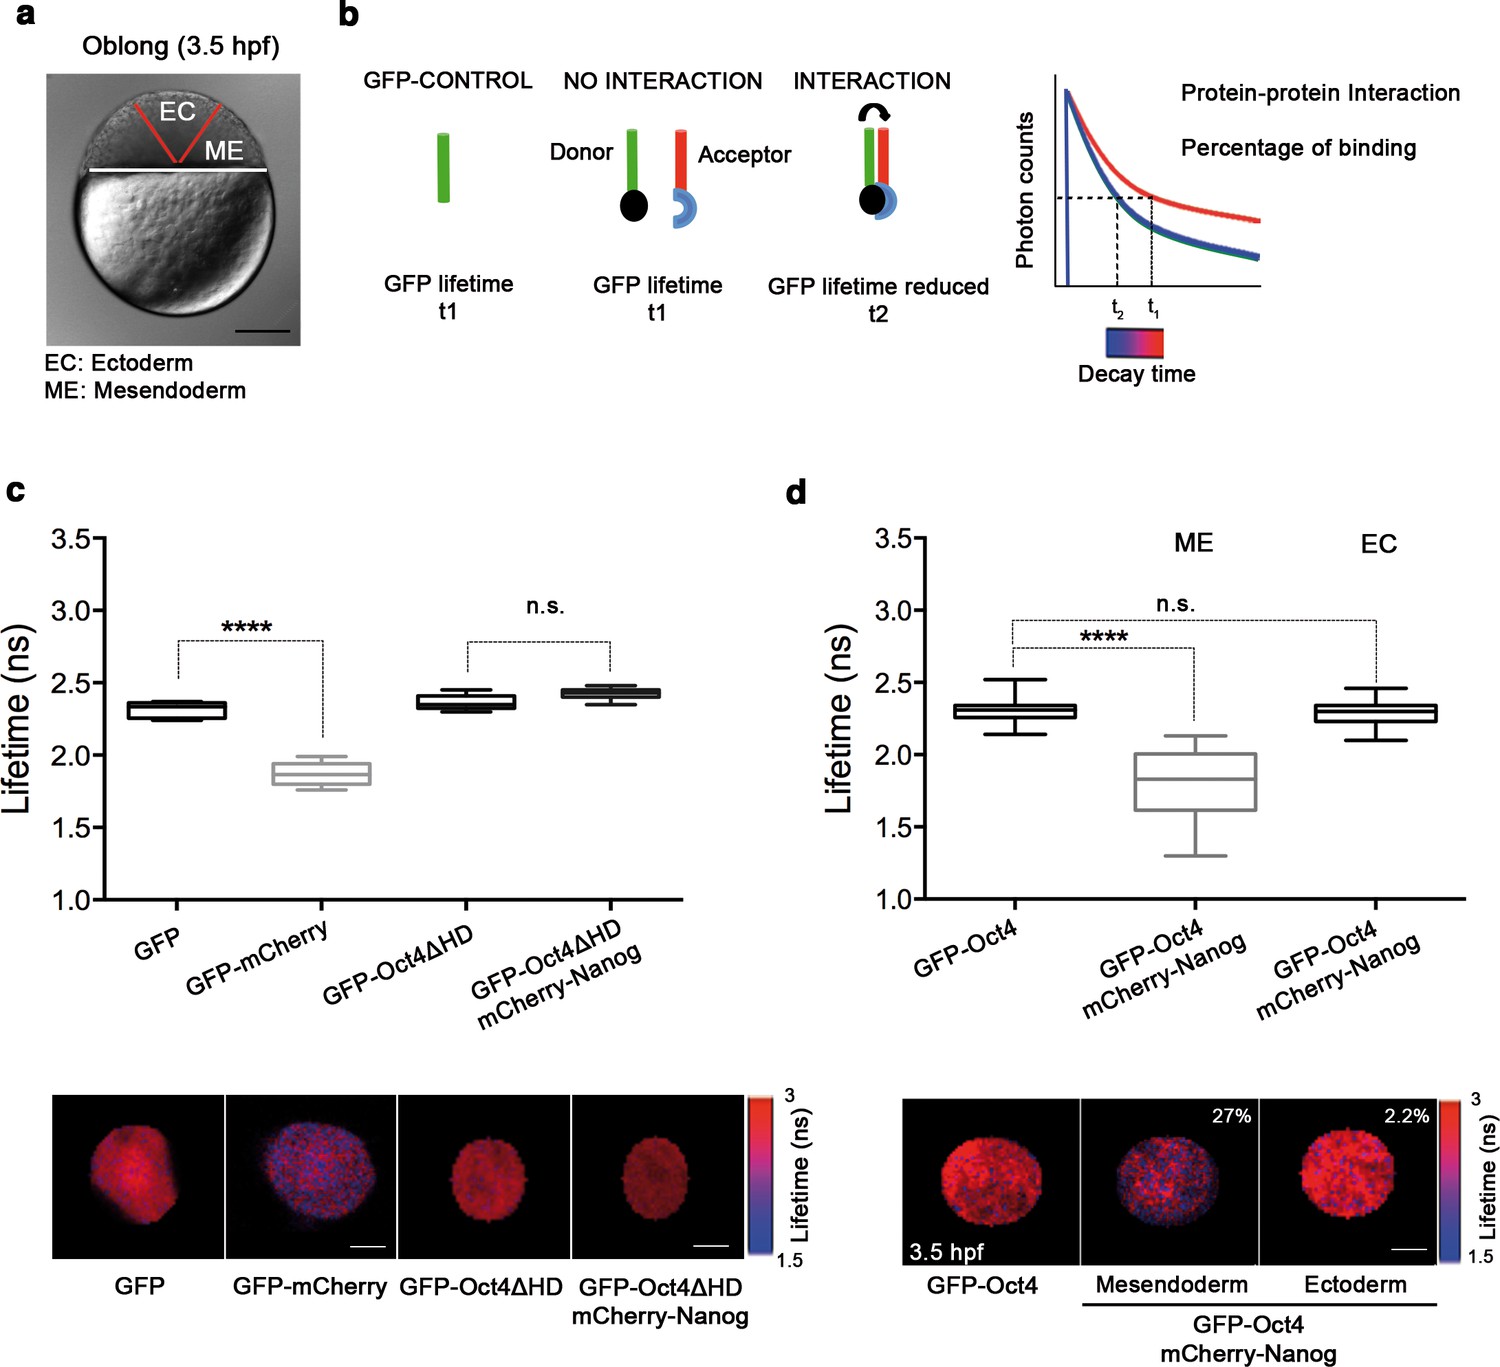
Oct4 and Nanog bind in mesendoderm of zebrafish blastula embryos.
(a) Schematic location of the presumptive mesendoderm (ME) and ectoderm (EC) in an embryo at oblong stage [3.5 hr post-fertilization (hpf)]. Scale bar: 200 µm. (b) Schematic diagram of FLIM-FRET (Fluorescence Lifetime Microscopy–Forster Resonance Energy Transfer). GFP lifetime (t1) of the donor is reduced if an acceptor (mCherry) is in close proximity (1–10 nm); this is the reduced lifetime (t2). If the acceptor is not in close proximity (>10 nm) to the donor, donor lifetime remains unchanged (t2 similar to t1). Lifetimes are measured with time-correlated single-photon counting. (c) Lifetime values and FLIM images of GFP-Oct4 alone and in the presence of a linked mCherry protein in single cells. Scale bar: 10 µm. In the same graph, lifetime values and FLIM images of GFP-Oct4ΔHD alone and co-expressing mCherry-Nanog in single nuclei. Scale bar: 5 µm. (d) Lifetime values and FLIM images of GFP-Oct4 lifetime alone and in the presence of mCherry-Nanog in the nucleus of individual cells from mesendoderm or ectoderm. Scale bar: 5 µm. The percentage of binding is indicated at the top right corner of the FLIM images. Values represent the median and quartile ranges of data from three to five independent experiments (n = 20–40 cell nuclei from 10 to 15 embryos; ****p<0.0001). n.s. over bars indicates non-significant differences. See also Figure 2—figure supplements 1–4, Figure 2—source data 1 and 2.
-
Figure 2—source data 1
Quantification of GFP-Oct4 and GFP-Nanog activity in mesendoderm and ectoderm of wt and morphant zebrafish embryos.
Diffusion parameters values were derived from analysis of FCS data with the ACFs fit by two-component anomalous diffusion model. D1, D2: Diffusion coefficients of the fast and slow diffusion components, respectively. F2: Slow component fraction. α1, α2: anomalous parameters of the fast and slow diffusion components, respectively. ME: mesendoderm. EC: ectoderm. Values represent mean ± SEM from three to five independent experiments (n represents the number of cell nuclei from 10 to 15 embryos; ****p<0.0001; ***p<0.001). Details of the MOs and FCS analyses are shown in Figure 2—figure supplements 1,3 and Material and methods.
- https://doi.org/10.7554/eLife.11475.009
-
Figure 2—source data 2
FCCS parameters of GFP-Nanog and mCherry-Oct4 in mesendoderm and ectoderm of blastula embryos (oblong stage; 3.5 hpf).
Diffusion parameters values were derived from analysis of FCCS data with the ACFs and CCF fit by two-component anomalous diffusion model. D1, D2: Diffusion coefficient of the fast and slow diffusion component, respectively. α1, α2: anomalous parameter of the fast and slow diffusion component, respectively. Kd: dissociation constant at equilibrium; values were obtained from the slopes of the fitted linear line when plotting the concentration of GFP-Nanog (CN) * concentration of mCherry-Oct4 (CO) versus the concentration of the proteins association (CNO). If the proteins are associated, there will be a linear line; in cases where no association exists, there is no linear relationship (N.L). Association: fraction of proteins diffusing together in the same complex. Details of the FCCS analysis are shown in Figure 2—figure supplement 4 and Materials and methods. ME: mesendoderm. EC: ectoderm. Values represent mean ± SEM from three to five independent experiments with n > 15.
- https://doi.org/10.7554/eLife.11475.010
Figure 2—figure supplement 1

GFP-Oct4 dynamics in blastula embryos.
(a) GFP-Oct4 expressed in the blastoderm at the blastula stage (oblong; 3.5 hpf). Ectoderm (EC) cells are traced by dextran red; non-labeled cells are mesendoderm (ME). Scale bar: 200 μm. (b) Cells from the blastoderm expressing GFP-Oct4. Staining as in a. Scale bar: 20 μm. (c) ACF of the intensity traces of GFP-Oct4 in EC and ME in wild-type embryos. The ACF were fit by two-component anomalous diffusion model. Curves are normalized to compare differences in protein activity. (d) Raw data of residuals from fit curves shown in c. (e) DNA-bound fraction derived from the previous ACFs. Values represent the mean ± SEM of data from three to five independent experiments (n > 60 cell nuclei from 10 to 15 embryos; ****p<0.0001). (f) ACF of the intensity traces of GFP-Oct4 in nanog morphant embryos. The ACF were fit by two-component anomalous diffusion model. Curves are normalized to compare differences in protein activity. (g) Raw data of residuals from fit curves shown in f. (h) DNA-bound fraction derived from the previous ACFs. Values represent the mean ± SEM of data from three to five independent experiments (n > 60 cell nuclei from 10 to 15 embryos; ***p<0.001). See also Figure 2—source data 1
Figure 2—figure supplement 2
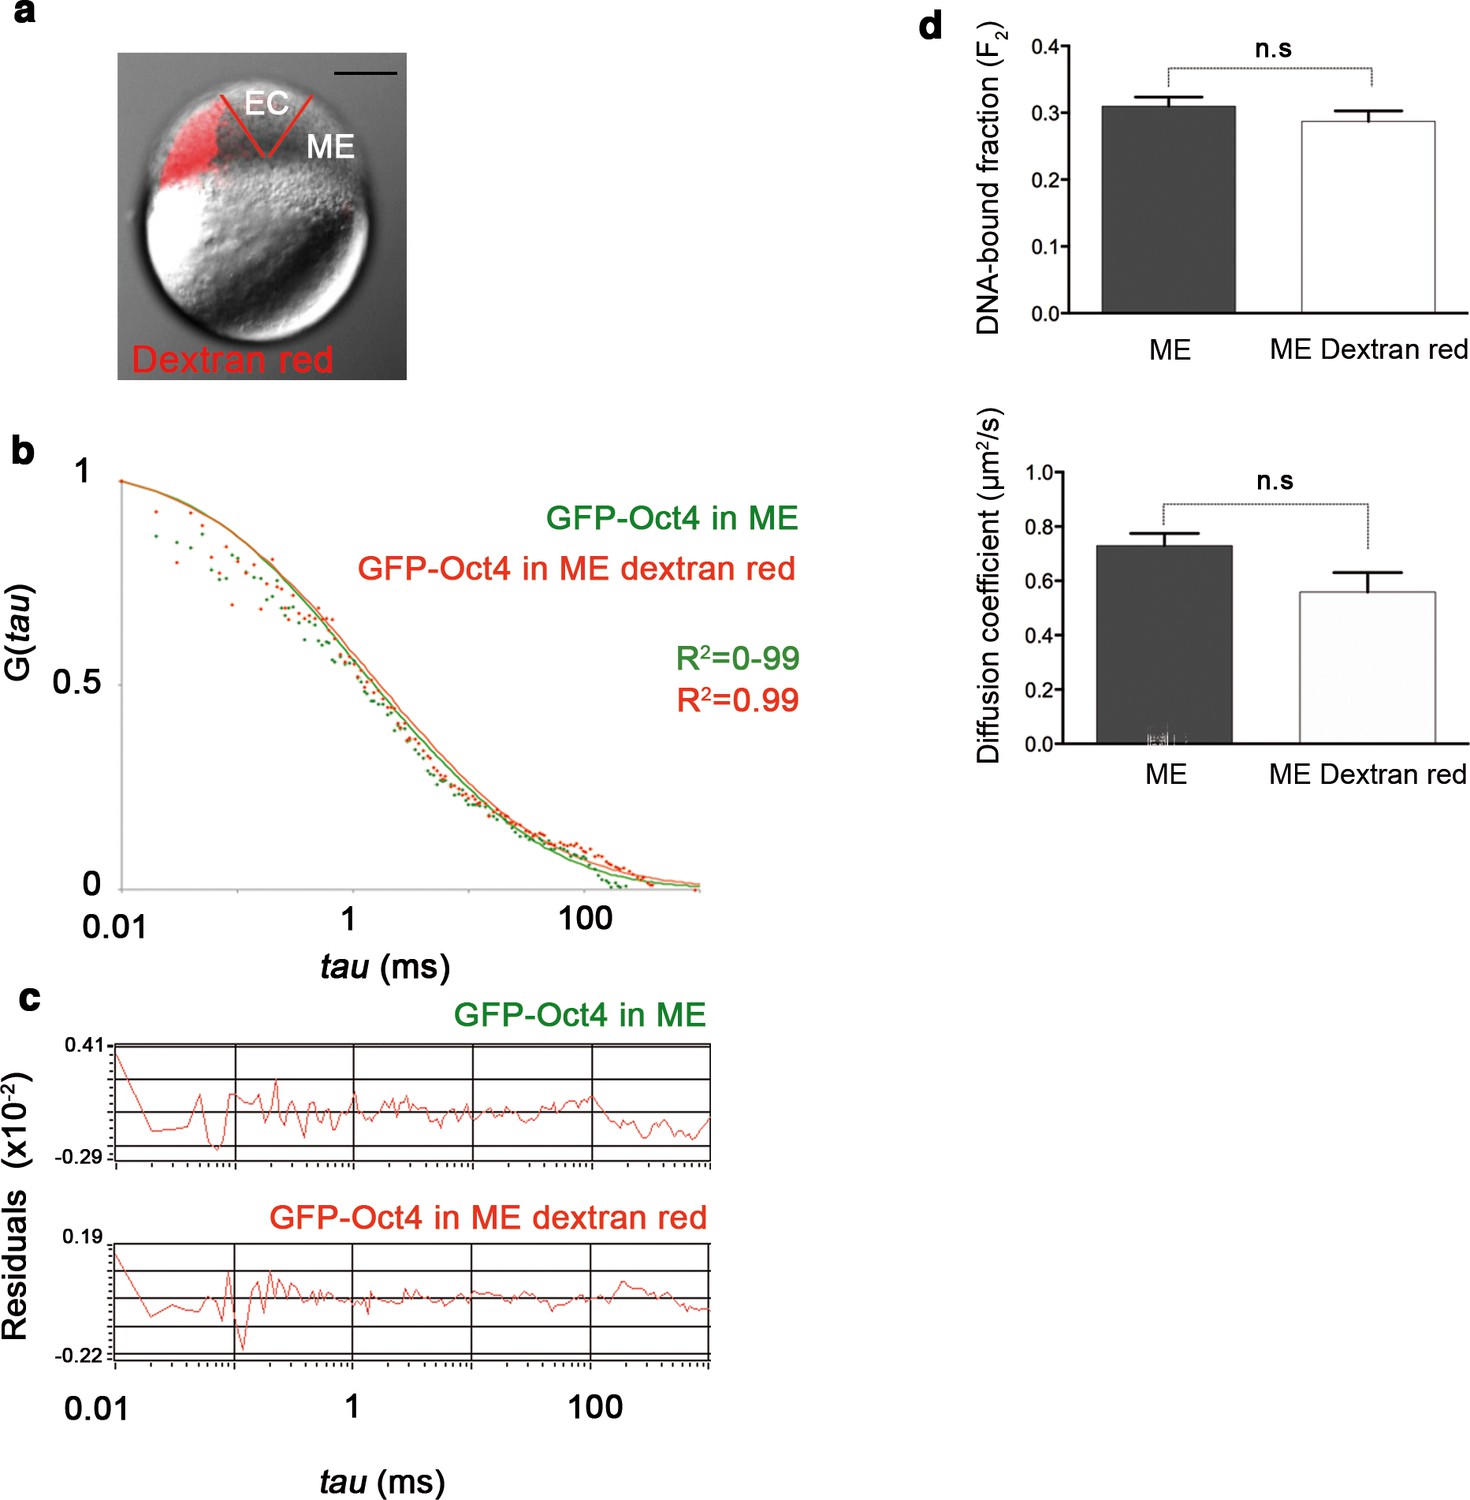
Dextran red does not interfere in the FCS measurements.
(a) Embryo (oblong stage; 3.5 hpf) showing mesendoderm (ME) labeled by dextran (red) leaving the ectoderm (EC) unlabeled. Scale bar: 200 µm. (b) ACF of the intensity traces of GFP-Oct4 in ME cells labeled or unlabeled. FCS data were fit by two-component anomalous diffusion model. (c) Raw data of residuals from fit curves shown in b. (d) DNA-bound fraction and diffusion coefficient derived from the FCS measurements in b. Values represent mean ± SEM of data from three independent experiments (n = 40–100 cell nuclei from 10 to 15 embryos). n.s. over bars indicates non-significant differences.
Figure 2—figure supplement 3
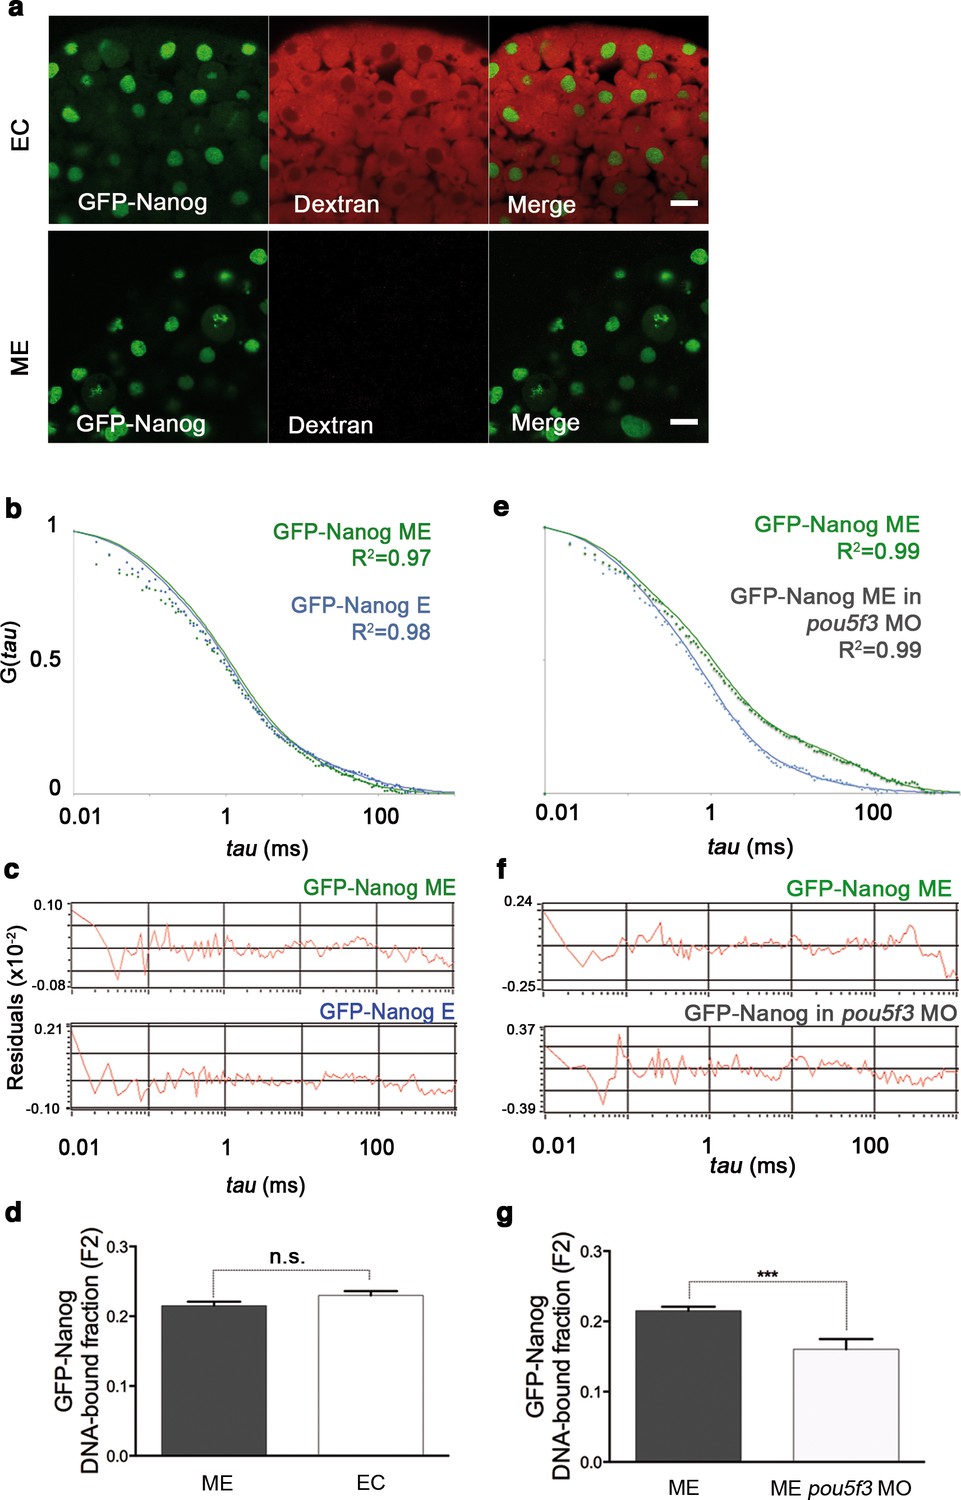
GFP-Nanog dynamics in blastula embryos.
(a) Cells from the blastoderm (oblong stage; 3.5 hpf) expressing GFP-Nanog. Ectoderm (EC) cells are positive for dextran red; mesendoderm (ME) cells are negative. Scale bar: 20 μm. (b) ACF of the intensity traces of GFP-Nanog in EC and ME in wild-type embryos. The ACF were fit by two-component anomalous diffusion model. Curves are normalized to compare differences in protein activity. (c) Raw data of residuals from fit curves shown in b. (d) DNA-bound fraction derived from the previous ACFs. Values represent the mean ± SEM of data from three to five independent experiments (n > 60 cell nuclei from 10 to 15 embryos; ****p<0.0001). (e) ACF of the intensity traces of GFP-Nanog in EC and ME in pou5f3 morphant embryos. The ACF were fit by two-component anomalous diffusion model. Curves are normalized to compare differences in protein activity. (f) Raw data of residuals from fit curves shown in e. (g) DNA-bound fraction derived from the previous ACFs. Values represent the mean ± SEM of data from three to five independent experiments (n > 60 cell nuclei from 10 to 15 embryos; ***p<0.001). See also Figure 2—source data 1.
Figure 2—figure supplement 4
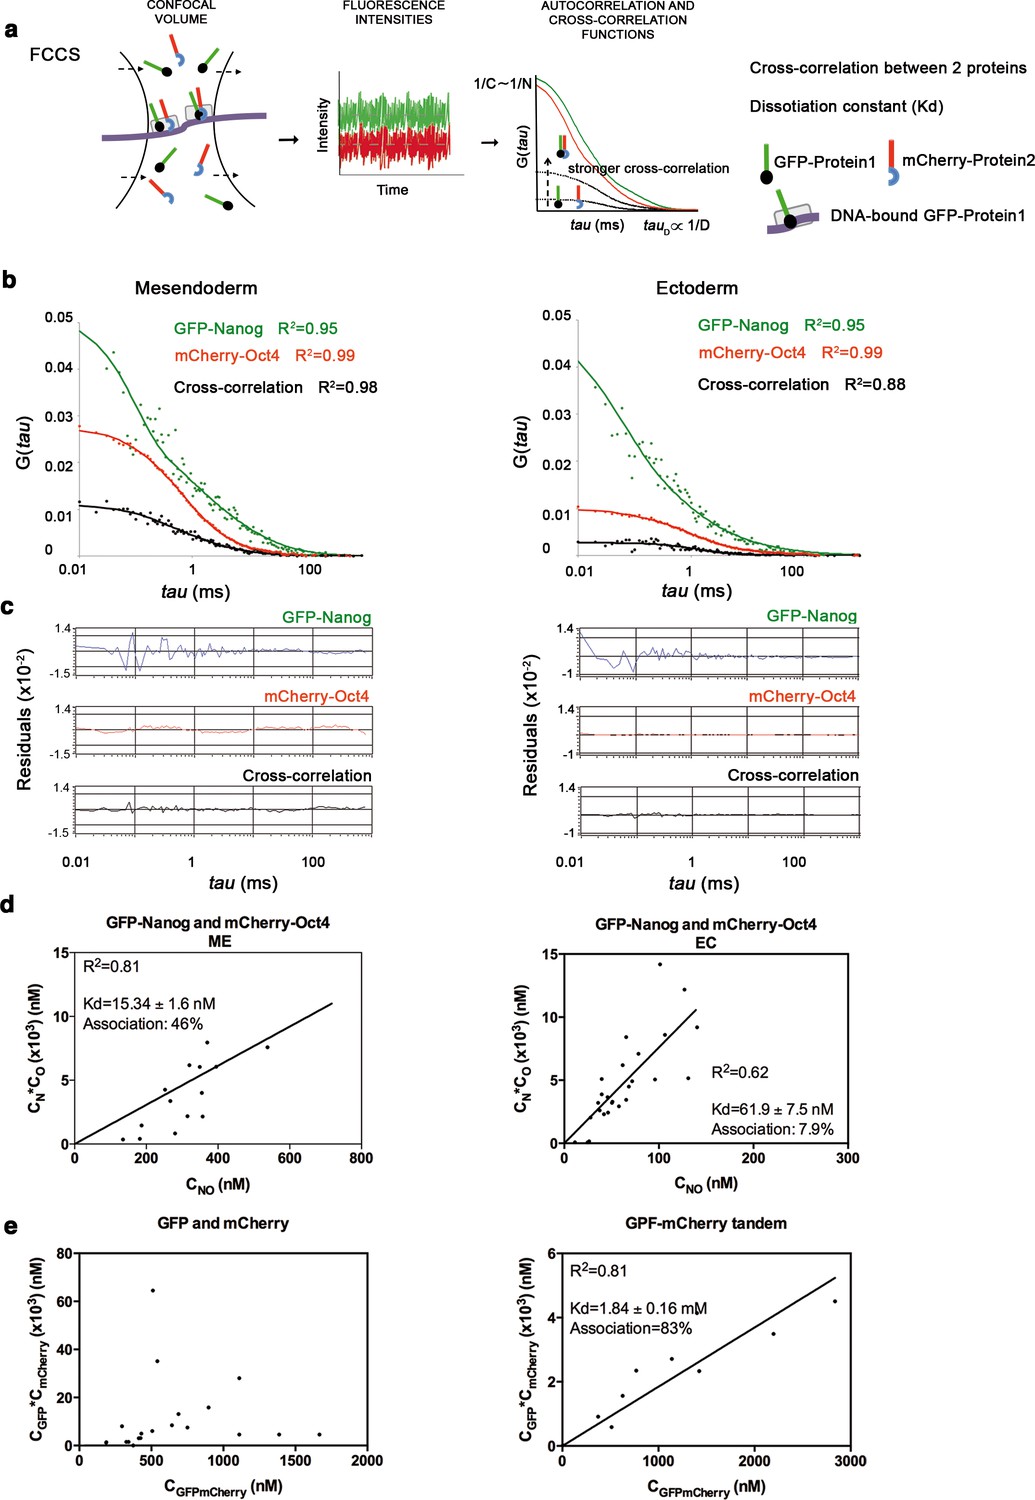
Oct4 and Nanog cross-correlate in mesendoderm of blastula embryos.
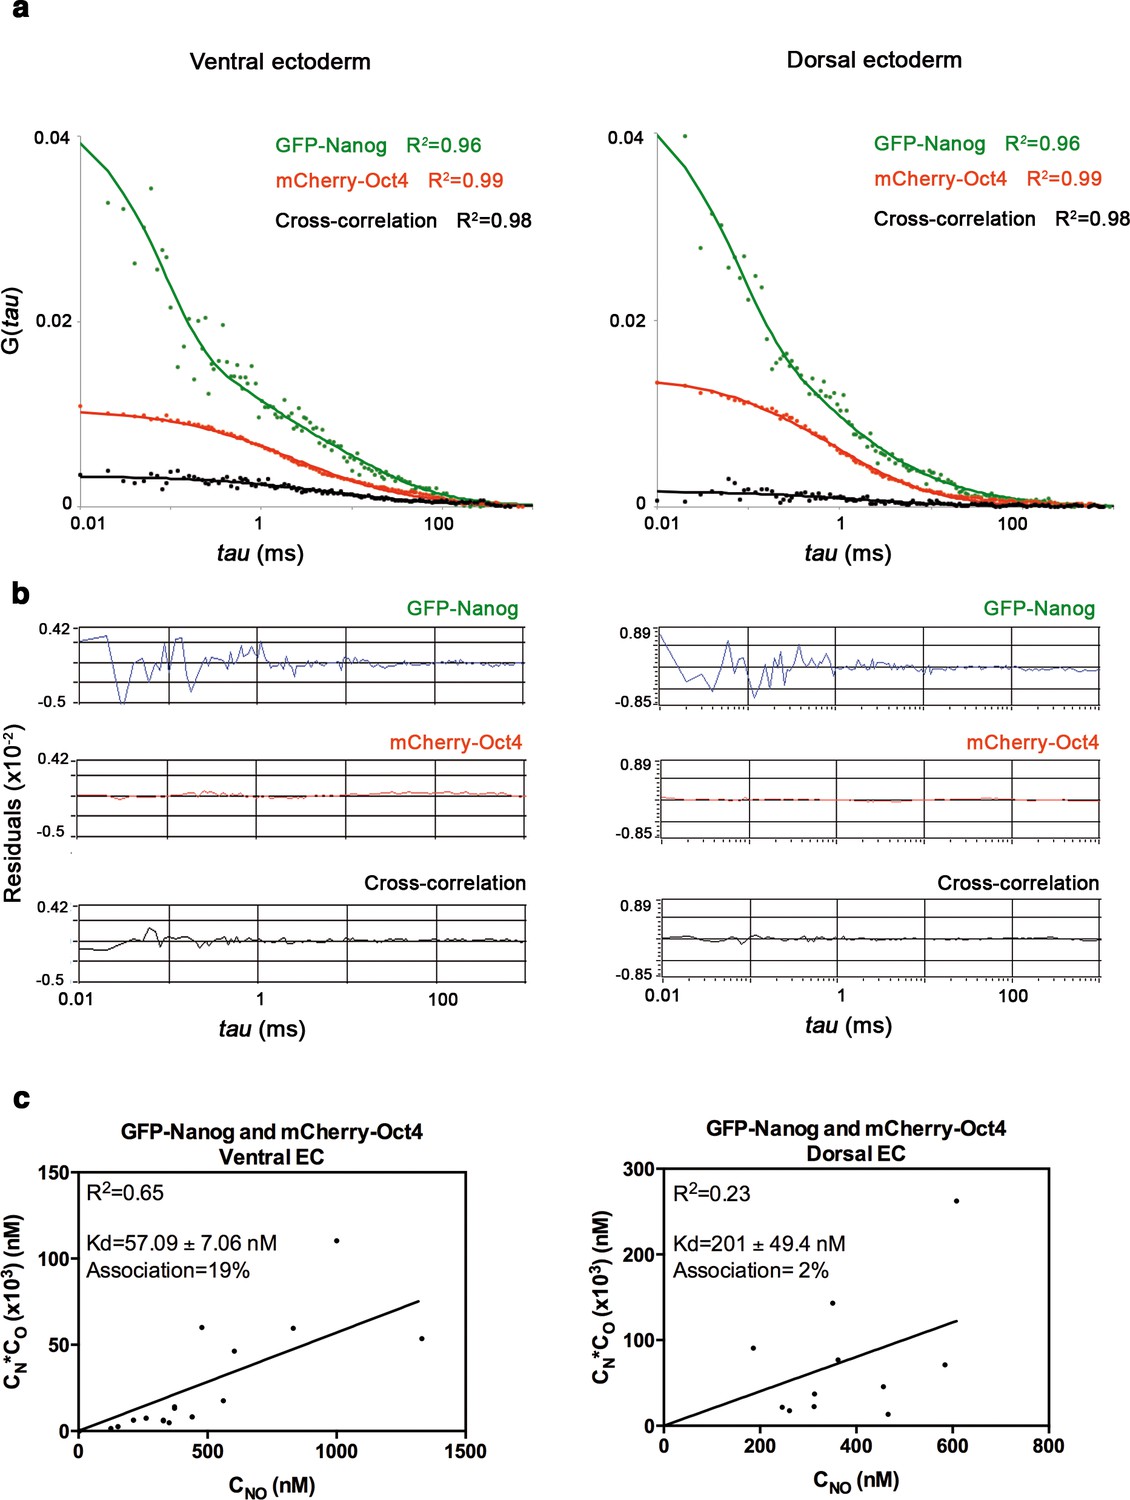
(a) Schematic diagram of a setup for fluorescence cross-correlation spectroscopy (FCCS). GFP- and mCherry-tagged nuclear proteins diffuse through a confocal volume (<1 μm3) within a single-cell nucleus and generate fluctuating fluorescence intensities. The autocorrelation functions (ACFs) and the cross-correlation function (CCF) of the fluctuations are fit to obtain the absolute protein concentration (C) and the diffusion coefficient (D), where N is the number of molecules. CCF is shown in black. (b) ACFs and CCFs of the intensity traces of GFP-Nanog co-expressed with mCherry-Oct4 in mesendoderm and ectodermal cells of blastula embryos (oblong stage; 3.5 hpf) fit by two-component anomalous diffusion model. (c) Raw data of residuals from fit curves shown in b. (d) Kd plots for GFP-Nanog and mCherry-Oct4 associations. Kd values were obtained from the slopes of the fitted linear line. If the proteins are associated, there will be a linear line when plotting the concentration of GFP-Nanog (CN) * concentration of mCherry-Oct4 (CO) versus the concentration of the protein association (CNO), since Kd represents the constant of the association at equilibrium. There is no linear relationship in cases where there is no association. (e) Kd plots for GFP co-expressed with mCherry protein (negative control) and GFP-mCherry linked protein (tandem; positive control). Values for GFP and mCherry proteins could not be linearly fitted. Association: fraction of proteins diffusing together in the same complex. See also Figure 2—source data 2.
Figure 3 with 2 supplements

Oct4 and Nanog complexes in the ventrolateral mesendoderm.
(a) wt embryo showing the ventral (V)–lateral (L)- and dorsal (D)-mesendoderm (ME) at the 50% epiboly [5.7 hr post-fertilization (hpf)] before commencement of involution. LiCl-dorsalized embryo at 5.7 hpf. Arrows show the dorsal organizer of the wt embryo and radialized dorsal structures along the germ ring of dorsalized embryos. Scale bar: 200 µm (b) Lifetime values and FLIM images of GFP-Oct4 lifetime alone and in the presence of mCherry-Nanog in the nuclei of individual cells measured at different locations within the mesendoderm. Values represent the median and quartile ranges of data from three to five independent experiments (n = 30–70 cell nuclei from 10 to 15 embryos; ****p<0.0001). The percentage of binding is indicated at the top right corner of the FLIM images. Scale bar: 5 µm. n.s. over bars indicates non-significant differences. See also Figure 3—figure supplements 1,2 and Figure 3—source data 1.
-
Figure 3—source data 1
FCCS parameters of GFP-Nanog and mCherry-Oct4 in mesendoderm and ectoderm of gastrula embryos (50% epiboly; 5.7 hpf).
Diffusion parameters were derived from analysis of FCCS data with the ACFs and CCF fit by two-component anomalous diffusion model. D1, D2: Diffusion coefficients of the fast and slow diffusion components, respectively. α1, α2: anomalous parameters of the fast and slow diffusion components, respectively. Kd: dissociation constant at equilibrium; values were obtained from the slopes of the fitted linear line when plotting the concentration of GFP-Nanog (CN) * concentration of mCherry-Oct4 (CO) versus the concentration of the proteins association (CNO). If the proteins are associated, there will be a linear line; in cases where no association exists, there is no linear relationship. Association: fraction of proteins diffusing together in the same complex. Details of the FCCS analysis are explained in the Materials and methods. V-ME: ventral mesendoderm; ME: lateral mesendoderm; D-ME: dorsal mesendoderm; V-EC: ventral ectoderm; D-EC: dorsal ectoderm. Values represent mean ± SEM from three to five independent experiments with n > 15.
- https://doi.org/10.7554/eLife.11475.016
Figure 3—figure supplement 1
Nanog and Oct4 cross-correlation in the ectoderm of gastrula embryos.
(a) ACFs and CCFs of the intensity traces of GFP-Nanog co-expressed with mCherry-Oct4 in ectoderm (EC) cells of gastrula (50% epiboly; 5.7 hpf) embryos fit by two-component anomalous diffusion model. (b) Raw data of residuals from fit curves shown in a. (c) Kd plots for GFP-Nanog and mCherry-Oct4 associations. Kd values were obtained from the slopes of the fitted linear line. If the proteins are associated, there will be a linear line when plotting the concentration of GFP-Nanog (CN) * concentration of mCherry-Oct4 (CO) versus the concentration of the protein association (CNO), since Kd represents the constant of the association at equilibrium. There is no linear relationship in cases where there is no association. Association: fraction of proteins diffusing together in the same complex. See also Figure 3—source data 1
Figure 3—figure supplement 2
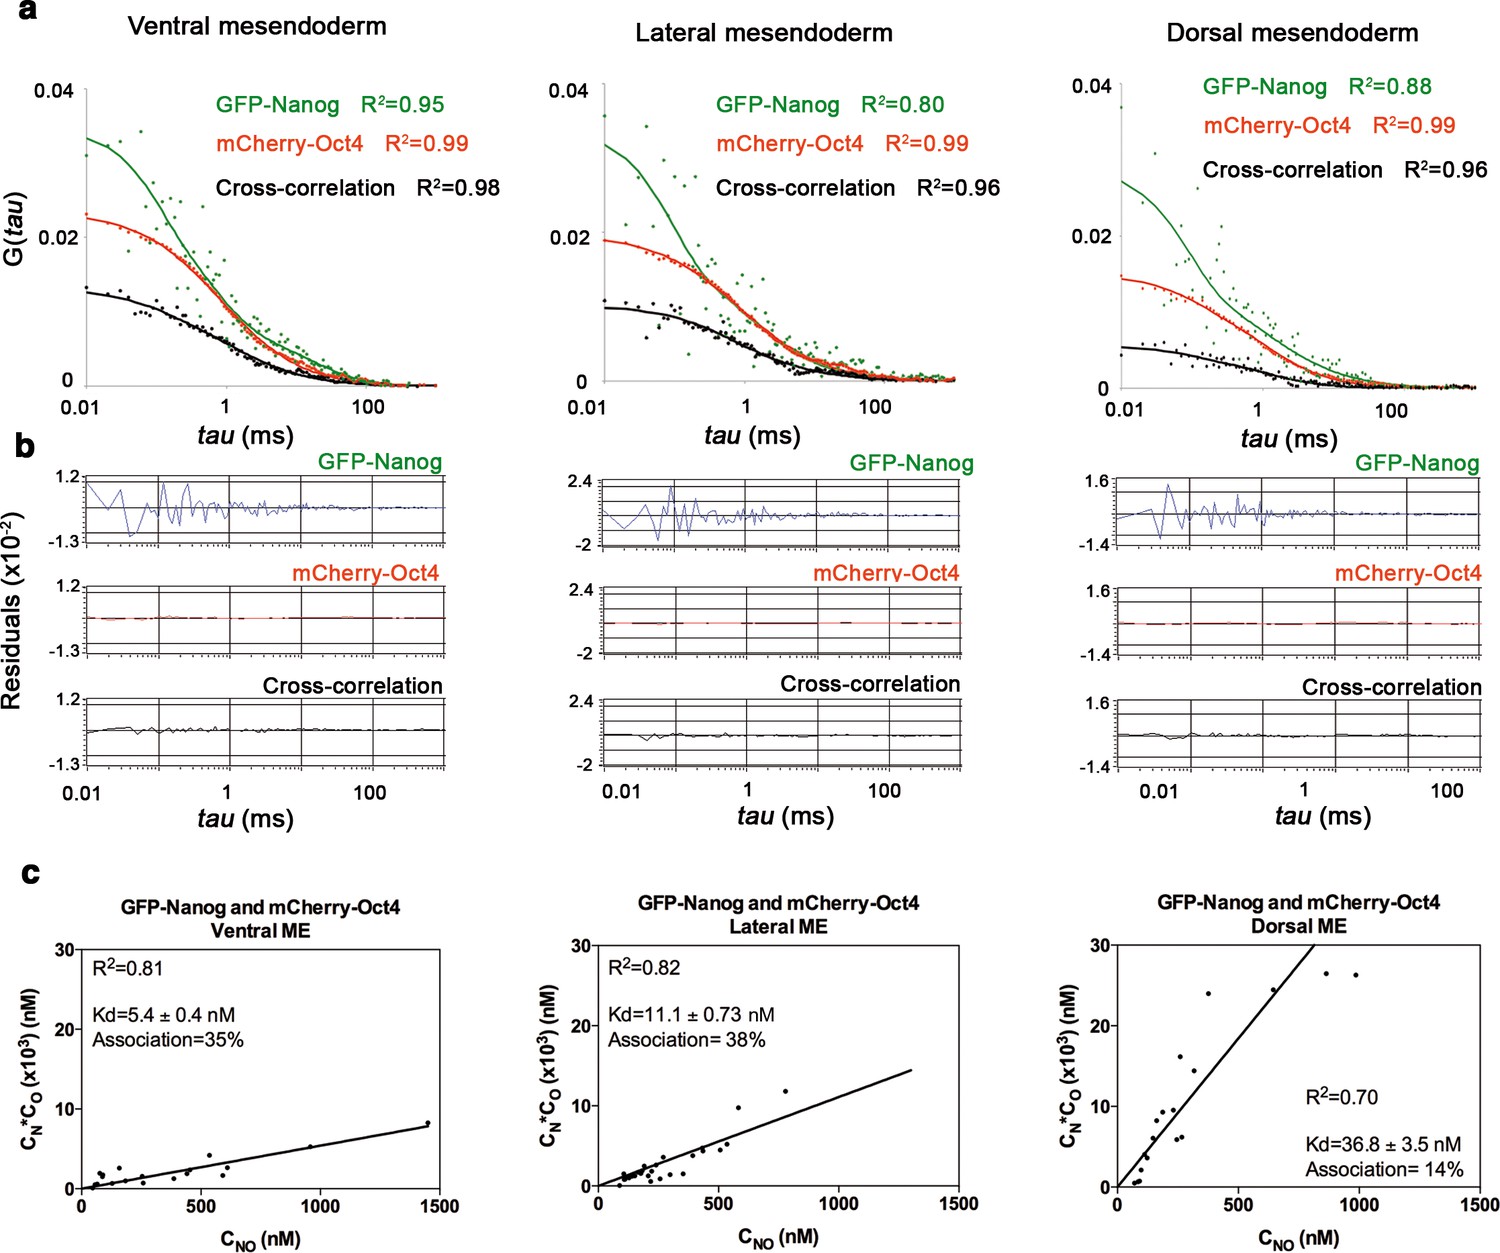
Nanog and Oct4 cross-correlation in ventrolateral mesendoderm of gastrula embryos.
(a) ACFs and CCFs of the intensity traces of GFP-Nanog co-expressed with mCherry-Oct4 in ventral, lateral and dorsal mesendoderm (ME) cells of gastrula embryos (50% epiboly; 5.7 hpf) fit by two-component anomalous diffusion model. (b) Raw data of residuals from fit curves shown in a. (c) Kd plots for GFP-Nanog and mCherry-Oct4 associations. Kd values were obtained from the slopes of the fitted linear line. If the proteins are associated, there will be a linear line when plotting the concentration of GFP-Nanog (CN) * concentration of mCherry-Oct4 (CO) versus the concentration of the protein association (CNO), since Kd represents the constant of the association at equilibrium. There is no linear relationship in cases where there is no association. Association: fraction of proteins diffusing together in the same complex. See also Figure 3—source data 1.
Figure 4 with 1 supplement
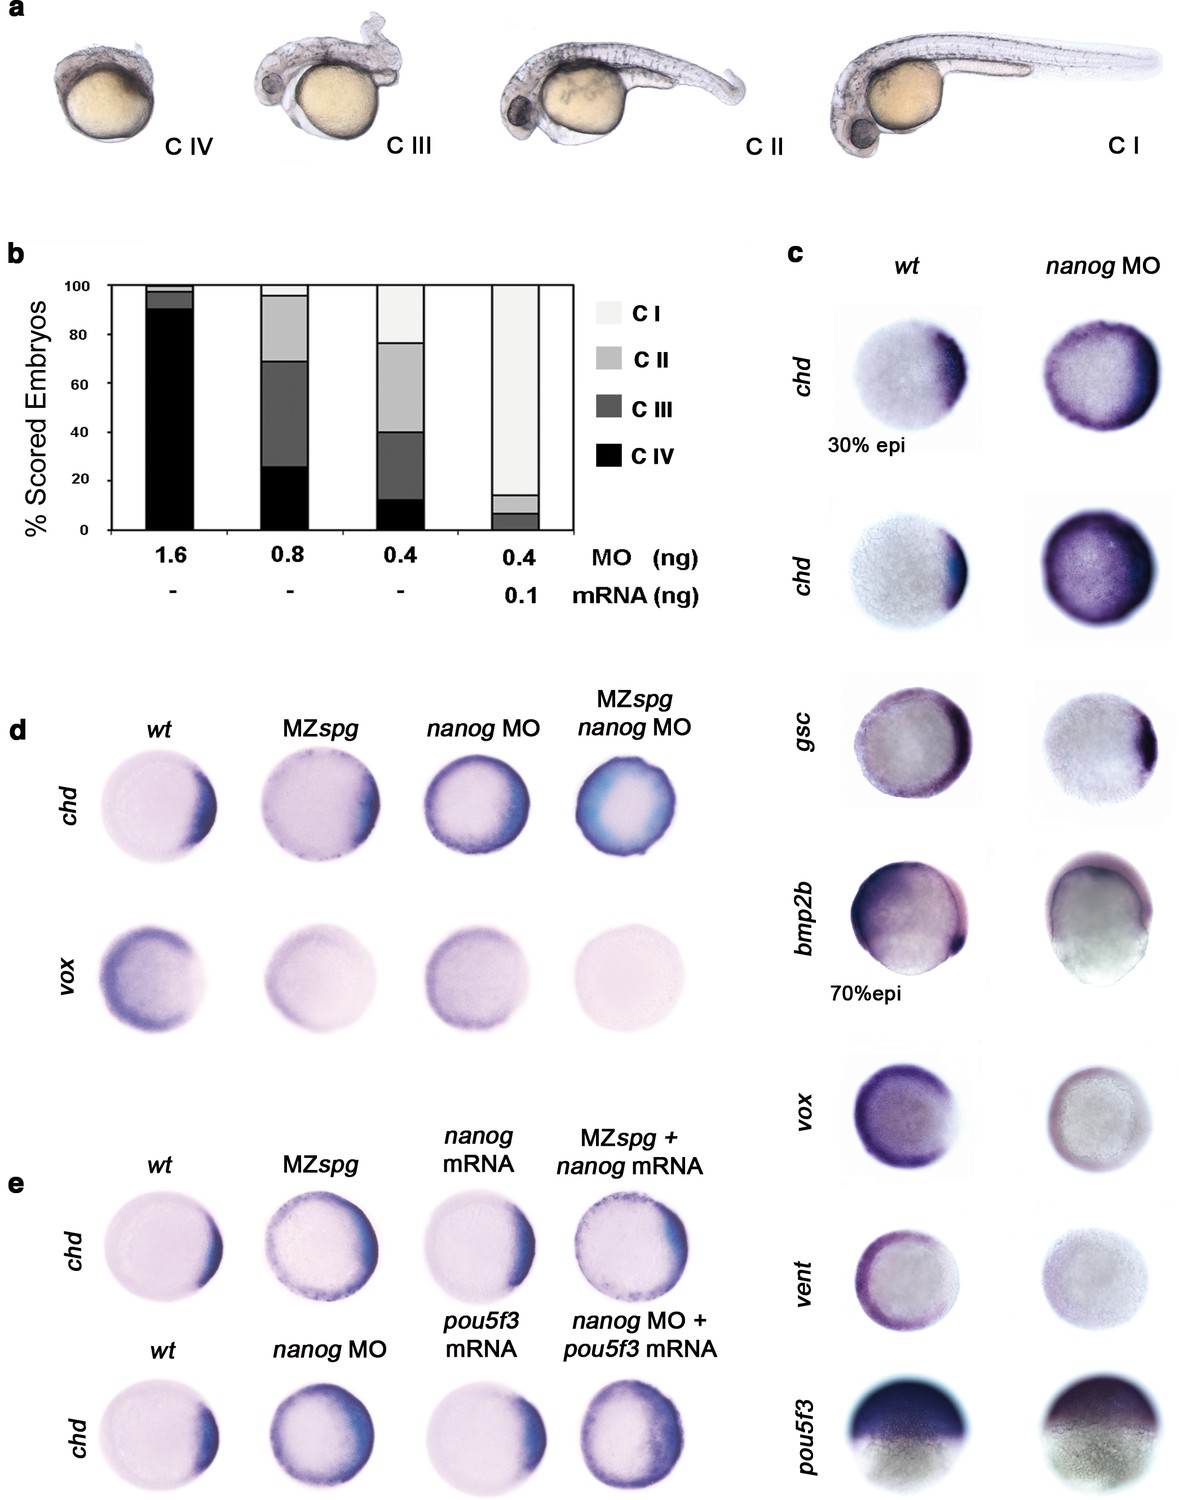
Pou5f3 and Nanog promote ventral fate.
(a) nanog MO-injected larvae show severely affected (Class (C) IV), less-severely affected (C III), mildly affected (C II) and least affected (C I) phenotypes. (b) Relative percentages of C I, C II, C III and C IV larvae according to dose of nanog MO injected (1.6 ng of nanog MO injection, n = 167; 0.8 ng of nanog MO injection, n = 186; 0.4 ng of nanog MO injection, n = 143). Co-injection of nanog MO (0.4 ng) with nanog* mRNA (0.1 ng) leads to over 80% wt-like larvae as opposed to 20% wt-like larvae in its absence (n = 126). (c–e) Embryos are at 50%-epiboly except where indicated. Embryos are in top views except lateral views for bmp2b-, oct4- and sox17-stained embryos. Dorsal is to the right-hand side. Markers were analysed following injection of 0.8 ng of nanog MO at the 1-cell stage. (c) chd expression in the dorsal margin is expanded ventrally in 30%-epiboly nanog morphants relative to wt embryos (86%, n = 40), and is uniformly expressed in the blastoderm of nanog morphants at 50%-epiboly relative to wt embryos (94%, n = 66). gsc expression in the prospective shield is expanded ventrally within the germ ring in nanog morphants relative to wt embryos at the early gastrula stage (71%, n = 47). bmp2b expression in the ventral ectoderm and organizer is markedly reduced in nanog morphants relative to wt embryos at mid-gastrulation (96%, n = 45). Expression of vox, a BMP target, is greatly diminished in nanog morphants relative to wt embryos (86%, n = 68). Expression of vent in the ventral margin is nearly absent in nanog morphants relative to wt embryos (95%, n = 56). At the early-gastrula stage, pou5f3 expression in the blastoderm is reduced in nanog morphants compared to wt embryos (97%, n = 44). (d) Effect of MZspg, nanog MO and MZspg/nanog MO on the expression of chd and vox. chd expression in the organizer of wt embryos (100%, n = 92) is ventrally expanded in MZspg embryos (98%, n = 75) and nanog morphants (90%, n = 97). In nanog MO-injected MZspg embryos, chd expression is further expanded in the entire blastoderm (92%, n = 62). vox expression in the ventral margin of wt embryos (100%, n = 96) is markedly reduced in MZspg embryos (97%, n = 60) and nanog morphants (88%, n = 84). In nanog MO-injected MZspg embryos, vox expression is completely lost (94%, n = 58). (e) Effect of oct4 mRNA in nanog MO, and nanog mRNA in MZspg mutant on chd expression. chd expression is ventrally expanded in MZspg embryos (98%, n = 75) relative to wt embryos (100%, n = 92). nanog mRNA cannot cause chd expansion when injected into wt embryos (93%, n = 65) and cannot rescue chd ventral expansion when injected into MZspg embryos (94%, n = 52). chd expression is ventrally expanded in nanog morphants (90%, n = 97) relative to wt embryos (100%, n = 92). Pou5f3 mRNA cannot cause chd expansion when injected into wt embryos (92%, n = 67) and cannot rescue chd ventral expansion caused by nanog depletion when co-injected with nanog MO (88%, n = 64). Data are from three to five independent experiments (n = 40–150). See also Figure 4—figure supplement 1.
Figure 4—figure supplement 1
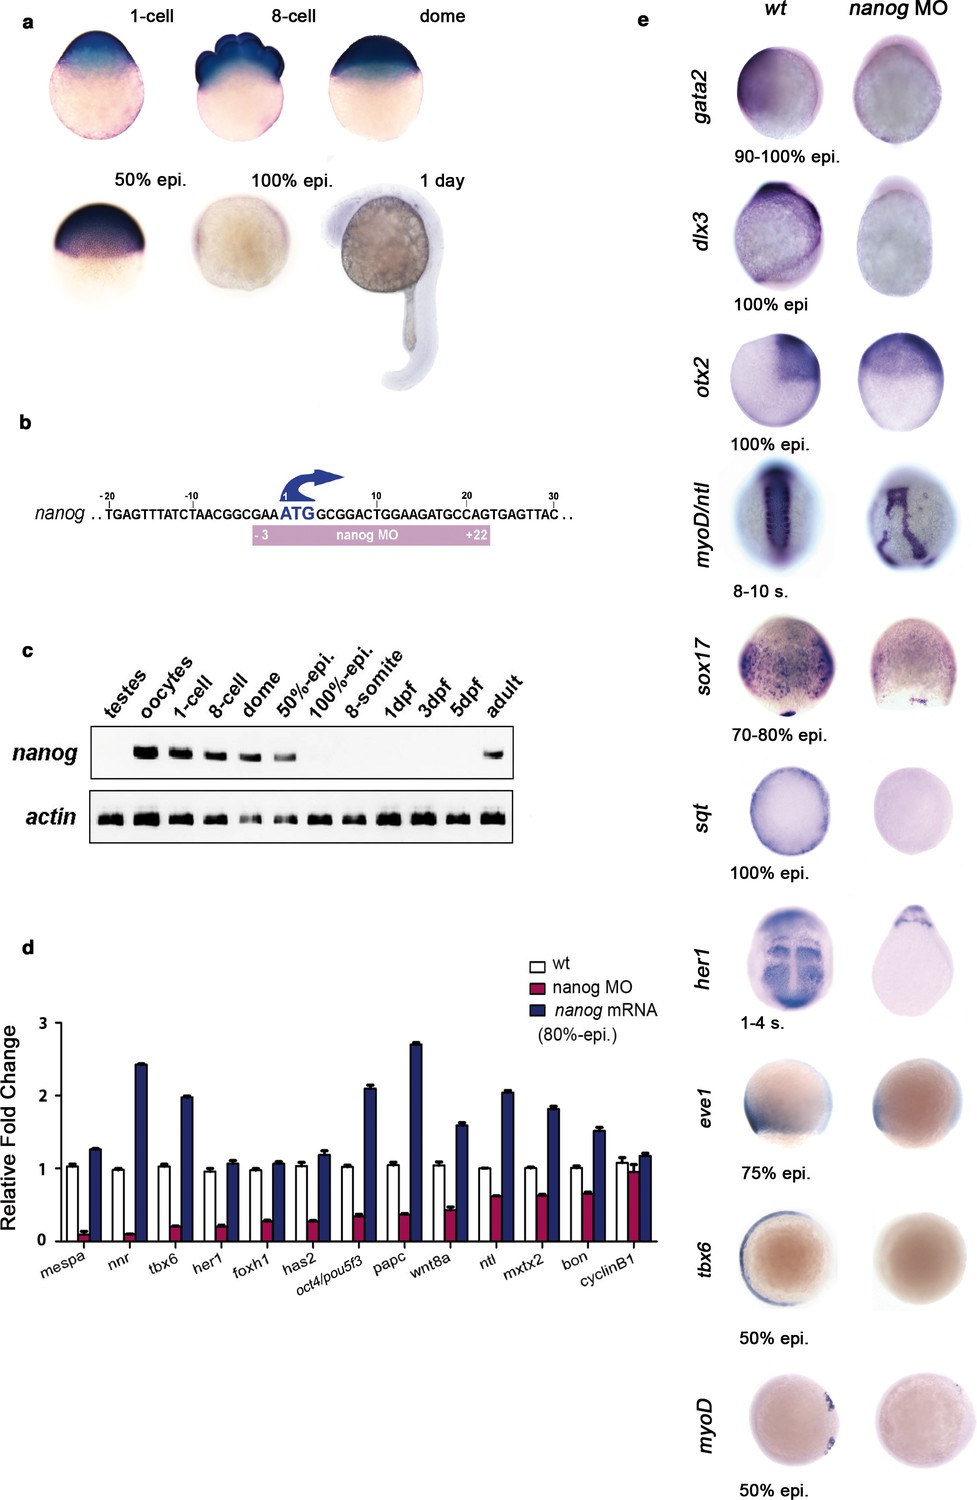
Nanog controls dorsoventral (DV) patterning.
(a) Maternal nanog mRNA is ubiquitously expressed in each blastomere of the eight-cell stage embryo. After mid-blastula transition, nanog expression is uniform in the blastoderm at the dome stage. At 50% epiboly, nanog mRNA is detected in all cells of the blastoderm. nanog mRNA accumulation is minimal by 100% epiboly. At 1 day, nanog transcripts are no longer detected. (b) Position of the nanog ATG-blocking morpholino relative to the translation initiation start of the zebrafish nanog allele. (c) RT-PCR analysis shows that, relative to actin, nanog expression in the developing embryo lasts until the onset of neurulation at early gastrulation, with high maternal contribution in oocytes. (d) qRT-PCR analysis reveals that nanog depletion or overexpression differentially affects the transcription of selected marker genes. Values represent mean ± SE of data from three independent experiments; p<0.01 except for cyclinB1. (e) nanog morphants, relative to wt embryos, lack non-neural ectoderm, as documented by the absence of gata2 expression at the end of gastrulation (88%, n = 52). Similarly, expression of dlx3 is lost in nanog morphants relative to wt embryos (85%, n = 48). Expression of the forebrain–midbrain marker otx2 is radialized in nanog morphants at 100% epiboly relative to wt embryos (95%, n = 41). ntl expression in the dorsal midline and myoD in the somites are mis-localized and absent, respectively, in nanog morphants relative to wt embryos at the 8–10 somite stage (97%, n = 52). The endoderm marker sox17 is dramatically reduced in nanog morphants relative to wt embryos at the mid-gastrula stage (92%, n = 65). sqt expression in the blastoderm margin at 30% epiboly is markedly reduced in nanog morphants relative to wt embryos (94%, n = 39). Presumptive segmental plate expression of her1 at the 1–4 somite stage is lost in nanog morphants relative to wt embryos (95%, n = 45). The ventrolateral mesoderm markers eve1 and tbx6 are reduced and absent, respectively, in nanog morphants relative to wt at 50% epiboly (97%, n = 25; 100%, n = 25).
Figure 5 with 2 supplements
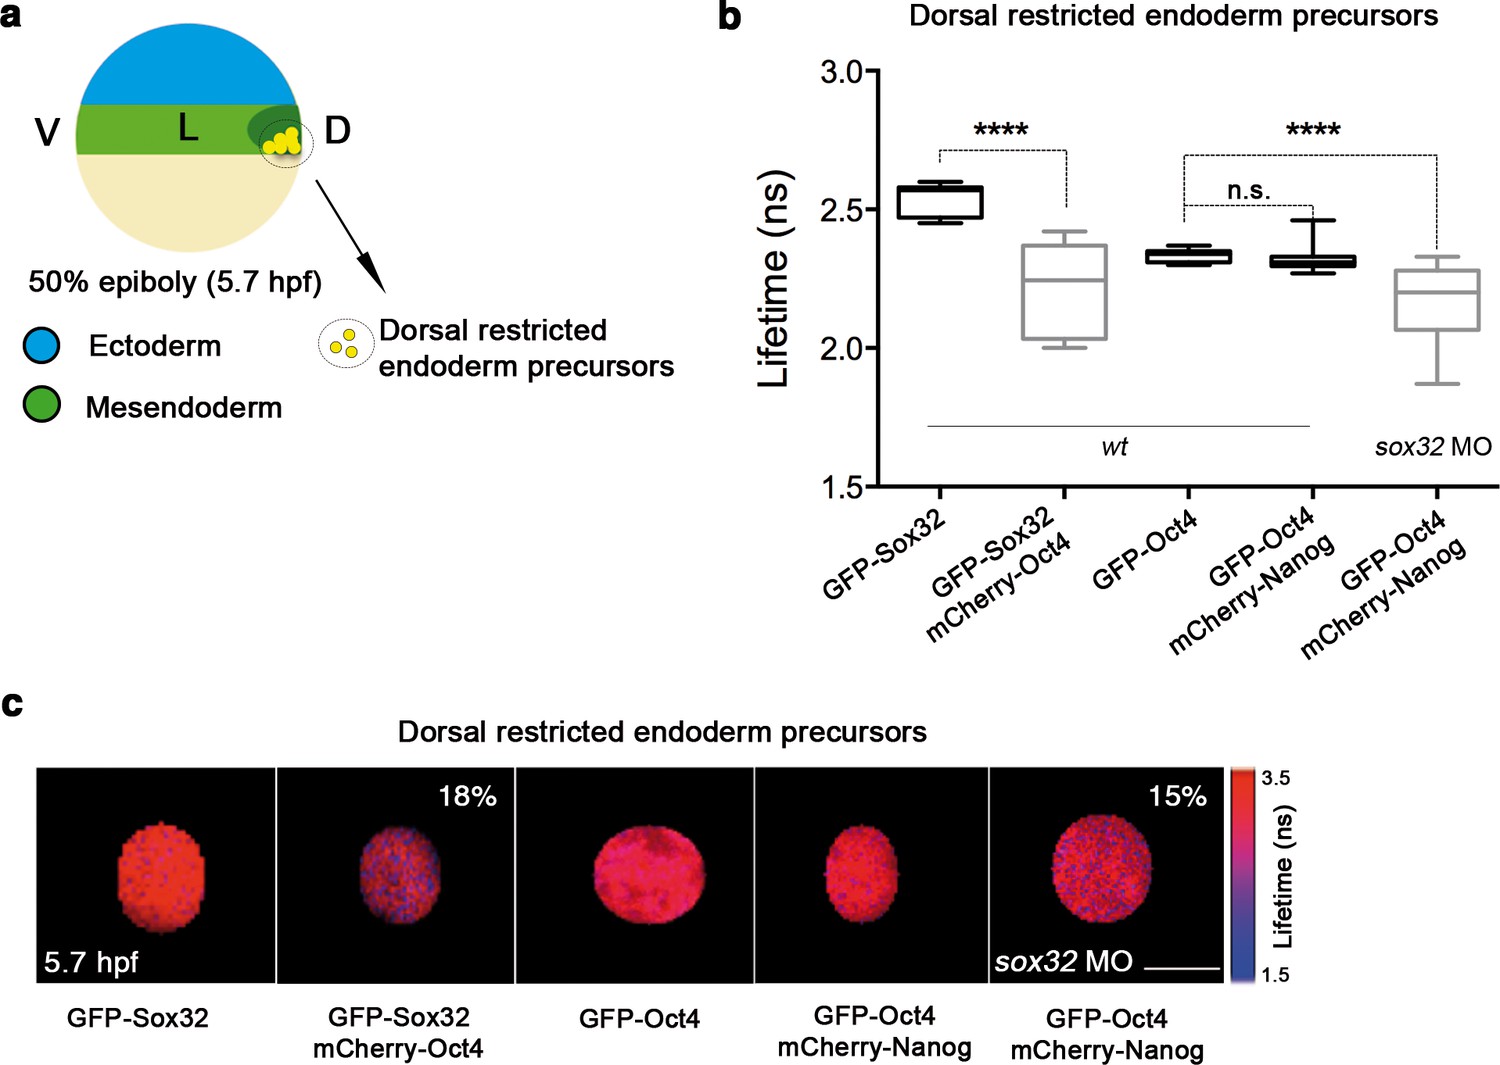
Sox32 competes with Nanog for Oct4 binding at dorsal endoderm of gastrula embryos.
(a) The schematic shows the main germ layers of the embryo at 50% epiboly (5.7 hpf) with ectoderm in blue and mesendoderm in green. The dorsal-restricted endoderm precursors are shown in yellow. (b, c) Lifetime values (b) and FLIM images (c) of GFP-Sox32 and GFP-Oct4 alone and in the presence of mCherry-Oct4 and mCherry-Nanog, respectively, in the nuclei of individual cells of dorsal endoderm precursors. Scale bar: 5 µm values represent the median and quartile ranges of data from three to five independent experiments (n = 20–30 cell nuclei from 10 embryos; ****p<0.0001). See also Figure 5—figure supplement 2, Figure 5—source data 1.
-
Figure 5—source data 1
FCCS parameters of GFP-Sox32 and mCherry-Nanog in endoderm of gastrula embryos (50% epiboly; 5.7 hpf).
Diffusion parameters were derived from analysis of FCCS data with the ACFs and CCF fit by two-component anomalous diffusion model. D1, D2: Diffusion coefficients of the fast and slow diffusion components, respectively. α1, α2: anomalous parameters of the fast and slow diffusion components, respectively. Kd: dissociation constant at equilibrium; values were obtained from the slopes of the fitted linear line when plotting the concentration of GFP-Sox32 (CS) * concentration of mCherry-Nanog (CN) versus the concentration of the proteins association (CSN). If the proteins are associated, there will be a linear line; in cases where no association exists, there is no linear relationship. Association: fraction of proteins diffusing together in the same complex. Details of the FCCS analysis are explained in the Materials and methods. D-E: dorsal endoderm; V-E: ventral endoderm; Values represent mean ± SEM from three to five independent experiments with n > 15.
- https://doi.org/10.7554/eLife.11475.022
Figure 5—figure supplement 1
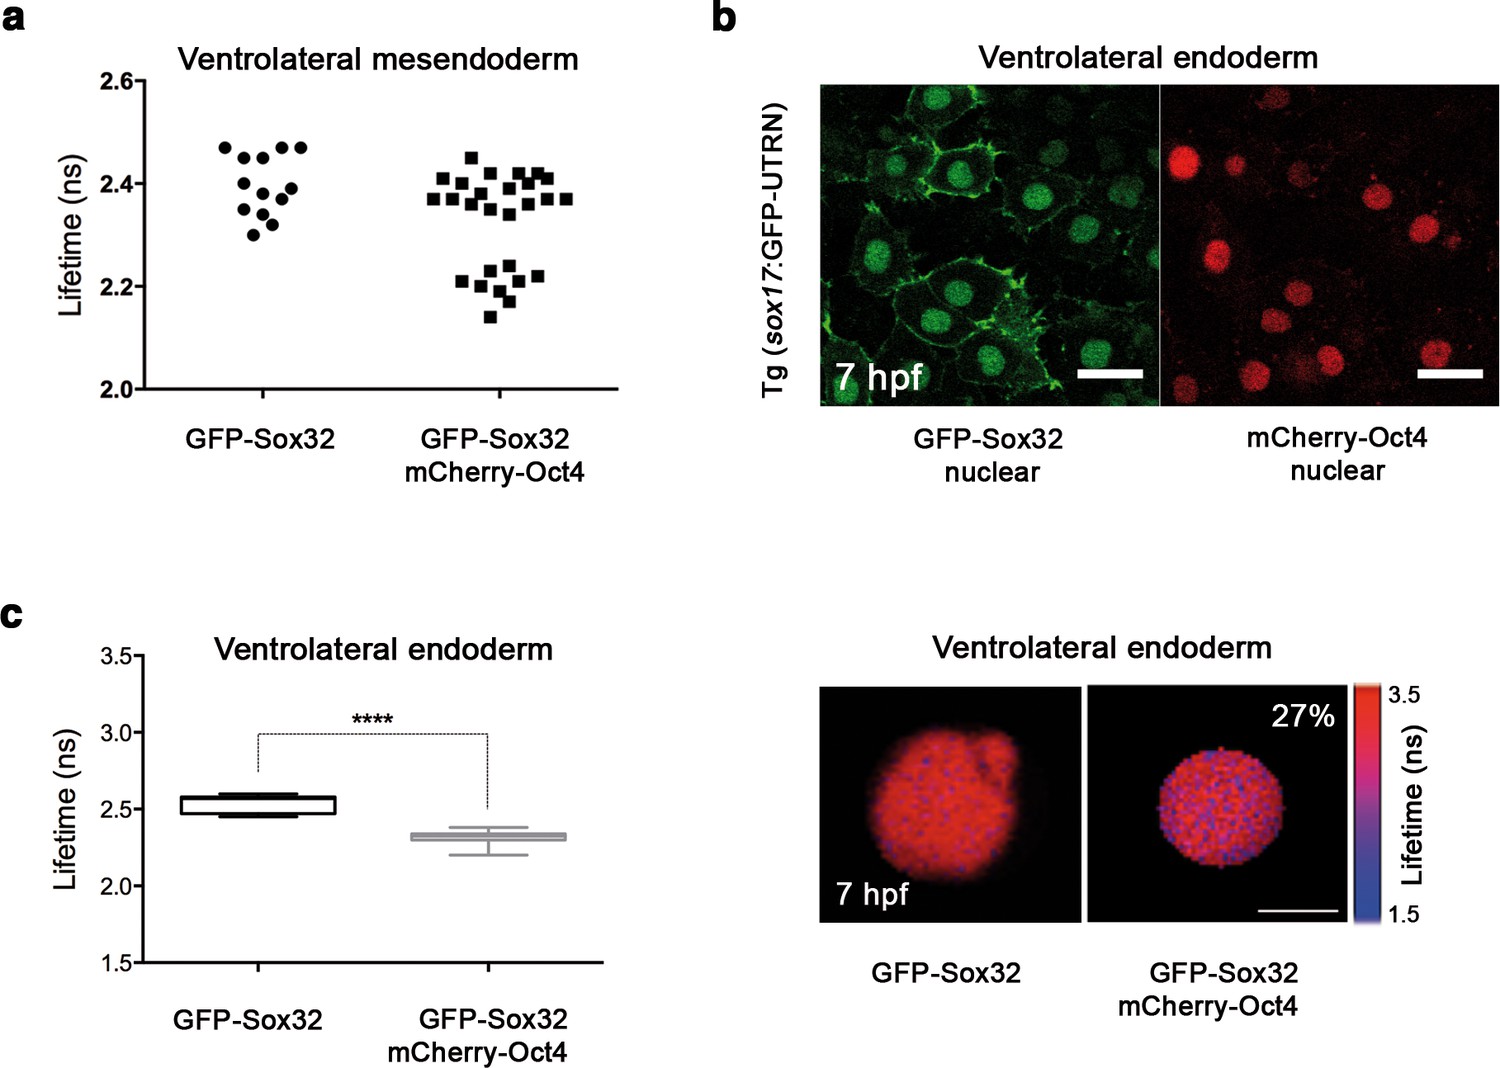
Sox32 binds Oct4 in ventrolateral endoderm.
Lifetime values of GFP-Sox32 lifetime alone and co-expressed with mCherry-Oct4 in the nuclei of individual cells from the row next to the margin in ventrolateral mesendoderm at 50% epiboly (5.7 hpf) before involution starts. Those showing a decrease in the lifetime are endoderm precursors and those with similar lifetime are mesoderm precursors. (b) GFP-Sox32 and mCherry-Oct4 co-expressed in Tg(sox17:GFP-UTRN) embryos at 60% epiboly (7 hpf). Scale bar: 20 μm. (c) Lifetime values and FLIM images of GFP-Sox32 lifetime alone and co-expressed with mCherry-Oct4 in the nuclei of individual cells in ventrolateral endoderm at 60% epiboly (7 hpf). The percentage of binding is indicated at the top right corner of the FLIM image. Values represent the median and quartile ranges of data from three independent experiments (n = 20–30 cell nuclei from 10 embryos; ****p<0.0001). Scale bar: 5 μm.
Figure 5—figure supplement 2

Nanog and Sox32 interact in endoderm.
(a, b) ACFs and CCFs of the intensity traces of GFP-Sox32 co-expressed with mCherry-Nanog in (a) the dorsal endoderm precursors at 50% epiboly (5.7 hpf) and (b) in ventrolateral endoderm cells in Tg(sox17:GFP-UTRN) embryos at 60% epiboly (7 hpf) fit by two-component anomalous diffusion model. (c, d) Raw data of residuals from fit curves shown in a, b, respectively. (e) Kd plots for GFP-Sox32 and mCherry-Nanog associations. Kd values were obtained from the slopes of the fitted linear line. If the proteins are associated, there will be a linear line when plotting the concentration of GFP-Sox32 (CS) * concentration of mCherry-Nanog (CN) versus the concentration of the protein association (CSN), since Kd represents the constant of the association at equilibrium. There is no linear relationship in cases where there is no association. Association: fraction of proteins diffusing together in the same complex. (f) Lifetime values of GFP-Sox32 lifetime alone and co-expressed with mCherry-Nanog in the nuclei of individual cells of dorsal and ventrolateral endoderm at the stages previously described. Values represent the median and quartile ranges of data from three independent experiments (n = 20–30 cell nuclei from 10 embryos; **p<0.01; ***p<0.001). See also Figure 5—source data 1.
Figure 6 with 1 supplement
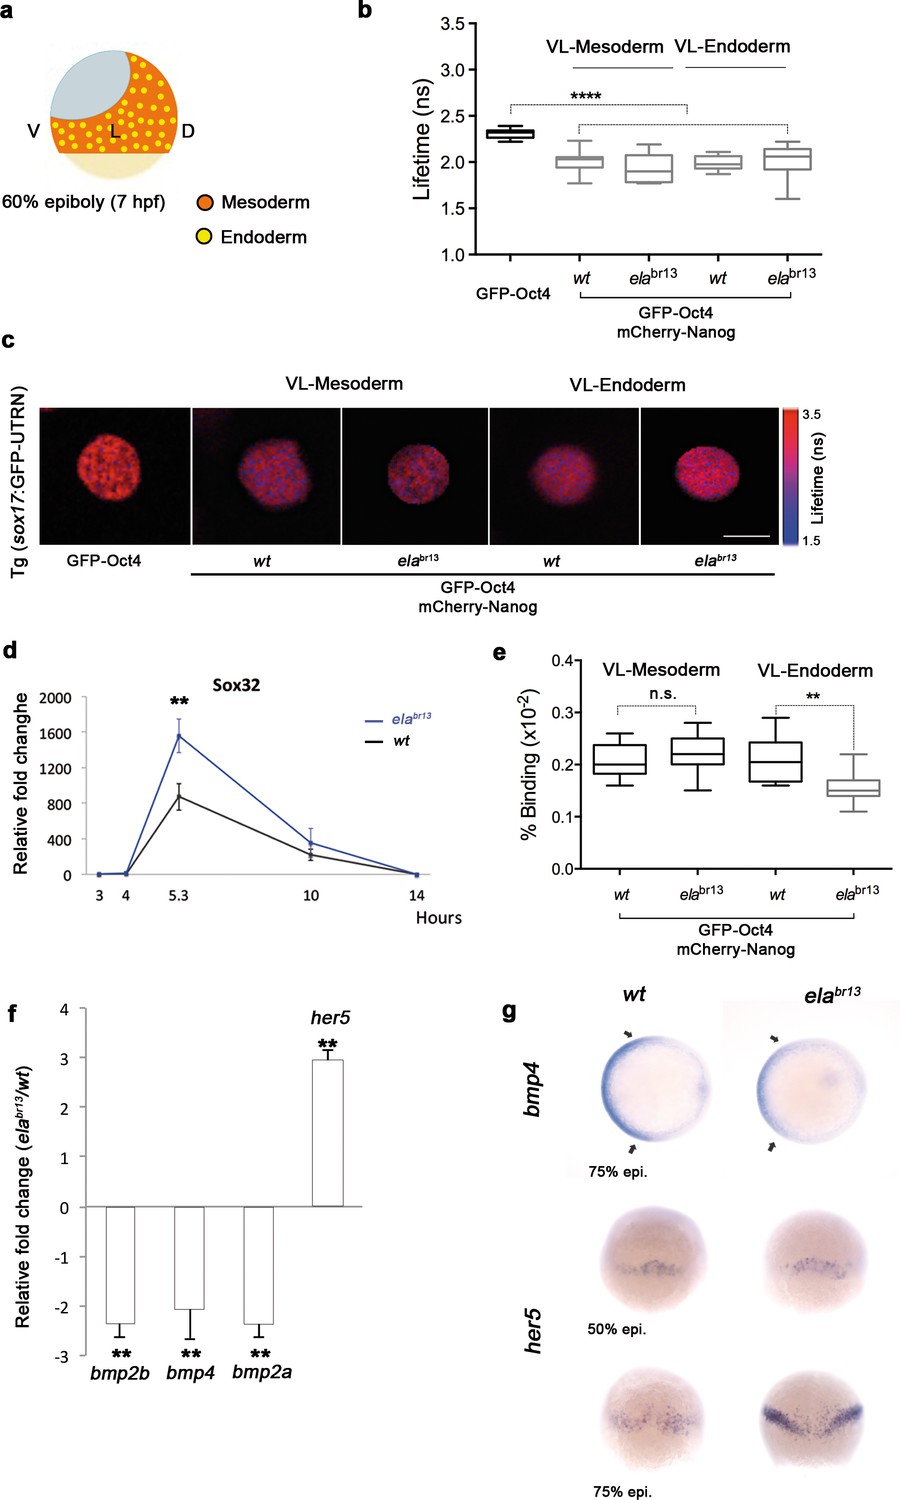
Sox32 modulates Oct4 and Nanog complexes in ventrolateral endoderm of gastrula embryos.
(a) The schematic shows the Ventrolateral (VL)- and dorsal (D)-mesendoderm layers at 60% epiboly (7 hpf), with mesoderm in orange and endoderm in yellow. (b, c) Lifetime values (b) and FLIM images (c) of GFP-Oct4 alone and in the presence of mCherry-Nanog in the nuclei of individual cells within VL-Mesoderm and VL-Endoderm cells of wt and elabr13 mutants. Values of FLIM data represent the median and quartile ranges of data from three to five independent experiments (n = 20–40 cell nuclei from 10 embryos; ***p<0.0001). Scale bar: 5 µm. (d) qRT-PCR analysis of sox32 relative to actin in wt and elabr13 mutant embryos. Values represent mean ± SEM of data from three independent experiments (**p<0.01). (e) Graphs show percentage of binding of GFP-Oct4 and mCherry-Nanog in VL-Mesoderm and VL-Endoderm of wt and elabr13 mutant embryos. Values represent the median and quartile ranges from data of three to five independent experiments (n = 20–40 cell nuclei from 7 to 10 embryos; **p<0.01). Values represent mean ± SEM of data from three independent experiments (**p<0.01). n.s. over bars indicates non-significant differences. (f) qRT-PCR analysis relative to actin reveals different transcription levels of bmp2b, bmp4, bmp2a and her5 in elabr13 mutants at 60% epiboly (7 hpf). Values represent mean ± SEM of data from three independent experiments (**p<0.01). (g) bmp4 expression (top view, dorsal is to the right-hand side) is ventrally reduced in elabr13 mutants compared with wt embryos. her5 expression (dorsal view) is dorsally upregulated in elabr13 mutants related to wt embryos. See also Figure 6—figure supplement 1.
Figure 6—figure supplement 1
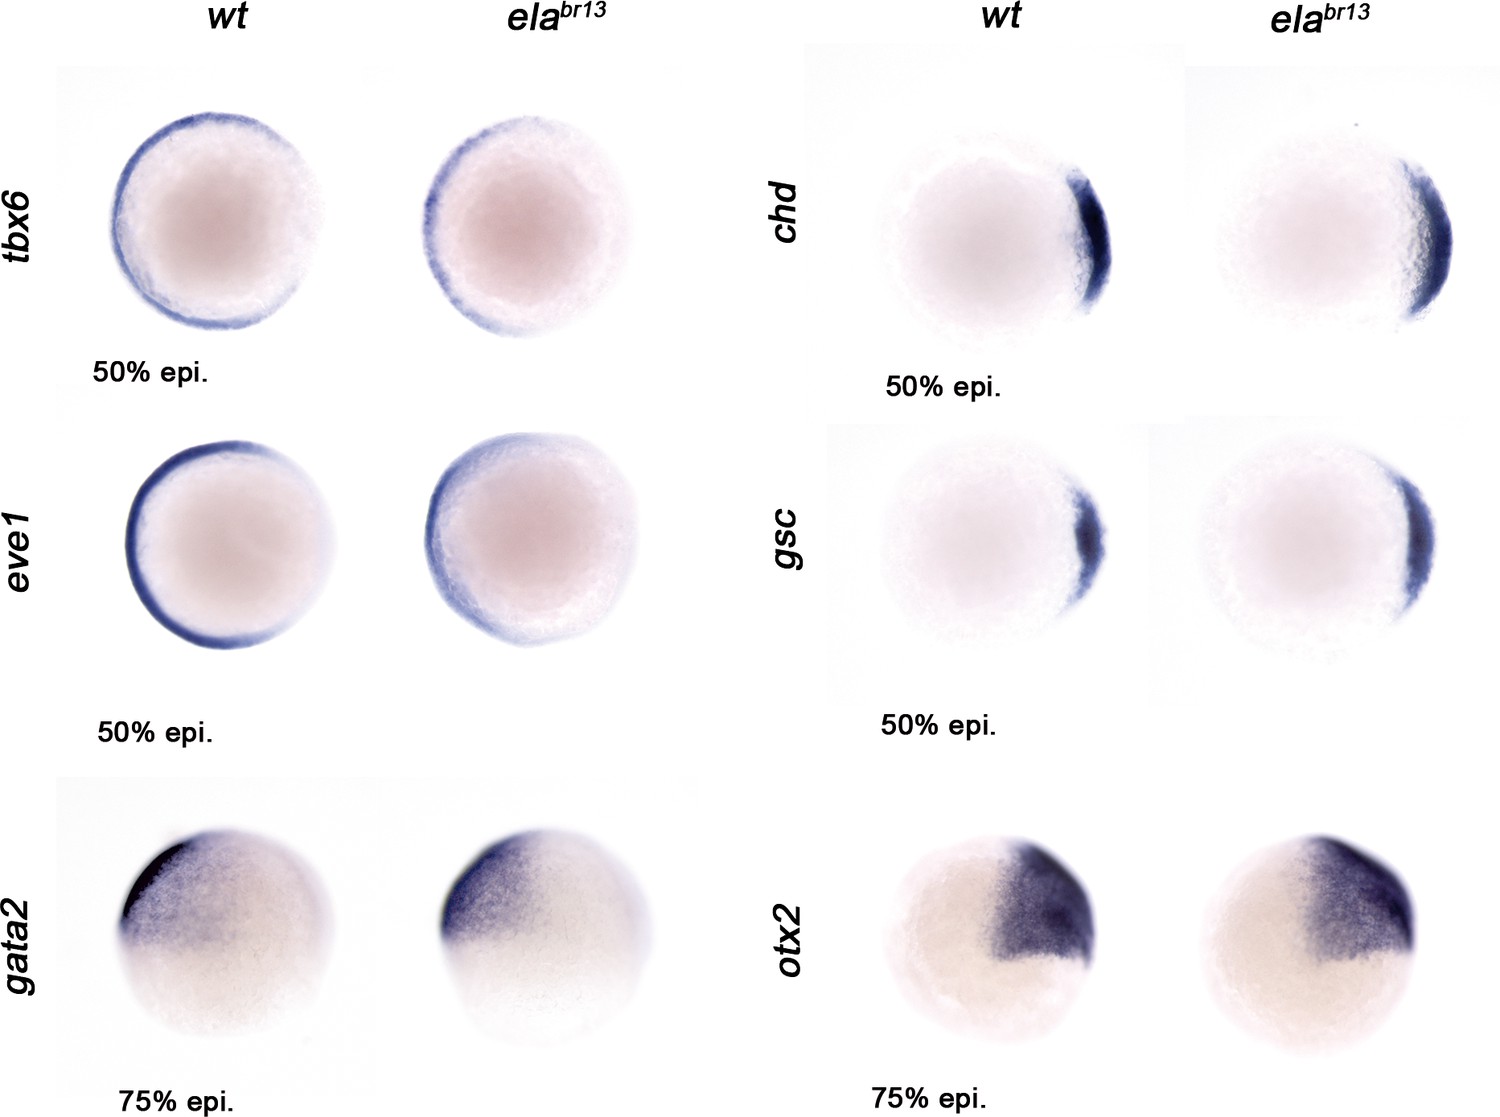
Ela/Aplnr pathway refines ventrolateral Bmp signaling.
Expression of the ventrolateral mesoderm markers, tbx6 and eve1, was slightly down-regulated in elabr13 relative to wt embryos at 50% epiboly. Chd expression in the dorsal margin and gsc in the prospective shield does not change in elabr13 ascompared with wt embryos at 50% epiboly. Ectoderm markers, gata2 (non-neural ectoderm) and otx2 (forebrain-midbrain), remained similar in elabr13 relative to wt embryos at 75% epiboly.
Additional files
-
Supplementary file 1
List of QRT-PCR primers.
Forward and reverse primers used in the qRT-PCR experiments. See Figure 6 and Figure 4—figure supplement 1.
- https://doi.org/10.7554/eLife.11475.027
Download links
A two-part list of links to download the article, or parts of the article, in various formats.
Downloads (link to download the article as PDF)
Open citations (links to open the citations from this article in various online reference manager services)
Cite this article (links to download the citations from this article in formats compatible with various reference manager tools)
Quantitative imaging reveals real-time Pou5f3–Nanog complexes driving dorsoventral mesendoderm patterning in zebrafish
eLife 5:e11475.
https://doi.org/10.7554/eLife.11475


