Actin filaments target the oligomeric maturation of the dynamin GTPase Drp1 to mitochondrial fission sites
- Geisel School of Medicine at Dartmouth, United States
- The University of Iowa, United States
Figures
Figure 1 with 2 supplements

Mitochondrial association of Drp1 puncta.
(A) Time-lapse image of region of gDrp1-U2OS cell transiently expressing mito-BFP and processed to remove background GFP (described in Figure 1—figure supplement 2A). Arrows denote variety of Drp1 puncta: stable (white arrow); transient (blue arrow); punctum at a fission site (yellow arrow). White arrowheads indicate unbound Drp1 puncta. Time in sec. Scale bar, 2 μm (Video 1). (B) Pie charts of mitochondria-associated versus non-associated Drp1 puncta: left panel, total puncta; right panel, high threshold. Each percentage is calculated by averaging percentages of mitochondrial Drp1 puncta over 201 frames from a 10 min imaging time. Quantification is based on 11 ROIs from 4 cells. (C) Histograms of lifetime distribution for mitochondrial Drp1 puncta, determined over 1200 s total recorded time. Left panel, total puncta; right panel, high threshold.
Figure 1—figure supplement 1
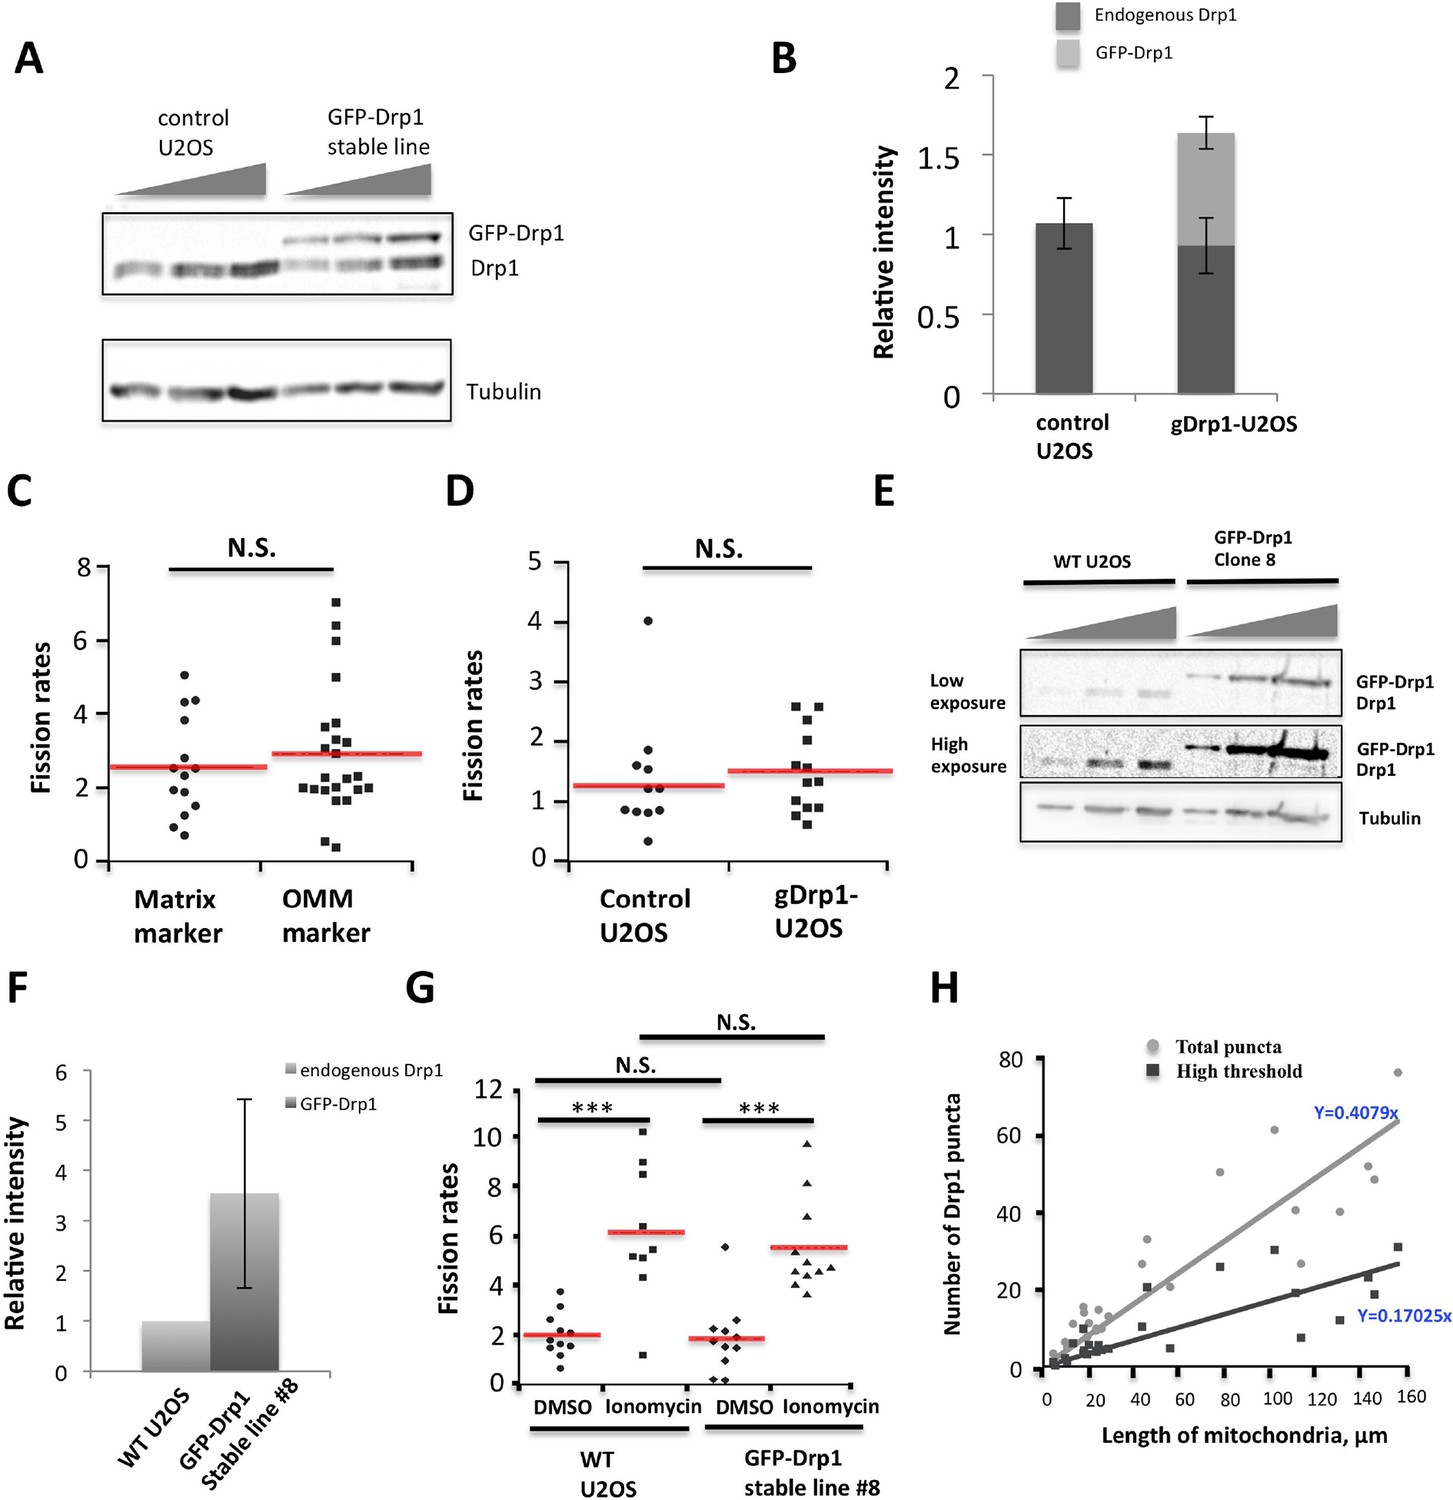
Characterization of stable GFP-Drp1 cell line (gDrp1-U2OS cells).
(A) Western blot of control U2OS cells or gDrp1-U2OS cells showing expression level of GFP-Drp1 and endogenous Drp1 with varying amount of extract loaded (0.5, 0.75 and 1.0x from left to right). (B) Quantification of endogenous Drp1 and GFP-Drp1 in control U2OS and gDrp1-U2OS cells from western blots (normalized to tubulin level). Error bars, S.D. (C) Comparison of mitochondrial fission rates in control U2OS cells transfected with a mitochondrial matrix marker (mito-dsRed) versus an OMM marker (Tom20-GFP or Tom20-mApple). Mean ± standard deviation for each condition are (in fission events mm mitochondrial length-1 min-1): mito-dsRed, 2.56 ± 1.36 (14 ROIs/7 cells); and Tom20, 2.91 ± 1.73 (24/9). N.S., p = 0.52, unpaired Student t-test. (D) Comparison of fission rate in control U2OS and gDrp1-U2OS cells transiently transfected with mCherry-mito7 plasmid (fission events mm mitochondrial length-1 min-1). 13 ROIs/7 cells for gDrp1-U2OS cells, and 12 ROIs/6 cells control U2OS cells. N.S. = not significant. p = 0.49, unpaired Student t-test. (E-G) Analysis of a second GFP-Drp1 stable cell line (called clone 8). (E) Western blots with varying amount of extract loaded (0.25, 0.5 and 1.0x from left to right) for both endogenous Drp1 and GFP-Drp1 level in WT U2OS versus stable clone #8. (F) Quantification of Drp1 and GFP-Drp1 levels in WT U2OS and clone #8. Drp1 level was normalized to tubulin level when comparing samples, and combined Drp1/GFP-Drp1 level in clone #8 was normalized to the Drp1 level of WT cells. (G) Live-cell analysis of mitochondrial fission rates in WT U2OS and in clone #8 in the absence and presence of ionomycin (4 μM). Quantification based on at least nine ROIs and 5 cells for all conditions. Imaging period was at least 21 min for all conditions. ***p<0.001, unpaired Student t-test. (H) Quantification of number of total Drp1 puncta or high threshold Drp1 puncta (y axis) versus length of mitochondria (x axis). Quantification was based on 26 ROIs.
Figure 1—figure supplement 2
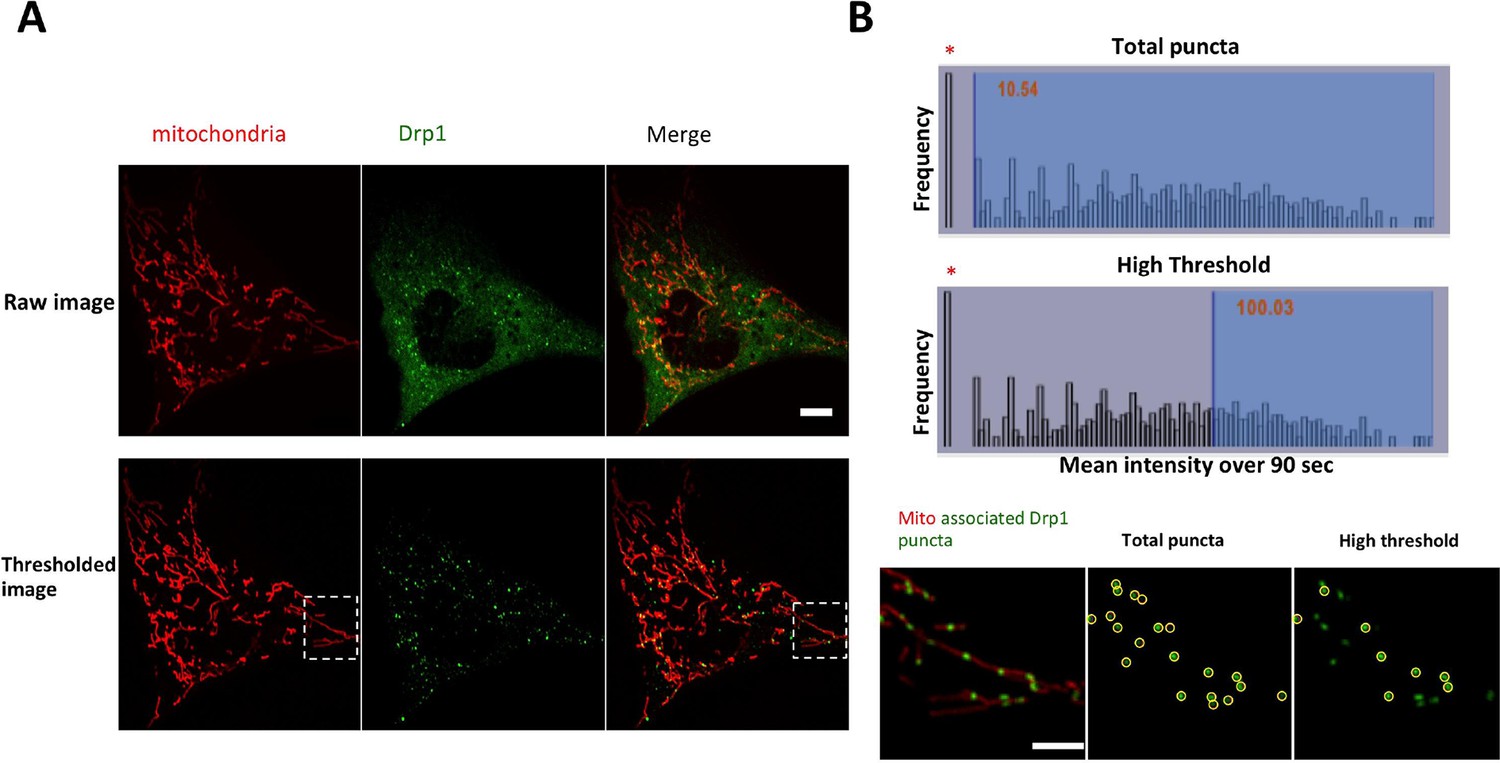
Image processing for GFP-Drp1 intensity in gDrp1-U2OS cells.
(A) Example of image processing for analysis of Drp1 dynamics. Images were threshold-adjusted by subtracting background Drp1 in the cytosol using a rolling ball algorithm (radius = 2 pixels or 0.304 mm), followed by smoothing (ImageJ). (B) Example of categorizing Drp1 puncta based on mean intensity over time. Bar graphs are histograms of mean Drp1 intensity over 90 s (3 s acquisition intervals), with the cytosolic “background” (bar at extreme left, indicated by asterisk) as the most abundant. Top histogram shows “total puncta” to include all puncta over background (mean intensity >10), and bottom histogram shows “high threshold” to examine only the brighter puncta (mean intensity >100). Micrographs show a merged image of mitochondria and mitochondrially bound puncta (left), puncta included in the total puncta category (circled in middle image), and puncta included in the high threshold category (circled in right image). Scale bar, 10 μm in (A), 5 μm in (B).
Figure 2 with 1 supplement

Maturation of mitochondrially-bound Drp1 puncta.
(A) Example of Drp1 maturation events (arrowheads), followed by mitochondrial fission (63 s). Time in sec. Scale bar, 1 μm (Video 2). (B) Quantification of mitochondrial Drp1 merging rate, defined as number of merging events per min per number of Drp1 puncta. 5317 puncta from 11 ROIs in four cells based on Trakmate with parameters described before. Line indicates mean (0.045 ± 0.029) (C) Super-resolution Airyscan live-cell images showing Drp1 maturation (yellow arrowheads) (Video 5).
Figure 2—figure supplement 1
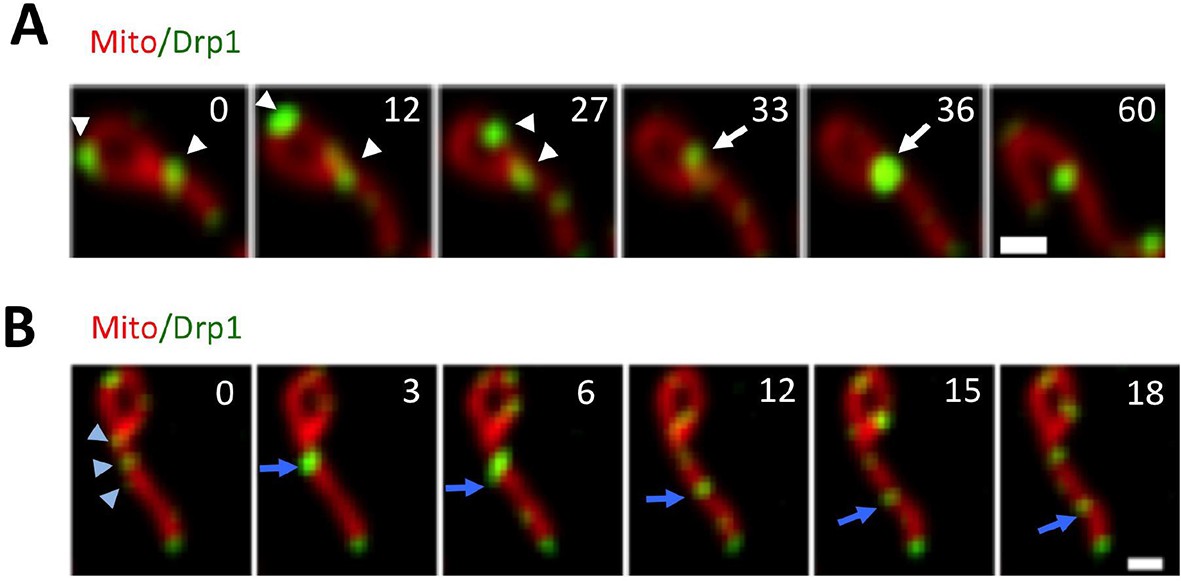
Drp1 maturation events.
(A) Multiple Drp1 merging events, followed by fission at a looped junction (arrow at 36 s) (Video 3). (B) Drp1 merging event, followed by splitting of the punctum. Three dim Drp1 puncta merge to form a bright punctum at 3 s (blue arrow). Subsequently, the punctum splits between 6 and 12 s and the resulting two puncta move away from each other (Video 4).
Figure 3 with 1 supplement
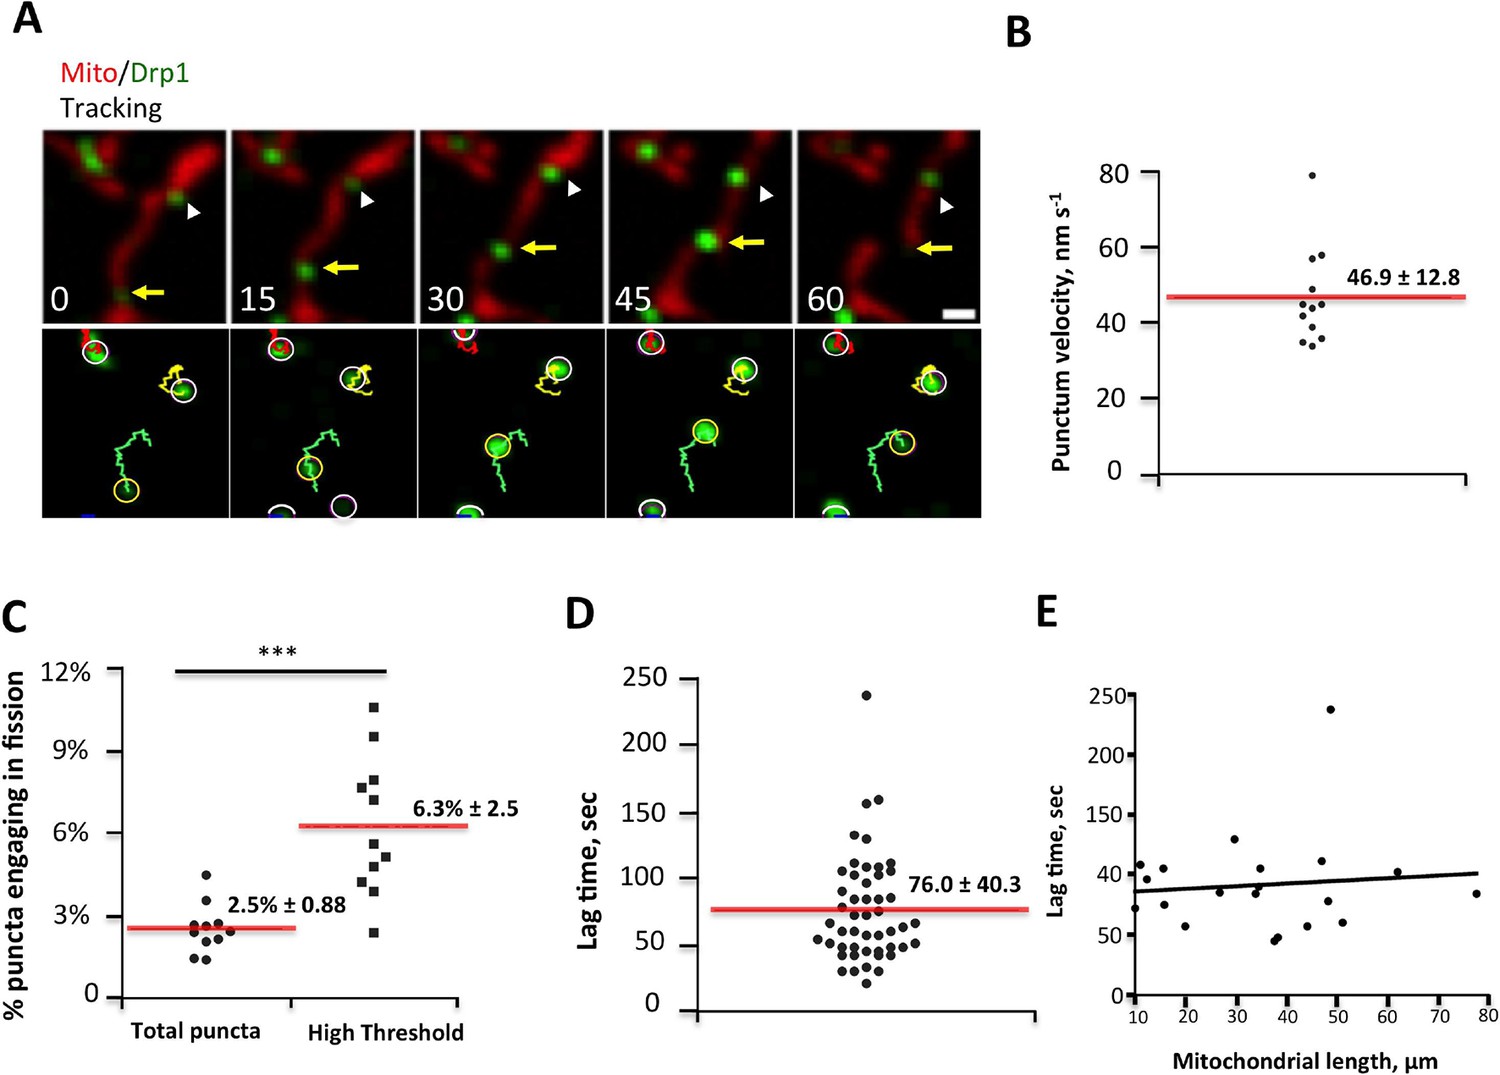
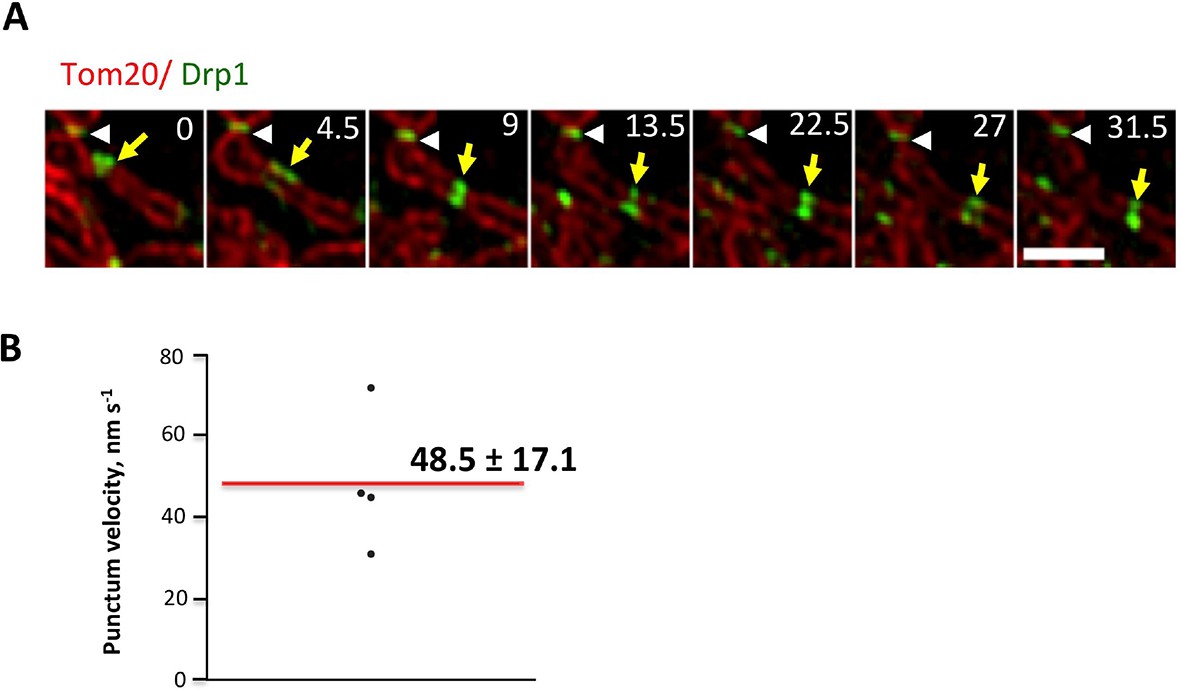
Drp1 puncta motility and relationship to mitochondrial fission.
(A) Example of motile Drp1 punctum (yellow arrow) engaging in fission at 60 s, and a stationary punctum (white arrowhead). Lower panel maps tracks of these puncta. Time in sec. Scale bar, 1 μm (Video 6). (B) Drp1 punctum translocation velocity on mitochondrion (12 motile puncta from 12 ROIs from 11 cells). (C) Quantification of percentage of Drp1 puncta engaging in fission over the 10 min viewing period for total puncta and for high threshold puncta. 11 ROIs from 4 cells, ***p<0.001, unpaired Student t-test. (D) Lag time between Drp1 punctum appearance and fission for productive Drp1 puncta. 49 fission events from 11 cells. (E) Relationship between lag time and mitochondrial length for 20 mitochondria. Line fit data: y = 83.7 + 0.22x, RMSD = 0.096.
Figure 3—figure supplement 1
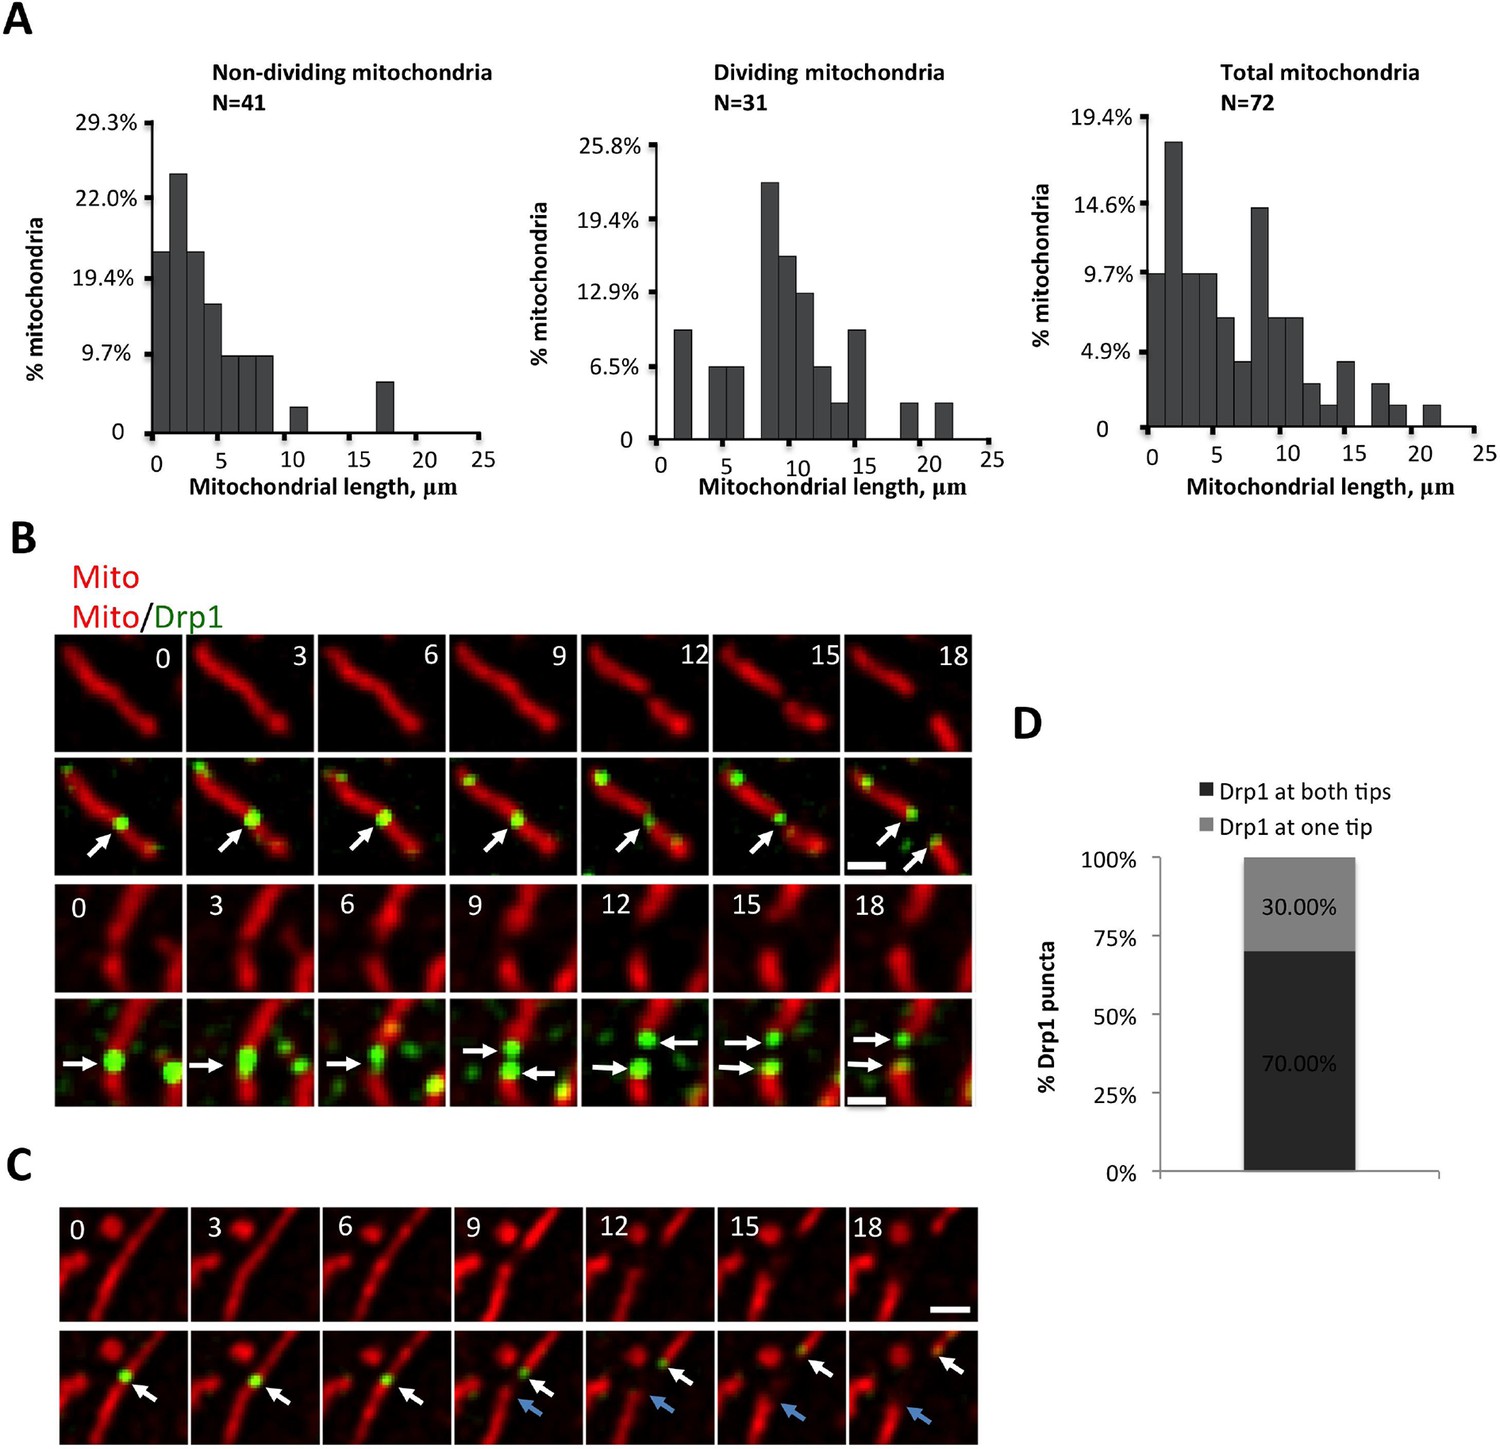
Correlation between mitochondrial length and fission, and Drp1 punctum persistence on mitochondrial ends after mitochondrial fission.
(A) Analysis of mitochondrial lengths for mitochondria not undergoing fission (“Non-dividing”, left), and mitochondria undergoing fission (“Dividing mitochondria, middle) over a 10 min imaging period. For dividing mitochondria, mitochondrial length was measured at the frame prior to dividing; for non-dividing mitochondria, length was measured at first frame imaged. Histogram of all mitochondria shown in right panel. (B) Two examples of Drp1 remaining on both new mitochondrial ends after fission events (white arrows). (C) Example of Drp1 remaining on only one new mitochondrial end after fission (blue arrow indicating mitochondrial end without Drp1 punctum). (D) Frequency of Drp1 left on ends after fission. Quantification was based on 20 fission events, in which Drp1 puncta were readily resolved after fission. Bar, 1 μm. Time in sec.
Figure 4 with 1 supplement
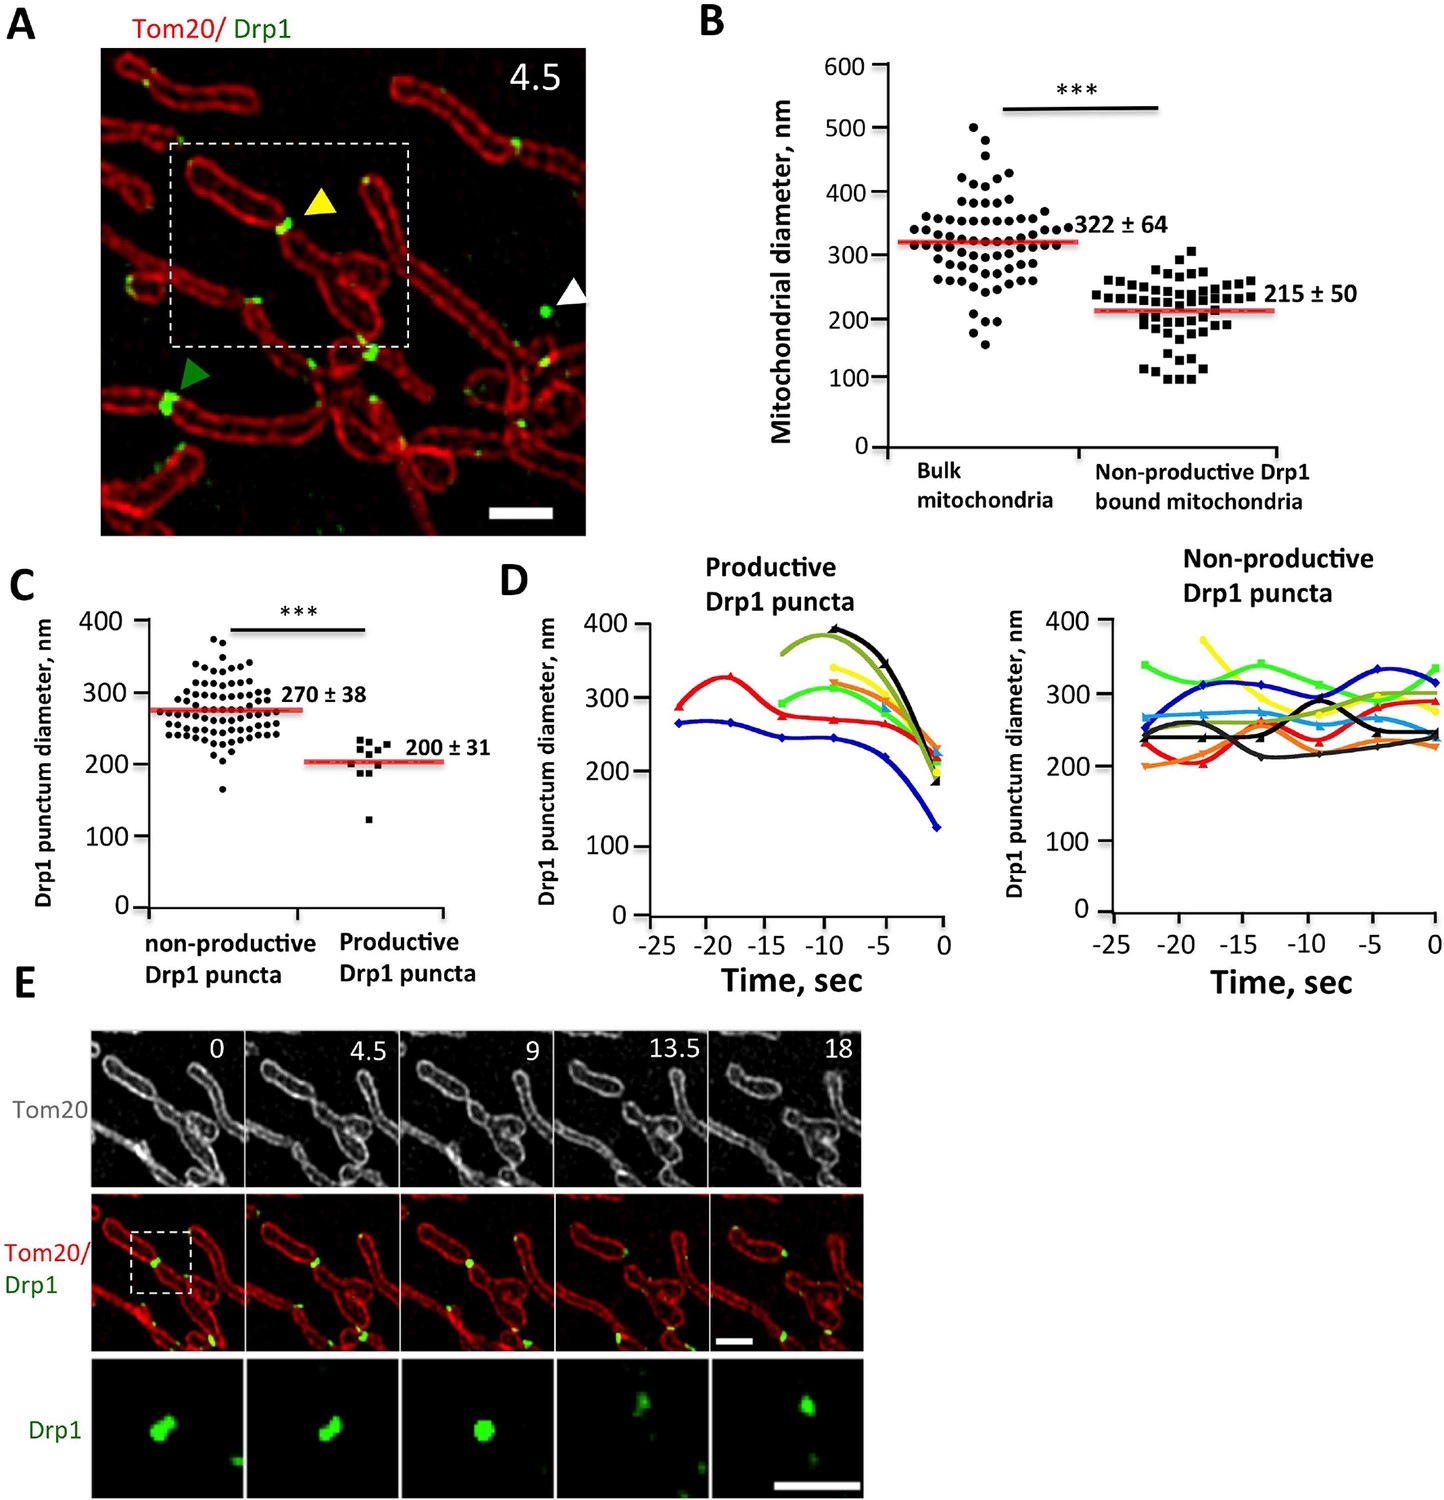
Drp1 and mitochondrial diameter by live-cell 3D-SIM.
(A) 3D-SIM image of region of a live gDrp1-U2OS cell transiently expressing Tom20-mCherry. Yellow arrowhead, Drp1 punctum engaged in fission. Green arrowhead, non-productive punctum. White arrowhead, unbound punctum. Time in sec. Scale bar, 1 μm. (B) Quantification of mitochondrial diameters from regions devoid of Drp1 (“bulk mitochondria”, left) or at sites of non-productive stationary puncta (right). ***p<0.001 unpaired Student t-test. (C) Quantification of Drp1 diameters for productive Drp1 puncta (4.5 s before fission, 11 events) versus non-productive puncta (82 events). ***p<0.001 unpaired Student t-test. (D) Diameter variation for seven productive Drp1 puncta over 30 s prior to fission (at 0 s, left) and for nine non-productive puncta over a similar time (right). (E) Time-lapse of fission event from (A) showing Drp1 punctum constriction. Bottom panel of Drp1 alone is further enlarged (Video 7). Time in sec. Scale bar, 1 μm (top); 0.5 μm (bottom).
Figure 4—figure supplement 1
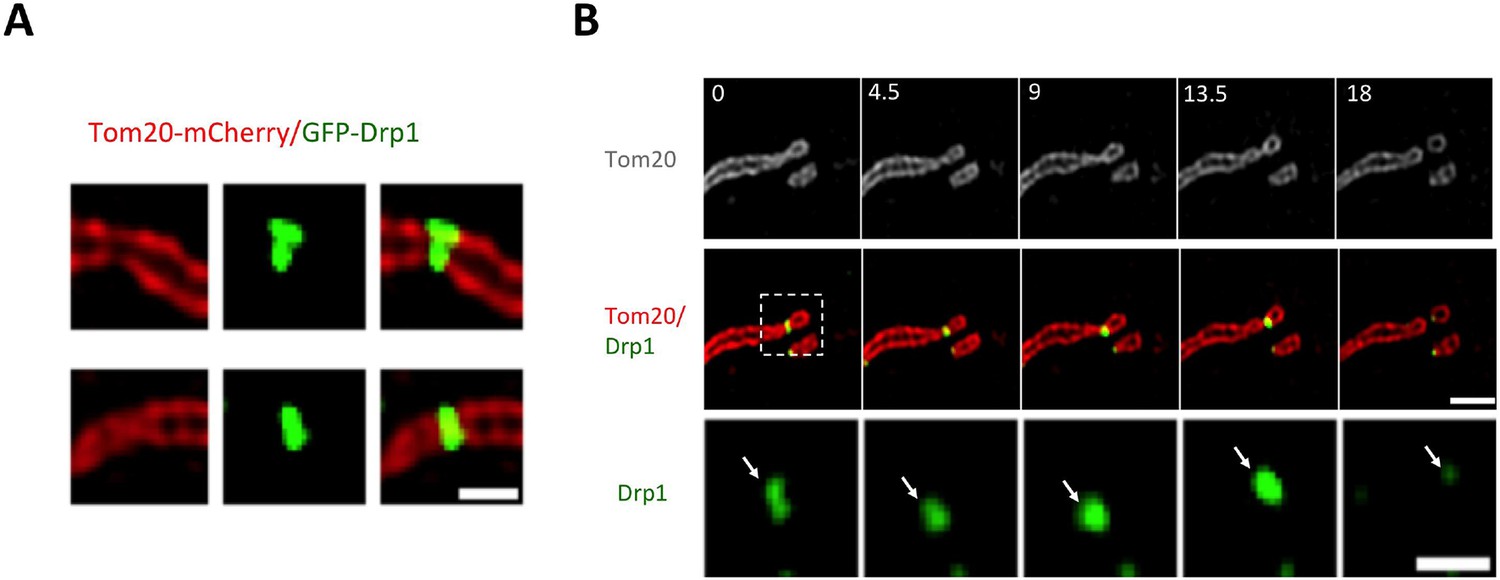
3D-SIM imaging of Drp1 and mitochondria.
(A) Two close-up examples of non-productive stationary puncta, showing constriction of OMM (left panel) in the absence of fission. (B) Additional example of mitochondrial fission event from 3D-SIM (similar to Figure 4E) shows morphological changes of Drp1 structures. The region in dashed rectangle is enlarged in the bottom panel. GFP-Drp1 (green), mCherry-Tom20 (red) (Video 8). Time in sec. Scale bars, 0.5 μm in (A) and 1 μm (top and middle panels) and 0.5 μm (bottom panel) in (B).
Figure 5 with 1 supplement
Drp1 motility by live-cell 3D-SIM.
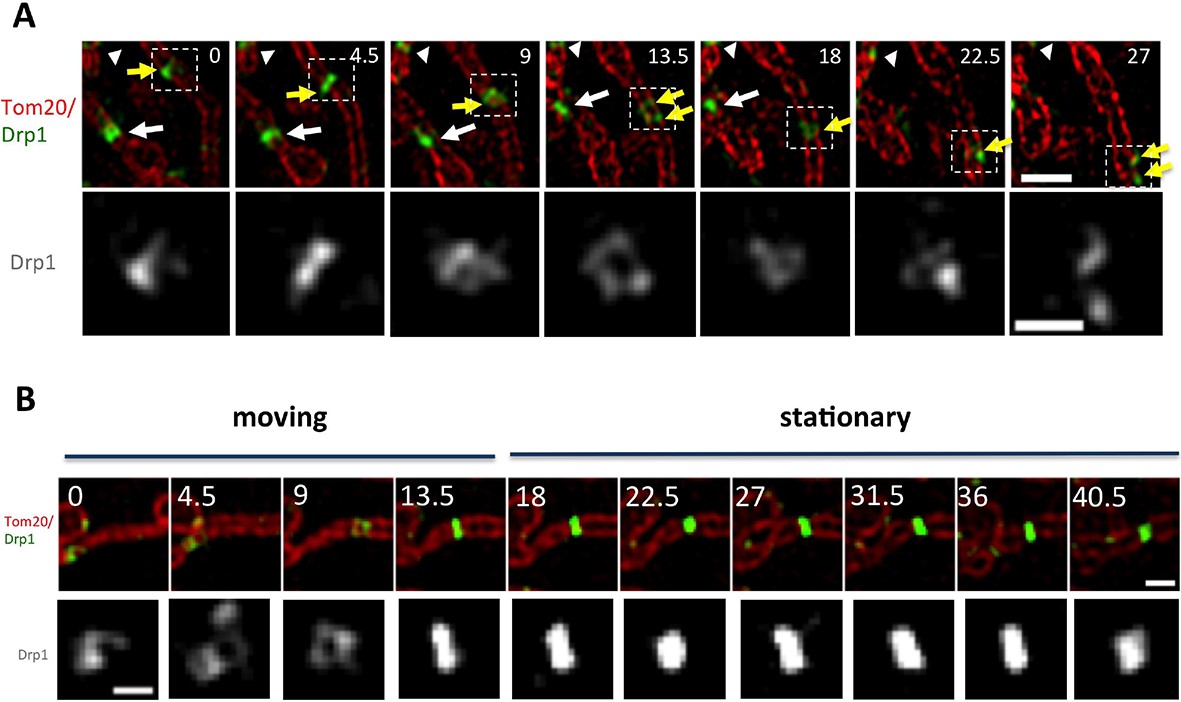
(A) Motile Drp1 punctum on a stationary mitochondrion (yellow arrow) and stationary Drp1 punctum on a motile mitochondrion (white arrow). White arrowhead indicates stationary Drp1 punctum on stationary mitochondrion. Lower panel is zoom of Drp1 alone, indicating changing Drp1 morphology during movement (Video 9). (B) Punctum transitioning from motile to stationary, accompanied by change in morphology. Time in sec. Scale bar, 1 μm in A (top); 0.5 μm in A (bottom); 1 μm in B (top); 0.3 μm in B (bottom).
Figure 5—figure supplement 1
(A) Additional example of motile Drp1 punctum from 3D-SIM (similar to Figure 5A).
Yellow arrow indicates the motile Drp1 punctum moving along the mitochondrion. White arrowhead indicates stationary Drp1 punctum. Time in sec. Scale bar, 1 μm (Video 10). (B) Velocity quantification of mitochondrially-associated motile Drp1 puncta from 3D-SIM. Four ROIs from 2 cells are used in this quantification via Trackmate V2.7.3.
Figure 6 with 4 supplements
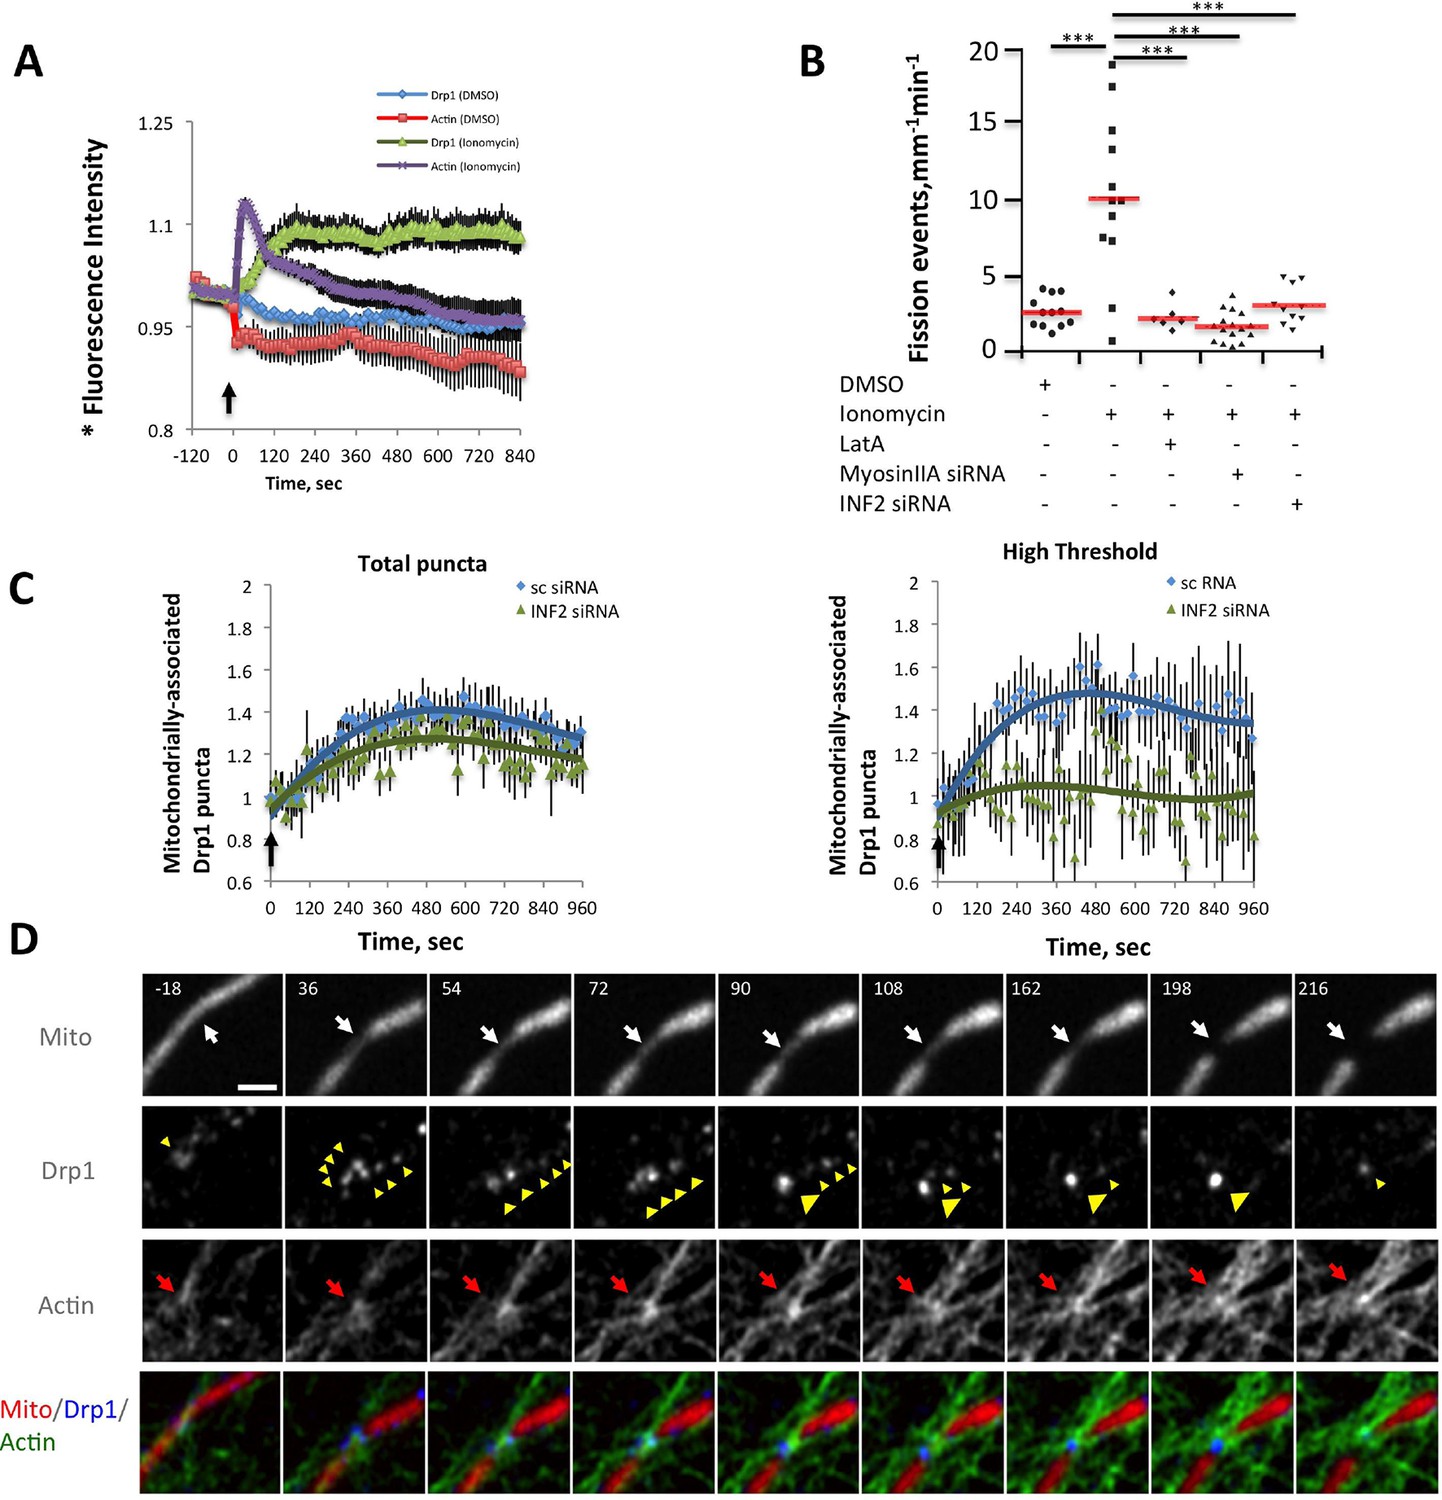
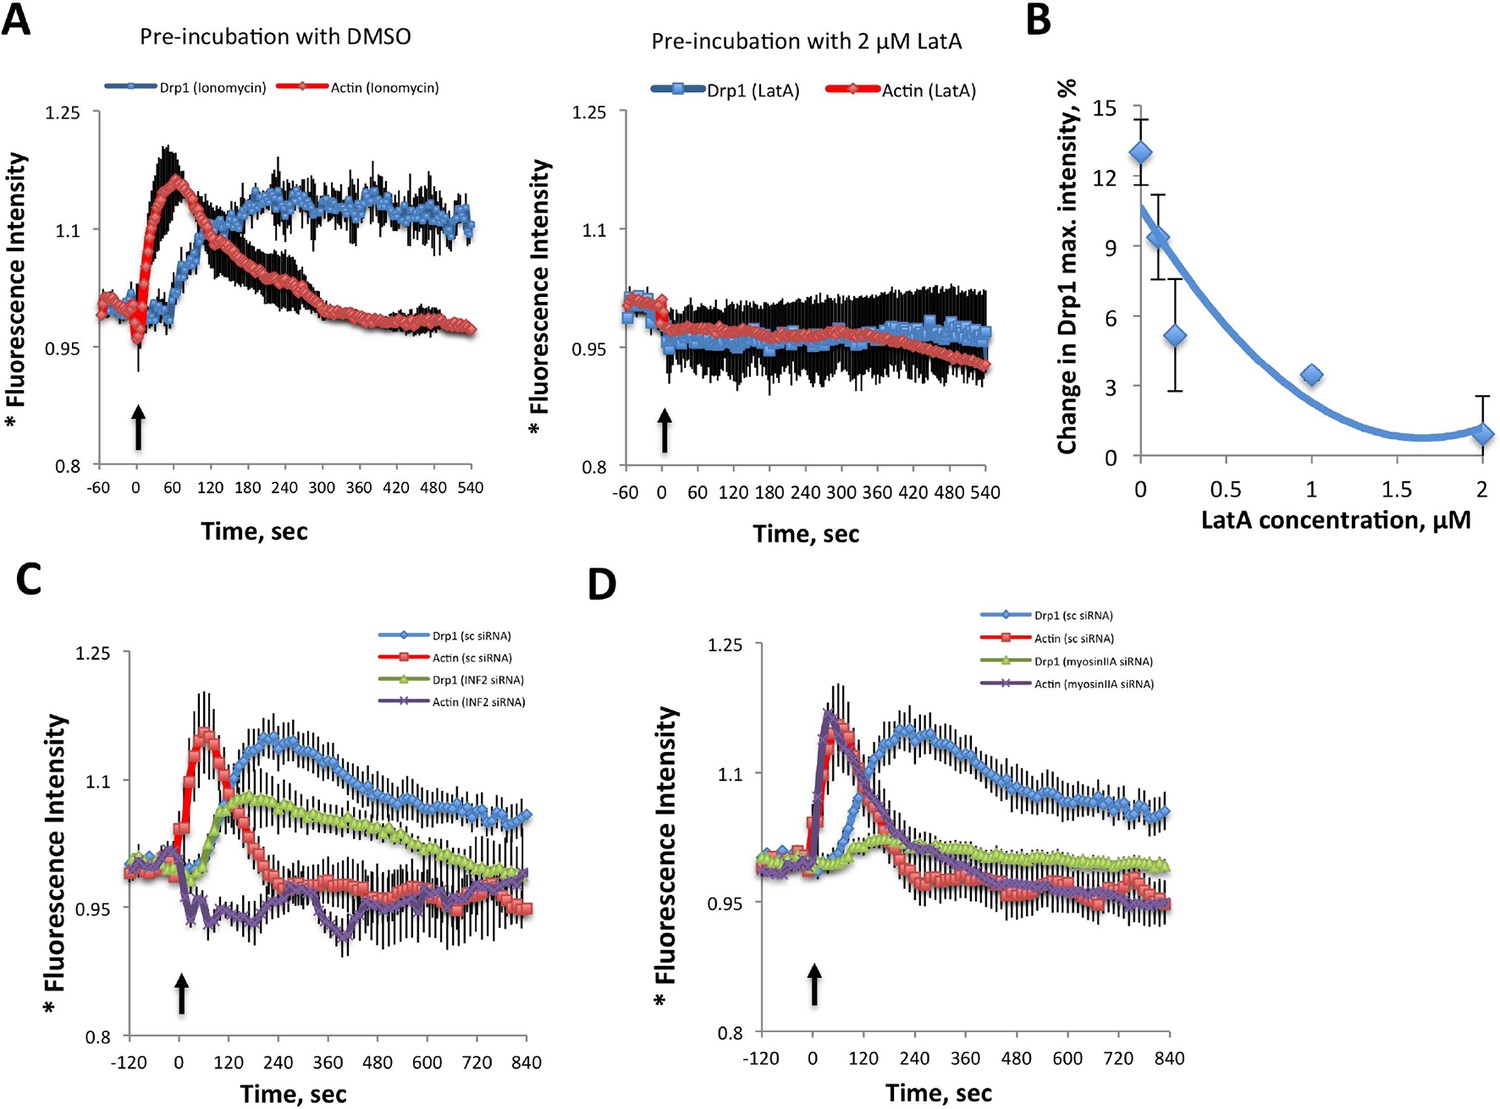
Ionomycin treatment induces actin polymerization, Drp1 maturation and mitochondrial fission.
gDrp1-U2OS cells transiently transfected with mApple-F-tractin and mito-blue plasmids. (A) Time course of changes in Drp1 oligomer and actin filaments (judged by changes in GFP and mApple signal over cytosolic background, fluorescence normalized to time 0). GFP-Drp1 quantified over whole cell. Actin filaments were quantified from two or three ROIs per cell (approximately 3 × 3 μm each), in which no stress fibers or cell edges were included. DMSO (N = 10 cells) or ionomycin (4 μM, N = 12 cells) added at time 0 (arrow). * denotes total Drp1 puncta or polymerized actin fluorescence (as indicated for individual curves). (B) Mitochondrial fission rate (fission events per mm mitochondrial length per min) upon ionomycin treatment in the absence or presence of LatA (2 μM) or siRNA for INF2 or myosin IIA. ***p<0.001. (C) Quantification of mitochondrially bound Drp1 puncta (total puncta (left) and high threshold (right)) in response to ionomycin treatment in control (sc siRNA) and INF2 suppressed (INF2 siRNA) cells. Nine ROIs from six control cells and six INF2 suppressed cells. Ionomycin was added at 0 s to all samples (black arrow). Data first quantified as mitochondrially-bound puncta per mm mitochondrial length, then normalized such that 0 s value = 1. Error bars, standard deviation (S.D.). (D) Airyscan microscopy of a fission site (white arrow) showing actin filament enrichment (red arrows) and Drp1 maturation (yellow arrowheads) upon ionomycin treatment (1 μM at t = 0). Larger area shown in Figure 6—figure supplement 2 (Video 12). Time in sec. Bar, 1 μm.
Figure 6—figure supplement 1
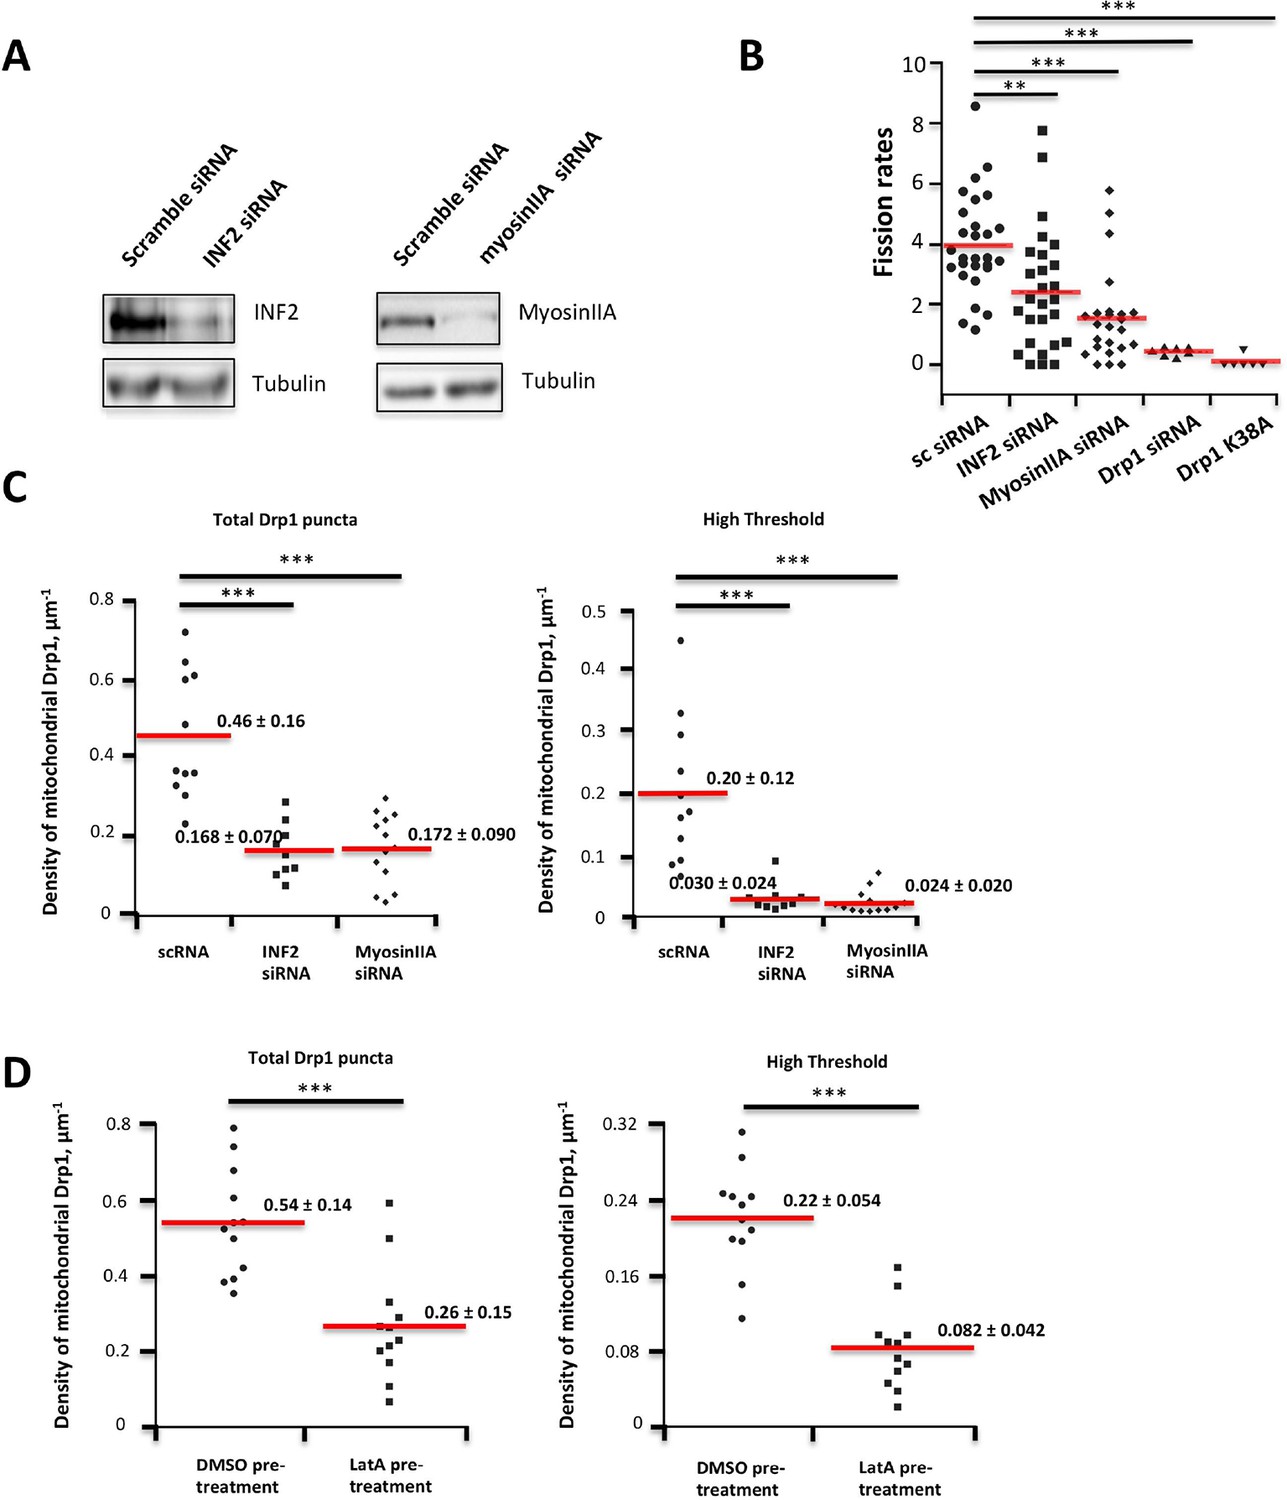
Suppression of INF2 or myosin IIA decreases fission rate in un-stimulated conditions.
(A) Western blots for INF2 (left) or myosinIIA (right) using lysates from siRNA-treated cells (tubulin as loading control). (B) Quantification of mitochondrial fission rates in U2OS cells transiently transfected with mito-dsRed in un-stimulated conditions. Fission rate defined as fission events per mm mitochondrial length per min in a defined ROI. Mean rate ± standard deviation for each condition are: control siRNA, 3.97 ± 1.65 (28 ROIs/4 independent experiments); INF2-CAAX siRNA, 2.42 ± 1.99 (27/4); myosin IIA siRNA, 1.55 ± 1.52 (24/4); Drp1 siRNA, 0.43 ± 1.41 (7/2); and Drp1-K38A over-expression, 0.081 ± 0.20 (6/2). **p<0.01, ***p<0.001, unpaired Student t-test. (C,D) Inhibition of actin, INF2 or myosin IIA reduces density of mitochondrially associated Drp1 in unstimulated conditions. (C) Knock down of INF2 or MyosinII-A reduces both total Drp1 puncta (left panel) and high threshold Drp1 puncta (right panel). Each value is calculated by averaging density of mitochondrial Drp1 puncta over 201 frames with 3 s time intervals over 10 min imaging time. Quantification is based on 11 ROIs from 4 scRNA treated cells, 9 ROIs from 3 INF2 siRNA treated cells; and 13 ROIs from 5 MyosinIIA siRNA treated cells from 2 independent experiments. (D) Inhibition of actin polymerization by LatA reduces both total Drp1 puncta (left panel) and high threshold Drp1 puncta (right panel). Quantification was based on 12 ROIs from five DMSO pre-treated cells; 12 ROIs from six 2 μM LatA pre-treated cell from 2 independent experiments. ***p< 0.001, unparied Student t-test.
Figure 6—figure supplement 2
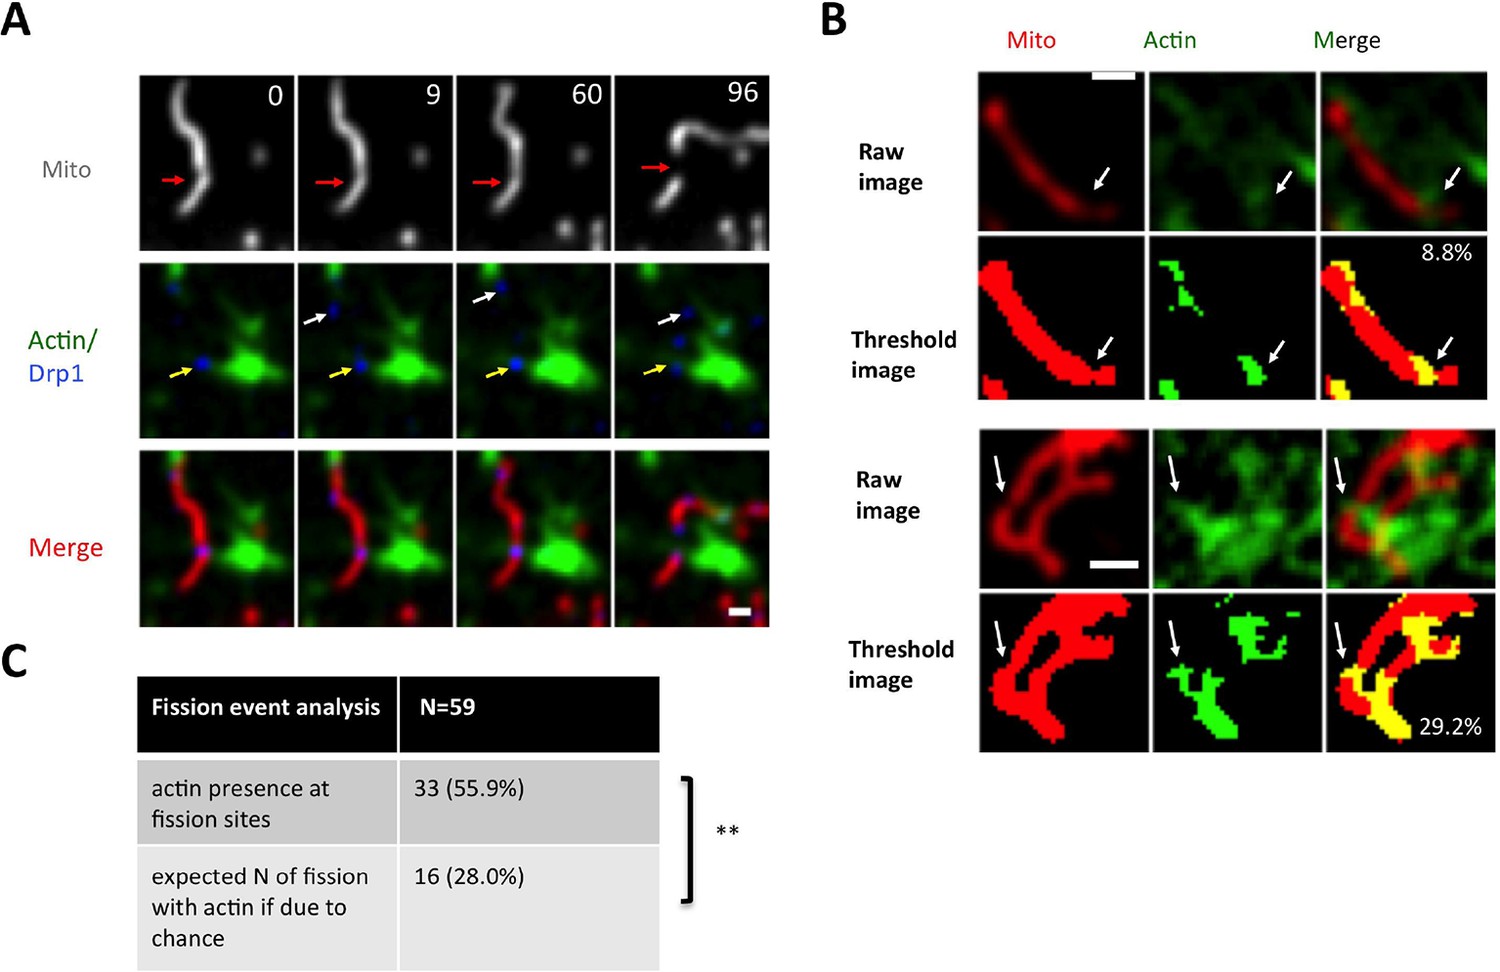
Actin filament enrichment with Drp1 puncta at fission sites in un-stimulated conditions.
(A) Example of actin filaments enriching with Drp1 punctum prior to fission in gDrp1-U2OS cell transiently transfected with mApple-Ftractin and mito-BFP. Upper panel, mitochondrial signal only; middle panel, Drp1 and actin filaments; bottom panel, all three markers. Red arrows indicate fission sites in the upper panel. Yellow arrows indicate Drp1 punctum that overlays with actin filaments, and white arrows indicate Drp1 punctum that does not overlay with actin (Video 12). (B) Two examples of image processing for determining the percentage of mitochondrial surface covered by actin filaments. Upper panels are raw images of mitochondria and actin filaments from the frame immediately before mitochondrial fission (3 s). Bottom panels show processed images with% of actin/mitochondrial overlap given. White arrows indicate fission sites. (C) Table comparing the number of fission events at actin-mitochondrial contact sites compared to the expected number if there is no relationship between the presence of actin and mitochondrial fission (predicted from the percent of mitochondrial coverage by actin filaments for 59 examples). **p=0.0026, Fisher’s exact test. Time in sec. Scale bar, 1 μm in (A and B).
Figure 6—figure supplement 3
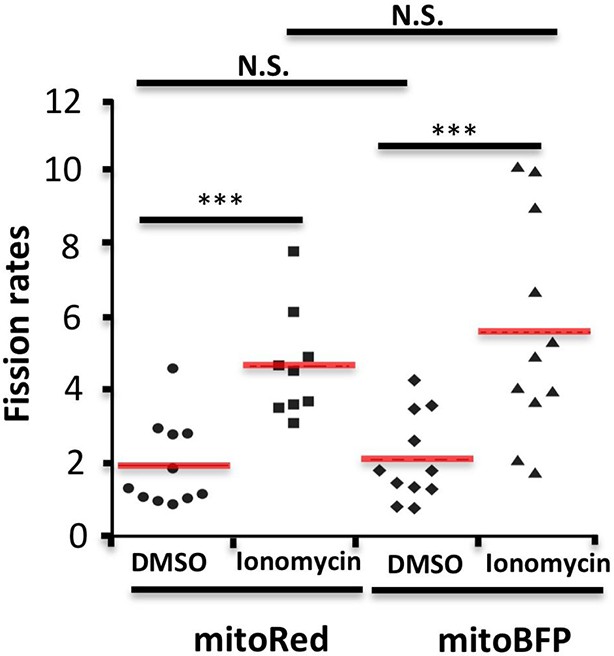
Comparison of mitochondrial fission rates in mitoRed labeled versus mitoBFP labeled cells.
Quantification was based on 11 ROIs from 7 DMSO treated, mitoRed labeled cells over 25.4 min; 9 ROIs from 7 Ionomycin treated, mitoRed labeled cells over 24.3 min; 11 ROIs from 10 DMSO treated, mitoBFP labeled cell over 24.2 min; 11 ROIs from 8 Ionomycin treated, mitoBFP labeled cell over 21.5 min. ***p<0.001, unpaired Student t-test.
Figure 6—figure supplement 4

Larger field of super resolution Airyscan images, including the region shown in Figure 6D.
Actin filaments accumulate at three mitochondrial constriction sites (red arrows) prior to Drp1 maturation (yellow arrowheads). Two of the constriction sites do not undergo fission in this time period (Video 12). Time in sec. Scale bar, 1 μm.
Figure 7
Inhibition of actin, INF2 or myosin IIA reduces ionomycin-induced Drp1 maturation.
(A,B) gDrp1-U2OS cells were transiently transfected with mitochondrial matrix marker, mito-BFP, and actin filament marker, mApple-F-tractin. Cells were treated with 0, 0.1, 0.2, 1 and 2 μM LatA (or DMSO) for 15 min before imaging. At 60 s after starting imaging, cells were treated with 4 μM ionomycin (in the presence of the appropriate concentration of LatA) and imaged for 9 min. GFP-Drp1 signals over cytosolic background (background subtract, ImageJ) were measured per whole cell; actin filament signals were quantified from two or three ROIs per cell (approximately 3 × 3 μm), in which no stress fibers or cell edges were included. Error bars, standard deviation for A and S.E.M. for B. (C) Time course of ionomycin-induced changes in Drp1 oligomer and actin filaments after INF2 siRNA treatment (INF2 siRNA). 11 control cells (sc siRNA), six INF2 siRNA. Error bars, S.E.M. (D) Time course of ionomycin-induced changes in Drp1 oligomer and actin filaments after myosin IIA siRNA treatment. N = 11 control cells (sc siRNA), 12 myosin IIA siRNA. * denotes total Drp1 puncta or polymerized actin (as indicated for individual curves). Error bars, S.E.M for C and D.
Figure 8 with 1 supplement
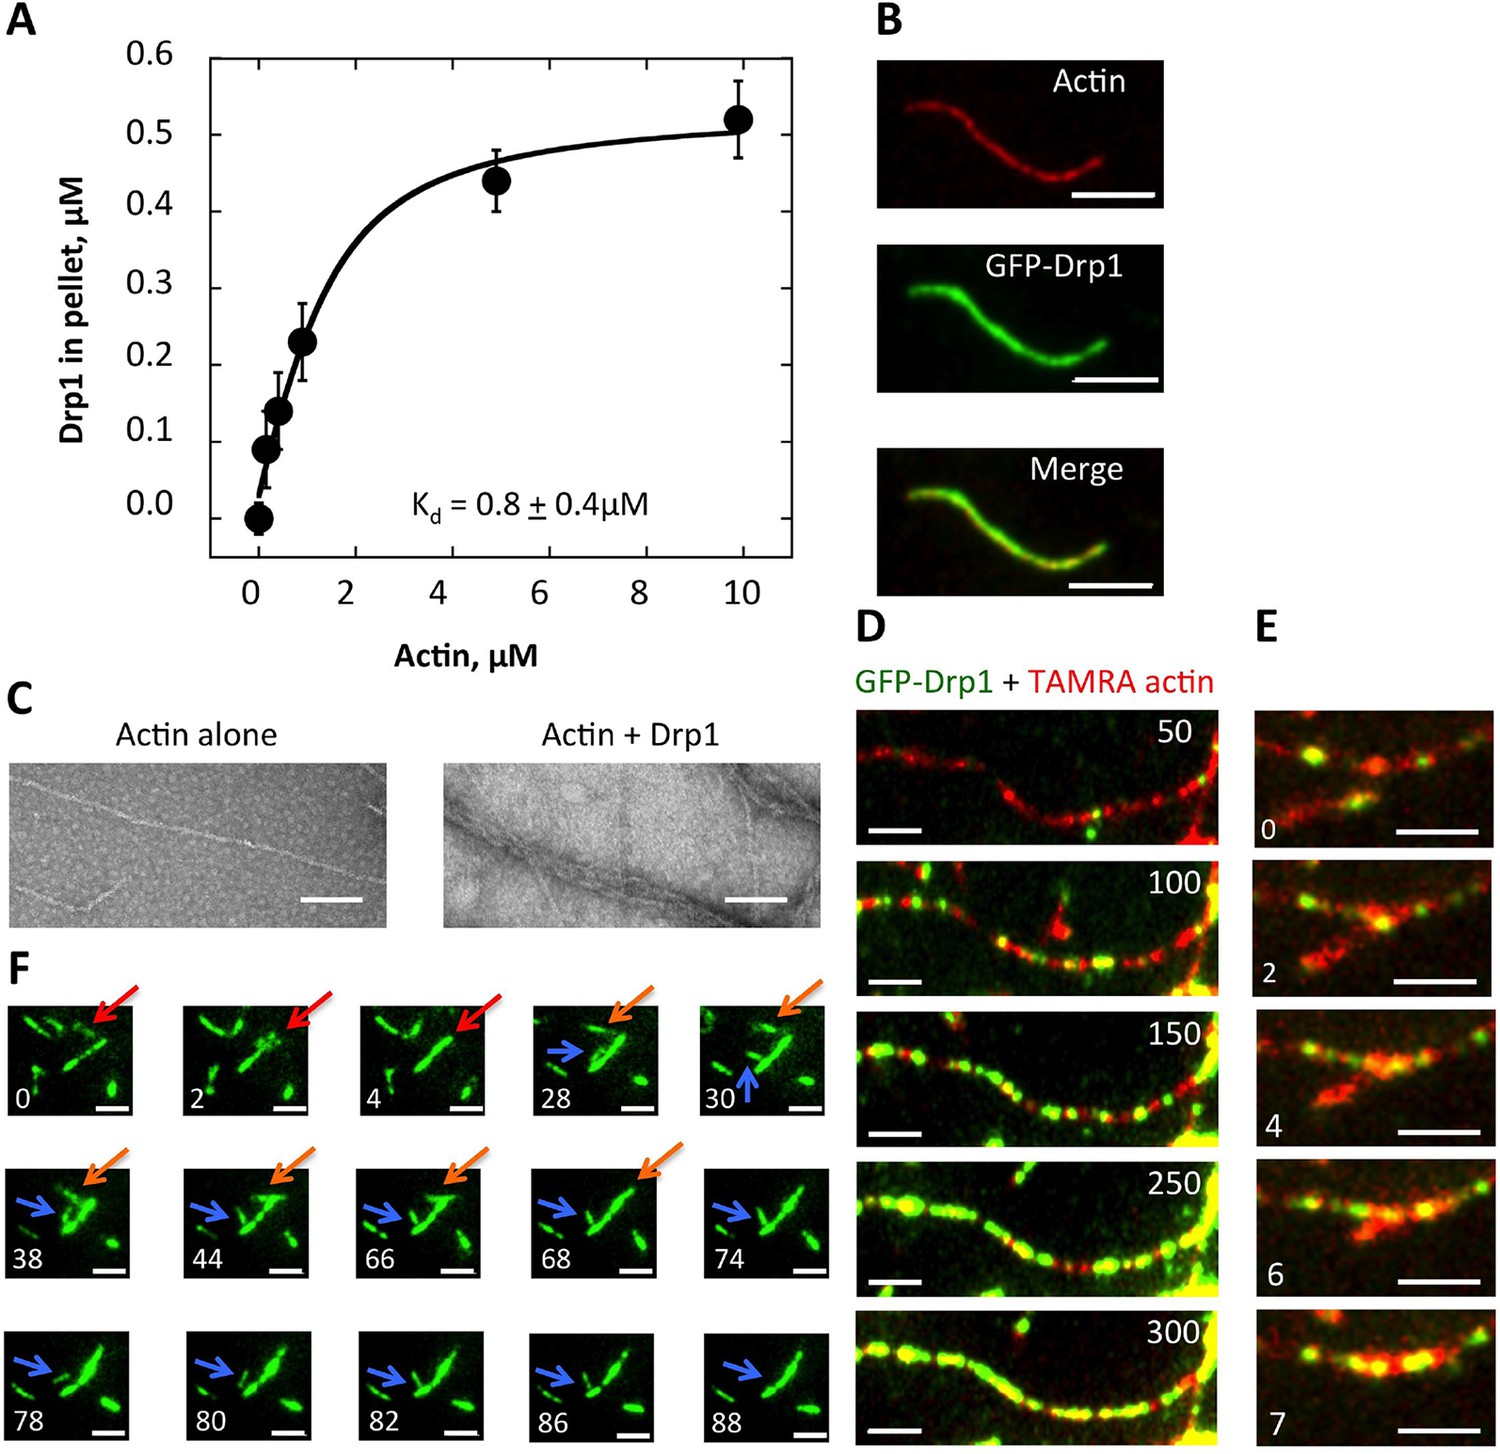
Drp1 binds to actin filaments.
(A) Co-sedimentation assay in which Drp1 (1.3 μM) is incubated with indicated concentration of pre-polymerized actin (concentrations indicate total actin) for 1 hr, then centrifuged at >100,000 ×g to sediment actin filaments. Pellets analyzed by SDS-PAGE (Figure 8—figure supplement 1A). Each data point is the mean from 10 independent experiments. Error bars, standard deviation. (B) Single time point images from TIRF microscopy assay of actin filaments (20% TAMRA-labeled) mixed with saturating concentration of GFP-Drp1. Scale bar, 2 μm. (C) Negative stain electron microscopy of 2 μM actin filaments in the absence or presence of 1 μM Drp1. Mean filament widths: 8.9 + 0.2 nm (n = 44 filaments) for actin alone; and 27.2 + 1.3 nm (n = 49) for actin/Drp1. Scale bar, 50 nm. (D) TIRF microscopy time-lapse montage showing GFP-Drp1 dynamics on an actin filament. Time indicates seconds after GFP-Drp1 addition. Scale bar, 2 μm (Video 13). (E) TIRF microscopy time-lapse montage showing GFP-Drp1 can bundle actin filaments (20% TAMRA-labeled). Time indicated in seconds. Scale bar, 2 μm (Video 14). (F) TIRF microscopy time-lapse montage showing multiple bundling events by GFP-Drp1 (denoted by red, orange and blue arrows). Actin filaments not shown. Note Drp1-coated filament denoted by blue arrow, which binds by its end to a second filament for ~50 s, before releasing, flipping, binding by its opposite end, then bundling into the second filament. Time in sec. Scale bar, 2 μm (Video 15).
Figure 8—figure supplement 1
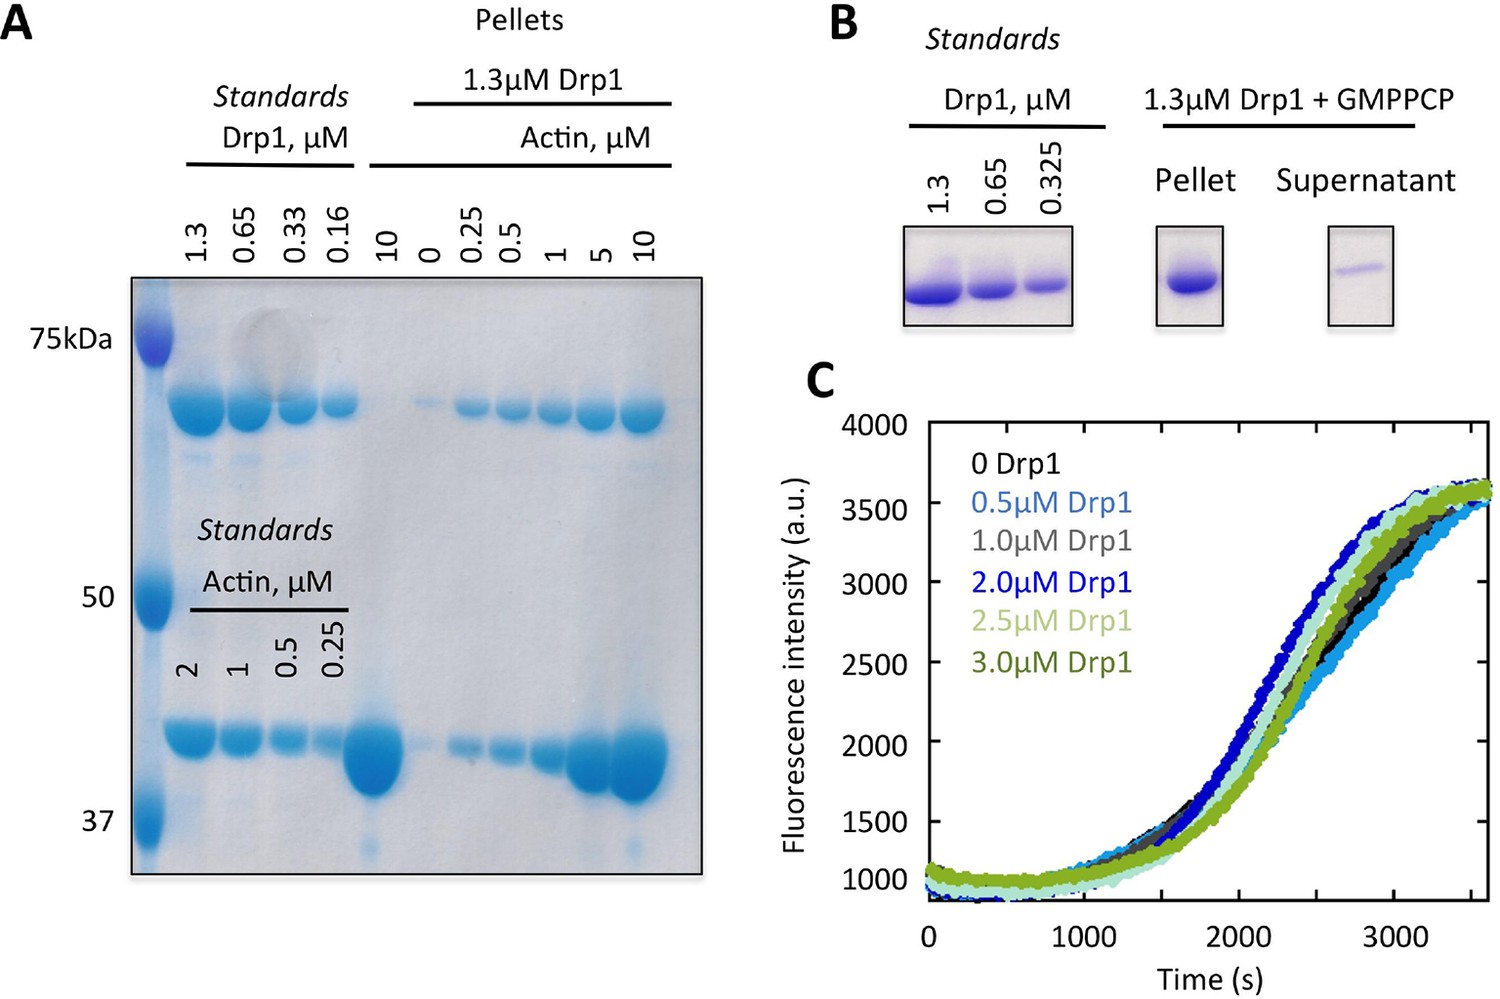
Binding of Drp1 to actin filaments by co-sedimentation assay.
(A) Example of an SDS-PAGE gel from a high-speed co-sedimentation assay, where 1.3 μM Drp1 was incubated with the indicated concentration of actin filaments for 1 hr at 23°C. Samples were ultra-centrifuged for 20min at 4°C. The amount of Drp1 in the pellet with actin filaments was analyzed using Colloidal blue staining SDS-PAGE and ImageJ Software. The standards indicate known amounts of Drp1 and actin, which were used to generate a standard curve to calculate the amount of Drp1 in the pellet. The concentrations of actin and Drp1 indicated in the ‘pellet’ lanes indicate the total amounts present in the assay before centrifugation. The Drp1 band is just below 75 kDa marker, and the actin band is between 37.5 and 50 kDa markers. (B) High-speed sedimentation assay where 1.3 μM Drp1 was incubated with 500 μM GMPPCP for 1 hr at 23°C. Samples were ultra-centrifuged for 20min at 4°C. The pellet and supernatant samples were analyzed using Coomassie staining SDS-PAGE. The standards indicate known amounts of Drp1. All samples were run on the same gel and stained identically (intervening lanes were cut out for clarity). (C) Pyrene-actin polymerization assay of 2 μM actin alone (10% pyrene label) or with 1 μM Drp1. Actin was monomeric at time 0 (time of addition of Drp1 and polymerization buffer).
Figure 9
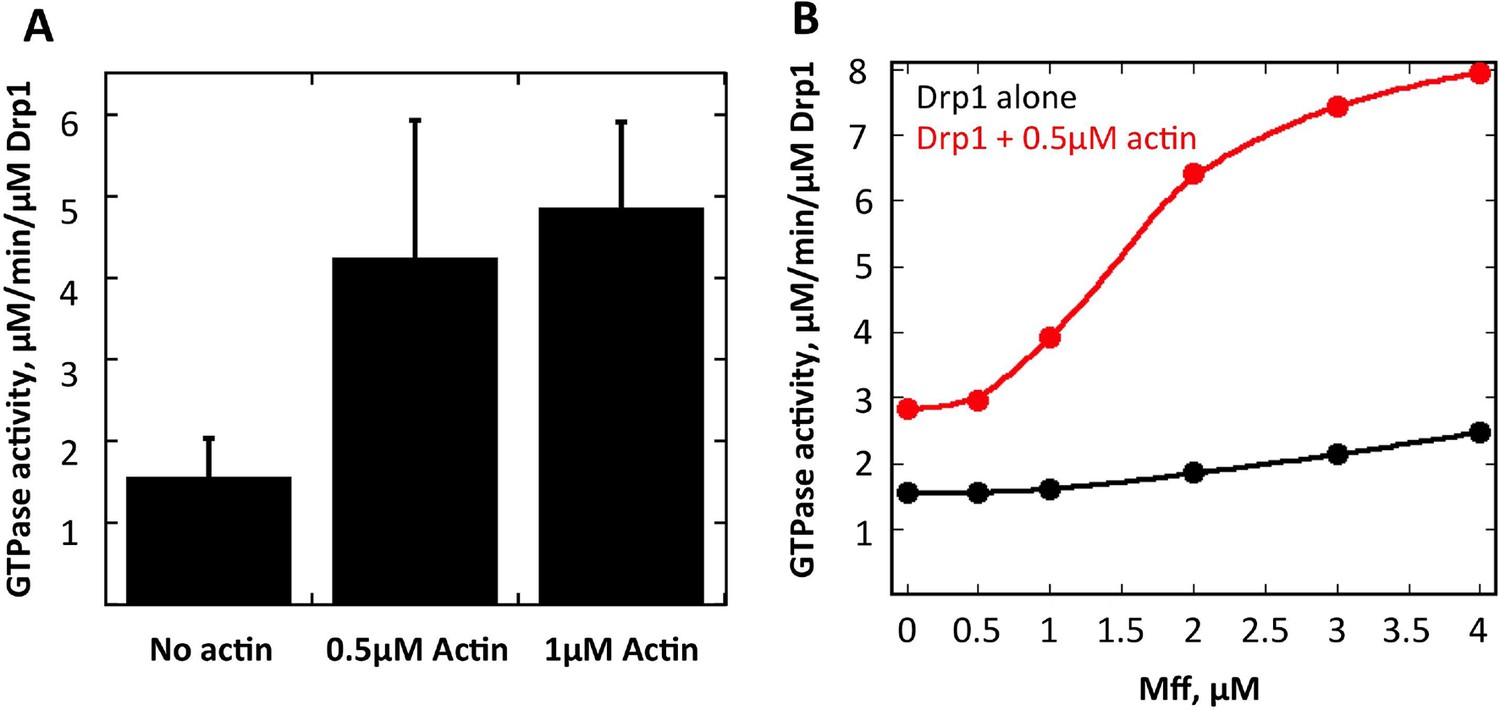
Actin fialments stimulate Drp1 GTP hydrolysis synergistically with Mff.
(A) GTPase assays containing 1 μM Drp1 in the presence or absence of 0.5 or 1 μM actin (pre-polymerized for 1 hr) for 5 min before GTP addition (250 μM). N = 6 experiments. (B) GTPase assays containing 1 μM Drp1 in the presence or absence of 0.5 μM actin (pre-polymerized for 1 hr) and the indicated concentration of Mff (cytosolic region) for 5 min before GTP addition (250 μM).
Figure 10
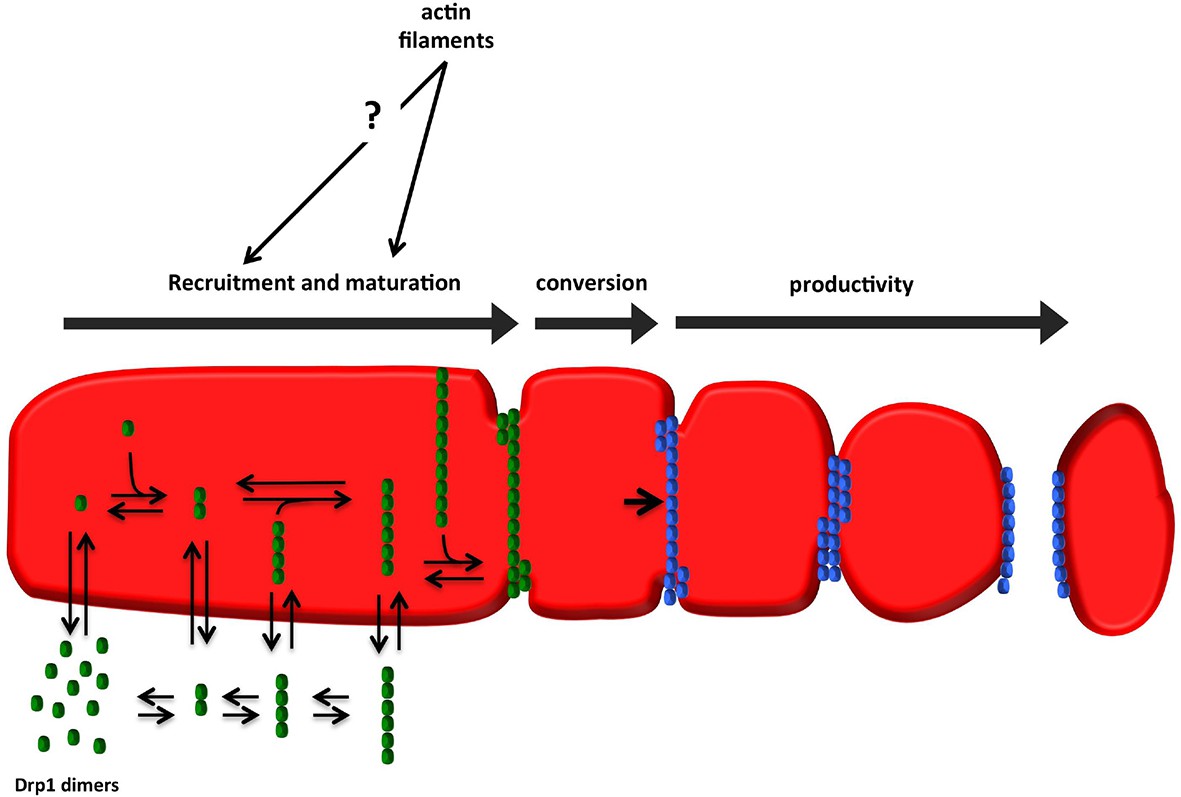
Model for assembly of fission-productive Drp1 on mitochondria.
Step 1: recruitment. Drp1 units are in equilibrium between cytosol and OMM, possibly binding to OMM receptors such as Mff, MiD49, MiD51, or Fis1, or to cardiolipin. We suggest that several distinct oligomeric species may interact with the OMM. Step 2: maturation. Mitochondrially-bound Drp1 oligomers grow through incorporation of other mitochondrially-bound oligomers, progressively encircling the OMM in the process. The larger Drp1 oligomers constrict the OMM but are not yet competent to drive fission. Step 3: conversion. A stable Drp1 oligomer becomes productive for mitochondrial fission (change from green to blue), with increased Drp1 ring constriction driving membrane ingression. Actin filaments and myosin II clearly stimulate the maturation process, with possible effects on recruitment as well.
Videos
Video 1
Left: confocal time-lapse of Drp1 dynamics in gDrp1-U2OS cell transiently expressing mito-BFP; Right: mitochondrially-associated Drp1 puncta pseudo-colored in blue.
Time lapse was taken in single z-plane every 3 s. Time min:sec. Bar, 2 μm (Figure 1A).
Video 2
Confocal time-lapse of Drp1 maturation in gDrp1-U2OS cell transiently expressing mCherry-mito7 (red).
Time lapse was taken in single z-plane every 3 s. Time min:sec. Bar, 1 μm (Figure 2A).
Video 3
confocal time-lapse of multiple Drp1 merging events, followed by fission at a looped junction in gDrp1-U2OS cell transiently expressing mCherry-mito7 (red).
Time lapse was taken in single z-plane every 3 s. Time min:sec. Bar, 1 μm (Figure 2—figure supplement 1A).
Video 4
Confocal live cell image of Drp1 merging event, followed by splitting of the punctum in gDrp1-U2OS cell transiently expressing mCherry-mito7 (red).
Time lapse was taken in single z-plane every 3 s. Time min:sec. Bar, 1 μm (Figure 2—figure supplement 1B).
Video 5
Airyscan time-lapse of Drp1 maturation in gDrp1-U2OS cell (GFP in green) transiently expressing mCherry-mito-7 (red).
Time lapse was taken in single z-plane in dorsal region of cells every 7 s. Time min:sec. Bar, 1 μm (Figure 2C).
Video 6
Confocal time-lapse of Drp1 movement along mitochondrion in gDrp1-U2OS cell transiently expressing mito-BFP (red).
Mitochondrially-bound Drp1 puncta were followed by Trackmate. Time lapse was taken in single z-plane every 1.5 s. Time min:sec. Bar, 1 μm (Figure 3A).
Video 7
3D-SIM time-lapse of Drp1-mediated mitochondrial fission in gDrp1-U2OS cell transiently expressing Tom20-mCherry (red).
Time lapse was taken every 4.5 s. Time min:sec. Bar, 1 μm (Figure 4A,E).
Video 8
3D-SIM live cell image of Drp1-mediated mitochondrial fission in gDrp1-U2OS cell transiently expressing Tom20-mCherry (red).
Time lapse was taken every 4.5 s. Time min:sec. Bar, 1 μm (Figure 4—figure supplement 1B).
Video 9
3D-SIM time-lapse of Drp1 movement along mitochondrion in stable gDrp1-U2OS cell transiently expressing Tom20-mCherry (red).
Time lapse was taken every 4.5 s. Time min:sec. Bar, 1 μm (Figure 5A).
Video 10
3D-SIM live cell image of Drp1 movement along mitochondrion in gDrp1-U2OS cell transiently expressing Tom20-mCherry (red).
Time lapse was taken every 4.5 s. Time min:sec. Bar, 1 μm (Figure 5—figure supplement 1A).
Video 11
Confocal live cell image of mitochondrial fission in an un-stimulated U2OS cell transiently expressing mApple-F-tractin and mito-BFP.
Time lapse was taken in single z-plane in dorsal region of cells to avoid massive actin based structures every 3 s. Time min:sec. Bar, 1 μm (Figure 6—figure supplement 1A).
Video 12
Airyscan time-lapse of mitochondrial fission in response to Ionomycin treatment in gDrp1-U2OS cell (GFP in blue) transiently expressing mApple-F-tractin (green) and mito-BFP (red).
Time lapse was taken in single z-plane in dorsal region of cells every 18 s. Time min:sec. Bar, 1 μm (Figure 6D).
Video 13
TIRF microscopy time-lapse GFP-Drp1 (270 nM) was added to TAMRA-actin filaments (1 μM, 20% TAMRA initially).
Actin filaments were polymerized for 10 min prior to GFP-Drp1 addition. Dual-color simultaneous images were collected every 1 s. Scale bar, 2 μm. 307 frames played at 75 ms frame rate (13.3-fold accelerated) (Figure 8C).
Video 14
TIRF microscopy time-lapse showing filament bundling.
GFP-Drp1 (270 nM) was added to TAMRA-actin filaments (1 μM, 20% TAMRA initially). Actin filaments were polymerized for 10 min prior to GFP-Drp1 addition. Dual-color simultaneous images were collected every 1 s. Scale bar, 2 μm. 13 frames played at 250 ms frame rate (fourfold accelerated) (Figure 8E).
Video 15
TIRF microscopy time-lapse showing filament bundling.
GFP-Drp1 (2 μM) was added to TAMRA-actin filaments (1 μM, 20% TAMRA initially). Actin filaments were polymerized for 10 min prior to GFP-Drp1 addition. Images were collected every 2 s. Scale bar, 2 μm. 46 framed played at 100 ms frame rate (20-fold accelerated). Red, yellow and blue arrows indicate bundling events (Figure 8F).
Download links
A two-part list of links to download the article, or parts of the article, in various formats.
Downloads (link to download the article as PDF)
Open citations (links to open the citations from this article in various online reference manager services)
Cite this article (links to download the citations from this article in formats compatible with various reference manager tools)
Actin filaments target the oligomeric maturation of the dynamin GTPase Drp1 to mitochondrial fission sites
eLife 4:e11553.
https://doi.org/10.7554/eLife.11553


