Role of competition between polarity sites in establishing a unique front
- Duke University Medical Center, United States
- University of North Carolina at Chapel Hill, United States
- University of Liverpool, United Kingdom
Figures
Figure 1
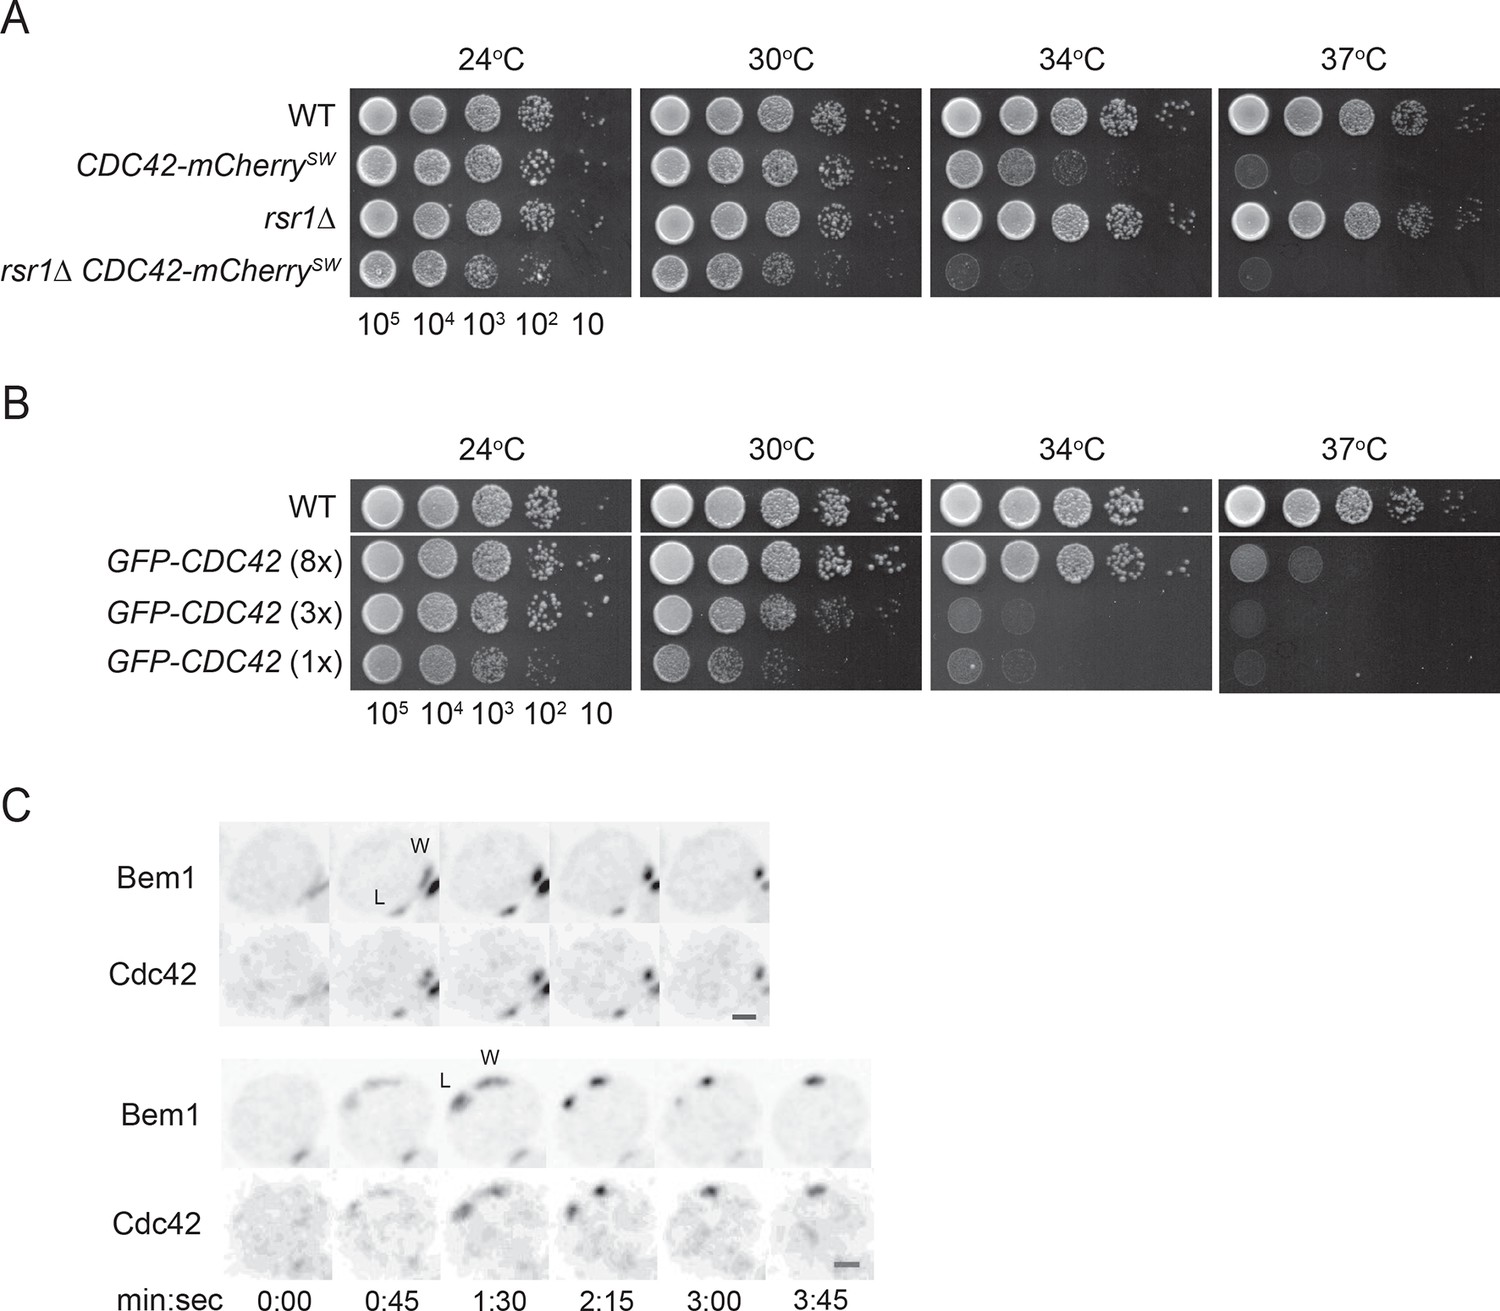
Polarity probes.
(A,B) Functionality of fluorescent Cdc42 probes. Cells of indicated strains were serially diluted in 10-fold steps from left (105 cells) to right, spotted on YEPD plates, and incubated at the indicated temperatures. (A) A construct expressing Cdc42-mCherrySW from the CDC42 promoter was integrated at URA3, and the endogenous CDC42 was deleted. The growth defect of cells expressing only Cdc42-mCherrySW was more severe in the rsr1Δ context. Strains DLY8155, 16855, 5069 and 17127. (B) A construct expressing GFP-Cdc42 is partially functional. Strains carrying GFP-Cdc42 replacing the endogenous Cdc42 showed growth defects at higher temperatures. Higher expression of the probe partially rescued the temperature sensitivity. Strains DLY8155, 13891, 16,730 and 15016. (C) Bem1-GFP and Cdc42-mCherrySW cluster and disappear concurrently, validating the use of the functional Bem1-GFP as a polarity reporter. Inverted maximum-intensity projections from movies of cells (DLY17110) synchronized by hydroxyurea arrest-release. Time in min:s. L: losing cluster. W: winning cluster.
Figure 2
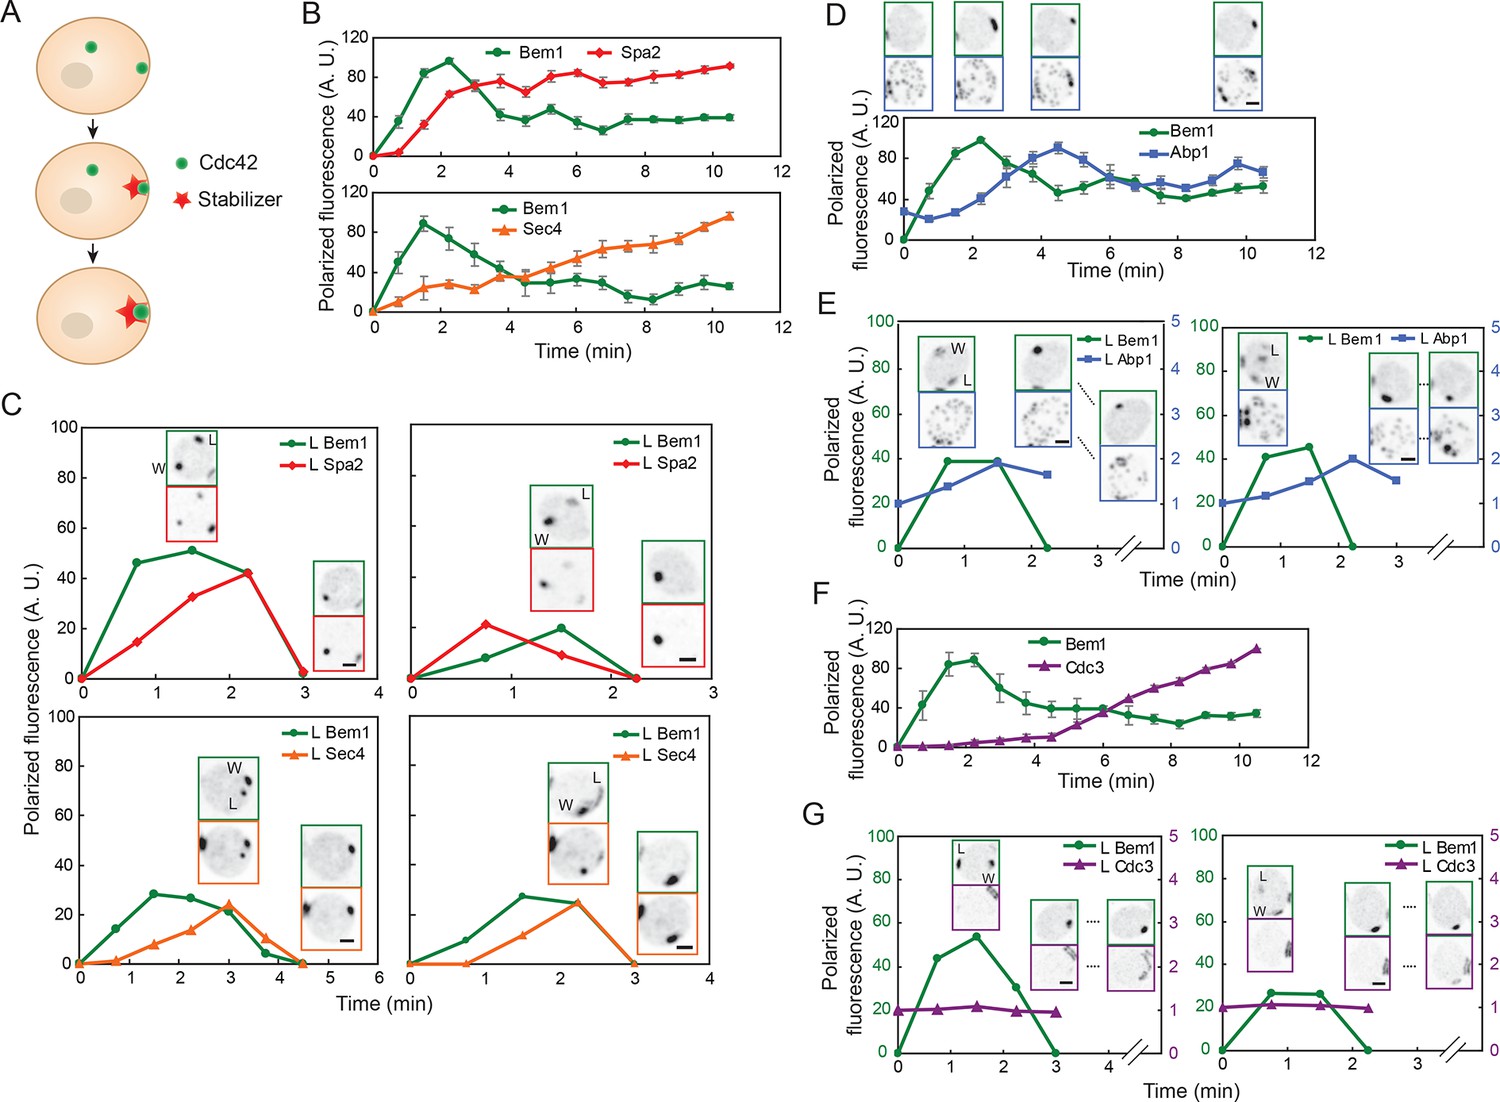
Localization of actin cables, actin patches, and septin rings during competition between polarity clusters.
(A) Stabilizer hypothesis: only the cluster that acquires the stabilizer persists to become the bud site. (B) Actin cable markers Spa2-mCherry (upper: DLY17251) and GFP-Sec4 (lower: DLY17374) polarize soon after Bem1-GFP. Data from two-color movies. Summed intensity of the polarized signal is normalized to the peak value within the displayed interval for each cell. t=0 is 45 s before the first detection of polarized signal. Plots show average ± SEM (n=7 cells). (C) In cells that have two-cluster intermediate stages, actin cable markers appear at both clusters and then disappear from the losing cluster. Graphs plot summed intensity of Bem1-GFP and Spa2-mCherry (DLY17251) or GFP-Sec4 and Bem1-tdTomato (DLY17374) at the losing cluster, normalized to the peak summed intensity at both clusters. Inset: images of the cells at the indicated times. L: losing cluster. W: winning cluster. (D) Clustering of actin patches (marker Abp1-mCherry) at the polarization site is delayed relative to Bem1-GFP. Graph: data from two-color movies (DLY11320) displayed as in (B) (n=5 cells). Top: cell snapshots at indicated times from a representative cell. (E) In cells that have two-cluster intermediate stages, actin patches do not cluster until after a winner emerges. Graphs plot summed intensity of Bem1-GFP and Abp1-mCherry (DLY11320) at the losing cluster. Inset: images of the cells at the indicated times. L: losing cluster. W: winning cluster. (F) Septins (marker Cdc3-mCherry) polarize well after Bem1-GFP. Data from two-color movies (DLY13098) displayed as in (B) (n=4 cells). (G) In cells that have two-cluster intermediate stages, septins are not recruited until after a winner emerges. Graphs plot summed intensity of Bem1-GFP and Cdc3-mCherry (DLY13098) at the losing cluster. Inset: images of the cells at the indicated times. L: losing cluster. W: winning cluster. Scale bars, 2 µm.
Figure 3
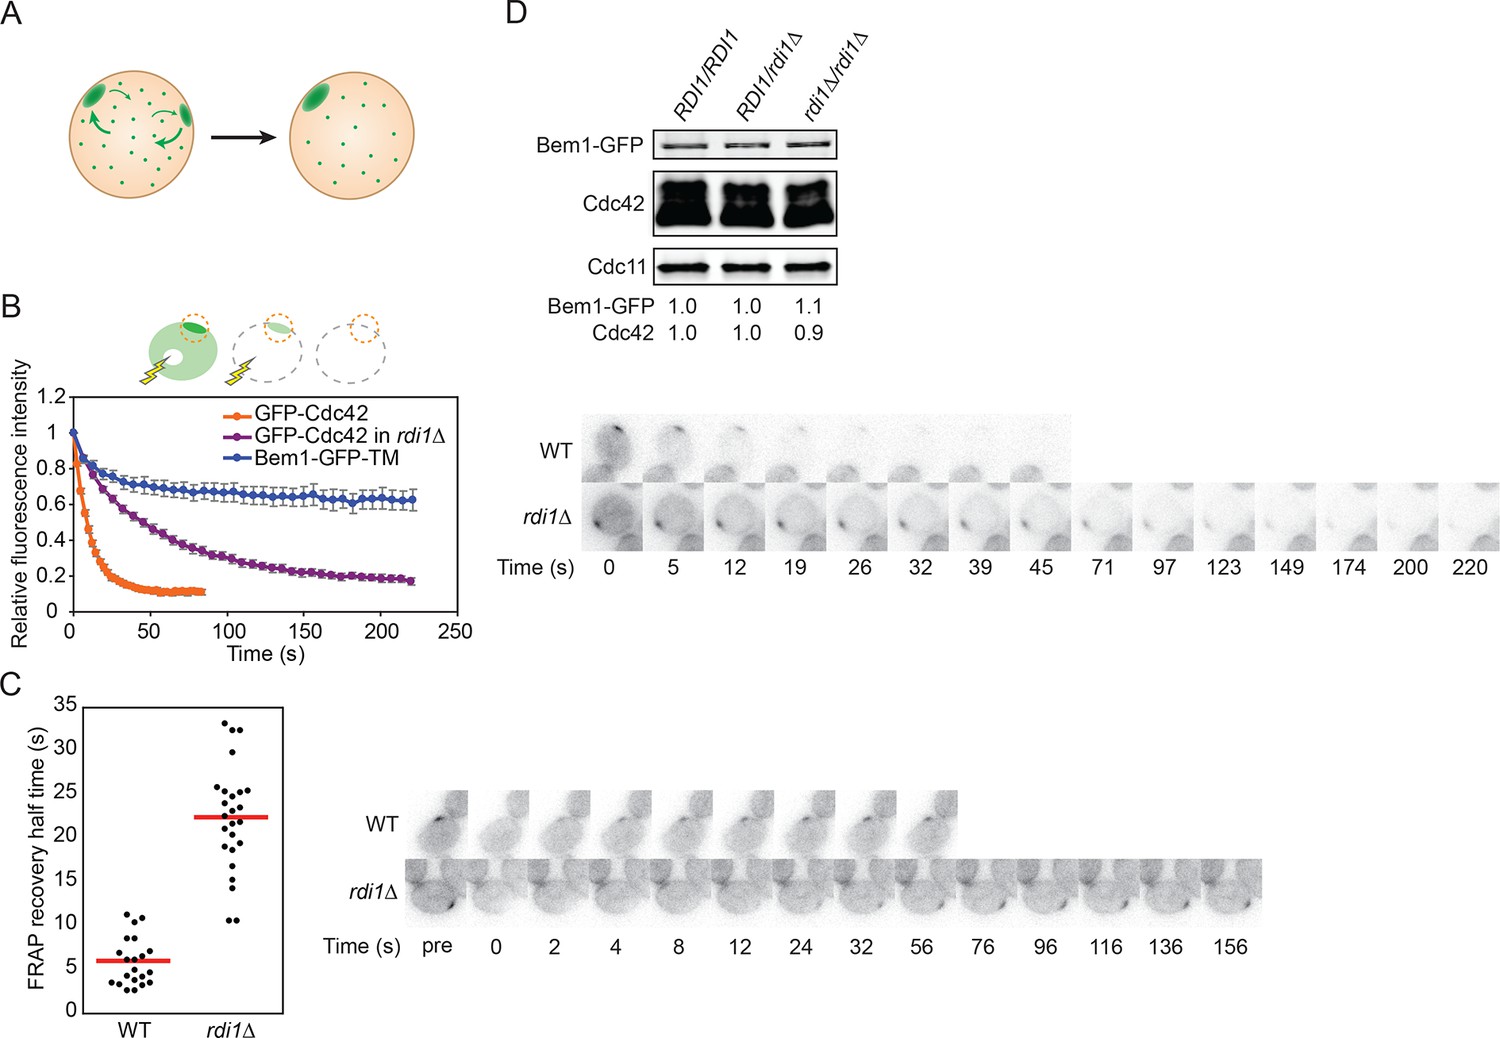
Slowing exchange of Cdc42 in and out of polarity clusters.
(A) Competition hypothesis: clusters compete for shared components from the cell interior. (B) FLIP analysis shows that Cdc42 exchanges between membrane and cytoplasm more slowly in rdi1Δ cells (DLY14898) than in RDI1 cells (DLY13920). Bem1-GFP-TM (DLY9641) is a control non-exchanging trans-membrane protein. Cartoon: the laser beam periodically bleached a region of the cytoplasm, and the fluorescence at the polarity patch (dotted red circle) was quantified. Graph: normalized intensity, average ± SEM (n>7 cells). Strips: single z plane snapshots of representative cells at the indicated times. t=0 is right before the first bleaching event. (C) FRAP analysis of Cdc42 exchange at the polarized patch in the same cells. The polarized patch was bleached once and the fluorescence recovery measured. Each dot represents the recovery half time of an individual cell. Red lines: average. Strips: single z plane snapshots of representative cells at the indicated times after the initial bleaching. Pre is right before the bleaching event. (D) Abundance of Cdc42 and Bem1 are unaffected by the presence or dose of Rdi1. Cdc11 (septin): loading control. Numbers represent Western blot signal normalized to the wild-type. Strains: DLY9200, DLY15241, DLY17301.
Figure 4

The polybasic-prenyl anchor allows slow exchange between membrane and cytoplasm.
(A) Strategy: append Cdc42 polybasic-prenyl motif to Bem1 and Cdc24. (B) Cells expressing Bem1-GFP-CAAX as the sole source of Bem1 do not require the formin Bni1. Tetrad dissection from a BNI1/bni1Δ BEM1-GFP-CAAX/BEM1 diploid (DLY17856). Circles: viable bni1Δ BEM1-GFP-CAAX haploids. Crosses: inviable bni1Δ BEM1-GFP-CAAX haploids. Table: quantification of% viability. (C) DIC images of viable bni1Δ BEM1-GFP-CAAX haploid cells (DLY17859) grown at 24°C. Cells show wide necks typical of bni1Δ mutants. Scale bar, 5 µm. (D) Polarization of Bem1-CAAX does not require F-actin. Bem1-GFP-CAAX (top), Whi5-tdTomato (middle), and merged (bottom) images from a representative cell (DLY20283) polarizing in 200 µM LatA at 24°C. The cell-cycle marker Whi5 exits the nucleus upon G1 CDK activation, which provides the signal for polarization (indicated by green arrow). Strips show inverted maximum projections. Scale bar = 5 µm. (E) Bem1-CAAX can be sequestered in the cytoplasm. Rapamycin induces dimerization between FKBP and FRB. Cells containing FKBP-tagged ribosomes and FRB-tagged Bem1-GFP-CAAX (DLY20489) were placed on slabs containing DMSO (top: negative control) or 50 µg/ml rapamycin (bottom) and imaged at 24°C. Binding to cytoplasmic ribosomes delocalizes Bem1-CAAX from polarity sites. Strips show inverted maximum projections. Scale bar, 5 µm.
Figure 5
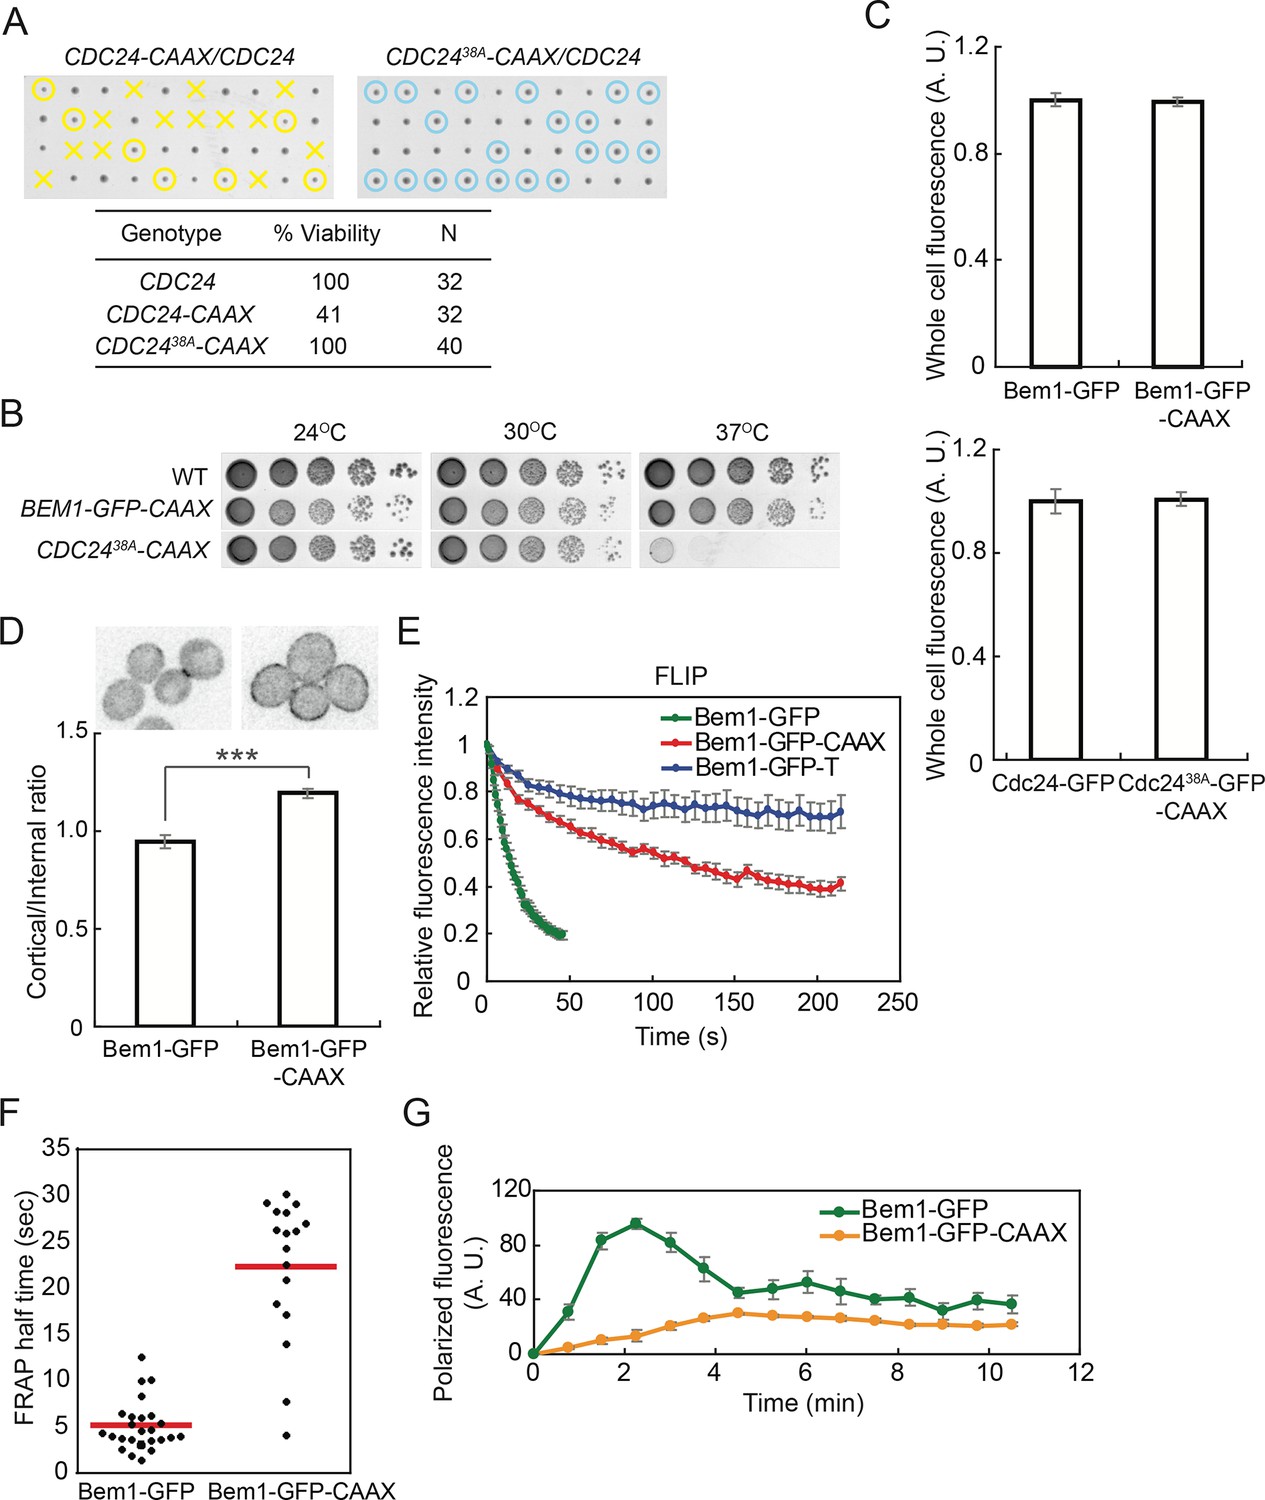
Slowing exchange of Bem1 and Cdc24 in and out of polarity clusters.
(A) Cdc24-CAAX is poorly functional but viability can be rescued by making nonphosphorylatable Cdc2438A-CAAX. Tetrad dissection of heterozygotes for CDC24-CAAX (DLY18402) or Cdc2438A-CAAX (DLY18401): each column has 4 spore colonies from one tetrad. Circles: viable mutants. Crosses: inviable mutants. Table: quantification of% viability. (B) Cells with Bem1-CAAX as the sole source of Bem1 (DLY17732) are healthy while those with Cdc2438A-CAAX as the sole source of Cdc24 (DLY18565) are temperature-sensitive. (C) Appending the polybasic-prenyl motif does not affect abundance of Bem1 or Cdc24. Quantification of whole-cell fluorescence intensity of the indicated GFP-tagged probes (Bem1: DLY11780 and DLY17732; Cdc24:DLY12383 and DLY18417) imaged on the same microscope slab. Average ± SEM of normalized mean intensity per cell (n=11 cells, Bem1; n=14 cells, Cdc24). (D) Graph: ratio of cortical to internal fluorescence in strains expressing Bem1-GFP (DLY18920) or Bem1-GFP-CAAX (DLY18849): average ± SEM (n>50 cells). *** p<0.001 by t-test. Top: inverted single-plane images of representative cells. (E) FLIP analysis shows that Bem1-GFP-CAAX (DLY17732) exchanges in and out of the polarity site more slowly than Bem1-GFP (DLY9201). Bem1-GFP-TM (DLY9641) is a control non-exchanging trans-membrane protein. Graph: normalized intensity, average ± SEM (n>10 cells). (F) FRAP analysis in the same cells. Each dot represents the recovery half time of an individual cell. Red lines: average. (G) Polarization dynamics: Bem1-GFP-CAAX accumulates more slowly than Bem1-GFP. Summed intensity of the polarized signal is normalized to the peak value within the displayed interval for each cell. Peak levels of polarized Bem1-GFP-CAAX (DLY17732) are lower than those for Bem1-GFP (DLY11780) based on imaging of both strains on same slab, and the graphs were scaled accordingly. t=0 is 45 s before the first detection of polarized signal. Plots show average ± SEM (n=7 cells).
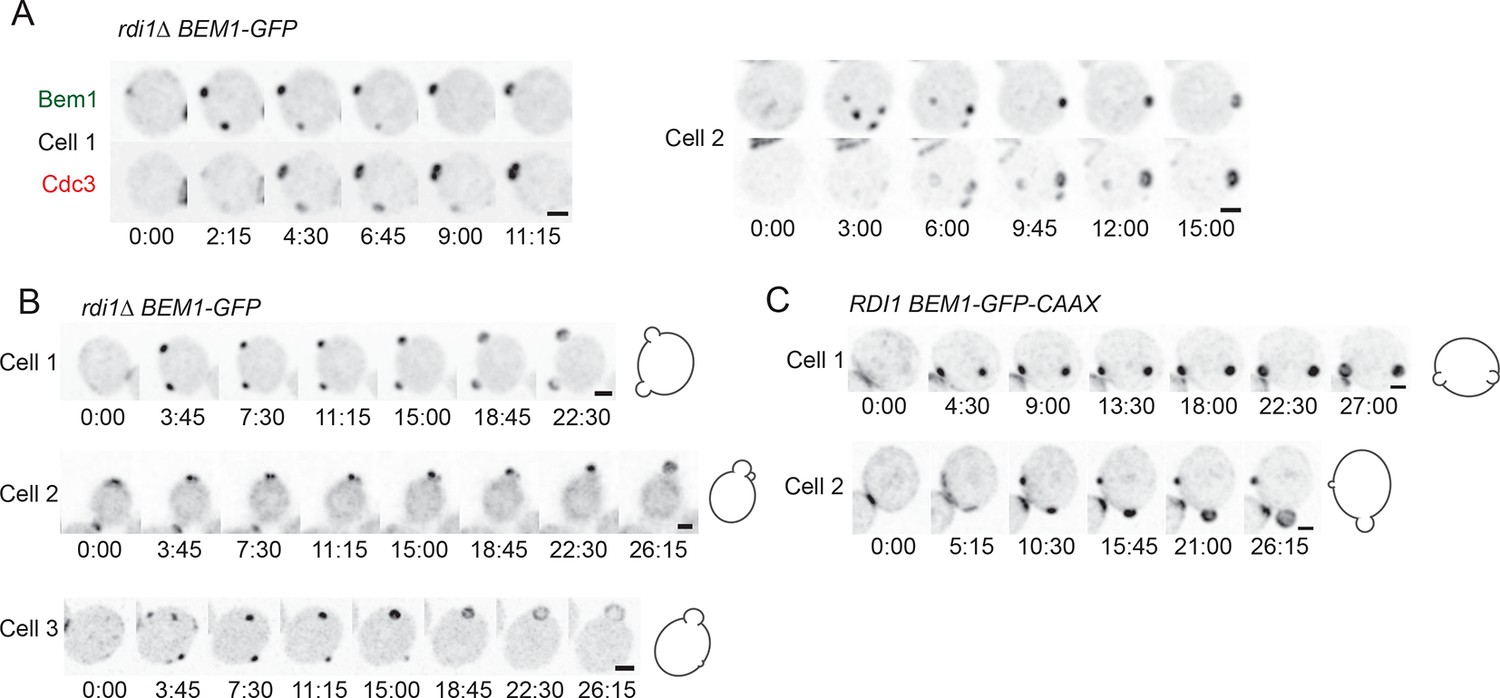
Figure 6

Slow competition between polarity clusters in cells with slow membrane/cytoplasm exchange of either Cdc42 or Bem1.
Inverted maximum-intensity projections from movies of cells synchronized by hydroxyurea arrest-release. (A) Prolonged competition in representative rdi1Δ cell (DLY17109) expressing Bem1-GFP and Cdc42-mCherrySW. (B) Prolonged competition in representative rdi1Δ cell (DLY15782) expressing Bem1-GFP and PBD-tdTomato (probe for GTP-Cdc42). (C) Prolonged competition in representative BEM1-GFP-CAAX cell (DLY12576) expressing Bem1-GFP-CAAX and Spa2-mCherry. (D) Prolonged competition in representative cdc42R66A cell (DLY15572: mutant fails to bind Rdi1) expressing Bem1-GFP. (E) Quantification of coexistence intervals (time between the first detection of >1 polarity clusters and disappearance of losing clusters). Each dot represents one cell. Red lines: average. (F) Quantification of growth and competition phases. Multiple clusters initially all grow in intensity (growth), after which losing cluster(s) shrink and disappear (competition). Time: min:s. Scale bars, 2 µm.
Figure 7
Formation of multiple septin rings and buds due to slow competition.
(A) In cells with slow competition, septins are recruited to multiple polarity clusters but competition continues. Inverted maximum-intensity projections from movies of rdi1Δ cells (DLY14535) synchronized by hydroxyurea arrest-release. Representative cells expressing Bem1-GFP and Cdc3-mCherry. (B) Simultaneous emergence of two buds in rdi1Δ cells (DLY17301) expressing Bem1-GFP. Cell 1: buds far apart, equal size. Cell 2: buds close together. Competition continues after budding (smaller bud abandoned). Cell 3: buds far apart, unequal size. Competition continues after budding (smaller bud abandoned). (C) Simultaneous emergence of two buds in BEM1-GFP-CAAX cells (DLY17732). Cell 1: buds far apart, equal size. Cell 2: unequal buds, larger grows more rapidly. Cartoons show cell outlines at final timepoint. Scale bars, 2 µm.
Figure 8
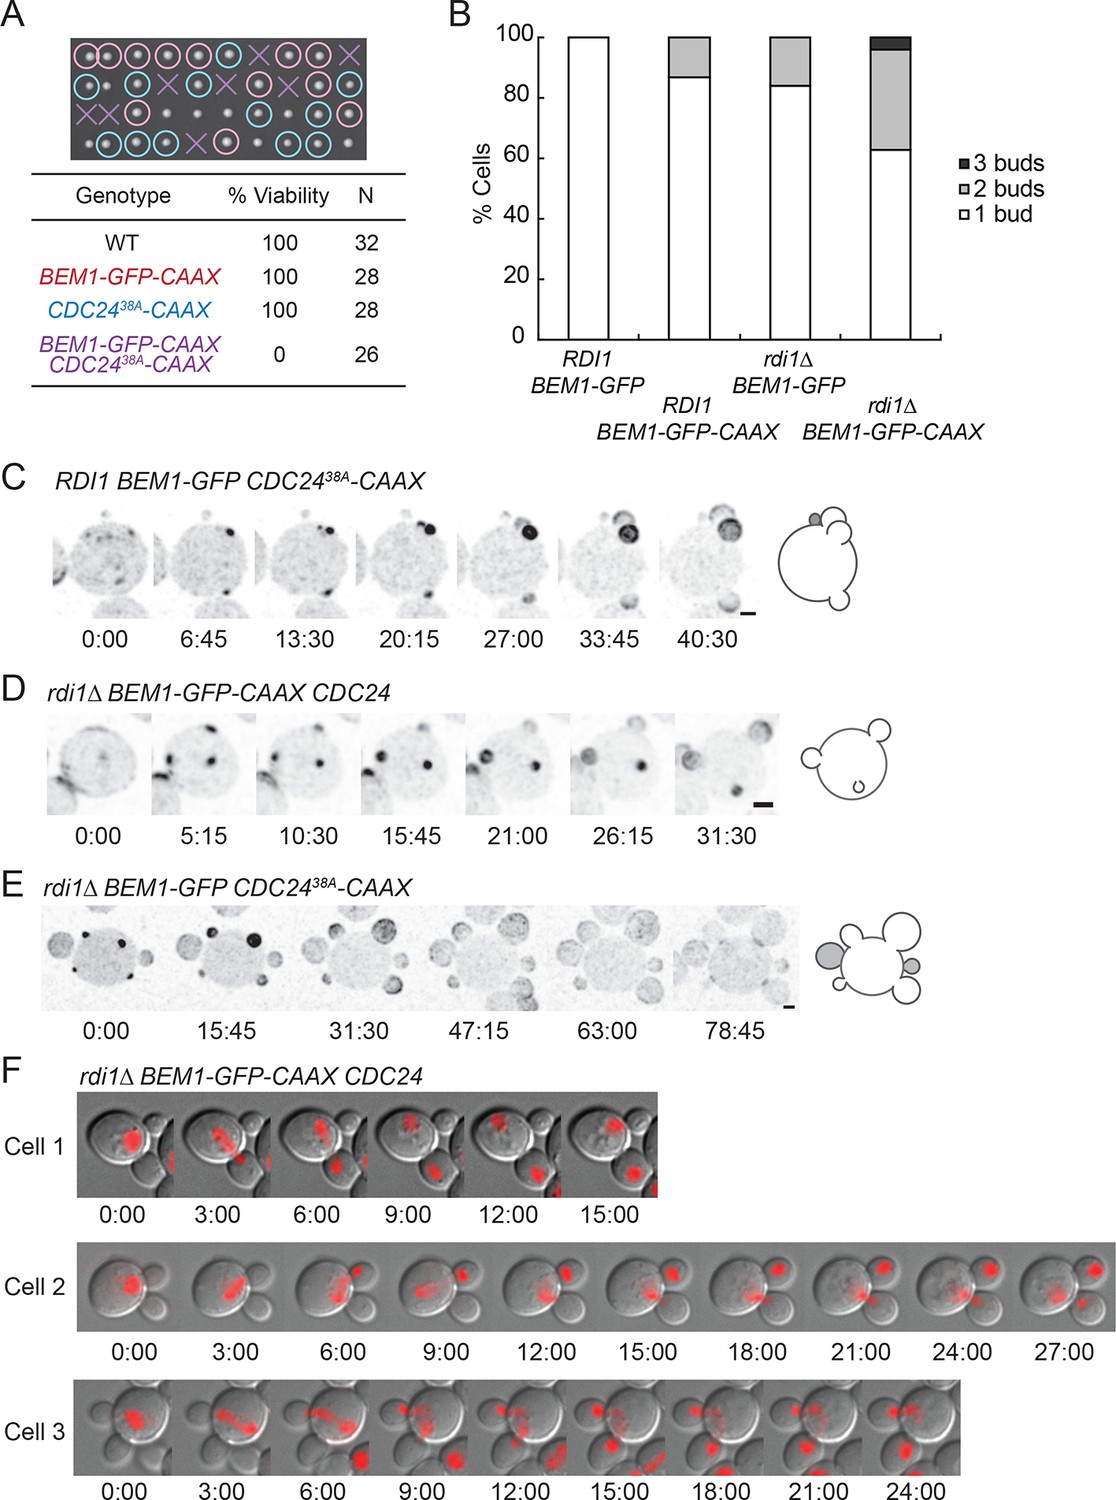
Additive effects of combining slow-exchange genotypes.
(A) Combining BEM1-GFP-CAAX and CDC2438A-CAAX is lethal. Tetrad dissection of heterozygotes for BEM1-GFP-CAAX and CDC2438A-CAAX (DLY18810): each column has 4 spore colonies from one tetrad. Circles: viable mutants. Crosses: inviable mutants. Table: quantification of% viability. (B) Combining rdi1Δ with BEM1-GFP-CAAX yields increased incidence of multi-budding. Quantification of% cells forming one, two, or three buds simultaneously (n>60 cells for each strain). Strains: DLY17732, DLY17301, DLY17941. (C) Simultaneous emergence of three buds in a CDC2438A-CAAX cell (DLY18565) expressing Bem1-GFP. An abandoned bud from the previous cell cycle is indicated in grey. (D) Simultaneous emergence of three buds in a rdi1Δ BEM1-GFP-CAAX cell (DLY17941). (E) Simultaneous emergence of four buds in a rdi1Δ CDC2438A-CAAX cell (DLY18643) expressing Bem1-GFP. Abandoned buds from the previous cell cycle indicated in grey. (F) Chromosome segregation in rdi1Δ BEM1-GFP-CAAX (DLY18196) cells that make two buds. Chomatin visualized with HTB2-mCherry (histone probe). Cell 1: mother and one bud inherit nuclei, other bud is left vacant. Cells 2 and 3: mothers and buds appear to fight for single nuclei. Scale bars, 2 µm.
Figure 9
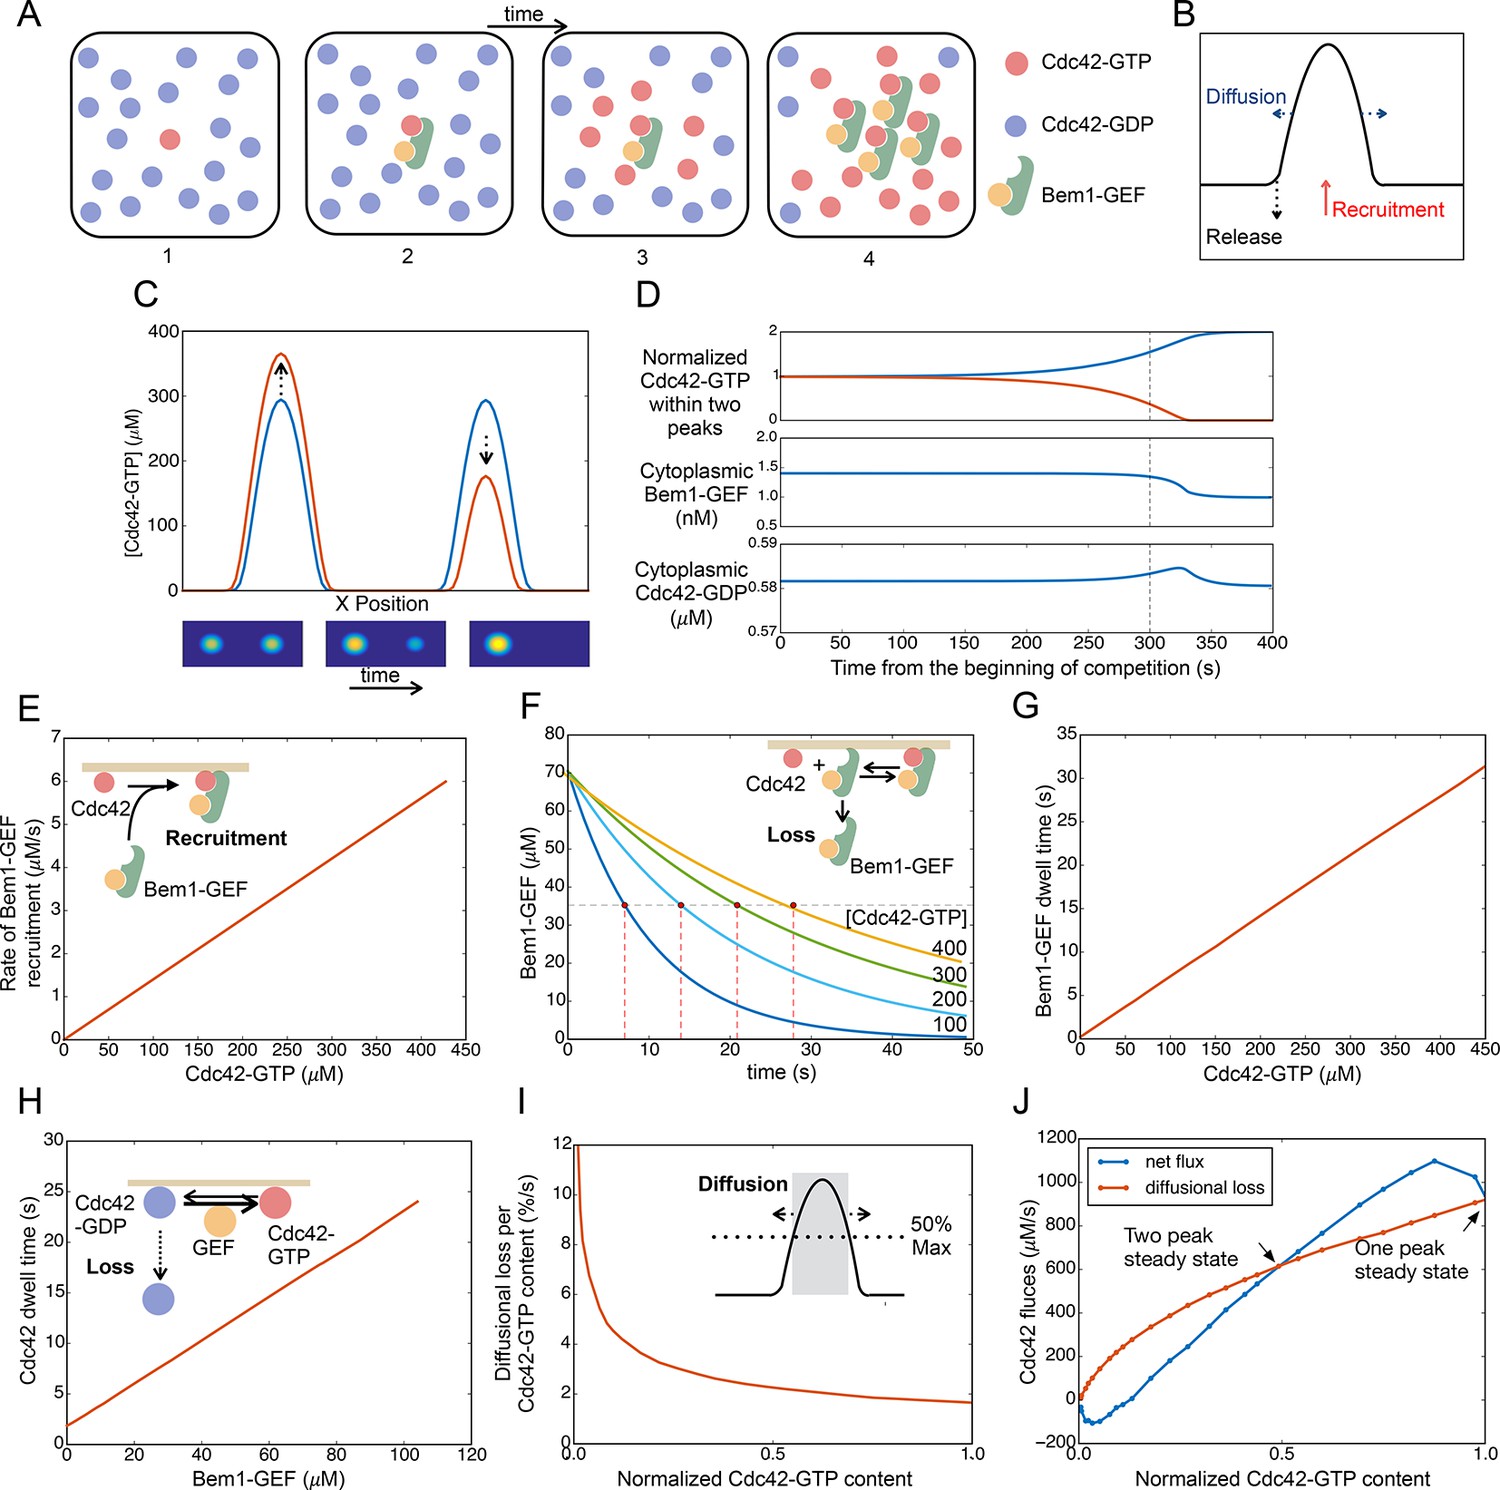
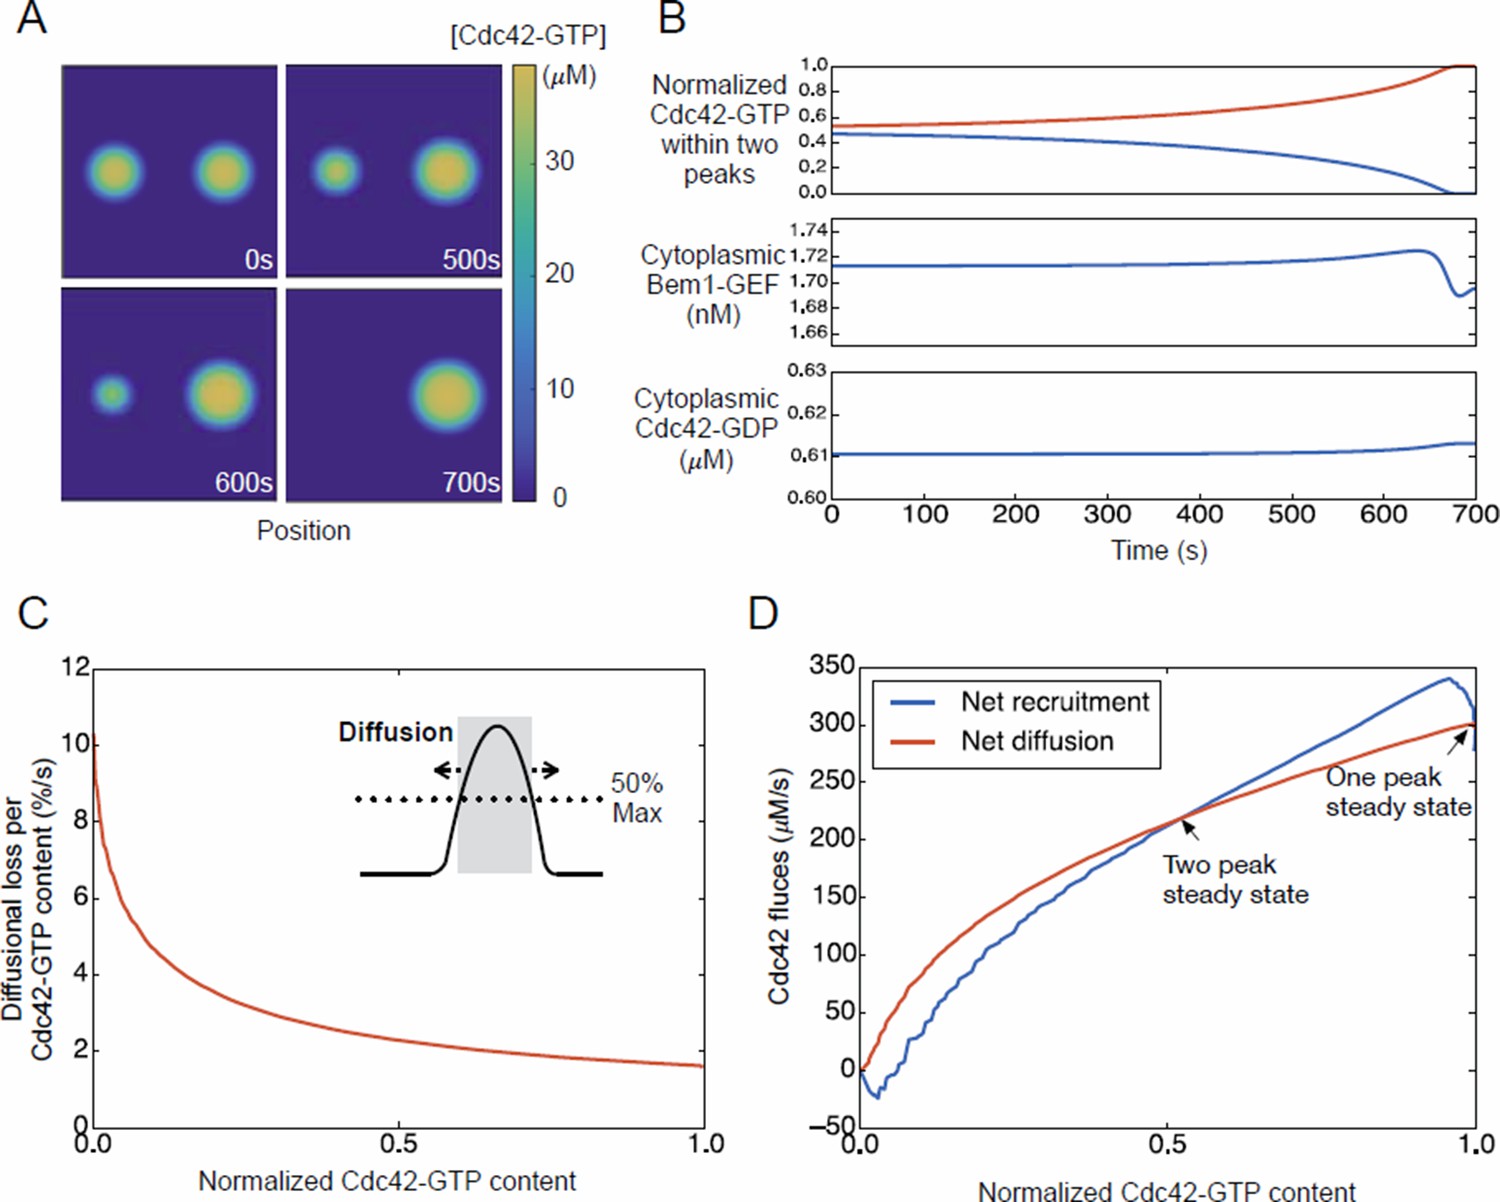
Competition between clusters in a computational model.
(A) Cartoon depicting positive feedback. Snapshots of a patch of plasma membrane in which stochastic activation of Cdc42 (1) leads to binding of Bem1-Cdc24 complex from the cytoplasm (2). Cdc24 (GEF) then loads neighboring Cdc42 with GTP (3), leading to binding of more Bem1-Cdc24 complexes and further Cdc42 activation (4). (B) Steady-state polarity peak: polarity protein concentration (Y axis) along the cell perimeter (X axis). The peak is constantly renewed by recruitment of polarity factors from the cytoplasm (red) to combat loss by diffusion (blue) and release of factors back to the cytoplasm (black). (C) Simulating competition: two equal peaks (blue) coexist in an unstable steady state: any perturbation drives growth of a winning peak with concomitant shrinkage of the losing peak (red). The graph represents a cross-section of a two-dimensional simulation, for which snapshots are shown below the graph. Color: Cdc42 concentration. (D) Top: Starting from an unstable steady state with two equal peaks, one peak (blue) grows larger at the expense of the other (red). During the competition phase (before the dashed line), the cytoplasmic concentrations of both the Bem1-GEF complex (middle) and GDP-Cdc42 (bottom) remained constant. Towards the end, the winning peak grew further and depleted more Bem1-GEF complexes from the cytoplasm. (E) Larger peaks have an advantage in recruiting Bem1-Cdc24 complexes. At the center of the peak, the rate of complex recruitment increases with the GTP-Cdc42 concentration. (F) Larger peaks have an advantage in retaining Bem1-Cdc24 complexes. Inset: cartoon of the relevant reactions. The curves represent the loss of Bem1-Cdc24 complexes with time, at the indicated GTP-Cdc42 concentrations. Dashed red lines indicate the half-times (dwell times) for each curve. (G) The dwell time computed from the simulations in (F) increases with the GTP-Cdc42 concentration. (H) Larger peaks have an advantage in retaining Cdc42. The dwell time of GDP-Cdc42 was computed for varying GEF concentrations, as described for Bem1-Cdc24. Inset: cartoon of the relevant reactions. (I) Larger peaks lose a smaller proportion of their content to lateral diffusion. Rate of escape of Cdc42 from the peak by diffusion across the waistline (as a proportion of the Cdc42 content), plotted against the total Cdc42 content within the waistline. Calculated from the simulation in (C). Inset: defining a 'waistline' for the polarity peak. (J) Rate balance plot for competition between two peaks. The net fluxes of Cdc42 into the peak (recruitment from the cytoplasm: blue) and out of the peak (diffusion: red) from the simulation in (C) were plotted against the Cdc42 content within the waistline (normalized to the content of the winning peak). Fluxes are balanced at two steady states: an unstable steady state with two peaks (middle), and a stable steady state with one peak (winner, right; loser, left).
Figure 10
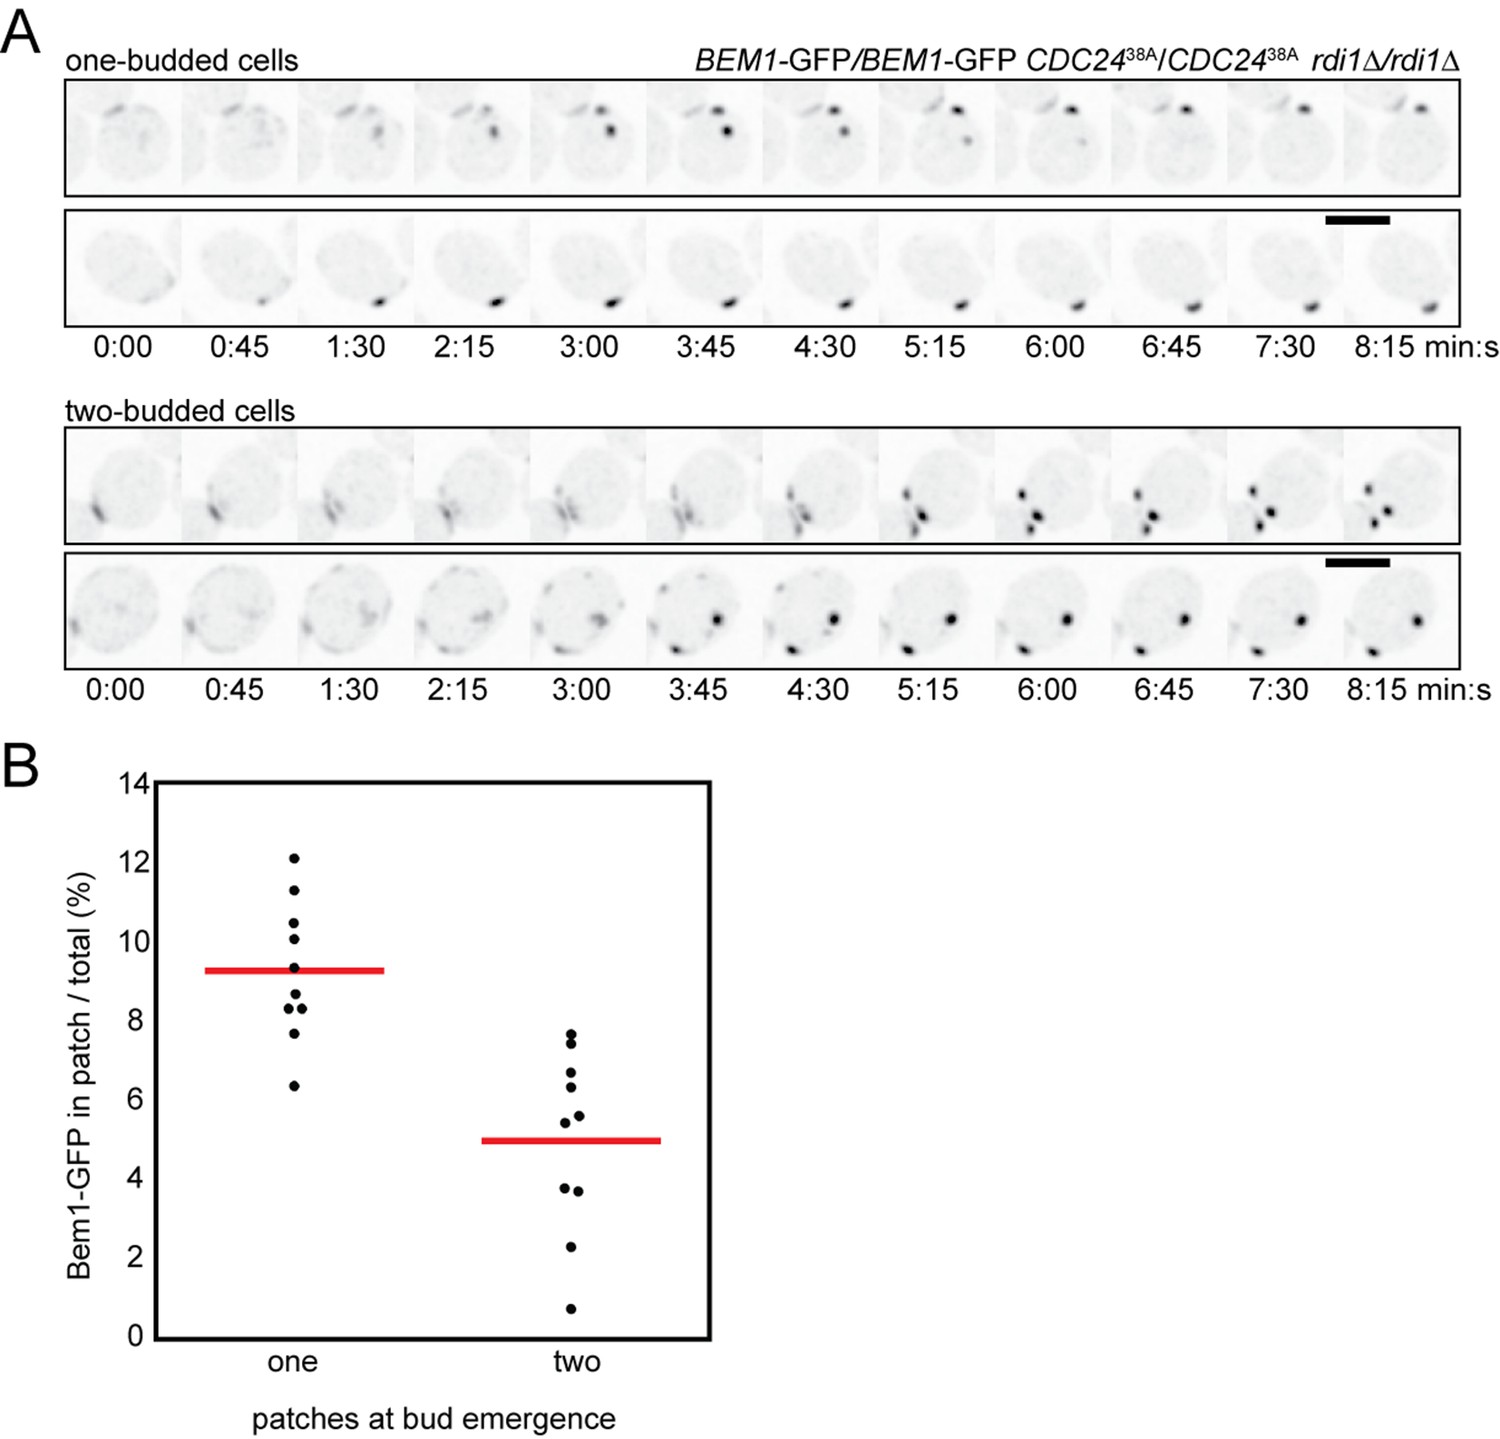
Competition in cells with impaired negative feedback.
(A) Inverted maximum-intensity projections of CDC2438A rdi1Δ cells (DLY18500) expressing Bem1-GFP synchronized by hydroxyurea arrest-release. Top: representative cells that resolve competition and bud once. Bottom: representative two-budded cells. (B) Bem1-GFP in the polarity patch immediately before bud emergence was quantitated as a% of the total Bem1-GFP in cells that made one two buds. Each dot represents one patch. Two-budded cells exhibited less Bem1 in each patch compared to one-budded cells.
Figure 11
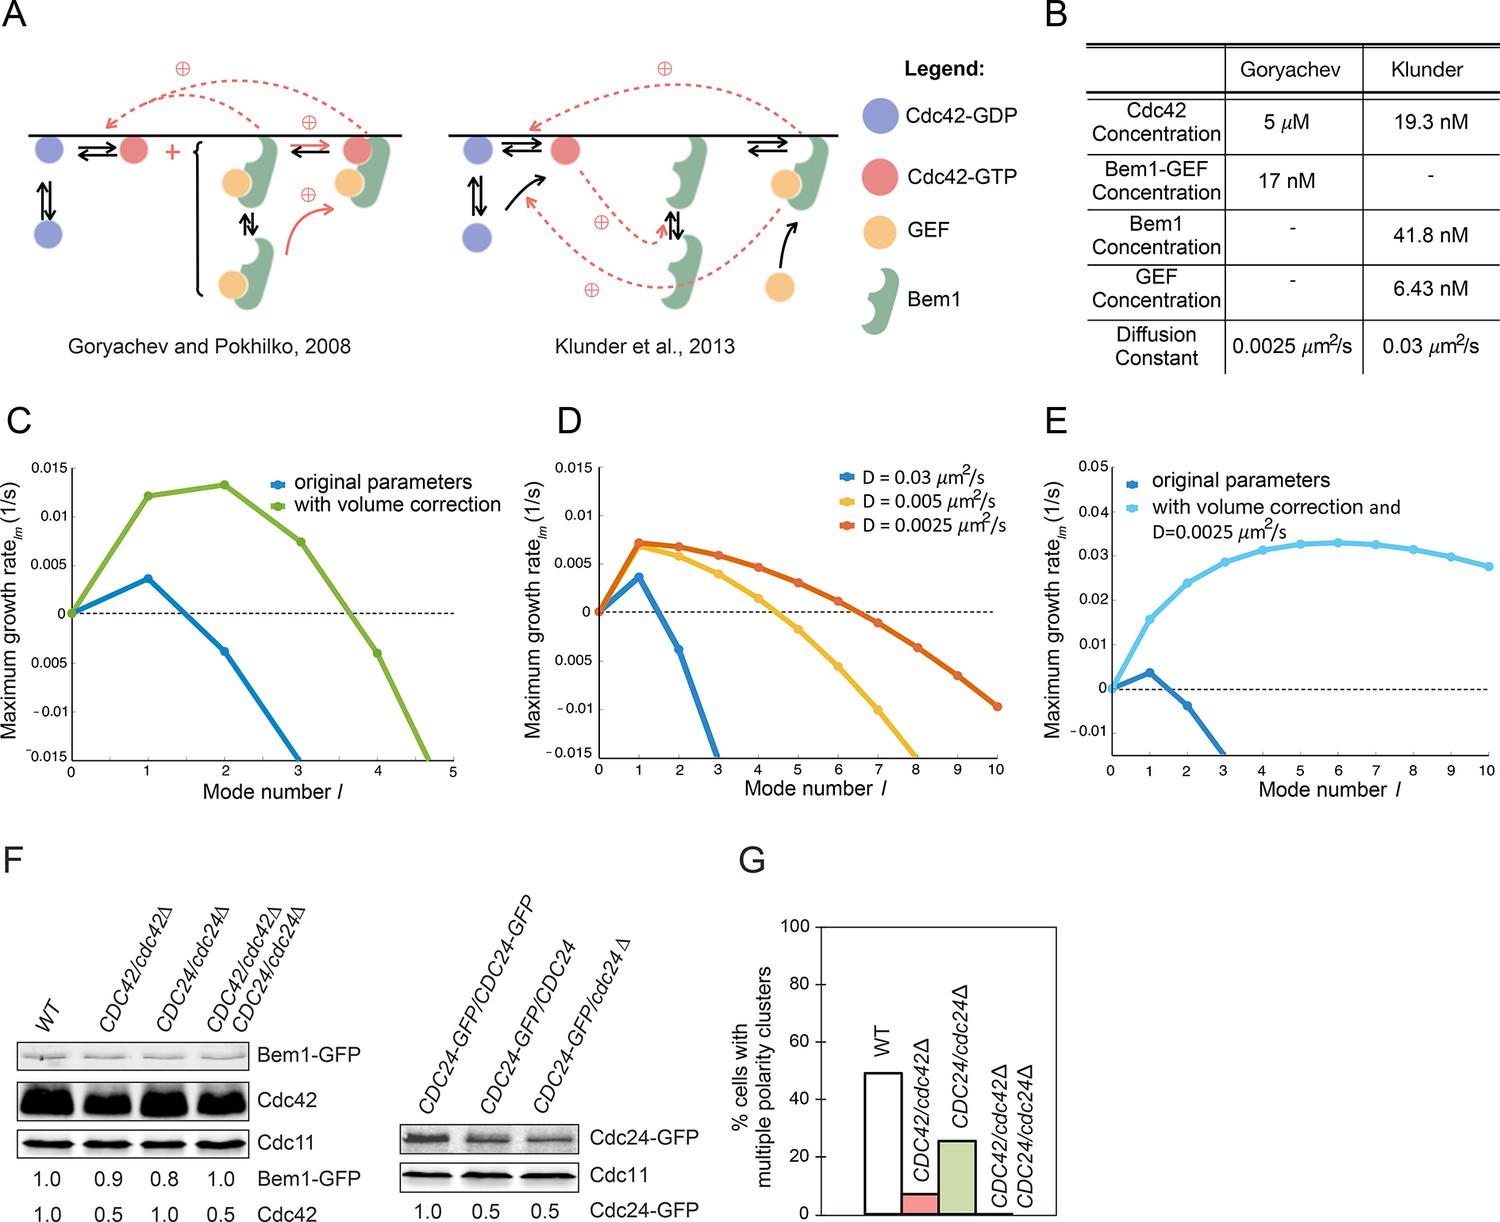
Modeling the initial emergence of polarity clusters.
(A) Interactions of polarity factors in two published models. (B) Protein concentrations and membrane species diffusion constants in the two models. (C) Increasing protein concentrations would lead to emergence of more than one polarity cluster. Linear stability analysis of the Klunder et al. model. Blue: Klunder et al. parameters. Green: same parameters but correcting the protein concentrations to account for the larger model cell. (D) Effect of slowing diffusion. (E) Effect of increasing protein concentrations as in (C) and slowing diffusion to 0.0025 μm2/s. (F) Reducing gene dosage 2-fold leads to a 2-fold reduction in Cdc42 or Cdc24 levels without affecting Bem1-GFP levels. Western blot analysis of Cdc42, Bem1-GFP, and Cdc24 levels in the indicated strains: DLY9200, DLY13824, DLY17817, DLY18215. Cdc11 (septin): loading control. Numbers represent Western blot signal normalized to the wild-type. (G) Percentage of cells with indicated genotypes (DLY9200, DLY13824, DLY17817, DLY18215) in which a multi-cluster intermediate was detected in movies of cells synchronized by hydroxyurea arrest-release (n>70 cells).
Figure 12
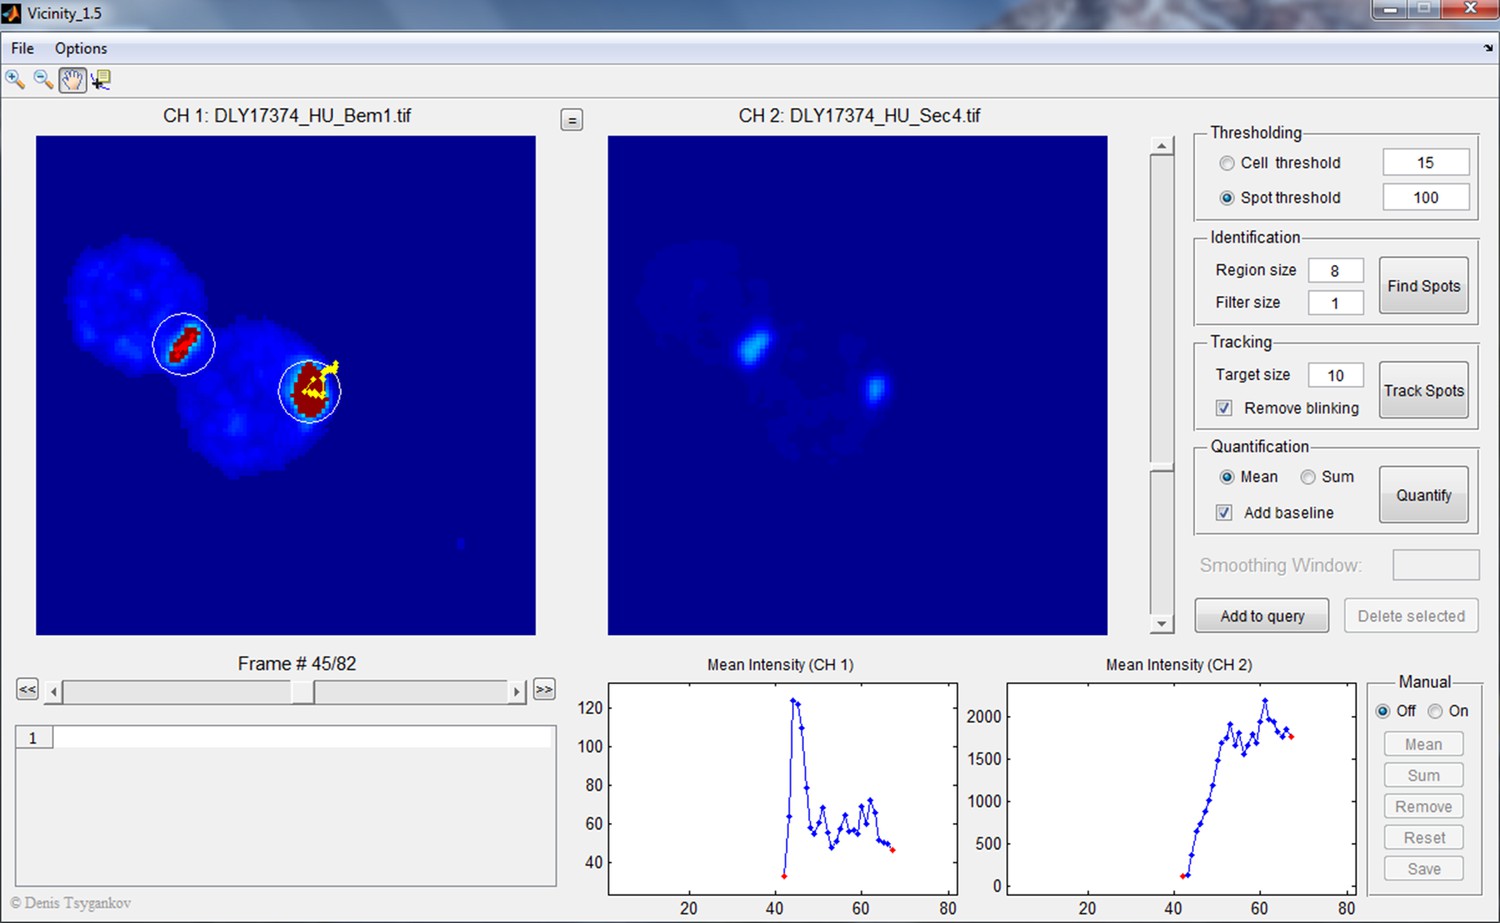
Screenshot illustrating Vicinity GUI operation.
The upper left of this interface shows the sum projection z-stacks from two fluorescence channels (Bem1-tdTomato and GFP-Sec4 in this case) side by side. The upper right side is the control panel where the threshold for selecting cells and polarity spots, radius of circular regions, filter size, and target size are set. Users can choose to quantify either mean or sum intensity of the pixels in the circular regions. In this example, both the polarity spot and the neck signal were marked in circular regions because their intensities were above the spot threshold, but only the polarity spot was selected for quantification (the track was highlighted in yellow). The intensity changes in the selected region over time (in both channels) are reported in the lower right side of the interface.
Author response image 1

Competition in BEM1/bem1Δ and CDC24/cdc24Δ hemizygotes.
(A) Coexistence time for multi−cluster intermediates is plotted (each dot is one cell) for strains of the indicated genotypes. (B−D) Inverted maximum−projection strips showing examples of competition in wild−type (B), BEM1/bem1Δ (C), and CDC24/cdc24Δ (D) strains. Arrows indicate multiple clusters, and after competition the winning cluster is indicated by a black arrow while the position(s) of the losing cluster(s) are indicated by fainter grey arrow(s). The polarity marker is Bem1−GFP in all cases.
Author response image 2
Competition in a model with negative feedback.
(A) Snapshots of competition from two−peak unstable steady state. (B) Cytoplasmic protein levels during competition. (C) Flux plot as in Figure 9J. Parameters were as in Kuo et al. 2014. Overall behavior is very similar to that shown in Figure 9 for model with no negative feedback.
Videos
Video 1
Rapid resolution of multicluster intermediate during polarity establishment.
Strain DLY17110 was imaged following release from HU arrest. Inverted maximum-intensity projections of Bem1-GFP (left) and Cdc42-mCherrySW (right) of two representative cells (upper and lower) are shown. Mother-bud pairs first go through cytokinesis (markers go to the neck), and then polarize both markers to two sites (arrows). One polarity cluster then disappears, leaving a single winner that then fluctuates in intensity and promotes bud emergence. Time in h:min:s.
Video 2
Vesicle marker Sec4 accumulates at both winning and losing polarity clusters.
Strain DLY17374 was imaged following release from HU arrest. Inverted maximum-intensity projections of Bem1-tdTomato (left) and Sec4-GFP (right) are shown. Mother-bud pairs first go through cytokinesis (markers go to the neck), and polarize first Bem1 and then Sec4 to two sites (arrows). One polarity cluster then disappears, leaving a single winner. Time in h:min:s.
Video 3
Actin patch marker Abp1 does not accumulate at polarity clusters until after one cluster has won.
Strain DLY11320 was imaged following release from HU arrest. Inverted maximum-intensity projections of Bem1-GFP (left) and Abp1-mCherry (right) are shown. Mother-bud pairs first go through cytokinesis (markers go to the neck), polarize Bem1 to two sites (arrows), and one polarity cluster then disappears, leaving a single winner. Abp1 patches are distributed until one Bem1 cluster wins, after which they accumulate in that vicinity and the bud emerges. Time in h:min:s.
Video 4
Septins do not accumulate at polarity clusters until after one cluster has won.
Strain DLY13098 was imaged following release from HU arrest. Inverted maximum-intensity projections of Bem1-GFP (left) and Cdc3-mCherry (right) are shown. The septin (Cdc3) starts out at the mother-bud neck, where it is joined by Bem1 as the cell goes through cytokinesis. Bem1 then polarizes to two sites (arrows), and one polarity cluster then disappears, leaving a single winner (a second brief competitor can also be seen at the old neck). After one Bem1 cluster wins (and then fluctuates in intensity), septins accumulate in a ring around the cluster. Time in h:min:s.
Video 5
Sequestering Bem1-CAAX in the cytoplasm Rapamycin induces tight binding between FKBP and FRB.
In a strain (DLY20489) where ribosomes are tagged with FKBP (2 copies C-terminal to Rpl13a) and Bem1-GFP-CAAX is tagged with FRB (2 copies between Bem1 and GFP), rapamycin (50 µg/ml, right) delocalized Bem1-GFP-CAAX, but DMSO control (left) did not. Deconvolved, inverted maximum projection images. Time in min:s. Bar, 5 µm.
Video 6
Slow resolution of multicluster intermediate in rdi1Δ cells allows multiple septin-containing sites to form.
Strain DLY14535 was imaged following release from HU arrest. Inverted maximum-intensity projections of Bem1-GFP (left) and Cdc3-mCherry (right) are shown. At least 4 clusters of Bem1 form in this cell, all of which persist long enough to acquire some septins. After a Bem1 cluster disappears, the septins at that site also disappear, leaving a single winner for both Bem1 and Cdc3 (septin). Time in h:min:s.
Video 7
Cells with slowed exchange of polarity proteins occasionally generate two buds.
A representative rdi1Δ cell (left, DLY17301, with Bem1-GFP probe) and BEM1-GFP-CAAX cell (right, DLY17732) imaged following release from HU arrest. Both cells generated two persistent polarity sites, giving rise equal (left) or unequal (right) buds. Time in h:min:s.
Video 8
Simultaneous formation of four buds.
An rdi1Δ CDC2438A-CAAX cell expressing Bem1-GFP (DLY18643) was imaged without HU treatment. Four growing buds display concentrated Bem1 while two pre-existing buds on the left and right sides appear to be abandoned buds from the previous cell cycle. Time in h:min:s.
Video 9
Chromosome segregation in two-budded cells.
An rdi1Δ Bem1-GFP-CAAX strain (DLY18196) containing the histone probe HTB2-mCherry to visualize chromatin was imaged following release from HU arrest. Merge of DIC and HTB2-mCherry channels is shown for three representative two-budded cells. Left: chromatin is segregated between the mother and one bud, while the other bud is left vacant. Middle and right: chromatin is split between mothers and buds. Time in h:min:s.
Video 10
Simulation of competition between polarity peaks in a computational model.
Cross-section (left) and 2D (right: color represents Cdc42 concentration) views of the same simulation. Starting from the homogeneous steady state, two identical perturbations lead to rapid growth of two peaks, which persist for a prolonged period (unstable steady state). Eventually, noise leads to one peak becoming bigger than the other, and this asymmetry leads to accelerating competition until only a single peak persists (stable steady state).
Tables
Table 1
Yeast strains used in this study.
| Strain | Background | Relevant genotype | Source |
|---|---|---|---|
| DLY5069 | YEF473 | α rsr1::HIS3 | This study |
| DLY8155 | YEF473 | a WT | |
| DLY9200 | YEF473 | a/α rsr1::TRP1/rsr1::TRP1 BEM1-GFP:LEU2/BEM1-GFP:LEU2 | Howell et al., 2009 |
| DLY9201 | YEF473 | a/α BEM1-GFP:LEU2/BEM1-GFP:LEU2 | Wu et al., 2013 |
| DLY9641 | YEF473 | a/α rsr1::HIS3/rsr1::HIS3 BEM1-GFP-snc2V39A,M42A:LEU2/BEM1 | Howell et al., 2009 |
| DLY11320 | YEF473 | a/α rsr1::TRP1/rsr1::TRP1 BEM1-GFP:LEU2/BEM1-GFP:LEU2 ABP1-mCherry:kanR/ABP1-mCherry:kanR | Howell et al., 2009 |
| DLY11780 | YEF473 | a/α rsr1::TRP1/rsr1::TRP1 BEM1-GFP:LEU2/BEM1-GFP:LEU2 SPC42-mCherry:kanR/SPC42 | Howell et al., 2012 |
| DLY12383 | YEF473 | α rsr1::HIS3 CDC24-GFP:TRP1 | This study |
| DLY12576 | a/α rsr1::HIS3/rsr1::HIS3 BEM1-GFP-CAAX:LEU2/BEM1-GFP-CAAX:LEU2 SPA2-mCherry:kanR/SPA2 | This study | |
| DLY13098 | YEF473 | a/α rsr1::TRP1/rsr1::TRP1 BEM1-GFP:LEU2/BEM1-GFP:LEU2 CDC3-mCherry:LEU2/CDC3 | Howell et al., 2012 |
| DLY13824 | YEF473 | a/α rsr1::TRP1/rsr1::TRP1 BEM1-GFP:LEU2/BEM1-GFP:LEU2 cdc42::HIS3/CDC42 | This study |
| DLY13891 | YEF473 | a cdc42::TRP1 URA3:GFP-CDC42 (8x) | This study |
| DLY13920 | YEF473 | a/α rsr1::HIS3/RSR1 cdc42::TRP1/CDC42 URA3:GFP-CDC42/ura3 | This study |
| DLY14535 | YEF473 | a/α rsr1::TRP1/rsr1::TRP1 rdi1::TRP1/rdi1::TRP1 BEM1-GFP:LEU2/ BEM1-GFP:LEU2 CDC3-mCherry:LEU2/CDC3 | This study |
| DLY14898 | YEF473 | a/α rsr1::HIS3/RSR1 rdi1::TRP1/rdi1::TRP1 cdc42::TRP1/CDC42 URA3:GFP-CDC42/ura3 | This study |
| DLY15016 | YEF473 | a GFP-CDC42 | This study |
| DLY15121 | YEF473 | a/α rdi1::TRP1/rdi1::TRP1 BEM1-GFP:LEU2/BEM1-GFP:LEU2 | This study |
| DLY15241 | YEF473 | a/α rsr1::HIS3/rsr1::HIS3 rdi1::TRP1/RDI1 BEM1-GFP:LEU2/BEM1-GFP:LEU2 | This study |
| DLY15782 | YEF473 | a/α rsr1::HIS3/rsr1::HIS3 rdi1::TRP1/rdi1::TRP1 BEM1-GFP:LEU2/ BEM1-GFP:LEU2 PBD-tdTomato:kanR/GIC2 | This study |
| DLY15572 | YEF473 | a/α rsr1::TRP1/rsr1::TRP1 BEM1-GFP:LEU2/BEM1-GFP:LEU2 cdc42R66A/cdc42R66A | This study |
| DLY16730 | YEF473 | α cdc42::TRP1 URA3:GFP-CDC42 (3x) | This study |
| DLY16855 | YEF473 | a cdc42::TRP1 URA3:CDC42-mCherrySW | This study |
| DLY17109 | YEF473 | a/α rsr1::HIS3/rsr1::HIS3 rdi1::TRP1/rdi1::TRP1 BEM1-GFP:LEU2/ BEM1-GFP:LEU2 cdc42::TRP1/CDC42 URA3:CDC42-mCherrySW/ura3 | This study |
| DLY17110 | YEF473 | a/α rsr1::HIS3/rsr1::HIS3 BEM1-GFP:LEU2/BEM1-GFP:LEU2 cdc42::TRP1/CDC42 URA3:CDC42-mCherrySW/ura3 | This study |
| DLY17127 | YEF473 | α rsr1::HIS3 cdc42::TRP1 URA3:CDC42-mCherrySW | This study |
| DLY17251 | YEF473 | a/α rsr1::TRP1/rsr1::TRP1 BEM1-GFP:LEU2/BEM1-GFP:LEU2 SPA2-mCherry:kanR/SPA2 | This study |
| DLY17301 | YEF473 | a/α rsr1::HIS3/rsr1::HIS3 rdi1::TRP1/rdi1::TRP1 BEM1-GFP:LEU2/ BEM1-GFP:LEU2 | This study |
| DLY17374 | YEF473 | a/α rsr1::HIS3/rsr1::HIS3 BEM1-tdTomato:HIS3/BEM1 GFP- URA3:SEC4/ura3 | This study |
| DLY17675 | YEF473 | a/α rsr1::HIS3/rsr1::HIS3 rdi1::TRP1/rdi1::TRP1 cdc42::TRP1/CDC42 URA3:GFP-CDC42/ura3 | This study |
| DLY17732 | YEF473 | a/α rsr1::HIS3/rsr1::HIS3 BEM1-GFP-CAAX:LEU2/BEM1-GFP-CAAX:LEU2 | This study |
| DLY17817 | YEF473 | a/α rsr1::TRP1/rsr1::TRP1 BEM1-GFP:LEU2/BEM1-GFP:LEU2 cdc24::URA3/CDC24 | This study |
| DLY17856 | BF264-15Du | a/α bni1::URA3/BNI1 rsr1::kanR/RSR1 BEM1-GFP-CAAX:LEU2/BEM1 bar1/BAR1 | This study |
| DLY17879 | BF264-15Du | a bni1::URA3 rsr1::kanR BEM1-GFP-CAAX:LEU2 | This study |
| DLY17941 | YEF473 | a/α rsr1::HIS3/rsr1::HIS3 rdi1::TRP1/rdi1::TRP1 BEM1-GFP-CAAX:LEU2/BEM1-GFP-CAAX:LEU2 | This study |
| DLY18196 | YEF473 | a/α rsr1::HIS3/rsr1::HIS3 rdi1::TRP1/rdi1::TRP1 BEM1-GFP-CAAX:LEU2/BEM1-GFP-CAAX:LEU2 HTB2-mCherry:natR/HTB2 | This study |
| DLY18215 | YEF473 | a/α rsr1::TRP1/ rsr1::TRP1 BEM1-GFP:LEU2/ BEM1-GFP:LEU2 cdc42::HIS3/CDC42 cdc24::URA3/CDC24 | This study |
| DLY18401 | YEF473 | a/α rsr1::TRP1/rsr1::TRP1 CDC2438A-CAAX:kanR/CDC2438A | This study |
| DLY18402 | YEF473 | a/α rsr1::TRP1/rsr1::TRP1 CDC24-CAAX:kanR/CDC24 | This study |
| DLY18417 | YEF473 | α rsr1::TRP1 CDC2438A-CAAX:kanR | This study |
| DLY18565 | YEF473 | a/α rsr1::TRP1/rsr1::TRP1 BEM1-GFP:LEU2/BEM1-GFP:LEU2 CDC2438A-CAAX:kanR/CDC2438A-CAAX:kanR | This study |
| DLY18643 | YEF473 | a/α rsr1::TRP1/rsr1::TRP1 rdi1::TRP1/rdi1::TRP1 BEM1-GFP:LEU2/ BEM1-GFP:LEU2 CDC2438A-CAAX:kanR/CDC2438A-CAAX:kanR | This study |
| DLY18649 | YEF473 | a/α HTB2-mCherry:natR/HTB2 rsr1::TRP1/RSR1 CDC2438A-GFP-CAAX:natR/CDC24 | This study |
| DLY18663 | YEF473 | a HTB2-mCherry:natR CDC2438A-GFP-CAAX:natR | This study |
| DLY18810 | YEF473 | a/α BEM1-GFP-CAAX:LEU2/BEM1 CDC2438A-CAAX:kanR/CDC24 | This study |
| DLY18849 | YEF473 | a/α rsr1::HIS3/rsr1::HIS3 BEM1-GFP-CAAX:LEU2/BEM1-GFP-CAAX:LEU2 LEU2:pTEF1-PRS1(1-208)-mCherry/leu2 | This study |
| DLY18859 | YEF473 | a/α rsr1::HIS3/RSR1 cdc42::TRP1/CDC42 URA3:GFP-CDC42/ura3 | This study |
| DLY18920 | YEF473 | a/α rsr1::TRP1/rsr1::TRP1 BEM1-GFP:LEU2/BEM1-GFP:LEU2 LEU2:pTEF1-PRS1(1-208)-mCherry/leu2 | This study |
| DLY20383 | YEF473 | a rsr1::HIS3 BEM1-GFP-CAAX:LEU2 WHI5-mCherry::URA3 | This study |
| DLY20489 | YEF473 | a rsr1::TRP1 BEM1-2xFRB-HA-GFP-CAAX:LEU2:natR fpr1::kanR tor1-1 RPL13a-2xFKBP-HA | This study |
Table 2
Parameters of the model.
| Description | Parameters | Value | Units | Reference |
|---|---|---|---|---|
| BemGEFc -> BemGEFm | k1a | 10 | s-1 | Kuo et al., 2014 |
| BemGEFm -> BemGEFc | k1b | 10 | s-1 | Kuo et al., 2014 |
| BemGEFm -> BemGEFc (Gaussian Noise) | s | 0.0001 | s-1 | Kuo et al., 2014 |
| Cdc42Dm + BemGEF -> Cdc42T | k2a | 0.16 | μM-1 s-1 | Kuo et al., 2014 |
| Cdc42T -> Cdc42Dm | k2b | 1.75 | s-1 | This study |
| Cdc42Dm + BemGEF42 -> Cdc42T | k3 | 0.35 | μM-1 s-1 | Kuo et al., 2014 |
| BemGEF + Cdc42T -> BemGEF42 | k4a | 10 | μM-1 s-1 | Kuo et al., 2014 |
| BemGEF42 -> BemGEF + Cdc42T | k4b | 10 | s-1 | Kuo et al., 2014 |
| Cdc42Dc -> Cdc42Dm | k5a | 36 | s-1 | Kuo et al., 2014 |
| Cdc42Dm -> Cdc42Dc | k5b | 0.65 | s-1 | Kuo et al., 2014 |
| BemGEFc + Cdc42T -> BemGEF42 | k7 | 10 | μM-1 s-1 | Kuo et al., 2014 |
| Diffusion coefficient on the membrane | Dm | 0.0025 | μm2 s-1 | Kuo et al., 2014 |
| Membrane to cytoplasm volume ratio | 0.01 | Kuo et al., 2014 | ||
| Surface area of the membrane | A | 25 | μm2 | Kuo et al., 2014 |
| Total [Cdc42] | 1 | μM | Kuo et al., 2014 | |
| Total [BemGEF] | 0.017 | μM | Goryachev, 2008 |
Download links
A two-part list of links to download the article, or parts of the article, in various formats.
Downloads (link to download the article as PDF)
Open citations (links to open the citations from this article in various online reference manager services)
Cite this article (links to download the citations from this article in formats compatible with various reference manager tools)
Role of competition between polarity sites in establishing a unique front
eLife 4:e11611.
https://doi.org/10.7554/eLife.11611


