Genetic dissection of Down syndrome-associated congenital heart defects using a new mouse mapping panel
- The Francis Crick Institute, United Kingdom
- UCL Institute of Neurology, United Kingdom
- Imperial College London, United Kingdom
Figures
Figure 1
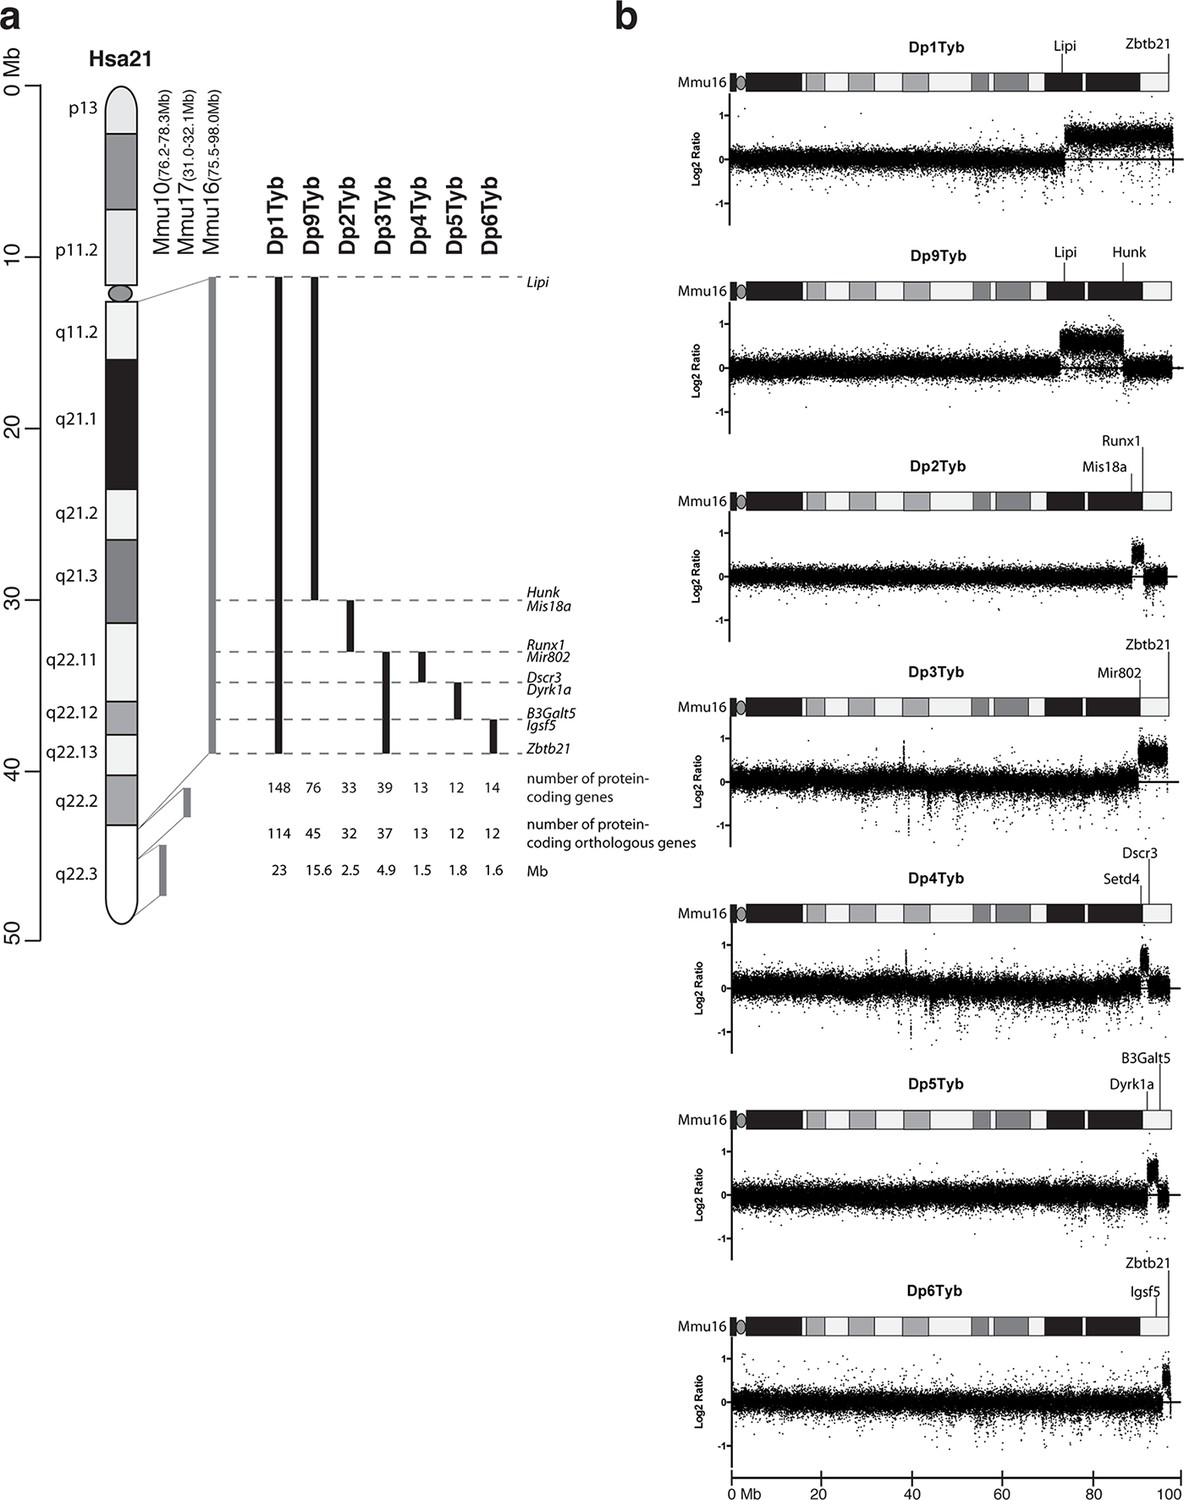
Generation of a mouse mapping panel of partial trisomies for DS phenotypes.
(a) Representation of Hsa21 and the regions of conserved synteny with orthologous regions on Mmu10, Mmu17 and Mmu16 (grey lines), indicating the coordinates of each mouse region. Diagram of Hsa21 shows the main cytogenetic bands (rectangles of different colors) and the centromere (oval). Black lines show the extent of the duplication in each of the mouse strains reported here, indicating the first and last genes at the ends of each duplication. The number of genes and extent in Megabases (Mb) of each duplicated region was calculated as described in Methods (b) CGH analysis of each duplication strain (2 mice analyzed/strain). Plots show log2-transformed hybridization ratios for DNA from each duplication strain versus C57BL/6JNimr. The duplicated regions would be expected to have a 1.5-fold increase in DNA content (log2 ratio = 0.58).
Figure 2
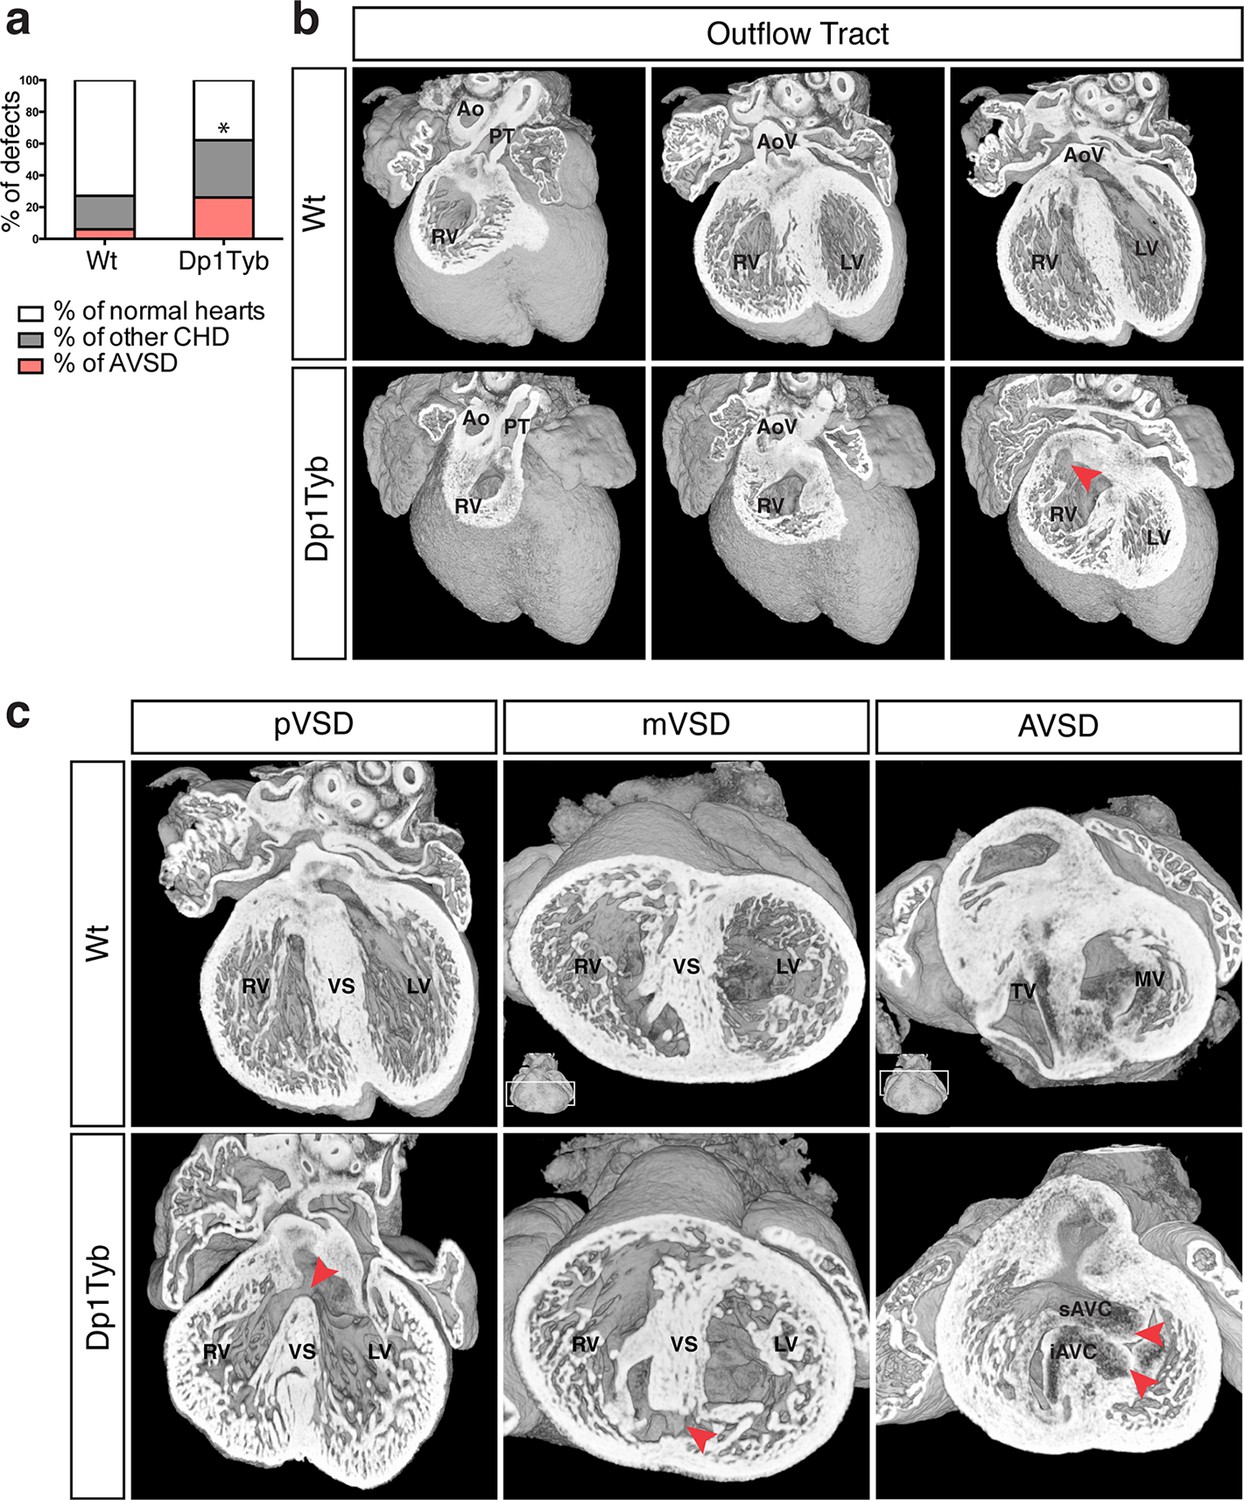
Dp1Tyb mice recapitulate the CHD seen in DS.
(a) Graph shows the percentage of CHD in Dp1Tyb embryonic hearts at E14.5 compared to wild-type (Wt) littermates; n = 26 Wt and 39 Dp1Tyb embryos. Significant difference to corresponding wild-type incidence (Fisher’s exact test) *p<0.05. (b) 3D HREM rendering of Wt and Dp1Tyb hearts, eroded from anterior to posterior to show the four-chamber view in 3 successive planes. Outflow tract defects such as double outlet right ventricle are observed in Dp1Tyb hearts (red arrow head indicates the aortic valve connecting to the right ventricle). (c) 3D reconstructions of Wt and Dp1Tyb E14.5 hearts with different types of CHD (red arrowheads): perimembranous ventricular septal defects (pVSD), muscular ventricular septal defect (mVSD), atrio-ventricular septal defect (AVSD). Ao, aorta; AoV, aortic valve; iAVC, inferior atrio-ventricular cushion; LV, left ventricle; MV, mitral valve; PT, pulmonary trunk; RV, right ventricle; sAVC, superior atrio-ventricular cushion; TV, tricuspid valve; VS, ventricular septum.
Figure 3

Genetic dissection of DS-associated CHD.
(a) Representation of Hsa21 showing region of conserved synteny with Mmu16 in grey and the extent of the duplications in Dp9Tyb, Dp2Tyb and Dp3Tyb in black. Graphs show the incidence of CHD in each strain; n = 22 Wt, 17 Dp9Tyb; n = 16 Wt, 26 Dp2Tyb and n = 26 Wt, 25 Dp3Tyb embryos. Significant difference to corresponding wild-type incidence (Fisher’s exact test) *P<0.05. ns, not significant. (b) 3D reconstructions of Wt and Dp3Tyb E14.5 hearts with different types of CHD (red arrowheads) as described in Figure 2c. (c) Representation of Hsa21 showing region of conserved synteny with Mmu16 in grey and the extent of the duplications in the indicated strains in black. Graphs shows incidence of CHD. n = 20 Wt, 21 Ts1Rhr; n = 15 Wt, 19 Dp4Tyb; n = 11 Wt, 20 Dp5Tyb and n = 28 Wt, 19 Dp6Tyb embryos analyzed. ns, not significant (Fisher’s exact test). iAVC, inferior atrio-ventricular cushion; LV, left ventricle; MV, mitral valve; RV, right ventricle; sAVC, superior atrio-ventricular cushion; TV, tricuspid valve; VS, ventricular septum.
Figure 4
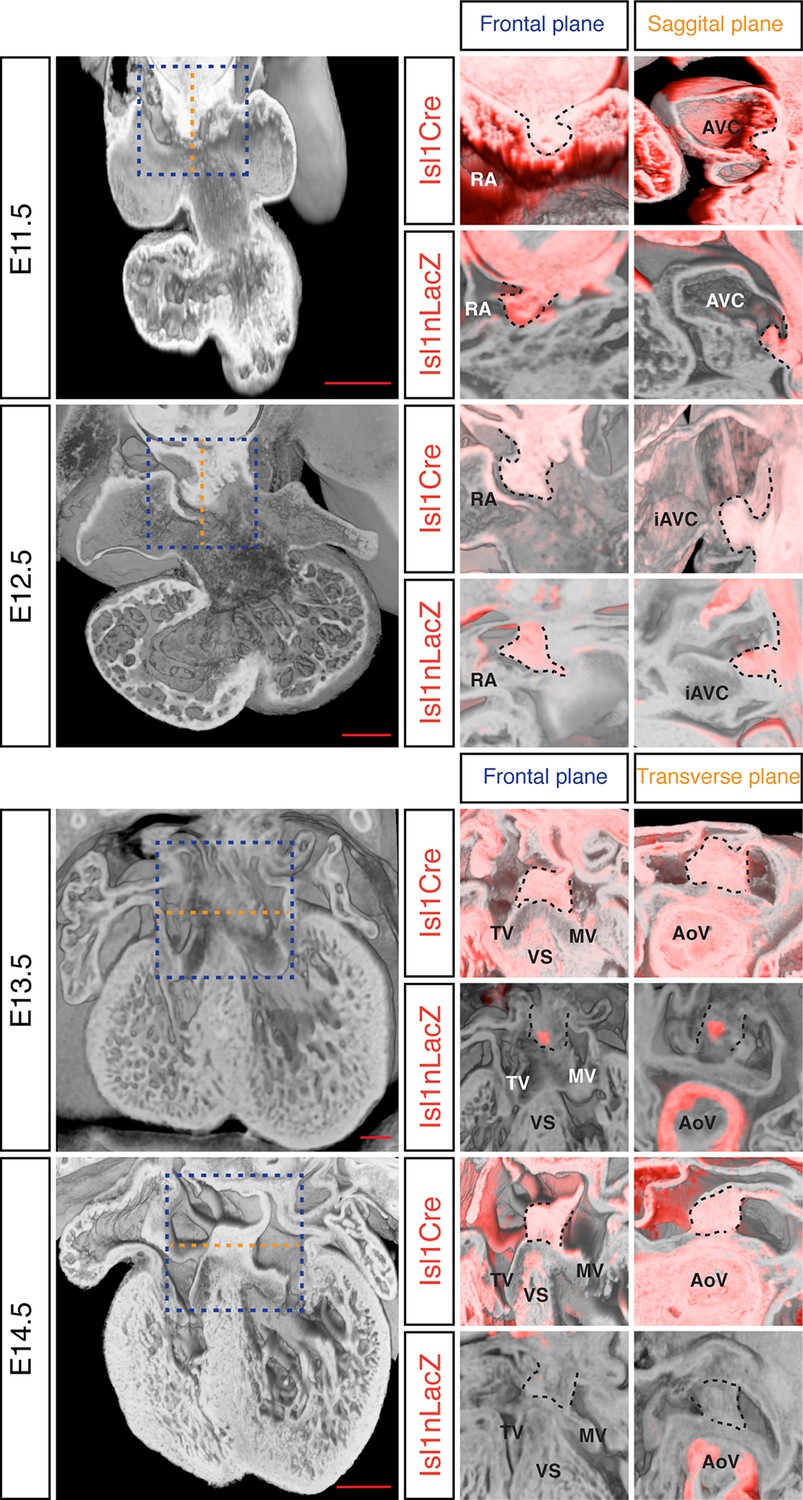
Development of the DMP.
Left panels show a series of 3D four-chamber views of hearts at embryonic stages E11.5, 12.5, 13.5 and 14.5. Middle panels show a close up of the AV junction (frontal plane view corresponds to blue dashed box in the left panels) in the Isl1Cre/Rosa26RLacZ (Isl1Cre) and the Isl1nLacZ strains; β–galactosidase expression is pseudo-colored in red. Right panels show a sagittal view of the AV junction in E11.5 and E12.5 hearts and a transverse view in E13.5 and E14.5 hearts; sagittal and transverse planes shown as orange dashed line in left panels; β–galactosidase expression is pseudo-colored in red. In the middle and right panels the DMP is marked with a black dashed contour. The number of biological replicates used for each of the developmental stages, E11.5, E12.5, E13.5 and E14.5 respectively, were: n = 2, 2, 6 and 4 for the Isl1Cre/Rosa26RLacZ and n = 10, 9, 7 and 5 for the Isl1nLacZ. AoV, aortic valve; AVC, atrioventricular canal; iAVC, inferior atrioventricular cushion; MV, mitral valve; RA, right atrium; TV, tricuspid valve; VS, ventricular septum. Scale bar, 200 μm.
Figure 5
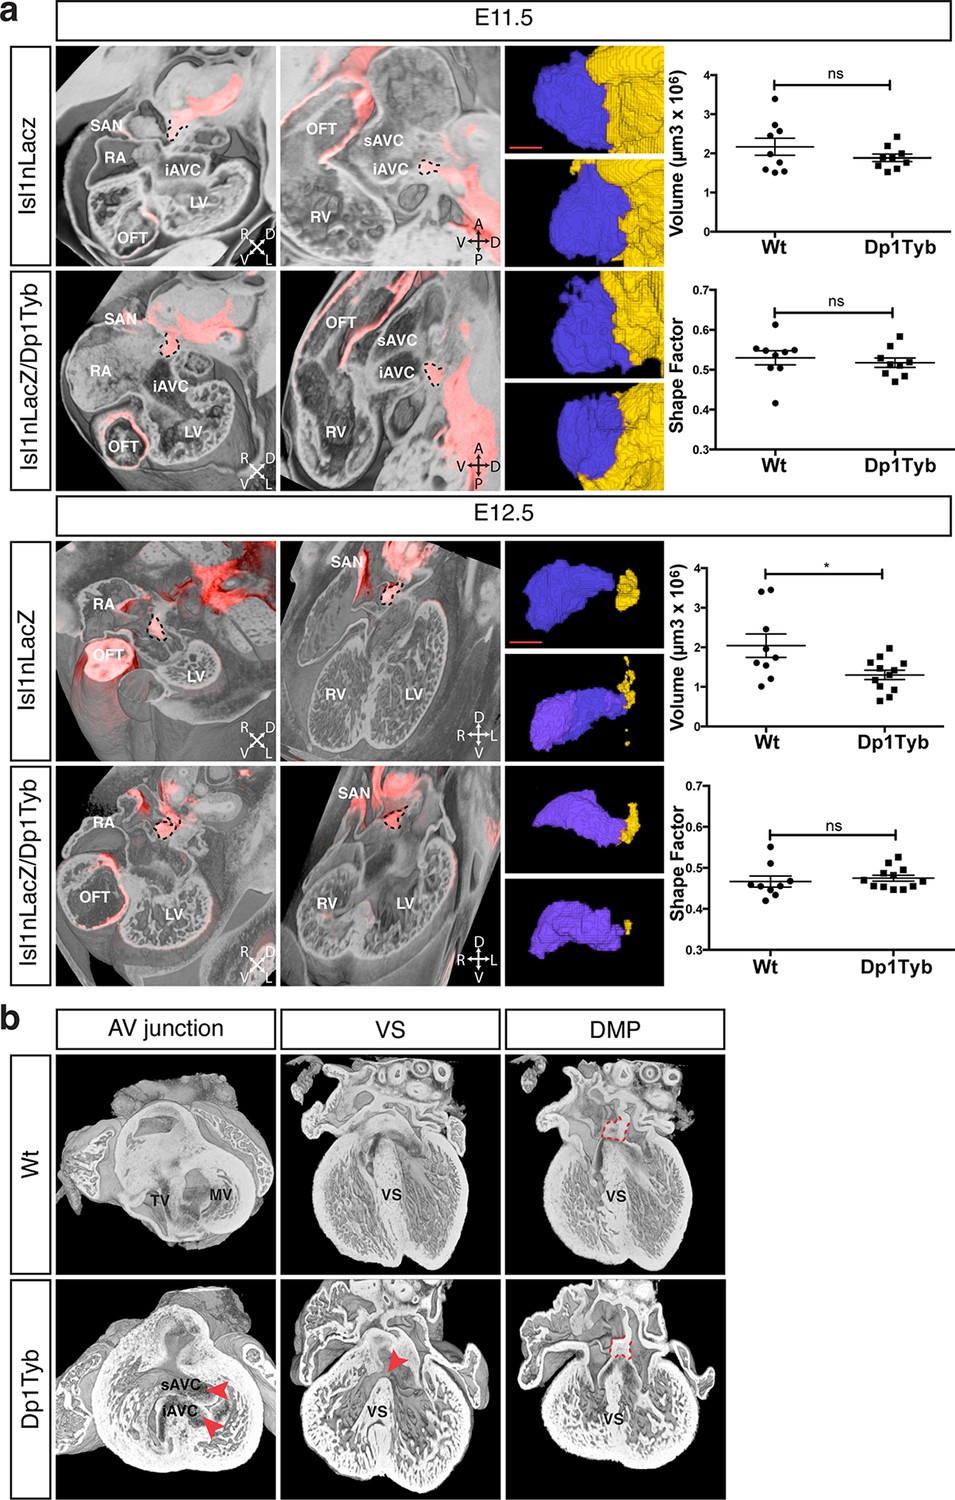
Largely normal development of the DMP in Dp1Tyb mice.
(a) 3D reconstruction of control Isl1nLacZ and Isl1nLacZ/Dp1Tyb E11.5 and E12.5 hearts analyzed using dual filter HREM. In the first two columns heart morphology is in grey and LacZ expression is pseudo-colored in red. Left panels show a transverse view of the developing heart and middle panels show a sagittal plane at E11.5 and a 4-chamber view at E12.5. The DMP is marked with a dashed black contour. Orientation is marked with 4 arrows (A, anterior; D, dorsal; L, left; P, posterior; R, right; V, ventral). Right image panels show two representative 3D reconstructions of the DMP for control and Dp1Tyb embryos at E11.5 and E12.5; the DMP is pseudo-colored in blue and surrounding dorsal mesenchyme is pseudo-colored in yellow. Graphs show the volume and shape factor of the DMP (n = 9 Wt and 9 Dp1Tyb E11.5 embryos, n = 9 Wt and 12 Dp1Tyb E12.5 embryos). Results are presented with measurements from each heart and as mean ± s.e.m. Statistical analysis with an unpaired Student’s t-test; ns, not significant, *P<0.05. (b) 3D HREM rendering of hearts from a single Wt and a single Dp1Tyb embryo at E14.5. The left images show the AV junction in short axis view from the ventricles towards the atria. Red arrowheads indicate the bridging leaflets of the common AV junction in the Dp1Tyb heart. The middle images show a 4-chamber view visualizing the ventricular septum. Red arrowhead indicates a pVSD in the Dp1Tyb heart. The right images show a more dorsal plane of the 4-chamber view to visualize the DMP, marked with a red dashed contour in both Wt and Dp1Tyb hearts. iAVC, inferior atrioventricular cushion; LV, left ventricle; MV, mitral valve; OFT, outflow tract; RA, right atrium; RV, right ventricle; SAN, sinoatrial node; sAVC, superior atrioventricular cushion; TV, tricuspid valve; VS, ventricular septum. Scale bar, 50 μm.
Figure 6
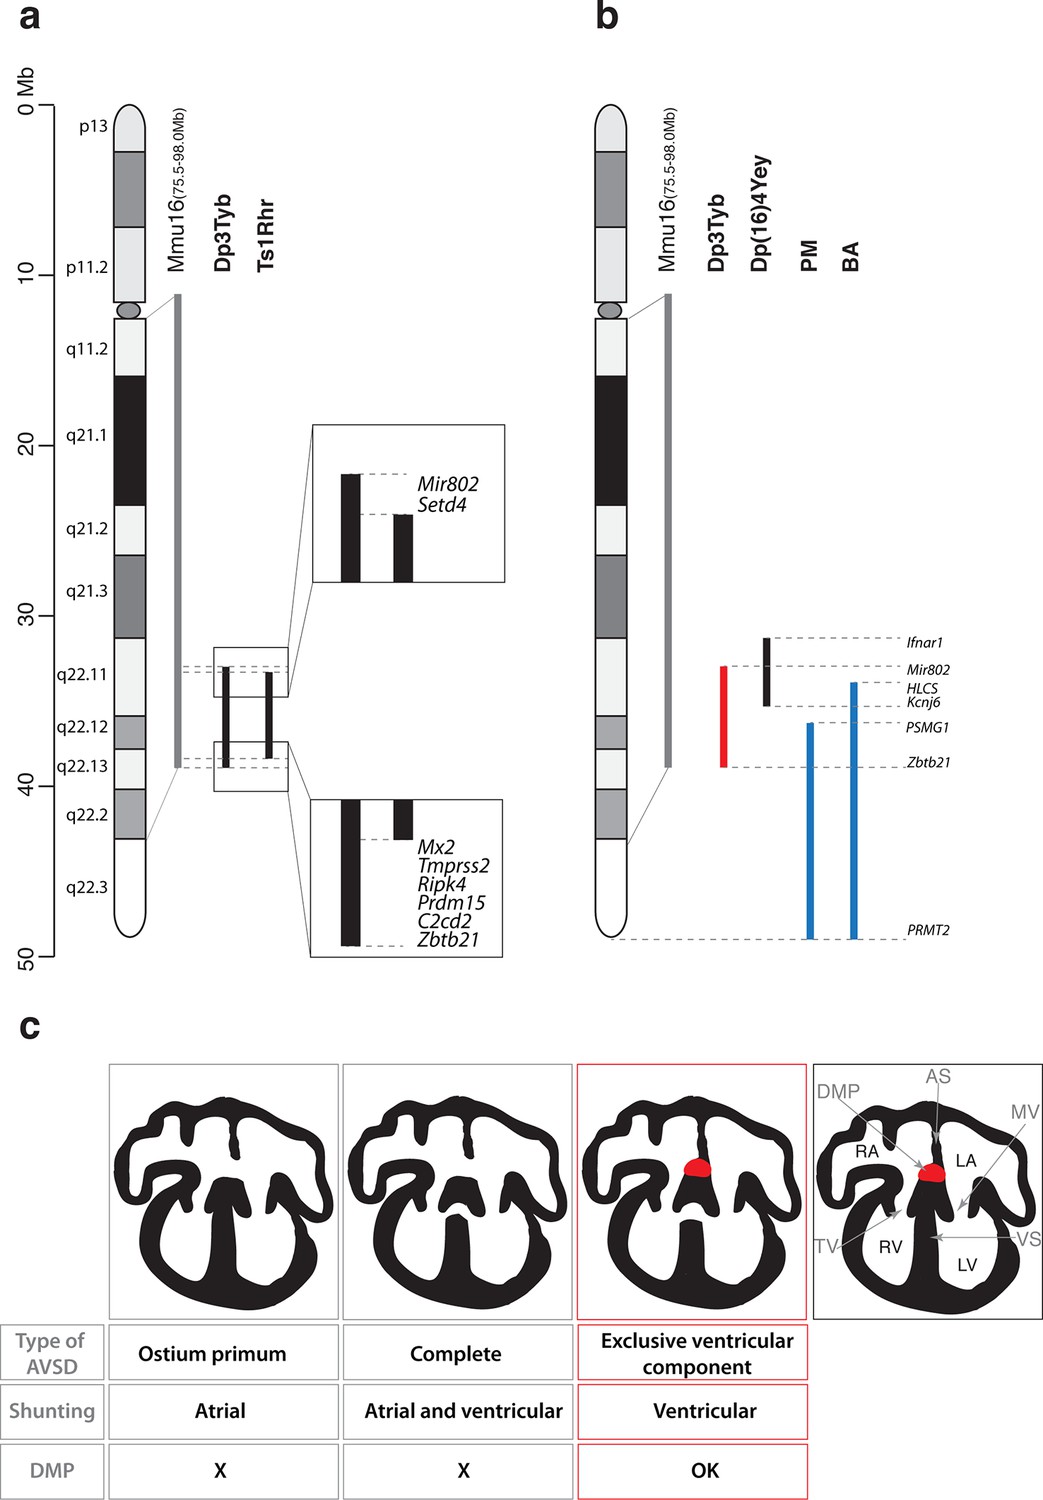
Genetic and mechanistic dissection of CHD in mouse models of DS.
(a) Representation of Hsa21 and the conserved region of synteny with the telomeric part of Mmu16 (grey line). Black lines indicate the extent of the duplications in Dp3Tyb and Ts1Rhr strains. Magnifications show the ends of the duplications indicating the 8 genes duplicated in Dp3Tyb but not Ts1Rhr mice. (b) Hsa21 and orthologous portion of Mmu16 (grey line), showing extent of duplication in Dp3Tyb (red line, this study) and Dp(16)4Yey (black line) (Liu et al., 2013). Also shown are the extent of partial trisomies of two individuals with DS who had a VSD (PM) or AVSD (BA) (blue lines) (Korbel et al., 2009). (c) Diagrams show a normal heart (right) and 3 types of AVSD depending on the relationship of the AV valves to the septal components and the presence/absence of the DMP (red). Defects in the DMP are seen in AVSD with atrial shunting (ostium primum) or in complete AVSD with both atrial and ventricular shunts. Dp1Tyb mice have AVSD with a ventricular shunt and the DMP is present (red boxes). AS, atrial septum; DMP, dorsal mesenchymal protrusion; LA, left atrium; LV, left ventricle; MV, mitral valve; RA, right atrium; RV, right ventricle; TV, tricuspid valve; VS, ventricular septum.
Videos
Video 1
OA in an E14.5 Dp1Tyb heart.
At the start of the video an image of the whole heart is seen and as it zooms in the frontal erosion of the heart reveals the four-chamber view. The pulmonary valves are seen at 00:05, coming from the right ventricle and at 00:08 the aorta is seen positioned directly over a VSD.
Video 2
DORV in an E14.5 Dp1Tyb heart.
The video starts with an image of the whole heart and frontal erosion reveals that the aorta is communicating with the right ventricle (00:04). The video then zooms in to reveal in more detail how the aortic valves are communicate with the right ventricle. Further erosion also shows a VSD at the end of the video (00:17).
Video 3
pVSD in an E14.5 Dp1Tyb heart.
At the start the video shows the whole heart and then erodes frontally to show a pVSD (00:08). The video then erodes slightly further to show the connection of the ventricular septum with the endocardial cushions. The image then zooms in and erodes backwards to show the pVSD at higher magnification.
Video 4
mVSD in an E14.5 Dp1Tyb heart.
The video shows a whole heart that rotates to view the apex of the ventricles and then erodes transversally revealing the ventricular septum. The mVSD is first seen at 00:08 and the image then zooms in to show it at higher magnification.
Video 5
AVSD in an E14.5 Dp1Tyb heart.
The video shows a whole heart that rotates to view the apex of the ventricles and then erodes upwards. The bridging leaflets across the common AV junction can first be seen at 00:05, but they are more clearly visible as the heart is eroded further and a close look at the AV valves is shown at the end of the video (00:16), where the superior and inferior bridging leaflets forms a common AV junction. Note the “unwedged” morphology of the left outflow tract on top of the superior bridging leaflet.
Video 6
AVSD with intact DMP in an E14.5 Dp1Tyb heart.
The video shows the whole heart that initially erodes transversally from the apex to reveal an AVSD (00:03 to 00:07). The heart is then reconstructed and eroded frontally to show a pVSD (00:13). Further erosion shows an intact DMP on top of the endocardial cushions (00:13 to 00:17). Note this is the same heart as shown in Video 5.
Video 7
mVSD in an E14.5 Dp3Tyb heart.
The embryonic heart is eroded upwards from the apex of the ventricles to reveal an mVSD in the inlet portion of the ventricular septum (00:17).
Video 8
AVSD in an E14.5 Dp3Tyb heart.
The heart is first eroded frontally to show a pVSD (00:04). The heart is then reconstructed and eroded from the top of the OFT downwards to reveal an AVSD (00:13 to 00:17).
Tables
Table 1
Yields of wild-type (WT) and mutant mice from the 7 duplication strains.
Table shows the numbers and percentages of wild-type and mutant mice recovered at weaning (~3 weeks old) from each of the 7 duplication strains which were bred by crossing a mutant mouse with a C57BL/6JNimr mouse. The numbers were tested for significant difference from the expected Mendelian yields (wild-type:mutant, 50%:50%) using a 2-tailed Fisher’s exact test and p-values are reported in the final column where these were <0.05, otherwise are indicated as not significant (ns).
| Mouse numbers | Percentages | ||||
|---|---|---|---|---|---|
| Strain | WT | Mutant | WT | Mutant | p-value |
| Dp1Tyb | 427 | 208 | 67.24% | 32.76% | <0.0001 |
| Dp2Tyb | 305 | 253 | 54.66% | 45.34% | ns |
| Dp3Tyb | 223 | 165 | 57.47% | 42.53% | 0.0437 |
| Dp4Tyb | 101 | 78 | 56.42% | 43.58% | ns |
| Dp5Tyb | 99 | 74 | 57.23% | 42.77% | ns |
| Dp6Tyb | 191 | 157 | 54.89% | 45.11% | ns |
| Dp9Tyb | 97 | 91 | 51.60% | 48.40% | ns |
Table 2
Cardiovascular abnormalities in E14.5 embryos.
Table shows the numbers of different cardiac defects found in embryos from the indicated duplication strains and in Wt littermate controls.
| Types of defects | Dp1Tyb | Dp9Tyb | Dp2Tyb | Dp3Tyb | Ts1Rhr | Dp4Tyb | Dp5Tyb | Dp6Tyb | ||||||||||
|---|---|---|---|---|---|---|---|---|---|---|---|---|---|---|---|---|---|---|
| Wt | Dp1Tyb | Wt | Dp9Tyb | Wt | Dp2Tyb | Wt | Dp3Tyb | Wt | Ts1Rhr | Wt | Dp4Tyb | Wt | Dp5Tyb | Wt | Dp6Tyb | |||
| Single defects | Septal defects | ASD | 1 | 0 | 0 | 0 | 0 | 0 | 1 | 0 | 0 | 0 | 0 | 0 | 0 | 0 | 0 | 0 |
| pVSD | 3 | 9 | 0 | 1 | 2 | 5 | 2 | 0 | 4 | 1 | 0 | 4 | 1 | 1 | 4 | 1 | ||
| mVSD | 0 | 0 | 1 | 0 | 0 | 2 | 0 | 4 | 0 | 0 | 0 | 0 | 0 | 0 | 2 | 1 | ||
| OFT defects | OA | 0 | 0 | 0 | 0 | 0 | 0 | 0 | 0 | 0 | 0 | 0 | 0 | 0 | 0 | 0 | 0 | |
| DORV | 0 | 0 | 0 | 0 | 0 | 0 | 0 | 0 | 0 | 0 | 0 | 0 | 0 | 0 | 0 | 0 | ||
| AVSD | 0 | 1 | 0 | 0 | 0 | 0 | 0 | 0 | 0 | 0 | 0 | 0 | 0 | 0 | 0 | 0 | ||
| Multiple defects | OFT + VSD | 1 | 2 | 0 | 0 | 0 | 1 | 0 | 0 | 0 | 0 | 0 | 0 | 2 | 0 | 0 | 0 | |
| pVSD + mVSD | 1 | 3 | 0 | 0 | 0 | 1 | 0 | 0 | 0 | 2 | 0 | 0 | 0 | 0 | 0 | 0 | ||
| VSD + AVSD | 1 | 4 | 0 | 0 | 0 | 0 | 0 | 6 | 1 | 2 | 0 | 0 | 0 | 1 | 0 | 0 | ||
| OFT + VSD + AVSD | 0 | 5 | 0 | 0 | 0 | 0 | 0 | 1 | 0 | 0 | 0 | 0 | 0 | 1 | 0 | 0 | ||
| Total number of CHD | 7 | 24 | 1 | 1 | 2 | 9 | 3 | 11 | 5 | 5 | 0 | 4 | 3 | 3 | 6 | 2 | ||
| Embryos analyzed | 26 | 39 | 22 | 17 | 16 | 26 | 26 | 25 | 20 | 21 | 15 | 19 | 11 | 20 | 28 | 19 | ||
| % of CHD | 26.9 | 61.5 | 4.5 | 5.9 | 12.5 | 34.6 | 11.5 | 44.0 | 25.0 | 23.8 | 0 | 21.0 | 27.2 | 15.0 | 21.4 | 10.5 | ||
Download links
A two-part list of links to download the article, or parts of the article, in various formats.
Downloads (link to download the article as PDF)
Open citations (links to open the citations from this article in various online reference manager services)
Cite this article (links to download the citations from this article in formats compatible with various reference manager tools)
Genetic dissection of Down syndrome-associated congenital heart defects using a new mouse mapping panel
eLife 5:e11614.
https://doi.org/10.7554/eLife.11614


