Epigenetic regulation of hematopoiesis by DNA methylation
- National Institutes of Health, United States
- University of Oregon, United States
Figures
Figure 1 with 1 supplement
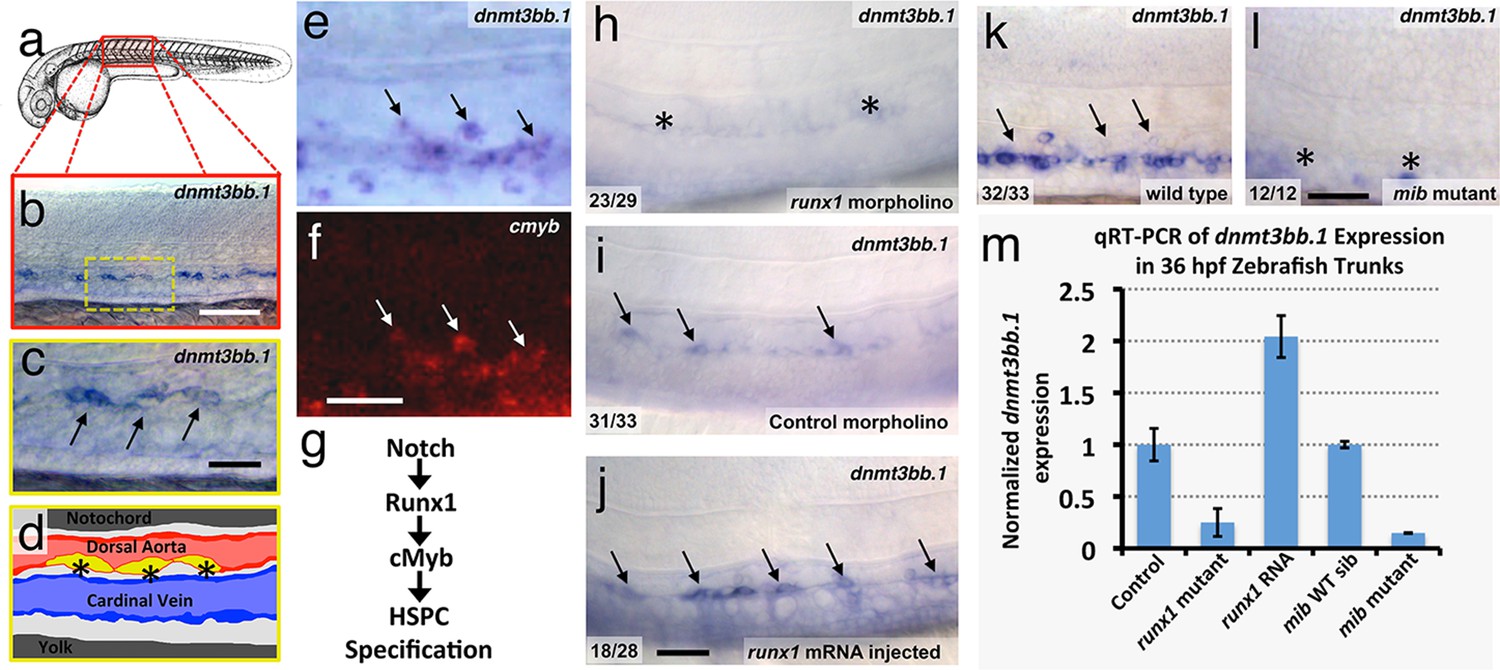
The DNA methyltransferase3bb.1 gene is expressed in developing hematopoietic stem and progenitor cells and is regulated by hematopoietic stem and progenitor cell ( HSPC)-specific pathways.
(a) Camera lucida drawing of a 24 hpf zebrafish embryo with a red box noting the approximate region of the trunk shown in in situ hybridization images. (b,c) Whole-mount in situ hybridization of a 36 hpf zebrafish trunk probed for dnmt3bb.1, showing expression in the ventral floor of the dorsal aorta (arrows in panel c). Yellow inset box in panel b indicates the magnified area shown in panel c. (d) Diagram corresponding to panel c showing dorsal aorta (red), cardinal vein (blue), and dnmt-positive cells in the floor of the dorsal aorta (yellow). (e,f) Double in situ hybridization of a 36 hpf zebrafish trunk probed for dnmt3bb.1 (e, blue) and c-myb (f, red). The c-myb positive HSPC progenitors also stain for dnmt3bb.1 (arrows). (g) A Notch- Runx- c-myb pathway regulates HSPC emergence in the zebrafish. (h–j) In situ hybridization of 36 hpf runx1 morpholino-injected (h), control (i), or runx1 mRNA-injected (j) zebrafish trunks probed for dnmt3bb.1, showing that dnmt3bb.1 expression is reduced by runx1 knockdown (asterisks) and increased by runx1 overexpression (arrows). (k,l) In situ hybridization of 36 hpf wild type (k) or mind bomb mutant (l) zebrafish trunks probed for dnmt3bb.1, showing that dnmt3bb.1 expression seen in wild-type siblings (arrows in panel k) is strongly reduced in Notch-deficient mind bomb mutants (asterisks in panel l). (m) Quantitative reverse transcriptase-polymerase chain reaction (qRT-PCR) analysis of dnmt3bb.1 transcript levels in 36 hpf (i) control, (ii) runx1W84X mutant, (iii) runx1 mRNA injected, (iv) mind bomb (mib) wild type sibling (wild type sibling of mib mutants), and (v) mib mutant zebrafish embryos. dnmt3bb.1 levels are normalized to the reference gene elf1α and to levels in controls. All graphs show mean ± standard error of the mean (SEM) and are representative of three biological replicates. Scale bars = 100 µm in b, h-l and 50 µm in c, f.
Figure 1—figure supplement 1
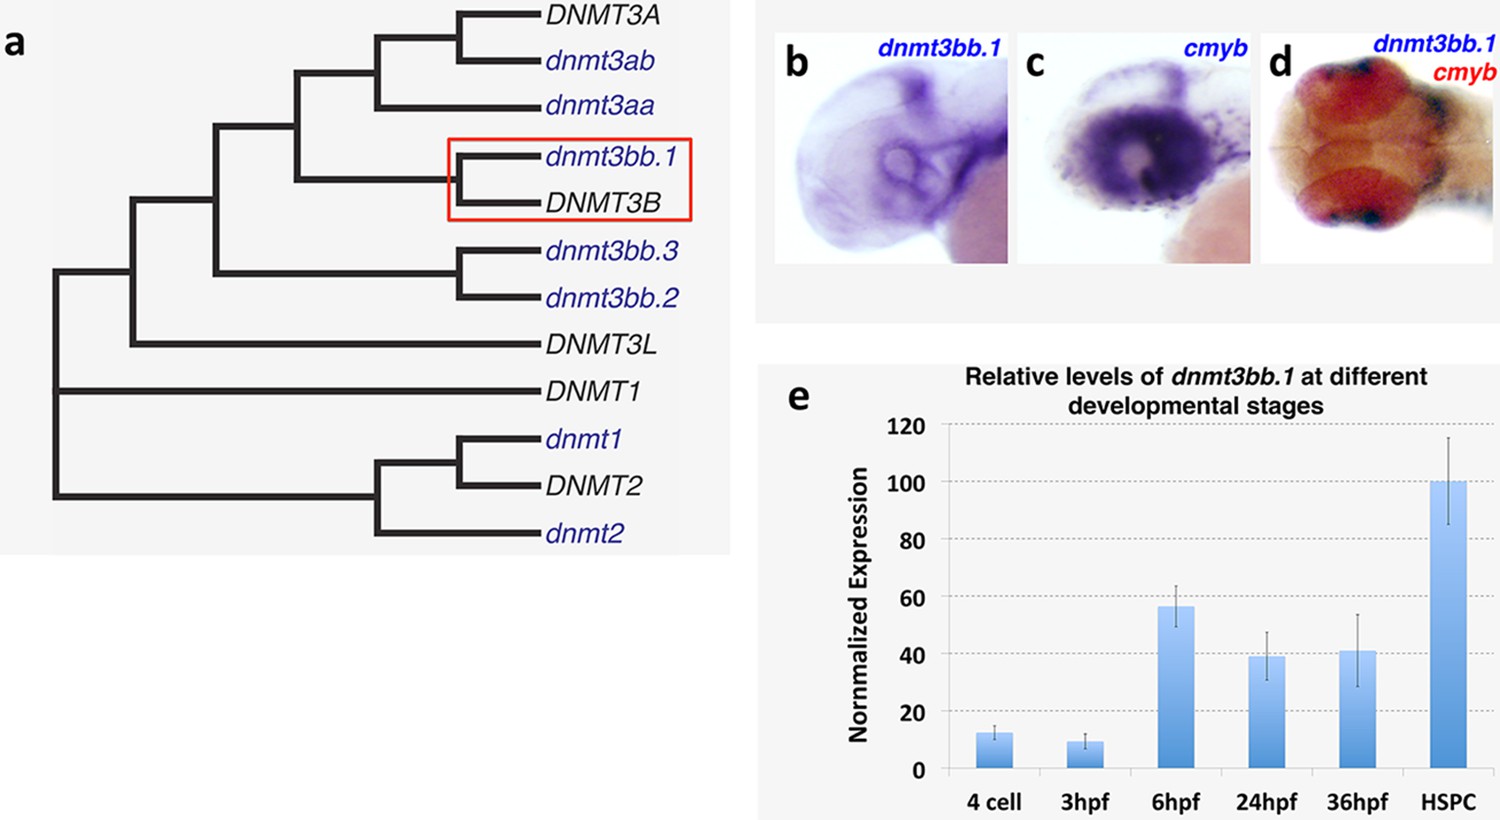
Dnmt3bb.1expression analysis and homology.
(a) Phylogenetic tree showing zebrafish Dnmt3bb.1 is the closest homolog of human DNMT3B. (b–d) WISH showing non-hematopoietic expression of dnmt3bb.1, b, cmyb, c, and dnmt3bb.1 and cmyb, d, in the heads of 36 hpf zebrafish. (e) relative levels of dnmt3bb.1 in embryos at different developmental stages.
Figure 2 with 3 supplements
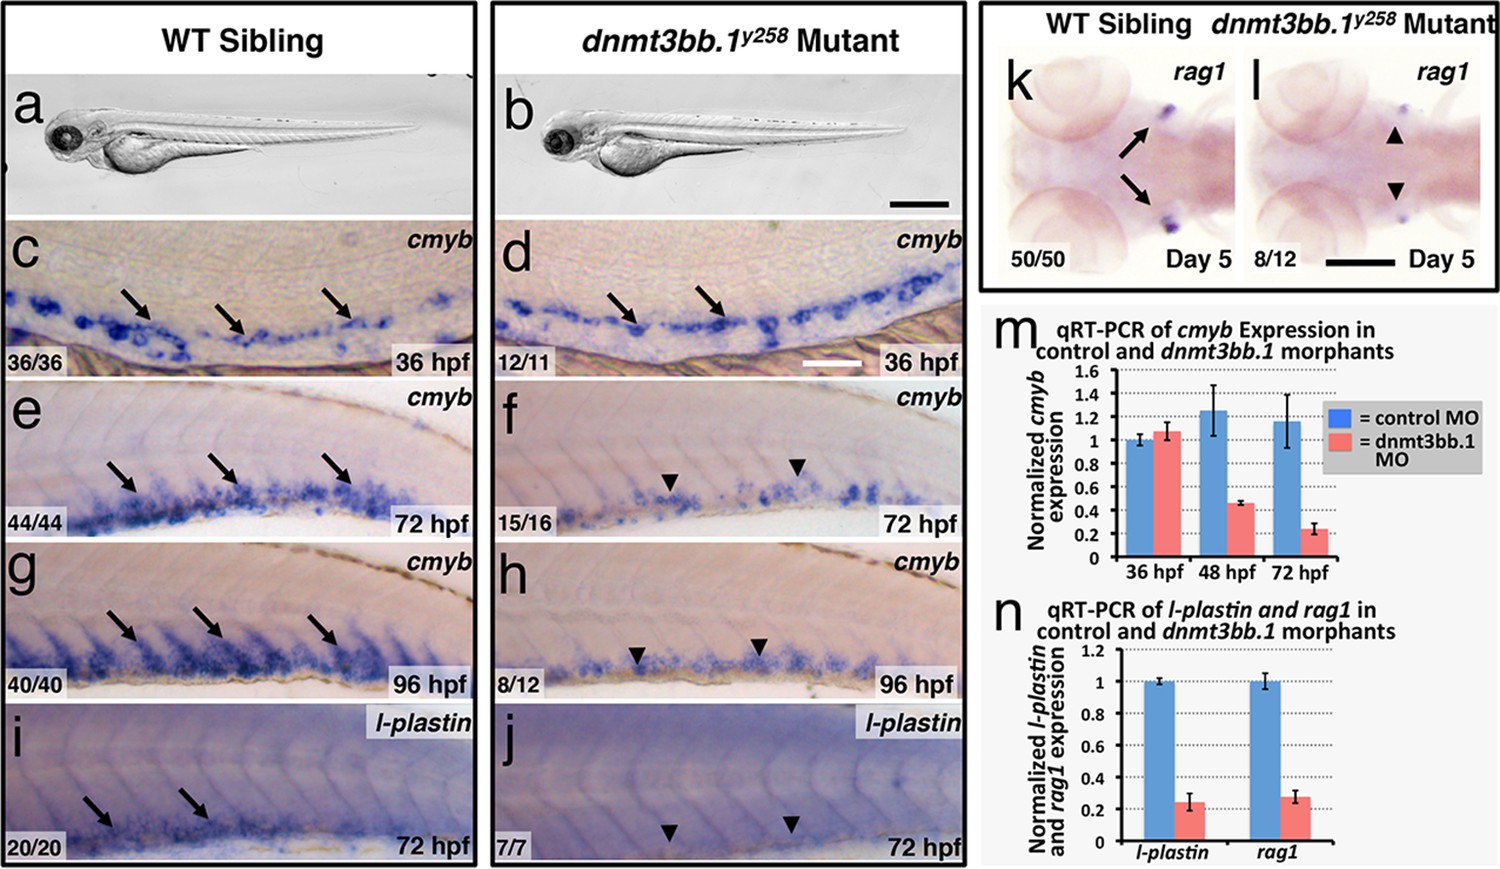
Dnmt3bb.1is necessary for hematopoietic gene expression.
(a,b) Transmitted light images of 72 hpf control (a) and dnmt3bb.1y258 (b) mutant zebrafish, showing absence of developmental delay or gross morphological abnormalities in dnmt3bb.1y258 mutants. (c–h) Whole mount in situ hybridization of 36 hpf (c,d), 72 hpf (e,f) and 96 hpf (g,h) wild type (WT) sibling (c,e,g) or dnmt3bb.1y258 (d,f,h) mutant animals, probed for cmyb. Cmyb is expressed in dnmt3bb.1 mutant at 36 hpf (arrows) but this expression is strongly reduced by 72 and 96 hpf (arrowheads). (i–l) Whole mount in situ hybridization of 72 hpf tails probed for l-plastin (i,j) and 5 dpf heads probed for rag1 (k,l) from WT sibling (i,k) or dnmt3bb.1 (j,l) mutant animals. Expression of both l-plastin and rag1 is present in controls (arrows) but strongly reduced in dnmt3bb.1 mutant animals (arrowheads). (m) Quantitative RT-PCR analysis of cmyb transcript levels in control (blue columns) or dnmt3bb.1 (red columns) morpholino injected animals at 36, 48, and 72 hpf. Transcript levels are normalized to the reference gene elf1α and to levels in 36 hpf control morphants. (n) Quantitative RT-PCR analysis of 3 dpf l-plastin and 5 dpf rag1transcript levels in control (blue columns) or dnmt3bb.1 (red columns) morpholino-injected animals. Transcript levels are normalized to the reference gene elf1α and to levels in controls. All graphs in panels i and j show mean ± SEM, are representative of three biological replicates. Scale bars = 150 µm in a,b, 50 µm in c,d, 100 µm in e-l.
Figure 2—figure supplement 1
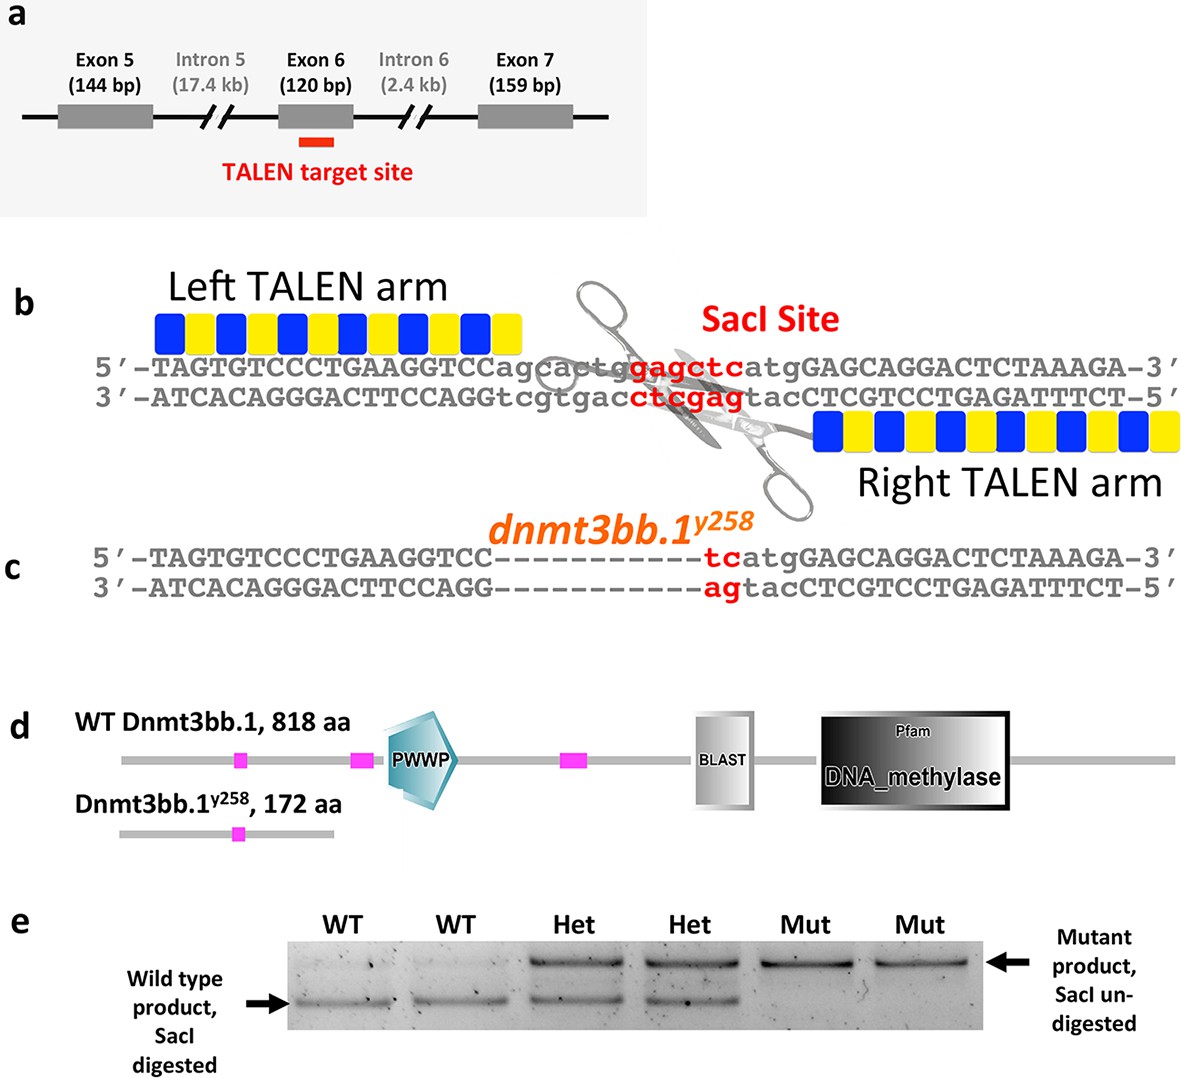
TALENmediated Dnmt3bb.1 mutation.
(a) Schematic diagram showing the position of the TALEN target site within exon 6 of dnmt3bb.1. (b) TALEN pair binding sites and spacer between them in the WT dnmt3bb.1 locus. The spacer region includes a Sac I restriction enzyme site. (c) dnmt3bb.1y258 mutation with an 11 nucleotide deletion resulting in loss of the Sac I site. (d) The dnmt3bb.1y258 mutation causes a frame shift after amino acid 166 that results in a truncated polypeptide of 172 amino acids lacking the DNA methylase domain as well as other important functional domains. (e) A representative genotyping gel containing PCR products digested with SacI, amplified from genomic DNA prepared from individual 72 hpf WT, dnmt3bb.1y258 heterozygous, and dnmt3bb.1y258 homozygous mutant embryos after blind scoring for cmyb expression by in situ hybridization. Eight out of 32 embryos scored showed weak expression of cmyb at 72 hpf, and all eight were homozygous mutants while the rest were wild type or heterozygotes.
Figure 2—figure supplement 2

Dnmt3bb.1 morpholino phenocopies TALEN-induced mutant defects.
(a) Schematic diagram showing the splice acceptor morpholino target site at the dnmt3bb.1 intron 3-Exon 4 boundary (red line) and positions of primers used to detect splicing changes (blue arrows). (b) RT-PCR gel image showing loss of correctly spliced dnmt3bb.1 transcripts in splice acceptor morpholino-injected animals. (c–f) WISH of 36 hpf trunks (c,d) and 72 hpf tails (e,f) from control (c,e) and dnmt3bb.1 (d,f) morpholino injected animals, probed for cmyb. cmyb is expressed in dnmt3bb.1 morphants at 36 hpf (arrows) but the expression is lost by 72 hpf (arrowheads). (g–j) WISH of 72 hpf tails probed for l-plastin (g,i) and 5 dpf heads probed for rag1 (h,j) from control (g,h) or dnmt3bb.1 (i,j) morpholino-injected animals. (k–n) WISH of 5 dpf embryos probed for gata1 expression in control (k,m) and dnmt3bb.1 (l,n) morpholino injected embryos. m,n, higher magnification images of highlighted areas from k,l. (o) Quantitative RT-PCR analysis at 5 dpf lck, ikaros and eGFPtranscript levels in WT siblings (red columns), dnmt3bb.1 mutants (green columsn), control morpholino (blue columns) or dnmt3bb.1 (yellow columns) morpholino-injected animals. Transcript levels are normalized to the reference gene elf1α and to levels in controls. (p,q) WISH of 5 dpf embryos probed for ikaros expression in control (p) and dnmt3bb.1 (q) morpholino injected embryos. Expression of l-plastin, rag1, gata1 and ikaros is present in controls (arrows) but reduced in dnmt3bb.1 morpholino-injected animals (arrowheads). (r,s) Confocal images of 5 dpf Tg(lck:gfp) embryos injected with control (q) or dnmt3bb.1 morpholinos. Scale bars 50 µm in d, 100 µm in f,i,j,n,p, 25 μm in r.
Figure 2—figure supplement 3
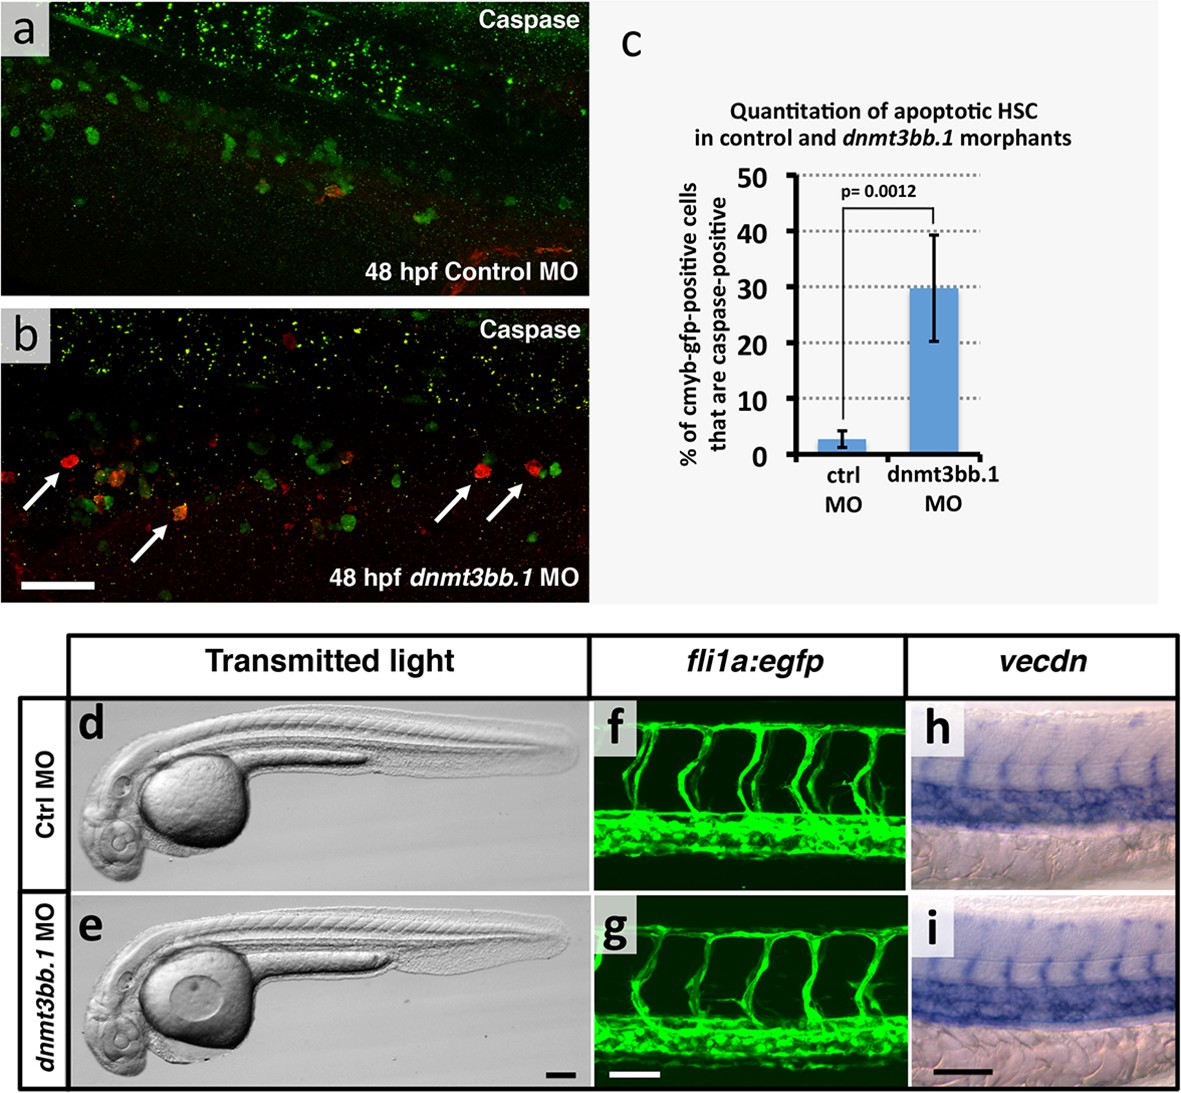
HSPCapoptosis but no gross morphological and vascular defects in in dnmt3bb.1 morphants.
(a,b) Immunohistochemical staining of the trunks of 48 hpf control (a) and dnmt3bb.1 (b) morpholino-injected Tg(cmyb:gfp) transgenic zebrafish with anti-GFP (green) and anti-caspase3 (red) antibodies, showing increased numbers of caspase3-positive HSPC in dnmt3bb.1-deficient animals. (c) Quantitation of the percentage of GFP (cmyb) positive HSPCs that are also caspase3-positive in 48 hpf control or dnmt3bb.1 morpholino-injected Tg(cmyb:gfp) transgenic zebrafish. Columns show mean ± SEM, and statistical significance calculated by paired t-test is shown (p = 0.0012). (d,e) Transmitted light images of whole 36 hpf control (d) and dnmt3bb.1 (e) morpholino-injected zebrafish, showing absence of developmental delay or gross morphological abnormalities in dnmt3bb.1 morphants. (f,g) Confocal images of trunk EGFP fluorescence in 36 hpf control (f) or dnmt3bb.1 (g) morpholino-injected Tg(fli1a:egfp)y1 transgenic zebrafish, showing normal trunk vessel patterning in dnmt3bb.1 morphants. (h,i) Whole mount in situ hybridization of the trunks of 36 hpf control (h) or dnmt3bb.1 (i) morpholino-injected zebrafish probed for vecdn, showing normal expression in dnmt3bb.1 morphants. All images are lateral views, rostral to the left. Scale bars 25 µm in b, 100 µm in e and 50 µm in g,i.
Figure 3 with 1 supplement
Dnmt3bb.1is necessary for epigenetic regulation of hematopoietic gene expression.
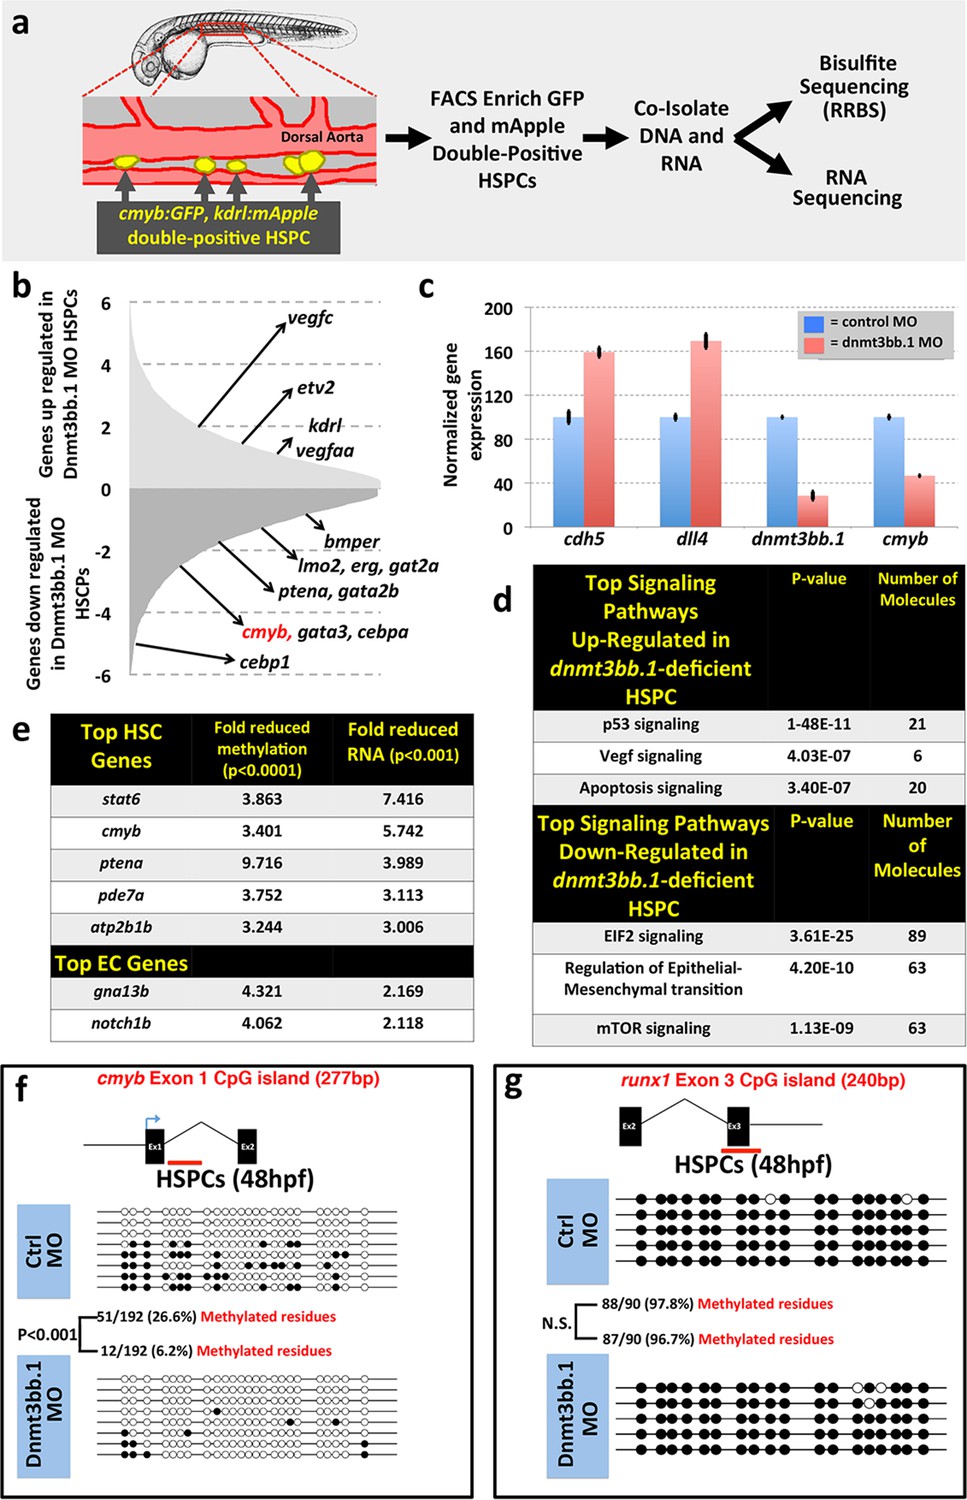
(a) Schematic diagram showing the experimental procedure for the isolation of GFP/mApple double-positive HSPCs from cmyb:GFP, kdrl:mApple double transgenic zebrafish and use of DNA and RNA from these HSPC for next-gen sequending projects (b) RNAseq analysis showing differentially expressed endothelial and hematopoietic genes in dnmt3bb.1 deficient HSPCs. (c) qRT-PCR analysis of selected genes from the RNAseq analysis. (d) Ingenuity Pathway Analysis (IPA) of the RNAseq data showing top pathways up- or down-regulated in dnmt3bb.1-deficient HSPCs. (e) Top five HSC-expressed genes with the most significantly reduced DNA methylation and expression from bisulfite and RNAseq analysis, respectively, as well as the top 2 endothelial genes. (f,g) Bisulfite sequencing analysis of DNA methylation at the cmyb intron 1 (f) and runx1 exon 3 (g) CpG islands in DNA isolated from control ('Ctrl MO', top) and dnmt3bb.1 ('Dnmt3bb.1 MO', bottom) morpholino-injected HSPCs, showing strongly reduced methylation of the cmyb CpG island but not the runx1 CpG island in dnmt3bb.1-deficient animals.
-
Figure 3—source data 1
Hematopoieticand Vascular genes with reduced methylation and altered expression in dnmt3bb. 1 morpholino-injected animals.
DNA methylation (p<0.0001) and RNA (p<0.001) expression fold changes for hematopoietic (left) and vascular (right) genes showing the most significant reduction in methylation in the RRBS dataset and change in RNA expression in the RNAseq dataset from FACS-enriched (as in Figure 3a) HSPC from dnmt3bb.1 morpholino- vs. control morpholino-injected animals.
- https://doi.org/10.7554/eLife.11813.010
Figure 3—figure supplement 1
Analysisof RNA seq and DNA methylation.
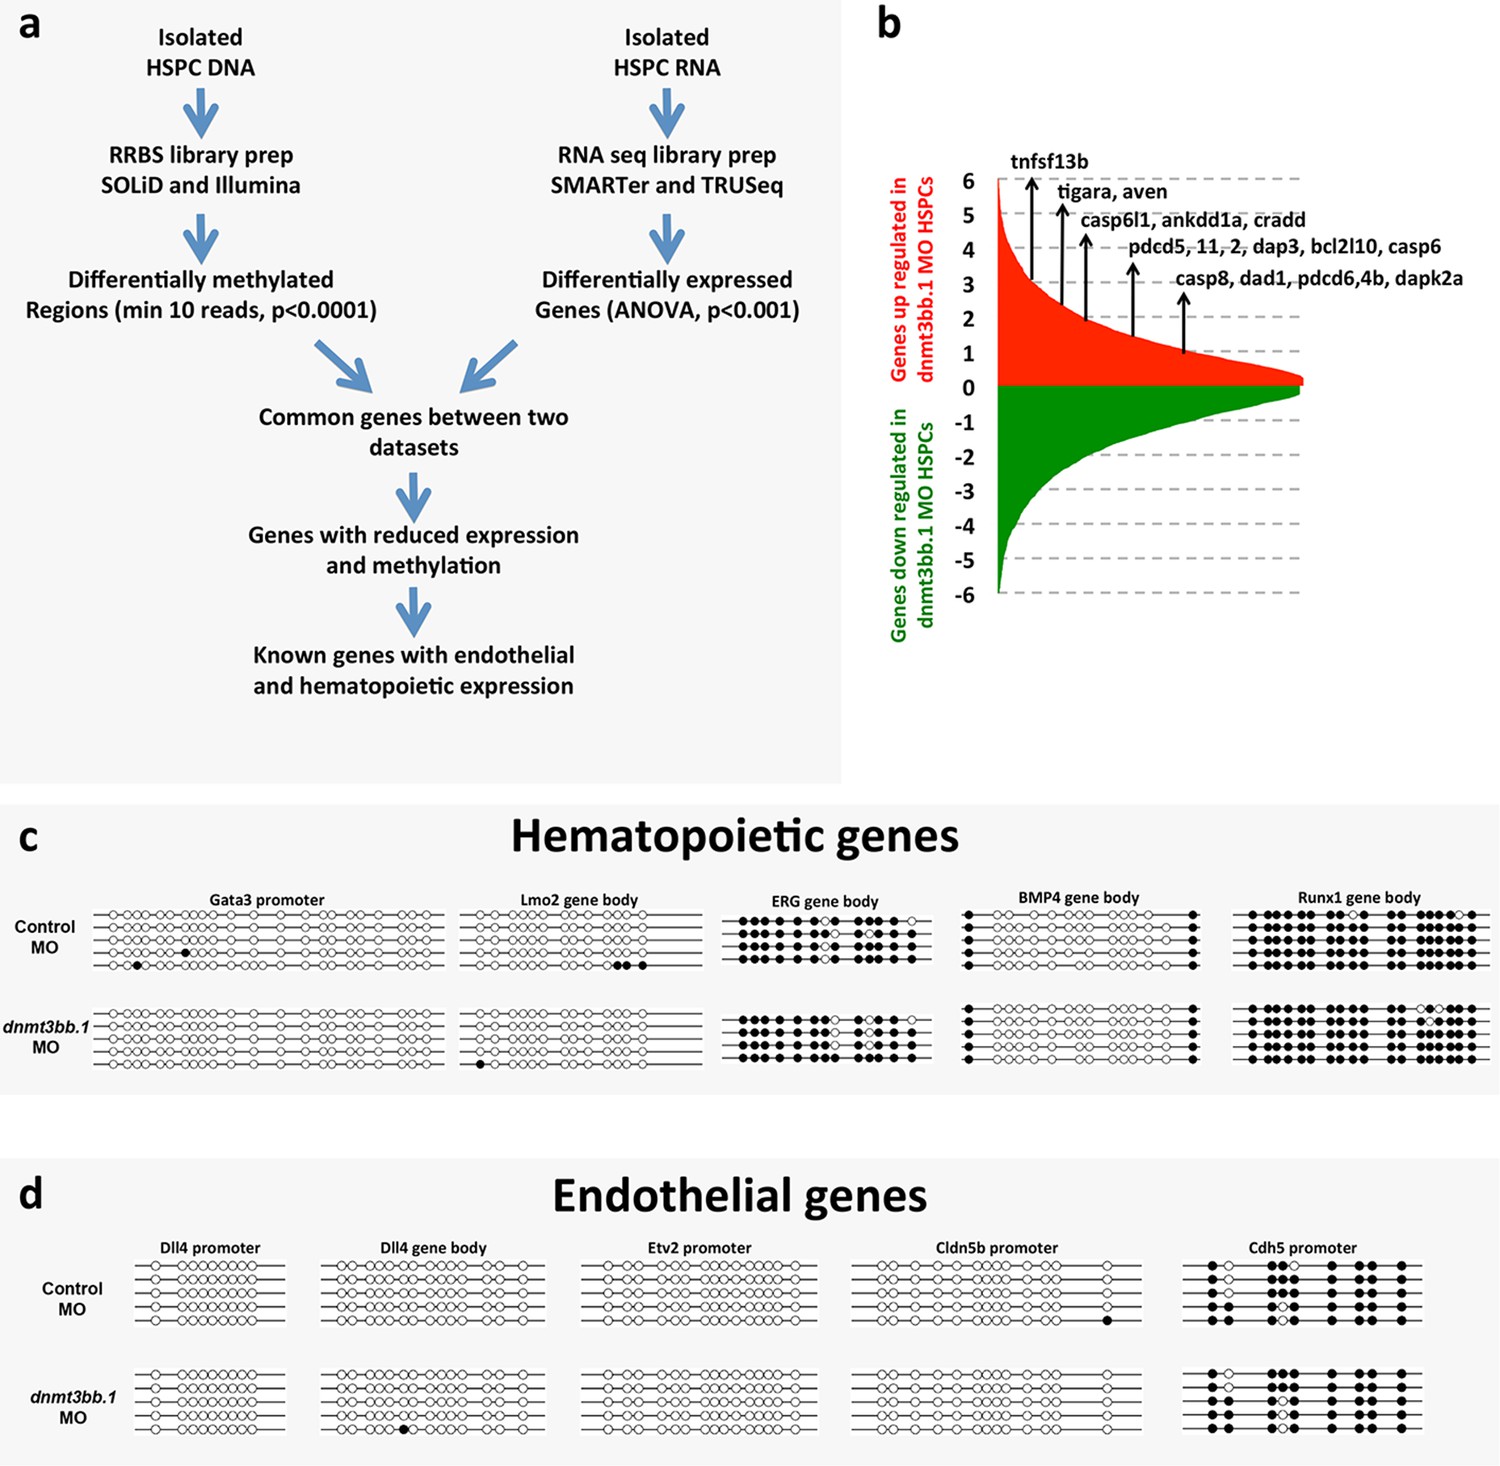
(a) Schematic diagram depicting the workflow for global RNAseq and DNA methylation (RRBS) analysis of control or dnmt3bb.1 deficient HSPCs. (b) RNA seq analysis showing upregulation of cell death genes in dnmt3bb.1-deficient HSPCs. (c,d) Bisulfite sequencing of CpG islands from hematopoietic (c) and endothelial (d) genes identified in the RNAseq analysis including hematopoietic genes gata3, lmo2, erg, bmp4 and runx1, c, and endothelial genes dll4, etv2, cldn5b and cdh5, d. None of the genes showed changes in methylation of their CpG islands.
Figure 4
Measurementof DNA methylation by bisulfite sequencing of gene body CpG islands from all known hematopoietic genes.
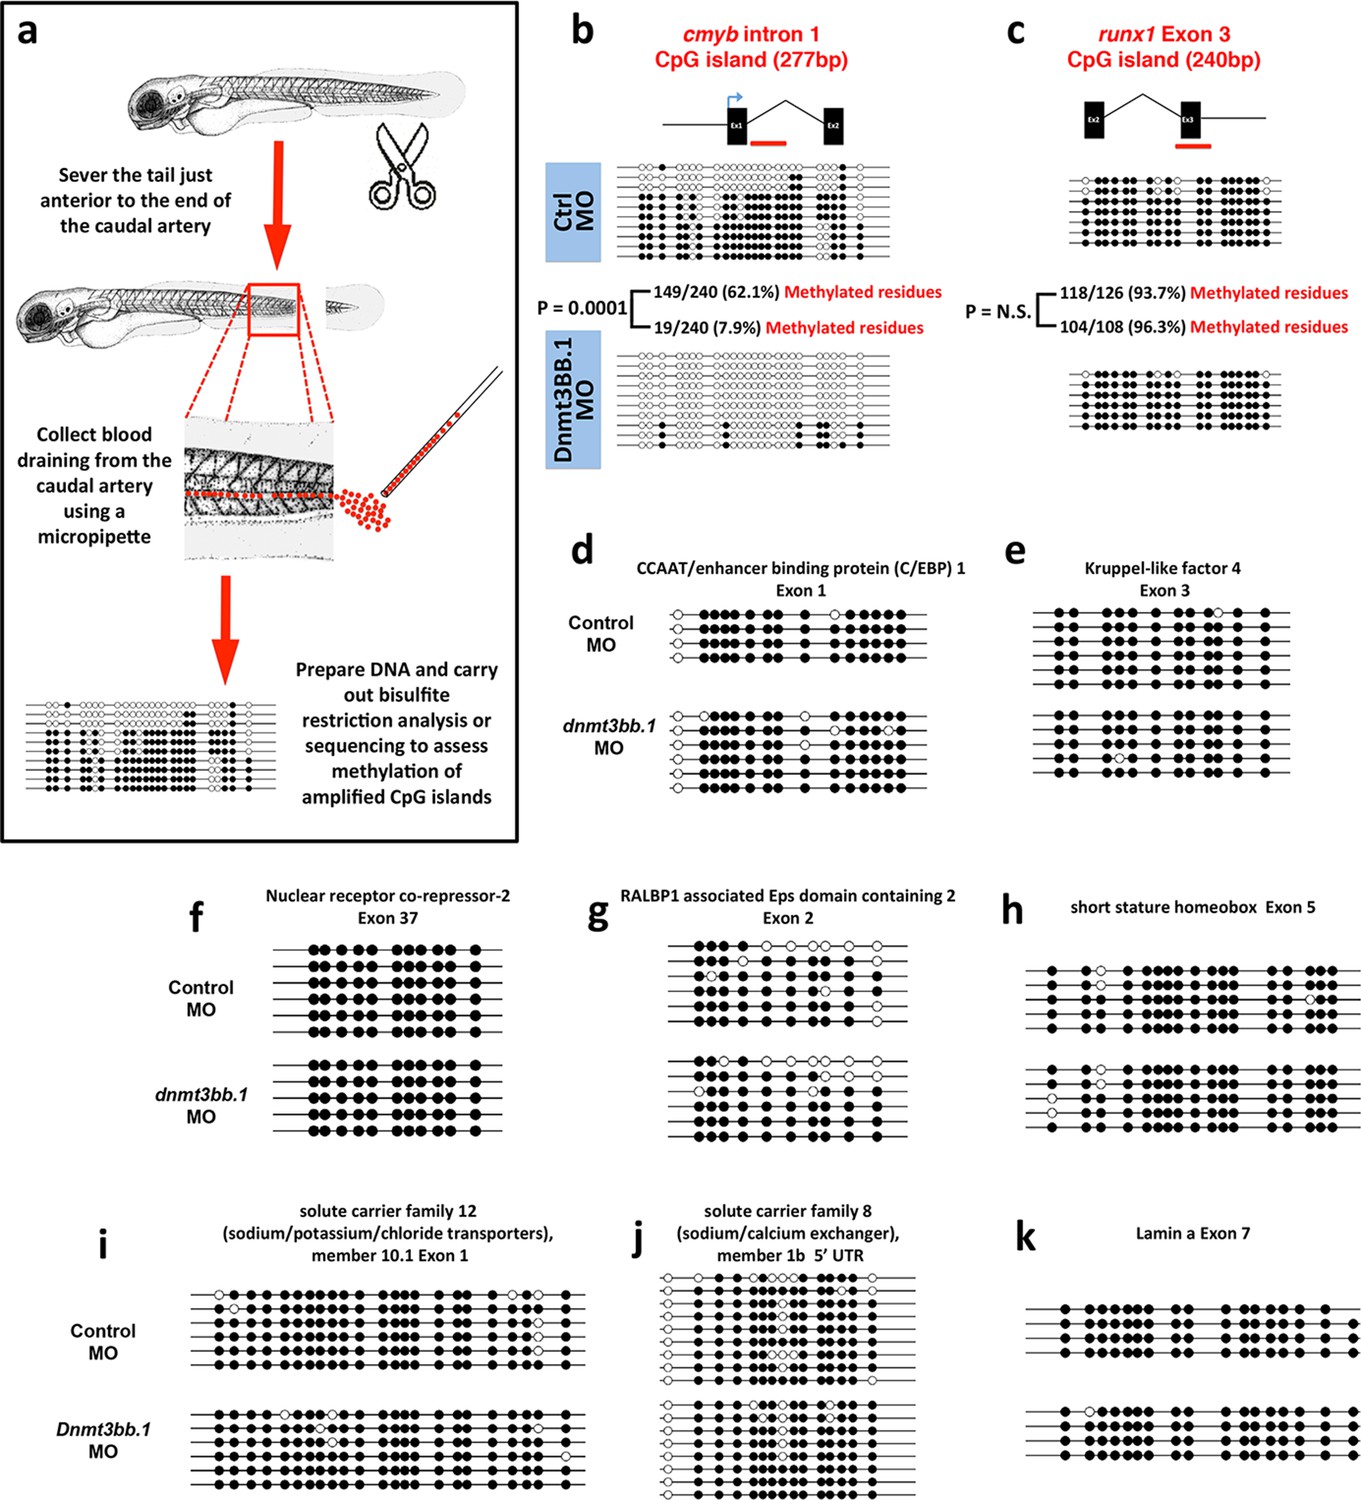
(a) Schematic diagram showing the method used to collect blood from 5–7 dpf embryos for bisulfite analysis. (b–k) Bisulfite sequencing of blood cell genomic DNA from 5–7 dpf control (top) and dnmt3bb.1 (bottom) morpholino-injected animals. The results are shown for ten different sequences identified in a genome-wide screen for gene body CpG islands methylated in blood cells: cmyb (b), runx1 (c), CCAT/enhancer binding protein 1-Exon 1 (d), Kruppel like factor 4-Exon 3 (e), Nuclear receptor co-repressor-2-Exon 37 (f), RALBP1 associated domain containing 2-Exon 2 (g), short stature homeobox-Exon 5 (h), solute carrier family 12-Exon 1 (i) and solute carrier family 8–5’ UTR (j), lamin a-Exon 7 (k). Open circles represent unmethylated and filled circles represent methylated cytosine residues from CpG dinucleotides.
Figure 5
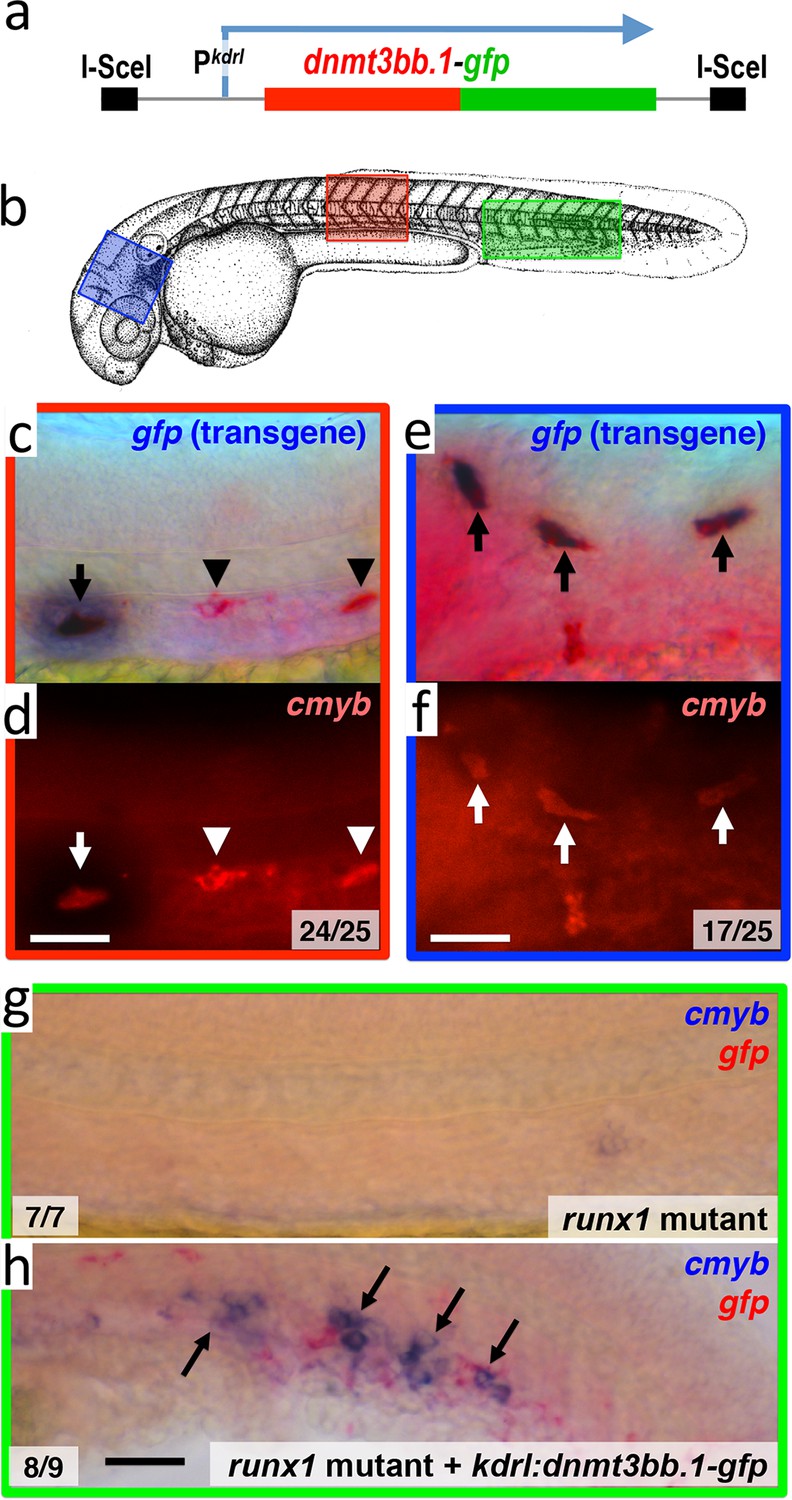
Dnmt3bb.1is sufficient for cmyb gene expression in the endothelium.
(a) Schematic diagram of the I-Sce1(kdrl:dnmt3bb.1-gfp) transgene used for the pan-endothelial expression of a dnmt3bb.1-gfp fusion protein. (b) Camera lucida drawing of a 24 hpf zebrafish embryo with red, blue and green boxes noting the approximate regions of the head, trunk and trunk/tail shown in in situ hybridization images in panels c-h. (c,e) Double whole-mount in situ hybridization of the head (e) and trunk (c) of 36 hpf I-Sce1(kdrl:dnmt3bb.1-gfp) transgene-injected zebrafish probed for gfp (blue) and cmyb (red). (d,f) fluorescence images of in situ hybridization corresponding to panels c and e, respectively. In panels c-e, endothelial cells expressing both the gfp transgene and cmyb are noted with arrows, while normal trunk HSC expressing only cmyb but not gfp are noted with arrowheads. (g,h) Double whole-mount in situ hybridization of the trunk/tail of a 36 hpf runx1 mutant (g) and a 36 hpf runx1 mutant injected with I-Sce1(kdrl:dnmt3bb.1-gfp) transgene (h), probed for cmyb (blue) and gfp (red). The cmyb gene is not expressed in runx1 mutants, but injection of dnmt3bb.1-egfp fusion protein into runx1 mutants results in the appearance of cmyb/gfp double-positive cells. Scale bars 25 µm in e,f and 100 µm in h.
-
Figure 5—source data 1
Mosaic expression of dnmt3bb.1:gfp in endothelial cells induces cmyb expression.
(I,II) Counts of numbers of 36 hpf ISceI(kdrl:gfp)- (I) or ISceI(kdrl:dnmt3bb.1-gfp)- (II) injected wild type animals with GFP transgene (purple) and cmyb (red) double-positive cells in either the trunk or head. (III) Counts of numbers of 3 dpf ISce1(kdrl:dnmt3bb.1-gfp)-injected runx1 mutant animals with GFP (purple) and cmyb (red) double-positive cells in the trunk. No cmyb-positive cells are observed in the trunks of un-injected runx1 mutants.
- https://doi.org/10.7554/eLife.11813.014
Figure 6 with 1 supplement
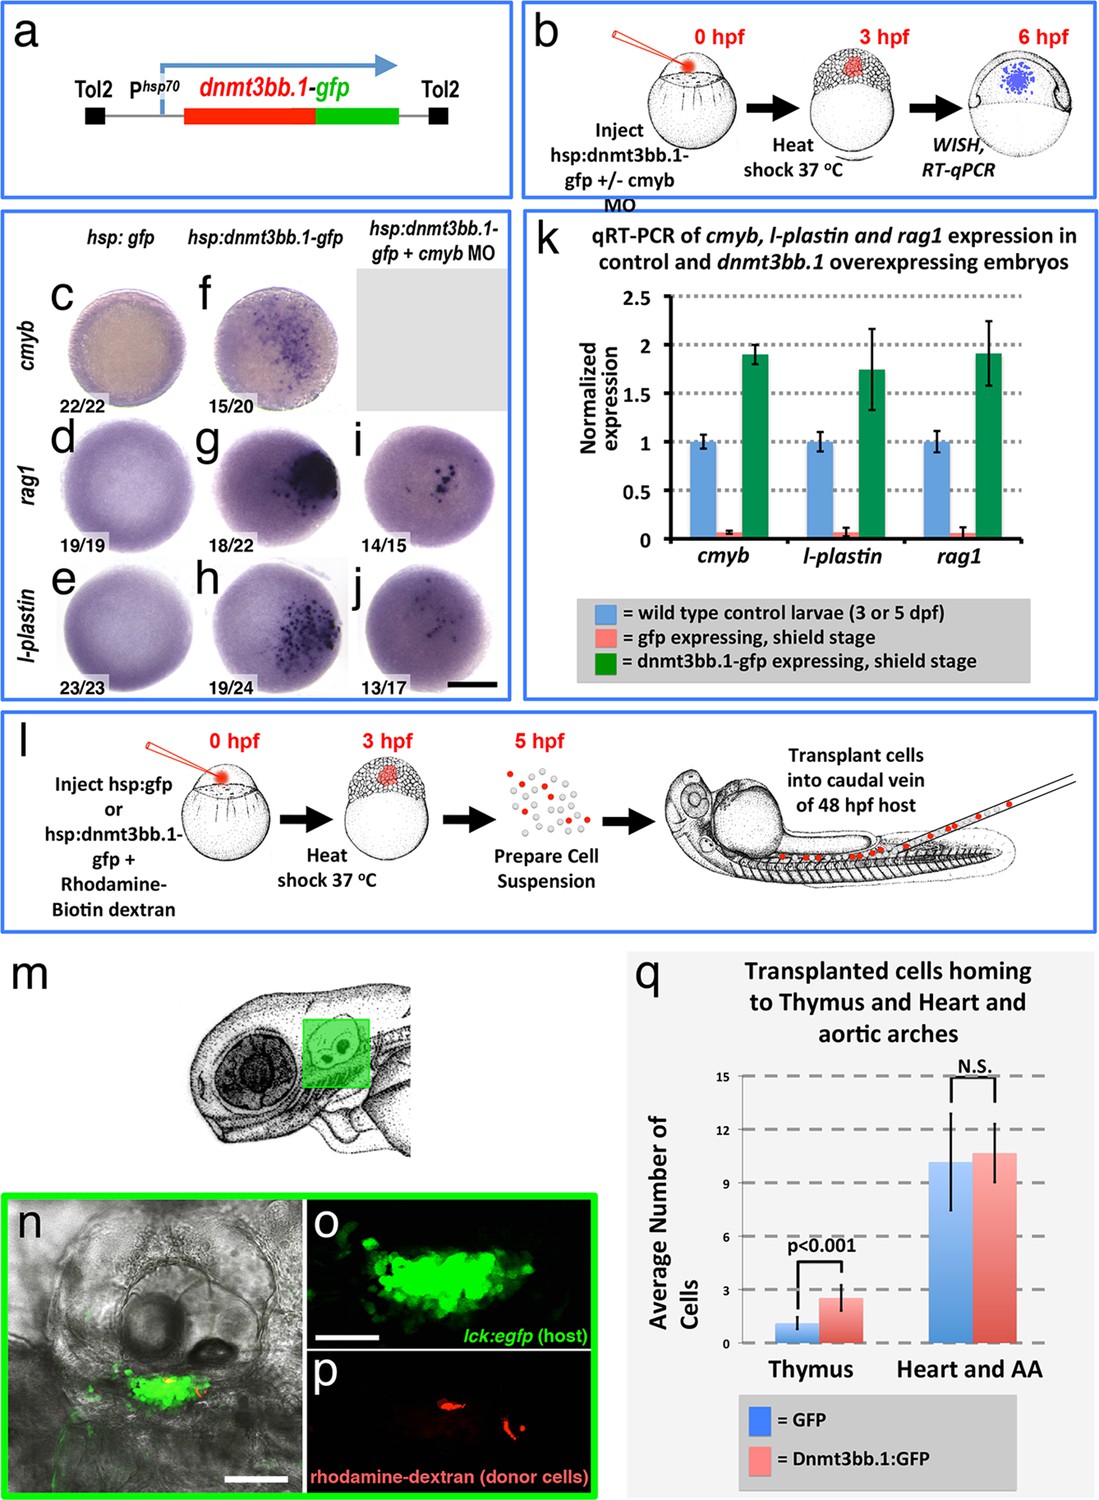
Dnmt3bb.1is sufficient for HSPC and downstream lineage gene expression.
(a) Schematic diagram of the Tol2(hsp70:dnmt3bb.1-gfp) transgene used for ubiquitous heat shock-inducible expression of dnmt3bb.1-gfp fusion protein. (b) Camera lucida drawing showing the experimental protocol employed for early embryonic induction of dnmt3bb.1. One cell-stage embryos are injected with Tol2(hsp70:dnmt3bb.1-gfp) transgene +/- cmyb morpholino (MO), raised to 3 hpf (mid-blastula stage), heat shocked, allowed to further develop to 6 hpf (shield stage), then either fixed for whole mount in situ hybridization (WISH) or collected to prepare RNA for RT-qPCR. (c–j) Whole mount in situ hybridization of 6 hpf control Tol2(hsp70:gfp) transgene-injected (c-e), Tol2(hsp70:dnmt3bb.1-gfp) transgene-injected (f-j), or Tol2(hsp70:dnmt3bb.1-gfp) transgene plus cmyb morpholino (MO)-injected (i,j) zebrafish embryos, probed for cmyb (c,f), rag1 (d,g,i), or l-plastin (e,h,j). (k) Quantitative RT-PCR analysis of cmyb, l-plastin, and rag1transcript levels in positive control untreated 3 dpf (for cmyb and l-plastin) or 5 dpf (for rag1) larvae (blue columns), negative control shield stage (6 hpf) embryos injected with a Tol2(hsp70:egfp) transgene and heat shocked at 3 hpf (red columns), or shield stage (6 hpf) embryos injected with an Tol2(hsp70:dnmt3bb.1-egfp) transgene and heat shocked at 3 hpf (green columns). (l) Schematic drawing showing the experimental protocol employed for early embryonic induction of dnmt3bb.1-gfp and subsequent transplantation of cells into the circulation. One cell-stage embryos were injected with Tol2(hsp70:egfp) or Tol2(hsp70:dnmt3bb.1-egfp) transgenes, raised to 3 hpf (mid-blastula stage), heat shocked, and allowed to develop to 5 hpf, at which point the embryos were dissociated and cell suspensions was prepared. Dissociated cells were injected into the circulation of 48 hpf host larvae using a borosilicate needle without filament. (m) Camera lucida drawing of a 72 hpf zebrafish embryo with a green box noting the approximate regions containing the thymus. (n–p) Confocal images of a 5 dpf Tg(lck:GFP)cz1 host animal showing transplanted cells colonizing the thymus. Transmitted light image (n), green fluorescent lck:gfp positive host thymus (n,o), and red fluorescent rhodamine-dextran positive donor cells populating the thymus (p). (q) Quantitation of the number of control GFP and dnmt3bb.1-GFP expressing cells in the thymus and heart/aortic arch region. Images in panels c-f,r,s are dorsal views and panels n-p are lateral views. Scale bars = 150 µm in c-j, 25 µm in n, 10 µm in o.
Figure 6—figure supplement 1
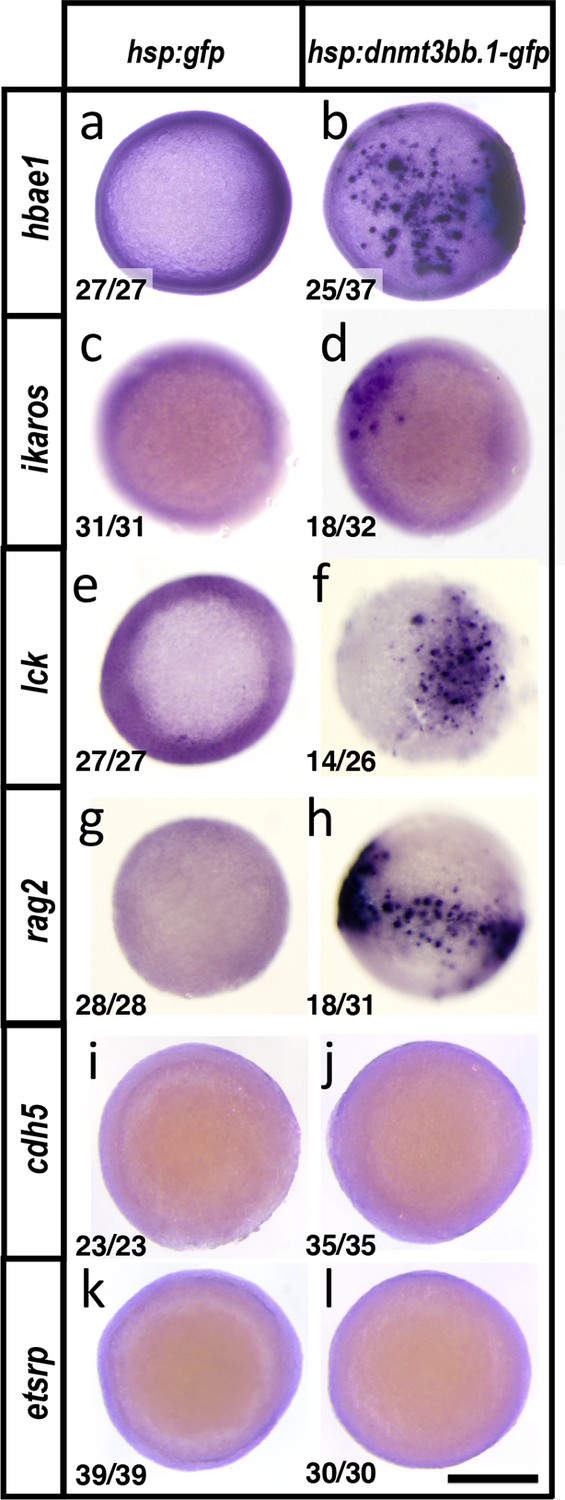
Dnmt3bb.1induces hematopoietic but not endothelial gene expression in early embryos.
(a-l) Whole mount in situ hybridization of 6 hpf control Tol2(hsp70:gfp) (a,c,e,g,i,k) or Tol2(hsp70:dnmt3bb.1-gfp) (b,d,f,h,j,l) transgene-injected zebrafish embryos, probed for hbae1 (a,b), ikaros (c,d), lck (e,f), rag2 (g,h), cdh5 (i,j) and etsrp (k,l) All panels show animal pole views. Scale bar 150 µm in l.
Figure 7
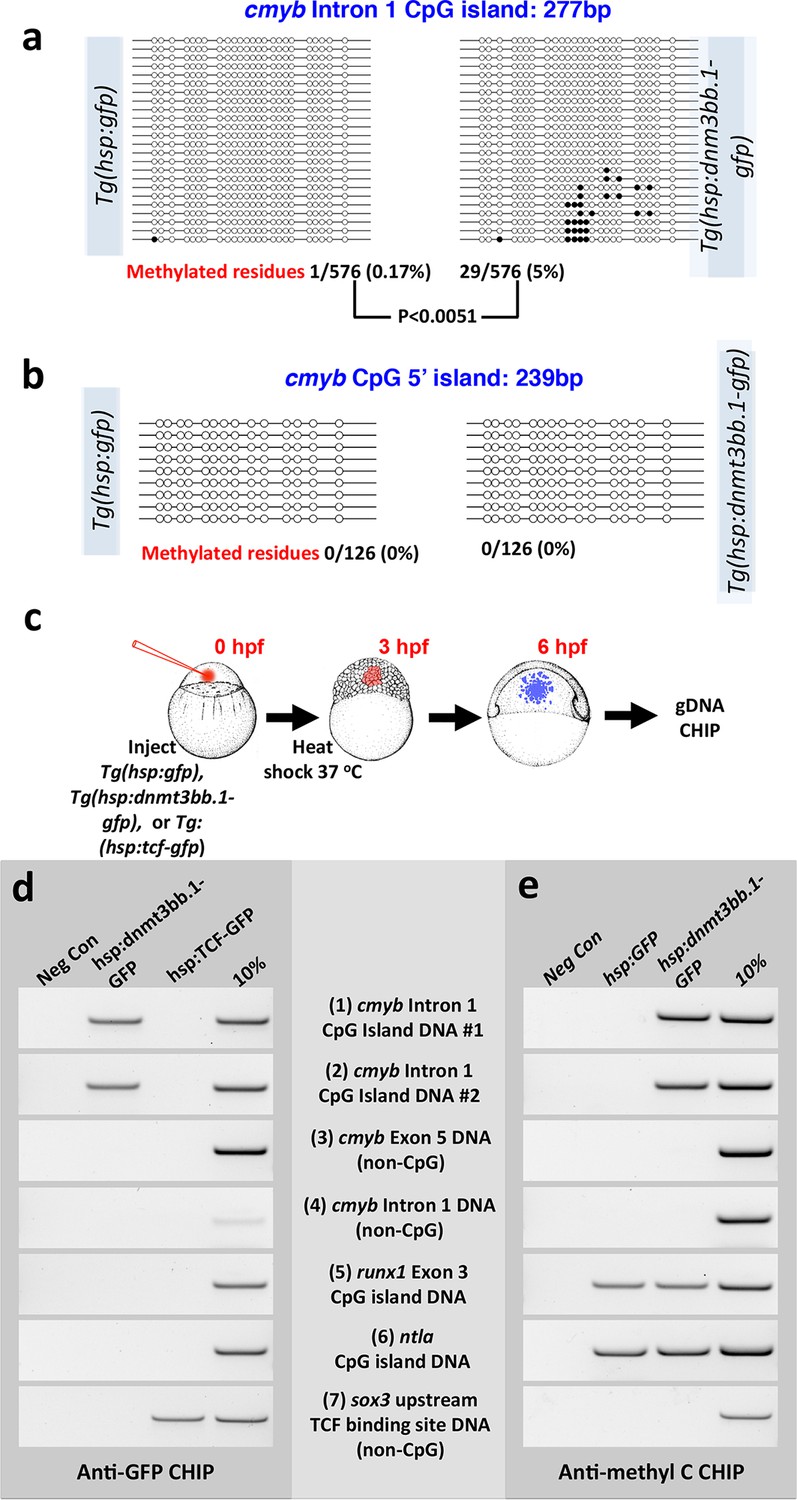
Dnmt3bb.1induces methylation of cmyb exon 1 CpG island DNA in early embryos.
(a,b) Bisulfite sequencing of genomic DNA from 6 hpf control Tol2(hsp70:gfp) transgene- or Tol2(hsp70:dnmt3bb.1-gfp) transgene-injected embryos to assess methylation of the cmyb intron 1 CpG island (a) or cmyb 5’ CpG island (b). Open circles represent unmethylated cytosine residues and filled circles represent methylated cytosine residues from CpG dinucleotides. Methylation of the intron 1 CpG island is detected in dnmt3bb.1-gfp expressing embryos, but not in control gfp-expressing embryos. (c–e) Chromatin immunoprecipitation (CHIP) using anti-GFP or anti-methylcytosine antibodies to detect Dnmt3bb.a-GFP (or TCF-GFP control) fusion protein binding or cytosine methylation in CpG islands (CGI), respectively. (c) Schematic diagram showing the experimental procedure used for CHIP analysis, (d) Anti-GFP CHIP with either no added chromatin (negative control; column 1) or with chromatin from either hsp:dnmt3bb.1-GFP injected embryos (column 2) or from hsp:TCF-GFP injected embryos (column 3; CHIP positive control). Column 4 is 10% of input chromatin from hsp:dnmt3bb.1-GFP injected embryos. (e) Anti-methylcytosine CHIP with either no added chromatin (negative control; column 1) or using chromatin from hsp:GFP injected embryos (column 2; negative control for dnmt3bb.1-gfp methylation) or from hsp:dnmt3bb.1-GFP -injected embryos (column 3). Column 4 is 10% of input chromatin from hsp:dnmt3bb.1-GFP injected embryos. Primers used for the CHIP experiments in both e and f were: (1) cmyb Intron 1 CpG Island DNA, site #1, (2) cmyb Intron 1 CpG Island DNA, site #2, (3) cmyb Exon 5 DNA (non-CpG island), (4) cmyb Intron 1 DNA (non-CpG island), (5) runx1 Exon 3 CpG island DNA, (6) ntla CpG island DNA, and (7) sox3 upstream TCF binding site DNA (non-CpG).
Figure 8 with 1 supplement

Hematopoieticdefects in adult dnmt3bb.1y258 Mutants.
(a,b) Wild type sibling (a) and dnmt3bb.1y258homozygous mutant (b) adult zebrafish. (c) Representative low-magnification sagittal section through a dnmt3bb.1y258 homozygous mutant adult zebrafish, showing the head kidney (marked an arrow and surrounded by a dashed line), a major site of hematopoiesis in adult zebrafish. (d,e) Representative higher magnification images of sagittal sections through the head kidneys of wild type sibling (d) and dnmt3bb.1y258 mutant (e) adult zebrafish, stained with hematoxylin/eosin. (f) quantitation of the percentage of the hematopoietic (non-kidney tubule) area that is acellular in head kidney sections from wild type sibling (left column) and dnmt3bb.1y258 mutant (right column) adult zebrafish. (g,h) Giemsa -stained blood smears from wild type sibling (g) and dnmt3bb.1y258 mutant (h) adult zebrafish. (i) quantitation of the adult erythroid cell circularity in WT and dnmt3bb.1y258 mutant (see Materials and methods), measured from blood smears such as those in panels g and h. (j,k) Giemsa stained FACS-sorted HSPC (as in Figure 3a) from 36 hpf dnmt3bb.1 (j) or control (k) morpholino-injected zebrafish.
Figure 8—figure supplement 1
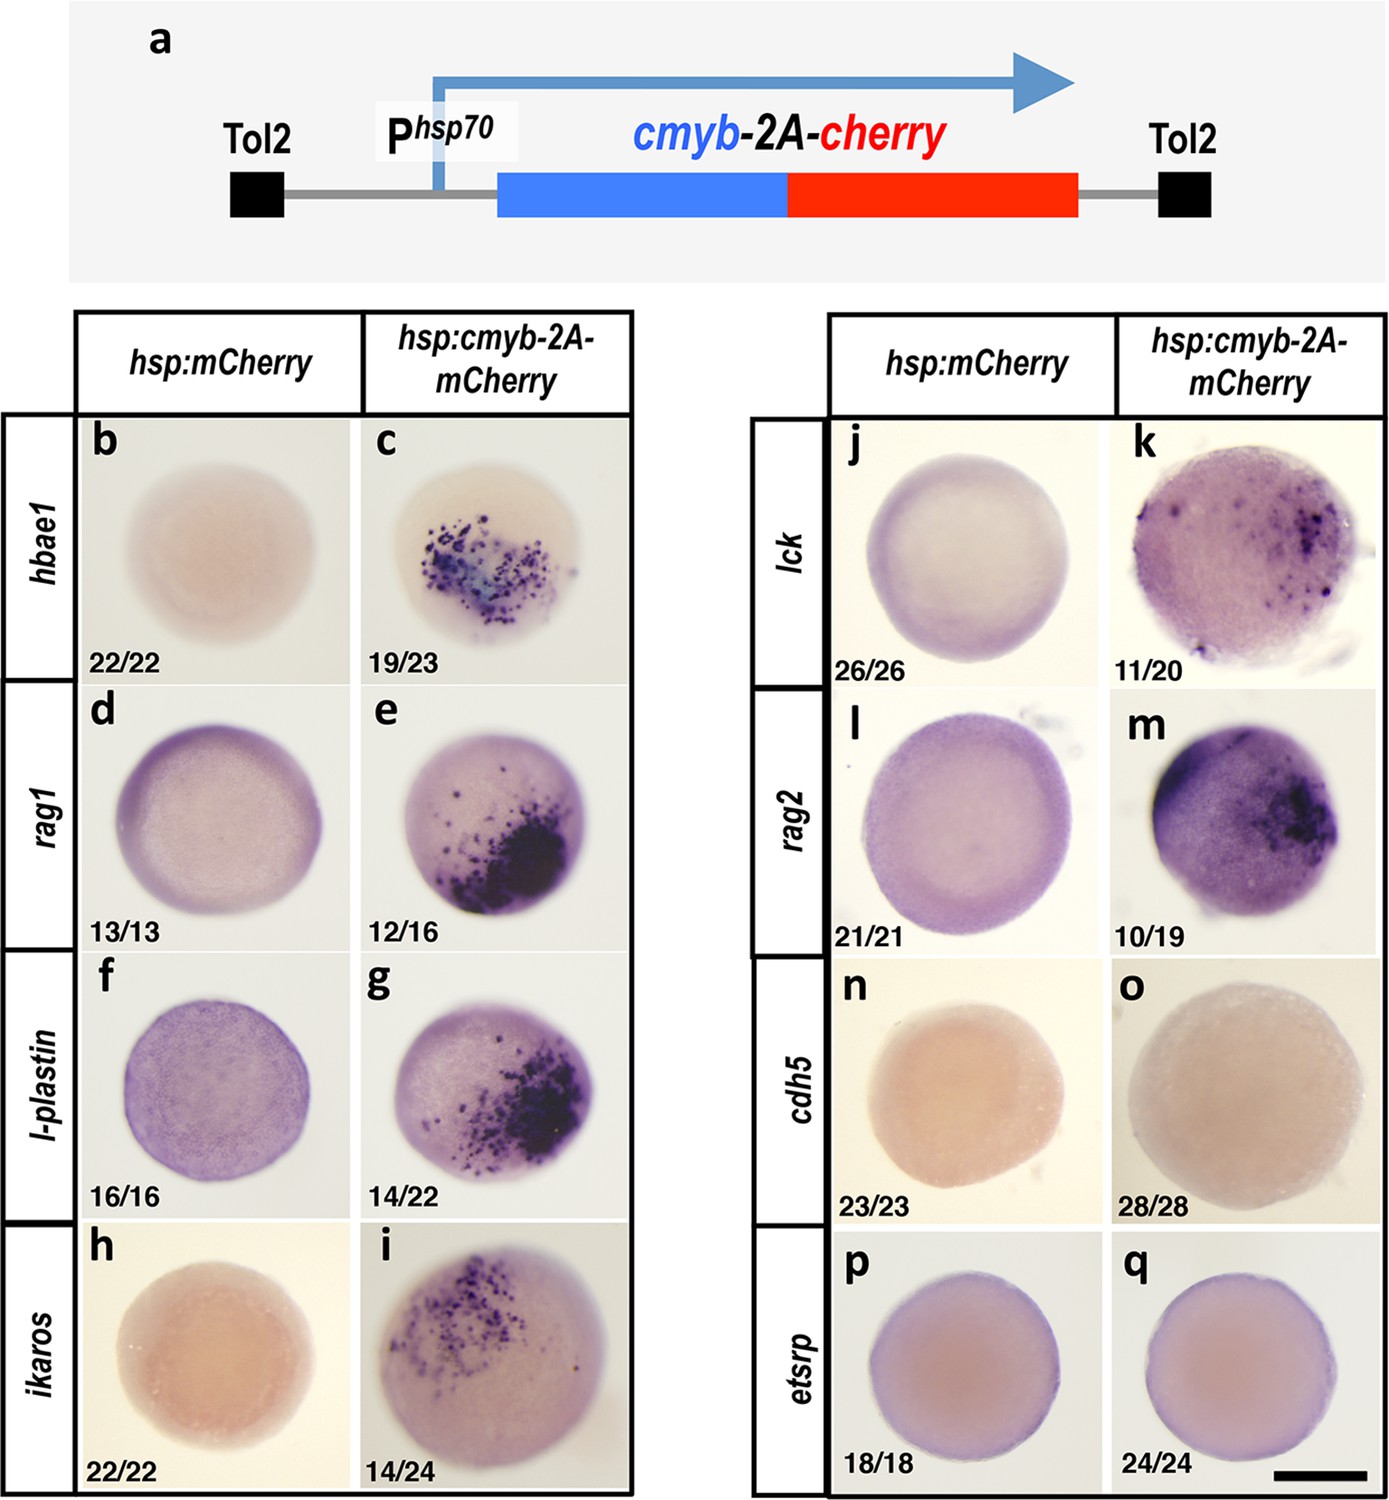
Cmybinduces hematopoietic but not endothelial gene expression in early embryos.
(a) Schematic diagram of the Tol2(hsp70:cmyb-2A-mCherry) transgene used for ubiquitous heat shock-inducible expression of cmyb. (b–q) WISH of 6 hpf control Tol2(hsp70:mCherry) (b,d,f,h,j,l,n,p) or Tol2(hsp70:cmyb-2A-mCherry) (c,e,g,i,k,m,o,q) transgene-injected zebrafish embryos, probed for hbae1 (b,c), rag1 (d,e), l-plastin (f,g), ikaros (h,i), lck (j,k), rag2 (l,m), cdh5 (n,o), and etsrp (p,q) All panels show animal pole views. Scale bar 150 µm in q.
Figure 9
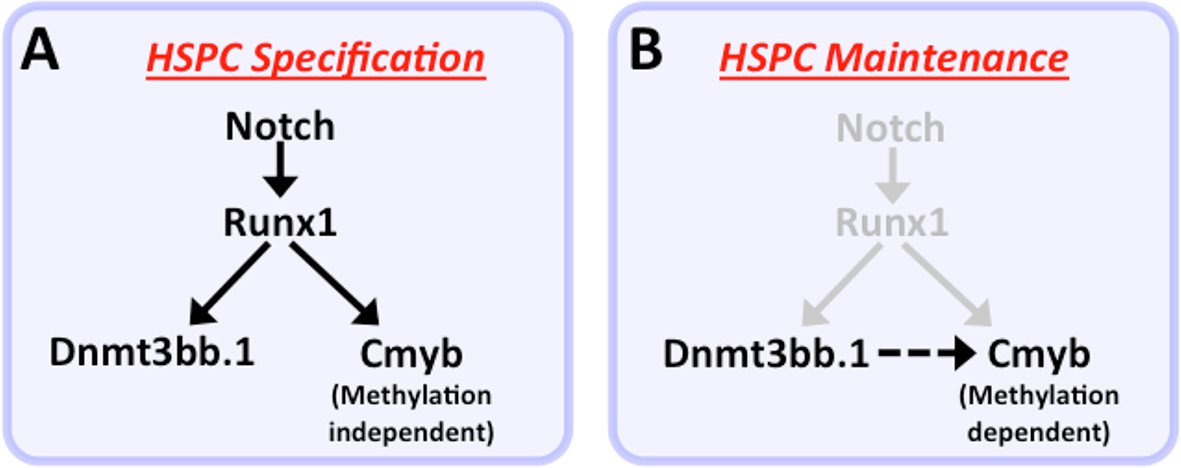
Modelfor regulation of HSPC cell fate during development.
(a) Notch-Runx1 signaling controls specification of HSPCs in the ventral wall of the dorsal aorta during early embryogenesis. This signaling pathway initiates HSPC expression of both the key transcription factor Cmyb and the epigenetic regulator Dnmt3bb.1. (b) As development proceeds Runx1 expression is down-regulated and continued maintenance of active Cmyb expression in HSPC depends on Dnmt3bb.1–mediated Cmyb gene body DNA methylation, ensuring maintenance of HSPC cell fate during the Runx1-independent phase.
Additional files
-
Supplementary file 1
(A) List of morpholinos used in the study.
A list of all of the antisense morpholino oligonucleotides used in this study. (B) List of primers used in the study. A list of all of the primer pairs used for qRT-PCR, bisulfite sequencing, genotyping, cloning and CHIP analysis in this study. (C) List of primers used in targeted blood specific CpG island screen. A list of all the primers used for the targeted blood specific CpG island screen (Analysis shown in Figure 4).
- https://doi.org/10.7554/eLife.11813.021
Download links
A two-part list of links to download the article, or parts of the article, in various formats.
Downloads (link to download the article as PDF)
Open citations (links to open the citations from this article in various online reference manager services)
Cite this article (links to download the citations from this article in formats compatible with various reference manager tools)
Epigenetic regulation of hematopoiesis by DNA methylation
eLife 5:e11813.
https://doi.org/10.7554/eLife.11813


