Blue light-induced LOV domain dimerization enhances the affinity of Aureochrome 1a for its target DNA sequence
- Max Planck Institute for Medical Research, Germany
Figures
Figure 1
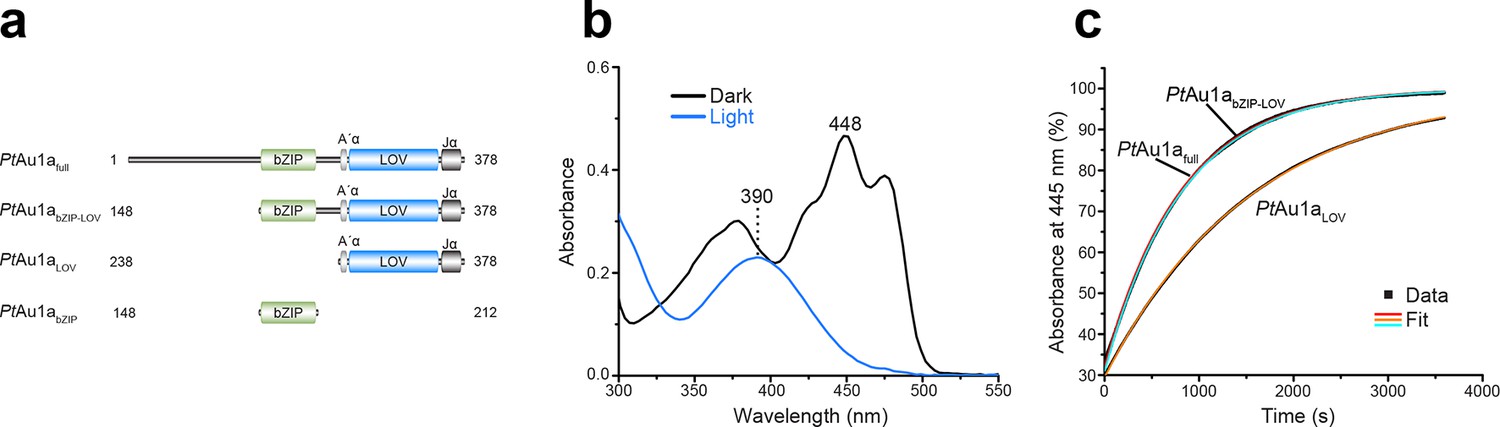
Absorption spectra of PtAu1afull and dark state recovery kinetics of the LOV domain-containing PtAu1a variants.
(a) Schematic representation of the PtAu1a constructs used in this study. (b) Absorption spectrum of PtAu1afull in the dark (black) and after illumination with blue light (blue). In the dark, the typical signature of an oxidized FMN chromophore can be detected. Upon light activation, these maxima decrease and a new absorption band appears at 390 nm, indicating FMN-cysteine adduct formation. (c) Recovery kinetics of the absorbance at 445 nm of PtAu1afull, PtAu1abZIP-LOV and PtAu1aLOV after light-activation. The red (PtAu1afull), cyan (PtAu1abZIP-LOV) and orange (PtAu1aLOV) lines in the plot represent an exponential fit to the data (black squares). Measurements were performed at a protein concentration of 20 µM and time constants represent the mean of three independent measurements. LOV, light-oxygen-voltage; FMN, flavin mononucleotide.
Figure 2 with 1 supplement
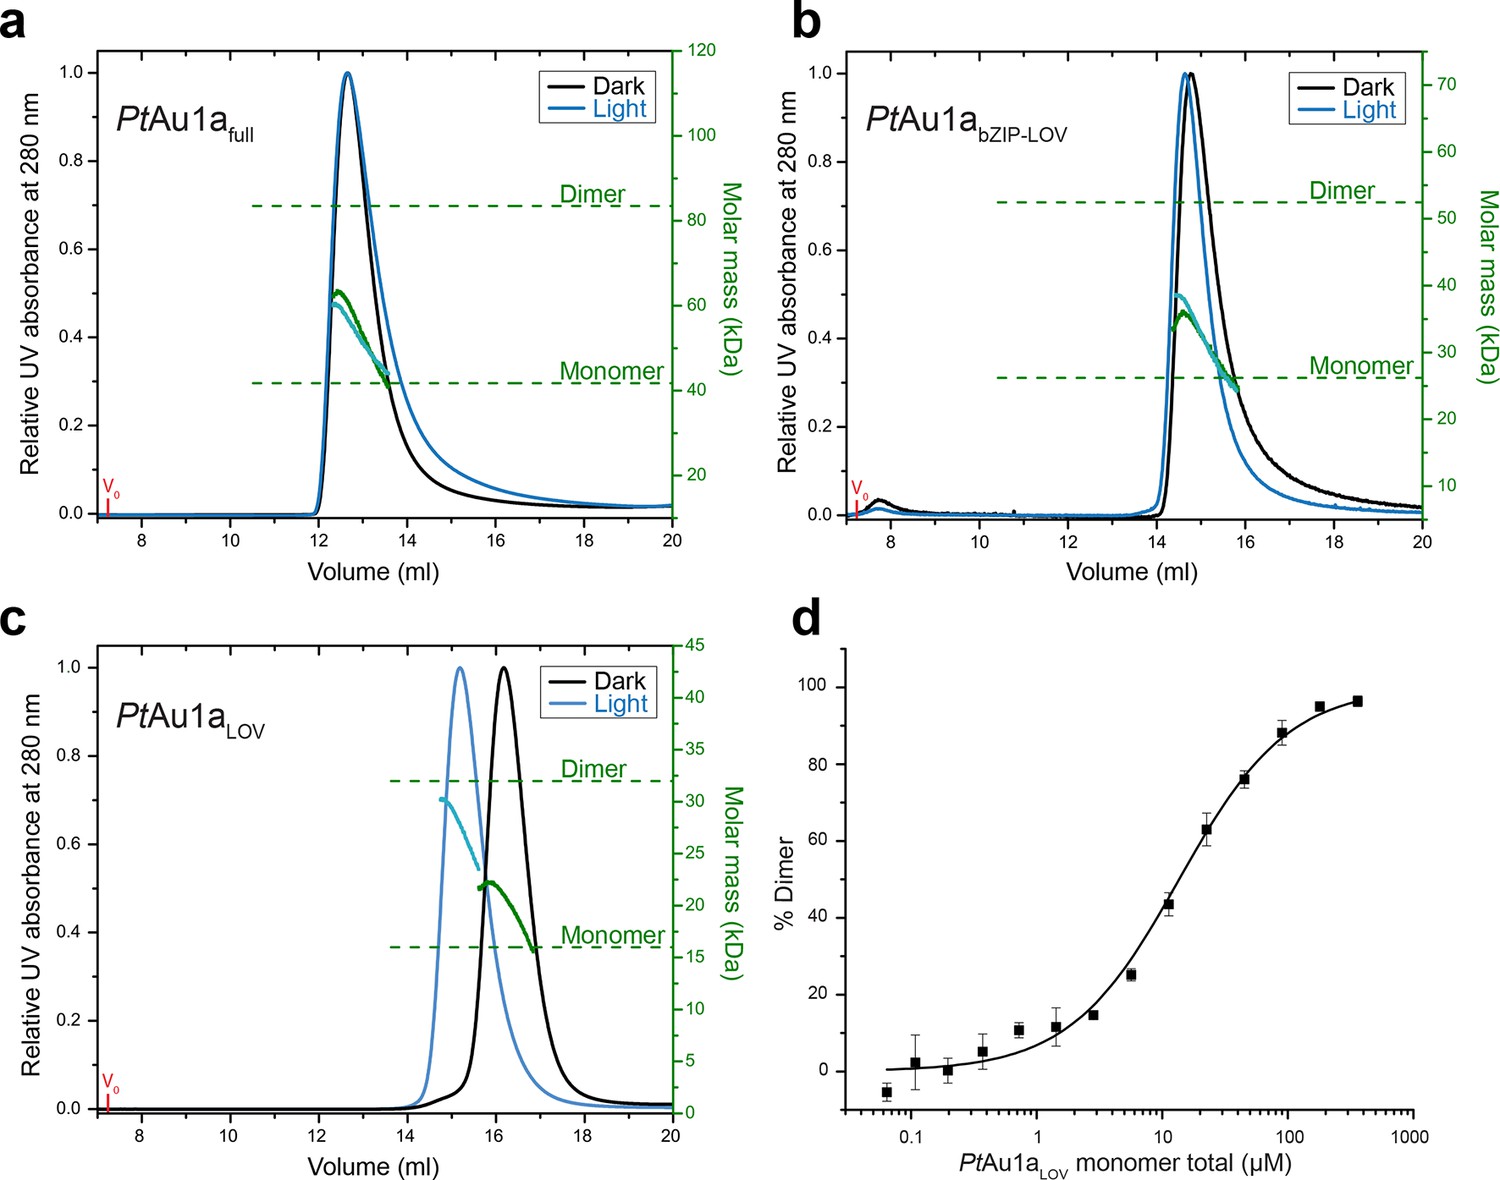
Domains involved in PtAu1a dimerization.
Normalized MALS detection of PtAu1afull (a), PtAu1abZIP-LOV (b) and PtAu1aLOV (c) fractionated by size-exclusion chromatography in the dark (black traces) and light (blue traces). The MALS-derived molar-mass signals are shown in green (dark runs) and blue–green (light runs). Additional experiments performed for PtAu1afull and PtAu1abZIP-LOV in the light at varying protein concentrations are shown in Figure 2—figure supplement 1. (d) Quantification of the monomer-dimer equilibrium of PtAu1aLOV in the dark by MST. Error bars represent the standard deviation of three individual experiments. MALS, multi-angle light scattering; MST, microscale thermophoresis.
Figure 2—figure supplement 1
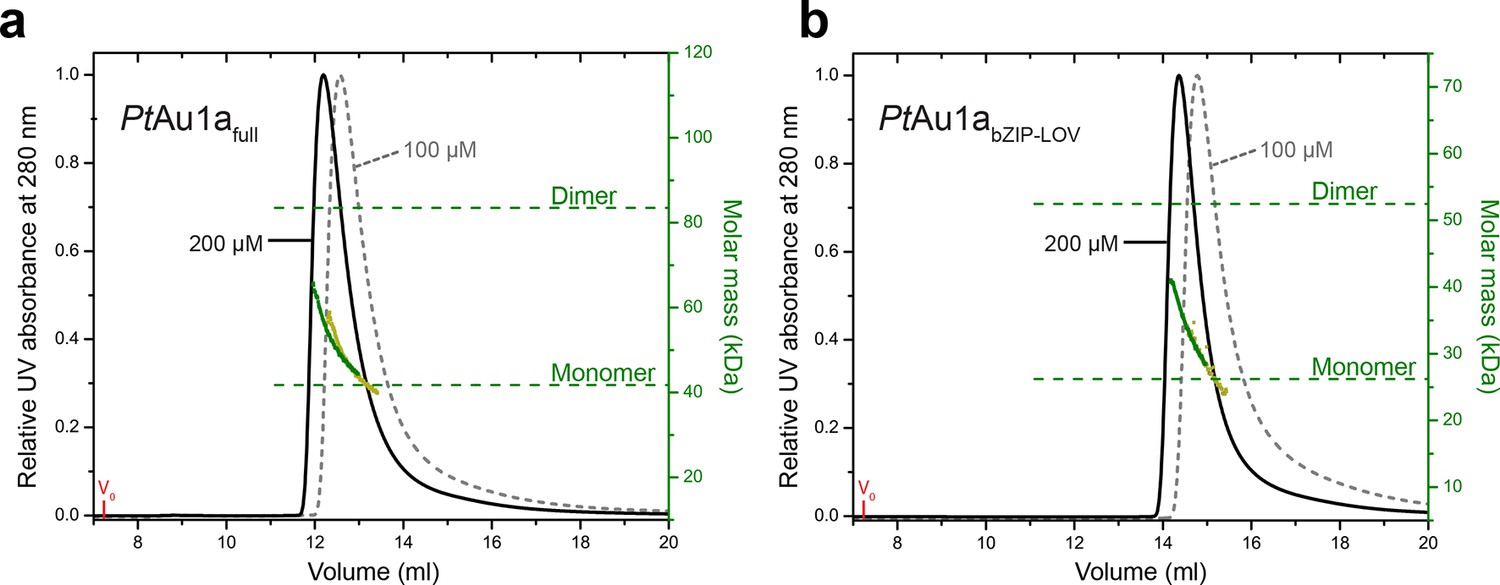
Concentration dependent elution profiles of PtAu1afull and PtAu1abZIP-LOV in the light.
Normalized MALS detection of PtAu1afull (a) and PtAu1abZIP-LOV (b) fractionated by size-exclusion chromatography at protein concentrations of 200 µM (black traces) and 100 µM (dashed gray traces) in the light. The MALS-derived molar mass signals are shown in green (200 µM) and yellow–green (100 µM). PtAu1afull and PtAu1abZIP-LOV were pre-incubated at 20°C under continuous blue light illumination (400 μW cm-2 at 450 nm) from a royal blue (455 nm) collimated LED lamp (Thorlabs) for 5 min. 100 μl protein solution was subjected to size-exclusion chromatography at RT on a Superdex 200 Increase 10/300 GL column (GE Healthcare, Uppsala, Sweden) equilibrated in buffer C. LED, light emitting diode; MALS, multi-angle light scattering; RT, room temperature.
Figure 3 with 3 supplements
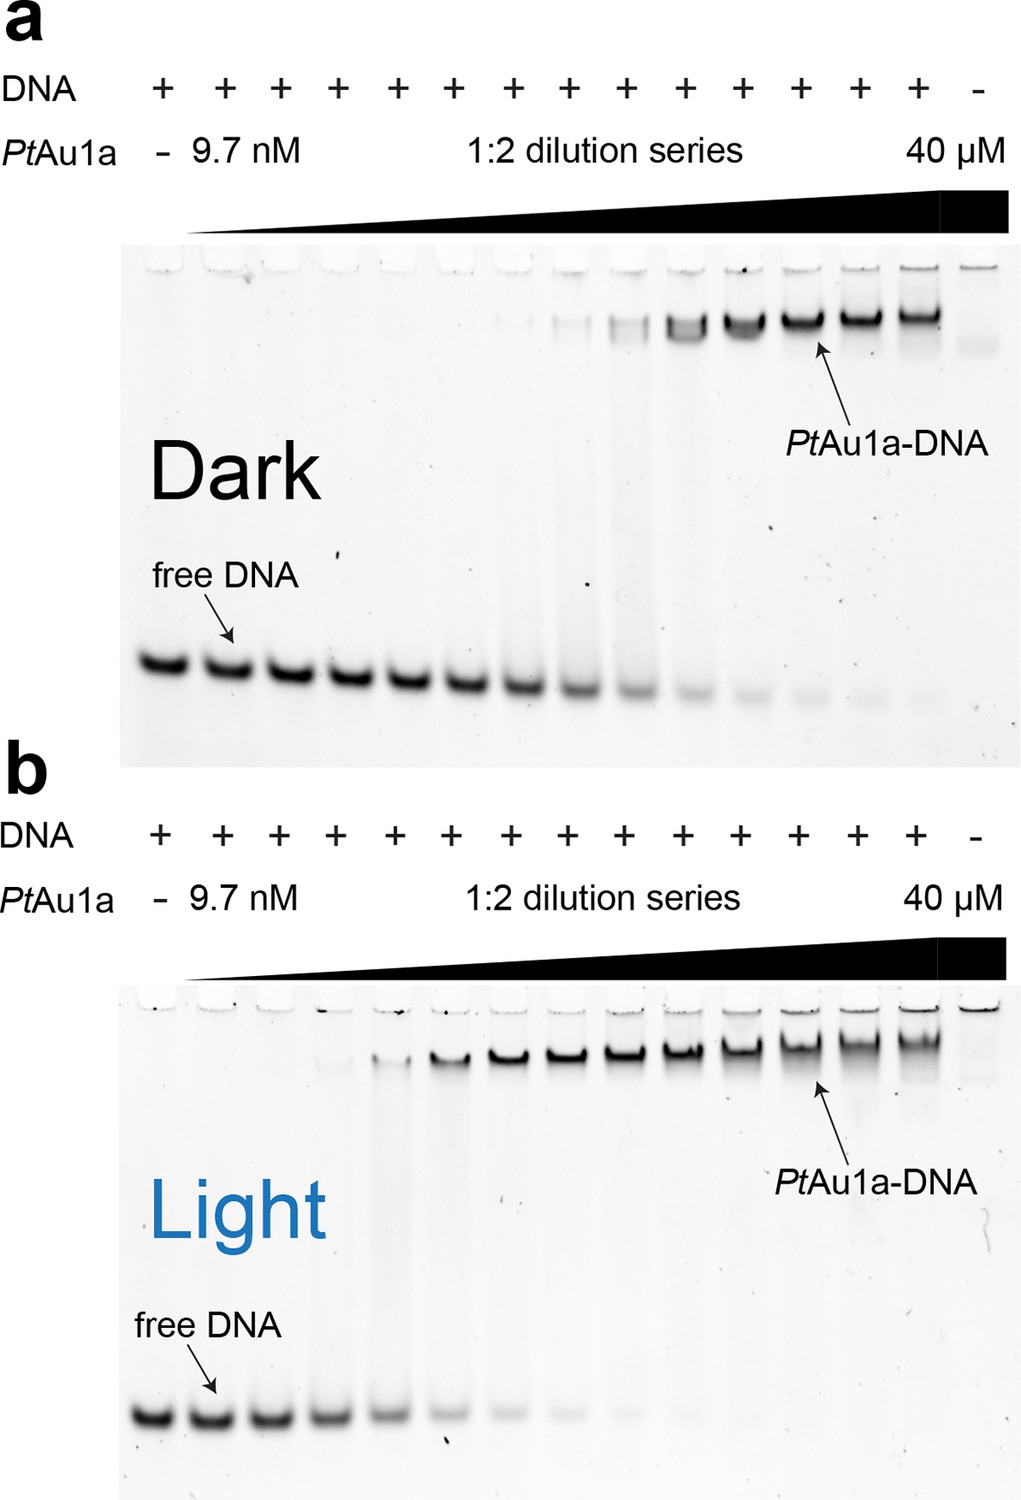
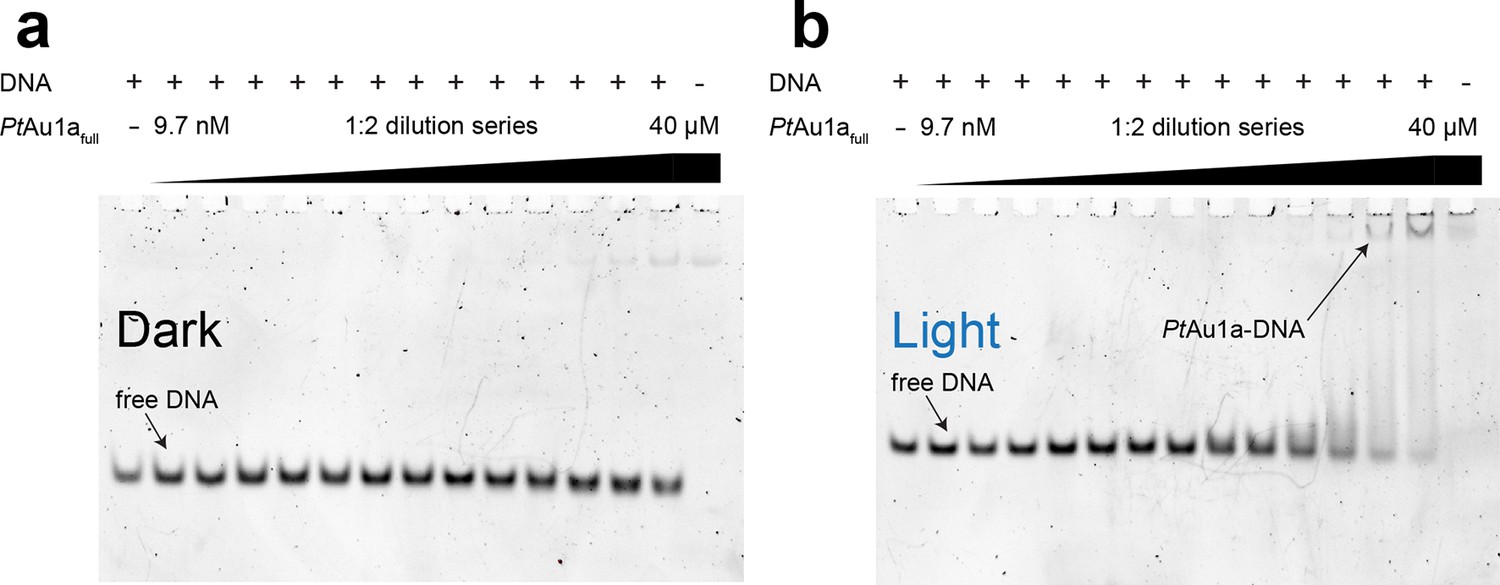
Blue light illumination enhances DNA binding of PtAu1afull to its target DNA sequence.
EMSAs of PtAu1afull under dark (a) and light (b) conditions in the presence of 50 nM dsCYC2 promoter DNA. Quantification of the gels in Figure 3—figure Supplement 1. EMSAs, electrophoretic mobility shift assays.
Figure 3—figure supplement 1
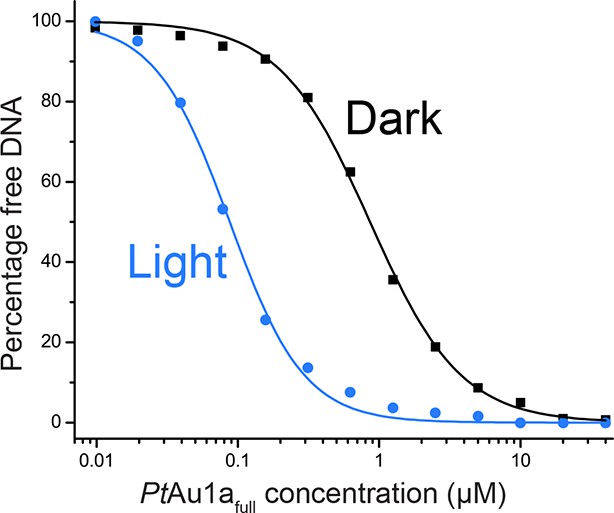
DNA binding curves of PtAu1afull under dark and light conditions.
DNA binding curves of PtAu1afull under dark (black) and light (blue) conditions obtained by quantification of the amount of free DNA in the EMSAs shown in Figure 3 revealed EC50 values of 860 nM (Hill coefficient of 1.35) in the dark and 90 nM (Hill coefficient of 1.65) in the light, indicating a 9.6-fold higher affinity of PtAu1afull to DNA in its light compared with its dark state. EMSAs, electrophoretic mobility shift assays.
Figure 3—figure supplement 2
PtAu1afull binds DNA in a sequence-specific manner.
EMSAs of PtAu1afull under dark (a) and light (b) conditions in the presence of a 24-bp DNA probe (c = 50 nM) lacking the bZIP target sequence. Under dark conditions, no binding of PtAu1afull to the DNA probe can be detected. Upon light activation, weak binding of PtAu1afull to the DNA probe can be detected at protein concentrations above 5–10 µM. The significantly decreased affinity of PtAu1afull to the DNA probe lacking the TGACGT binding motif reported for bZIP transcription factors confirms sequence-specific DNA binding of PtAu1afull (cf. Figure 3). bZIP, basic region leucine zipper; EMSAs, electrophoretic mobility shift assays.
Figure 3—figure supplement 3
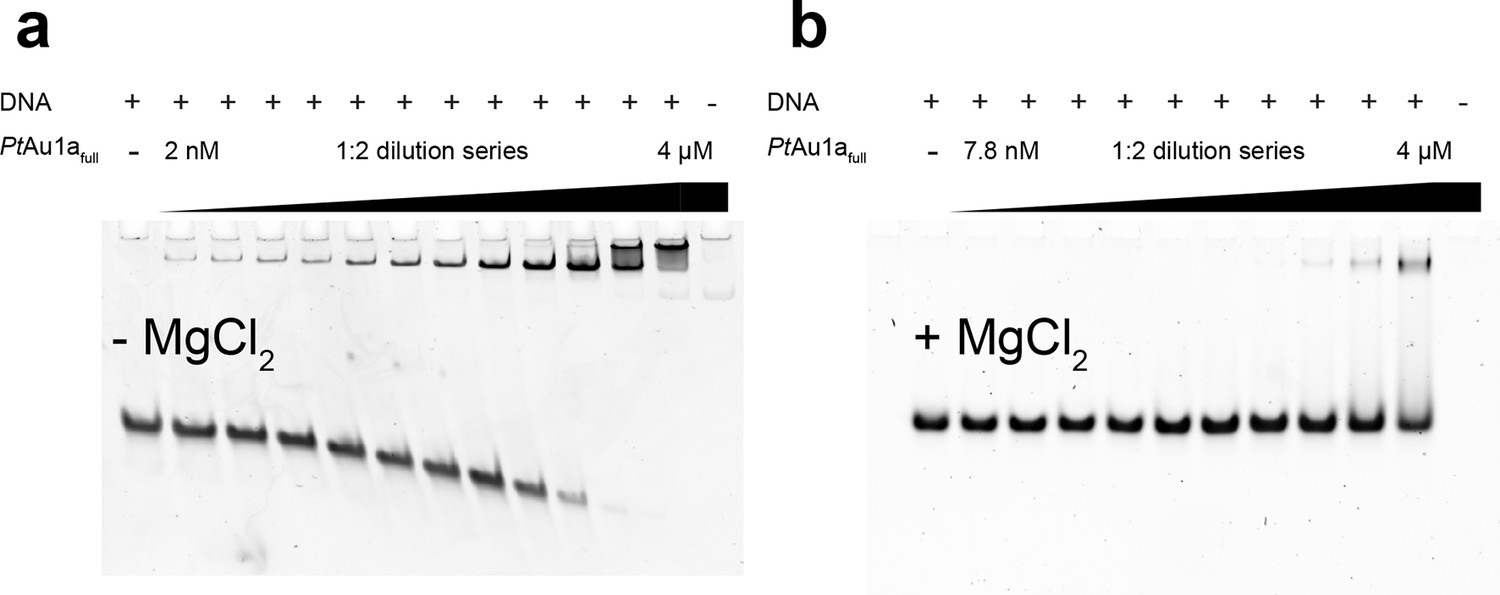
MgCl2 is essential for sequence-specific DNA binding of PtAu1afull.
EMSAs of PtAu1afull in the dark in the absence and presence of 10 mM MgCl2 in the polyacrylamide gels as well as in the reaction and running buffers. The 35-bp DNA probe used in the EMSAs was the one used for DNA binding studies of VfAu1 in the publication by Takahashi et. al. (Takahashi et al., 2007) (5'-GGAGTATCCAGCTCCGTAGCTGACGTG GCCTCTGG-3', the bZIP target sequence is underlined). The DNA probe (388 nM) was incubated in buffer D without MgCl2 (a) and with MgCl2 (b) with varying amounts of purified PtAu1afull (2, 4, 7.9, 15.9, 31.8, 63.5, 125, 250, 500, 1000, 2000, 4000 nM). EMSA runs were performed as described in the methods section. In the EMSA in the absence of MgCl2, the formation of a PtAu1afull-DNA complex is already observed at the lowest protein concentration of 2 nM. At protein concentrations above 250 nM, a second PtAu1afull-DNA band appears, which was also observed in gel shift experiments performed by Takahashi et. al. (Takahashi et al., 2007) and in DNA binding studies of the CREB bZIP domain (Moll et al., 2002). This slower migrating band most likely represents two PtAu1afull dimers bound to the 35-bp DNA probe, indicating the ability of unspecific DNA binding of PtAu1afull at high protein concentrations. In the EMSAs performed in the presence of MgCl2, the formation of a stable PtAu1afull-DNA complex is observed at much higher protein concentrations compared with the experiments without MgCl2. Additionally, the slower migrating PtAu1afull-DNA band disappeared, indicating sequence-specific DNA binding of a single PtAu1afull dimer to the target DNA sequence. Therefore, it can be concluded that the presence of MgCl2 is required for sequence-specific DNA binding of PtAu1afull. bZIP, basic region leucine zipper; EMSAs, electrophoretic mobility shift assays.
Figure 4 with 4 supplements

Structural characterization of PtAu1aLOV in its dark and light state.
(a) Crystal structure of the PtAu1aLOV dark state monomer with the N- and C-terminal A'α and Jα helices flanking the LOV core colored in light gray and dark gray, respectively. (b) Blue light illumination induces formation of a parallel PtAu1aLOV dimer. (c) In the dark, A'α covers the hydrophobic dimerization site on the LOV β-sheet. (d) Illumination results in a release of A'α from the LOV β-sheet and exposes the dimerization site. The PtAu1aLOV molecules in (c and d) are colored according to the Eisenberg hydrophobicity scale (Eisenberg, et al., 1984). Reddish regions correspond to high and white regions to low hydrophobicity. (e) The PtAu1aLOV light state dimer colored according to differences in deuterium incorporation in the dark and light state after 10 s of labeling. Shades of red and blue correspond to regions with increased and decreased deuterium uptake in the light, respectively. A peptide map that shows the differences in relative deuteration of dark and light experiments for all time points is shown in (Figure 4—figure supplement 3). All evaluated peptides for PtAu1aLOV and their individual deuteration plots are shown in (Figure 4—figure supplement 4). (f) PtAu1aLOV dark state monomer colored according to deuterium incorporation in the dark after 10 s labeling. Elements in (e) and (f) colored in dark gray represent regions that are not covered by peptides generated by pepsin digestion. Since rapid back-exchange of the two N-terminal residues prevents precise measurement of deuterium incorporation, these residues of all peptides are shown in dark gray, if not covered by an overlapping peptide. LOV, light-oxygen-voltage.
Figure 4—figure supplement 1
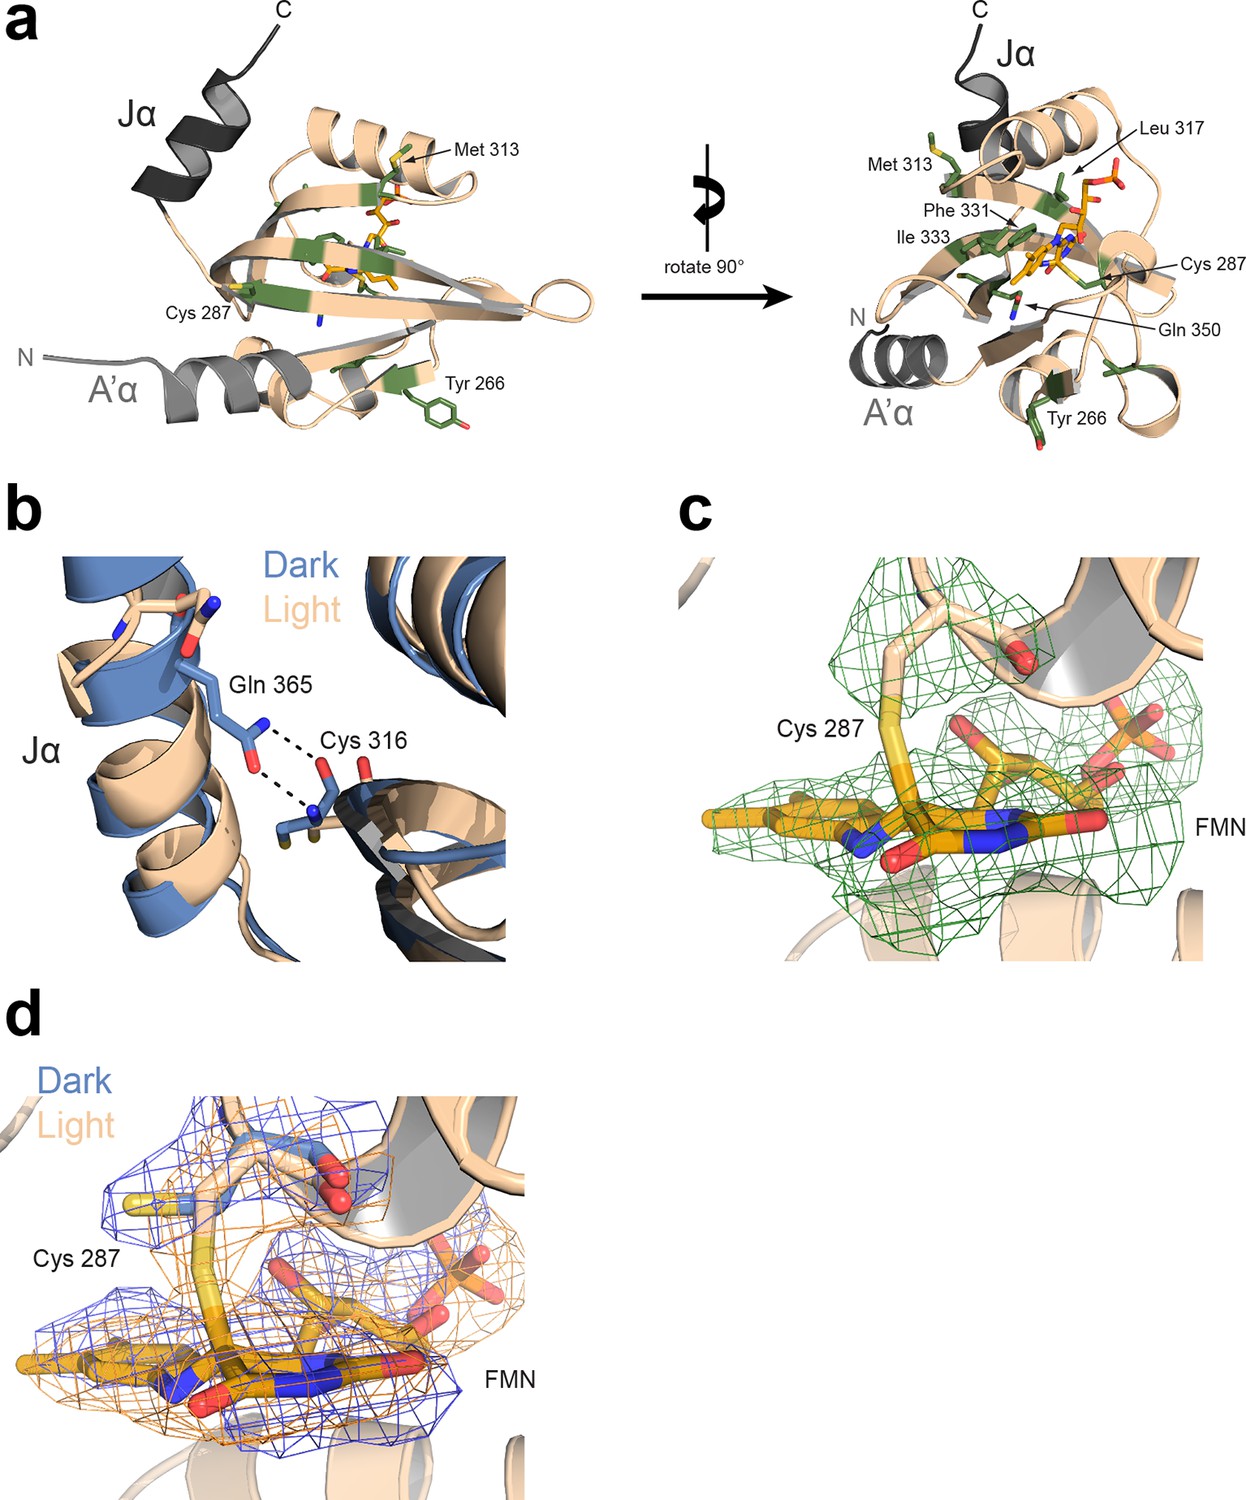
Light-induced structural changes of PtAu1aLOV (protomer A).
(a) Rotamer changes of Tyr266, Cys287, Met313, Leu317, Phe331, Ile333, Gln350 and Cys351 are observed in protomer A and B upon light activation. Additional rotamer changes detected in either protomer A or B are not shown, but might be also functional relevant. (b) In the dark (blue), Gln365 located on Jα forms hydrogen bonds with the carbonyl and amine group of Cys316, which are broken upon illumination (wheat) and results in undocking of Jα from the LOV β-sheet. (c) Fo-Fc omit map (green mesh) of the photoreactive Cys287 and the FMN cofactor upon light activation contoured at 2.5 σ and superimposed on the final model. The covalent Cys287-FMN adduct is significantly reduced due to radiation damage, as also observed for other LOV proteins (Fedorov et al., 2003; Zoltowski et al., 2007). (d) Overlay of 2Fo-Fc map in the dark (blue sticks and mesh) and light (wheat sticks and orange mesh). Both maps are contoured at 1.5 σ. FMN, flavin mononucleotide; LOV, light-oxygen-voltage.
Figure 4—figure supplement 2
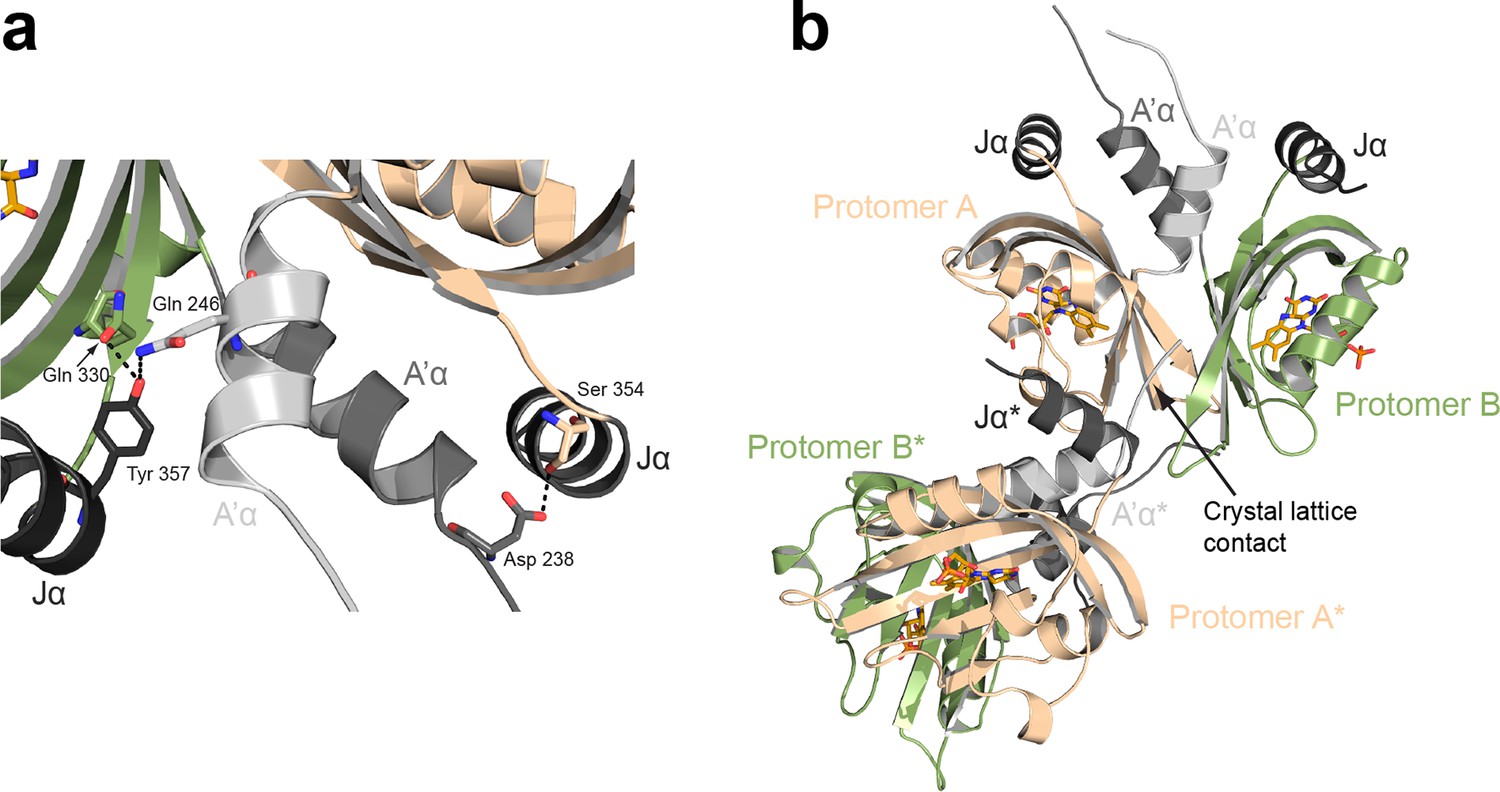
Interdomain interactions and crystal lattice contacts.
(a) Interactions between the Jα and A'α helices observed in the PtAu1aLOV light state dimer. The two protomers are related by two-fold non-crystallographic symmetry that does not apply to the A´α helices. (b) Crystal lattice contacts observed for the PtAu1aLOV light-state dimer. The N-terminus of protomer A of a symmetry related molecule (indicated by a *) interacts with elements of the light-state dimer interface, which slightly affects the relative positioning of the two protomers. LOV, light-oxygen-voltage.
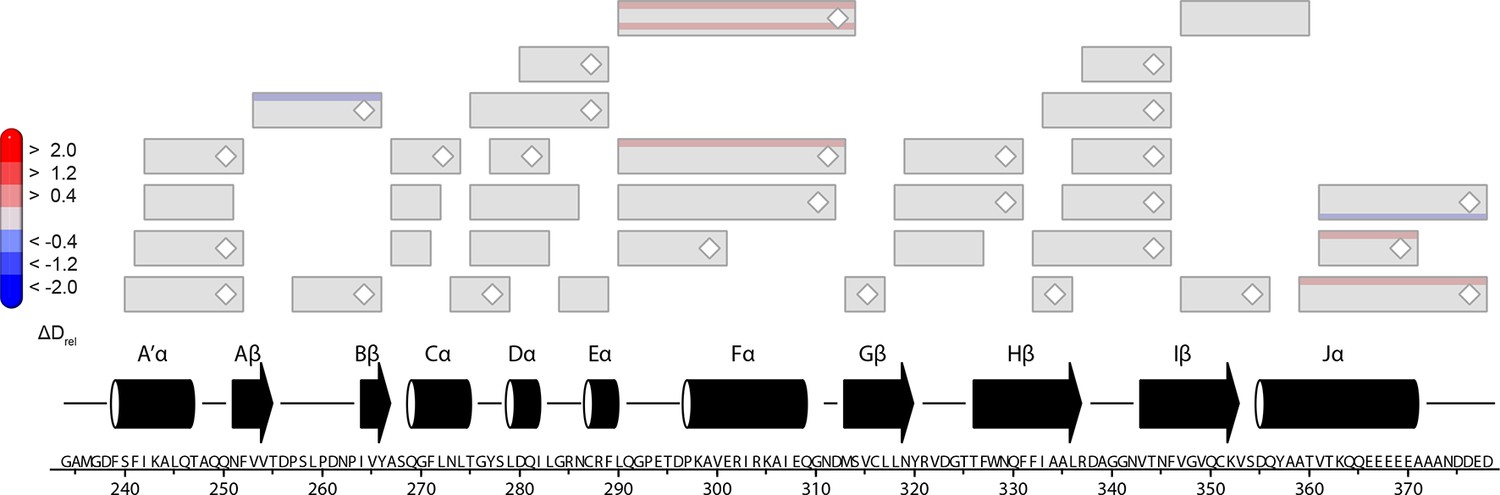
Figure 4—figure supplement 3
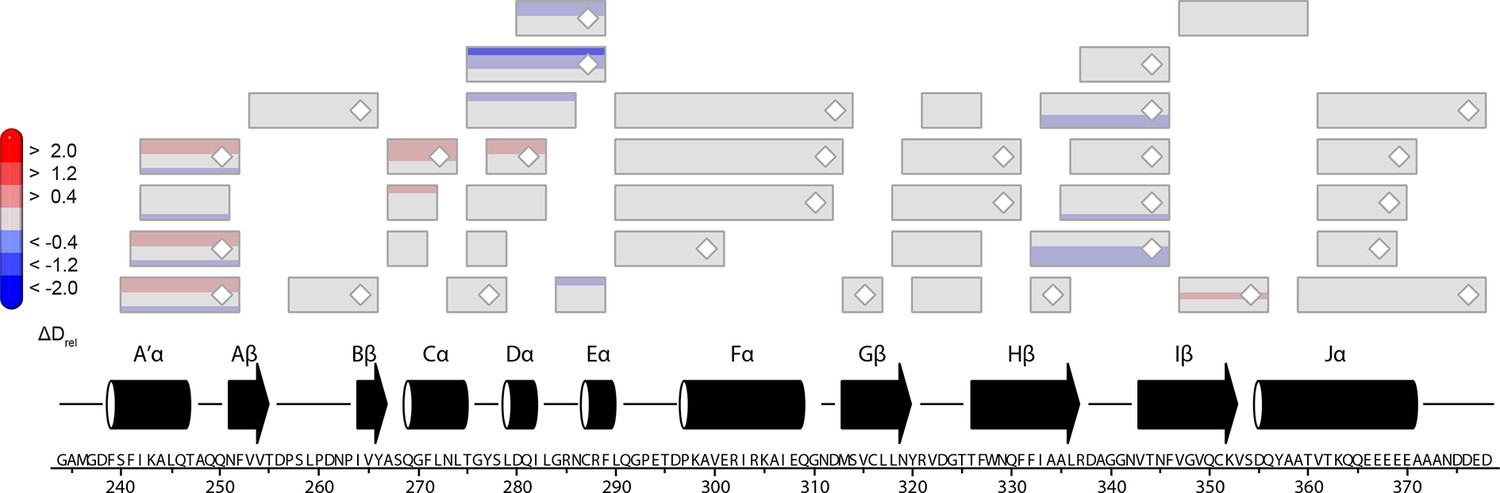
Effect of illumination on PtAu1aLOV.
Each box reflects one peptide and contains five different colors that correspond to the differences in relative deuteration (ΔDrel) of dark and light (ΔDrel of PtAu1aLOV,light -PtAu1aLOV,dark) experiments according to the legend on the left for the incubation times of 10, 45, 180, 900 and 3600 s (bottom up). MS/MS confirmed peptides are marked with diamonds. Secondary structure elements are taken from DSSP (Kabsch and Sander, 1983) analysis of the PtAu1aLOV dark state crystal structure. DSSP, define secondary structure of proteins; LOV, light-oxygen-voltage; MS/MS, tandem mass spectrometry.
Figure 4—figure supplement 4
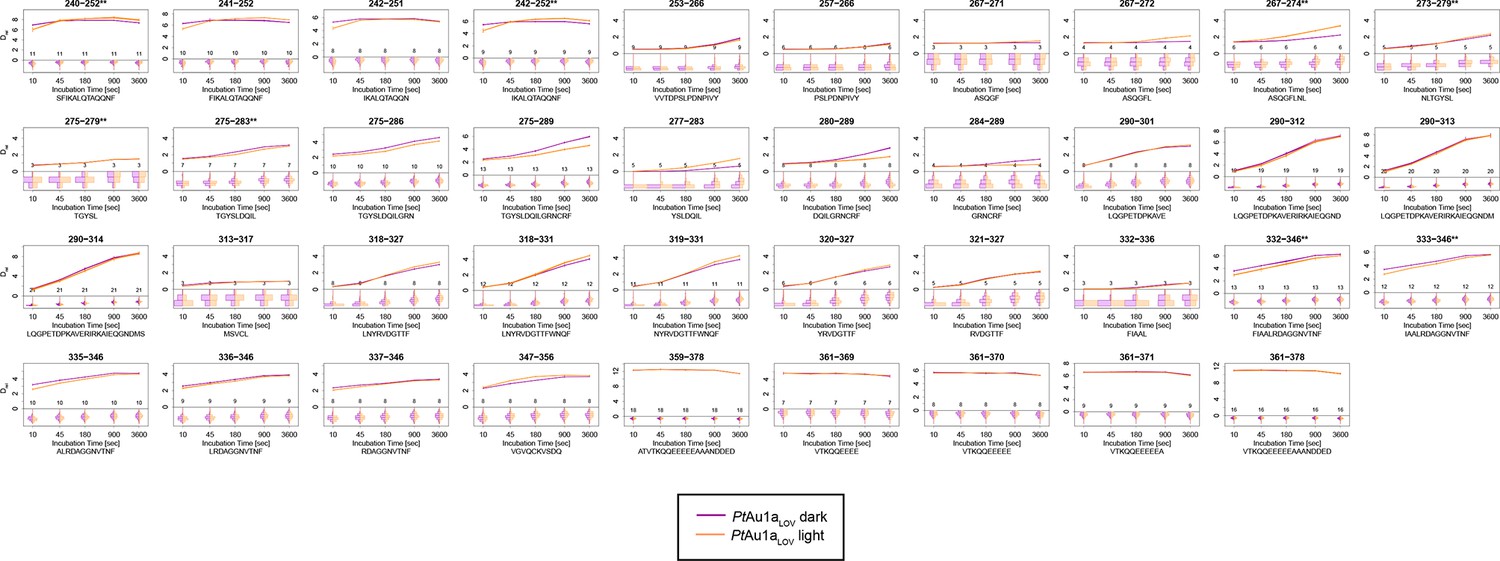
Overview of all 39 PtAu1aLOV peptides evaluated during HDX-MS analysis.
Please zoom in on the region of interest for full details. Individual plots show the time-dependent increase in deuterium incorporation. Drel values represent the mean of three independent measurements and error bars correspond to the standard deviation. A software-estimated abundance distribution of deuterated species is presented in the lower sub-panel on a scale from undeuterated to all exchangeable amides deuterated.
Figure 5 with 7 supplements
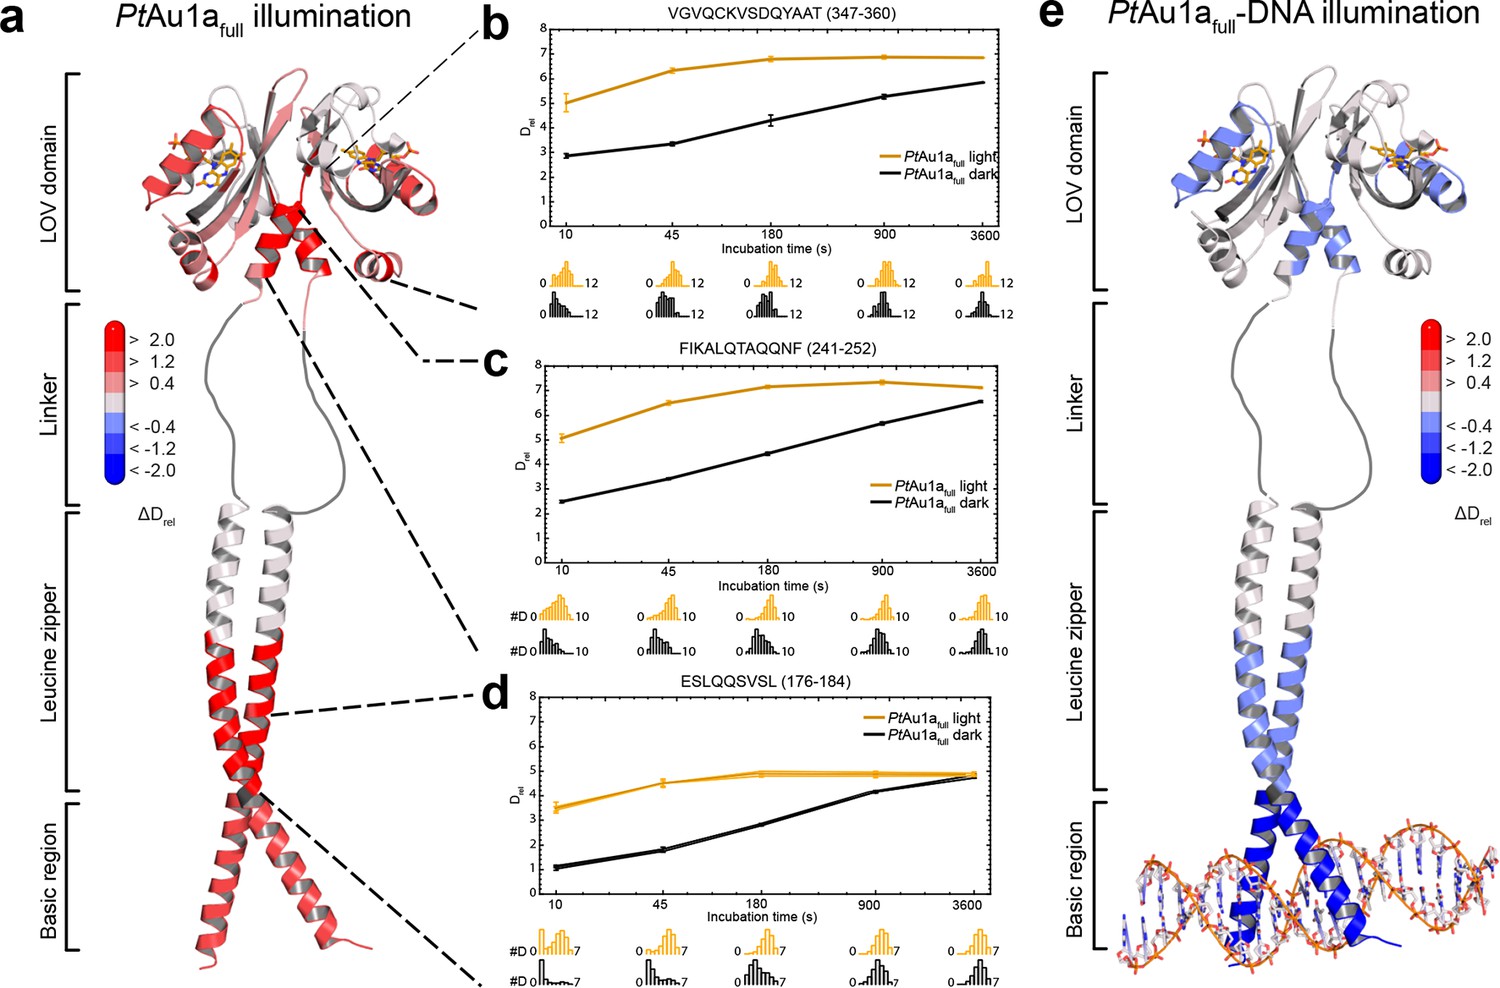
HDX-MS data of PtAu1afull in the absence and presence of DNA.
(a) Changes in deuterium incorporation of PtAu1afull mapped onto the structure of the PtAu1aLOV light state dimer and a model of the bZIP domain. (b–d) Deuterium uptake plots of Jα-Iβ, A'α and leucine zipper peptides with Drel plotted against the labeling time for three independent experiments. The estimated abundance distribution of individual deuterated species is shown at the bottom. (e) Differences in deuterium incorporation of PtAu1afull in the dark and light state in the presence of DNA mapped onto the PtAu1aLOV light state dimer and a model of the bZIP domain. All evaluated peptides for PtAu1afull in the absence and presence of DNA and their individual deuteration plots are shown in Figure 5—figure supplement 6 and Figure 5—figure supplement 7, respectively. HDX-MS, hydrogen/deuterium-exchange coupled to mass spectrometry; LOV, light-oxygen-voltage.
Figure 5—figure supplement 1

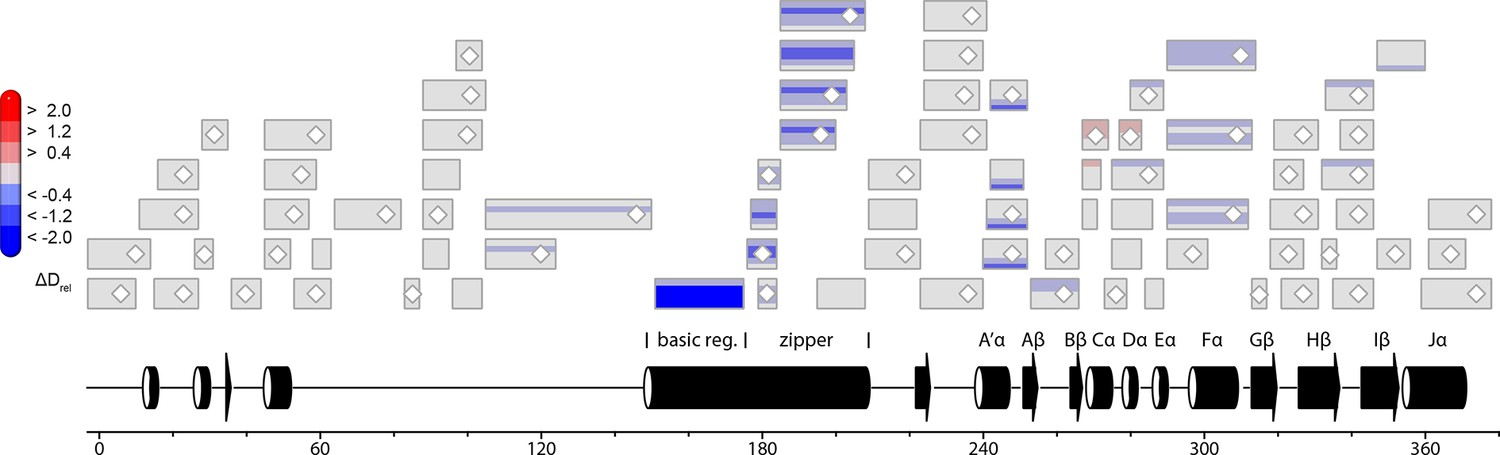
Effect of illumination on PtAu1afull in the absence of DNA.
Each box reflects one peptide and contains five different colors that correspond to the differences in relative deuteration (ΔDrel) between light and dark (ΔDrel of PtAu1afull,light - PtAu1afull,dark) experiments according to the legend on the left for the incubation times of 10, 45, 180, 900 and 3600 s (bottom up). MS/MS confirmed peptides are marked with diamonds. Secondary structure elements are taken from DSSP (Kabsch and Sander, 1983) analysis of the PtAu1aLOV dark state crystal structure and PSIPRED (Psi-blast based) secondary structure prediction (Jones, 1999). DSSP, define secondary structure of proteins; MS/MS, tandem mass spectrometry.
Figure 5—figure supplement 2
Comparison of HDX characteristics of LOV domain peptides of PtAu1afull and PtAu1aLOV in the light.
Each box reflects one peptide and contains five different colors that correspond to the differences in relative deuteration (ΔDrel) of light (ΔDrel of PtAu1afull,light - PtAu1aLOV,light) experiments according to the legend on the left for the incubation times of 10, 45, 180, 900 and 3600 s (bottom up). The deuterium exchange rates of LOV domain peptides of PtAu1aLOV and PtAu1afull in the light are nearly identical, confirming that the pronounced differences in deuterium exchange rates of LOV domain peptides of PtAu1afull in the dark and light (Figure 5—figure supplement 1) originate from an interaction of the LOV and bZIP domains in the dark. HDX, hydrogen/deuterium-exchange; LOV, light-oxygen-voltage.
Figure 5—figure supplement 3
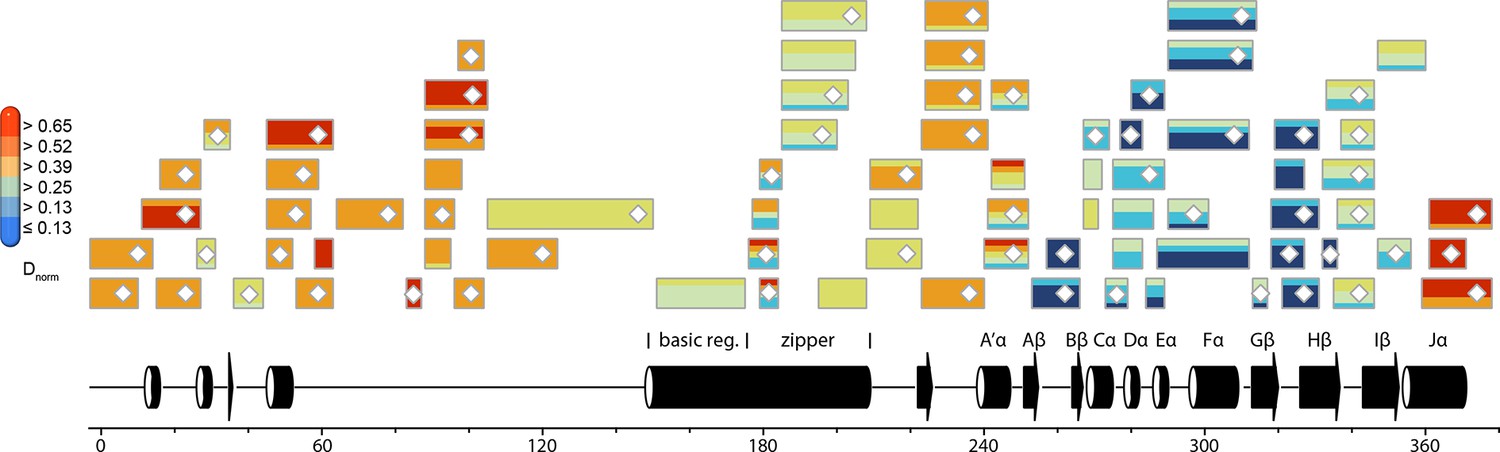
Normalized relative deuterium incorporation (Dnorm) of PtAu1afull in the dark.
Each box reflects one peptide and contains five different colors that indicate deuterium incorporation after 10, 45, 180, 900 and 3600 s from HDX-MS measurements performed in the dark, normalized to the number of exchangeable amides in each peptide. Data were not corrected for back-exchange. The back-exchange rates for individual peptides under the chosen experimental conditions are in the range of ~30-–35%. Blue colors indicate low deuterium incorporation and reflect stable secondary structure elements, while red colors indicate high deuterium incorporation and flexible elements. Most of the peptides within the N-terminal domain and the bZIP–LOV linker region reach their highest deuteration level already after 10 s of labeling, indicating a significant fraction of highly dynamic or unstructured elements within these regions. MS/MS confirmed peptides are marked with diamonds. Secondary structure elements are taken from DSSP (Kabsch and Sander,, 1983) analysis of the PtAu1aLOV dark state crystal structure and PSIPRED secondary structure prediction (Jones, 1999). DSSP, define secondary structure of proteins; HDX-MS, hydrogen/deuterium-exchange coupled to mass spectrometry; MS/MS, tandem mass spectrometry.
Figure 5—figure supplement 4
Effect of illumination on PtAu1afull in the presence of DNA.
Each box reflects one peptide and contains five different colors that correspond to the differences in relative deuteration (ΔDrel) between light and dark (ΔDrel of PtAu1afull,light-DNA - PtAu1afull,dark-DNA) experiments according to the legend on the left for the incubation times of 10, 45, 180, 900 and 3600 s (bottom up).
Figure 5—figure supplement 5

Effect of DNA on LOV domain peptides of PtAu1afull in the dark.
Each box reflects one peptide and contains five different colors that correspond to the differences in relative deuteration (ΔDrel) between dark (ΔDrel of PtAu1afull,dark-DNA - PtAu1afull,dark) experiments according to the legend on the left for the incubation times of 10, 45, 180, 900 and 3600 s (bottom up). DNA binding of PtAu1afull in the dark induces similar effects within the LOV domain as illumination (cf. Figure 5—figure supplement 1), which suggests DNA-induced bZIP–LOV dissociation. The subtle differences in deuterium incorporation of Jα peptides observed after 3600 s in both comparisons most likely originate from slight differences in the experimental conditions of the HDX-MS measurements and have no functional implications. MS/MS confirmed peptides are marked with diamonds. Secondary structure elements are taken from DSSP (Kabsch and Sander, 1983) analysis of the PtAu1aLOV dark state crystal structure. DSSP, define secondary structure of proteins; HDX-MS, hydrogen/deuterium-exchange coupled to mass spectrometry; MS/MS, tandem mass spectrometry.
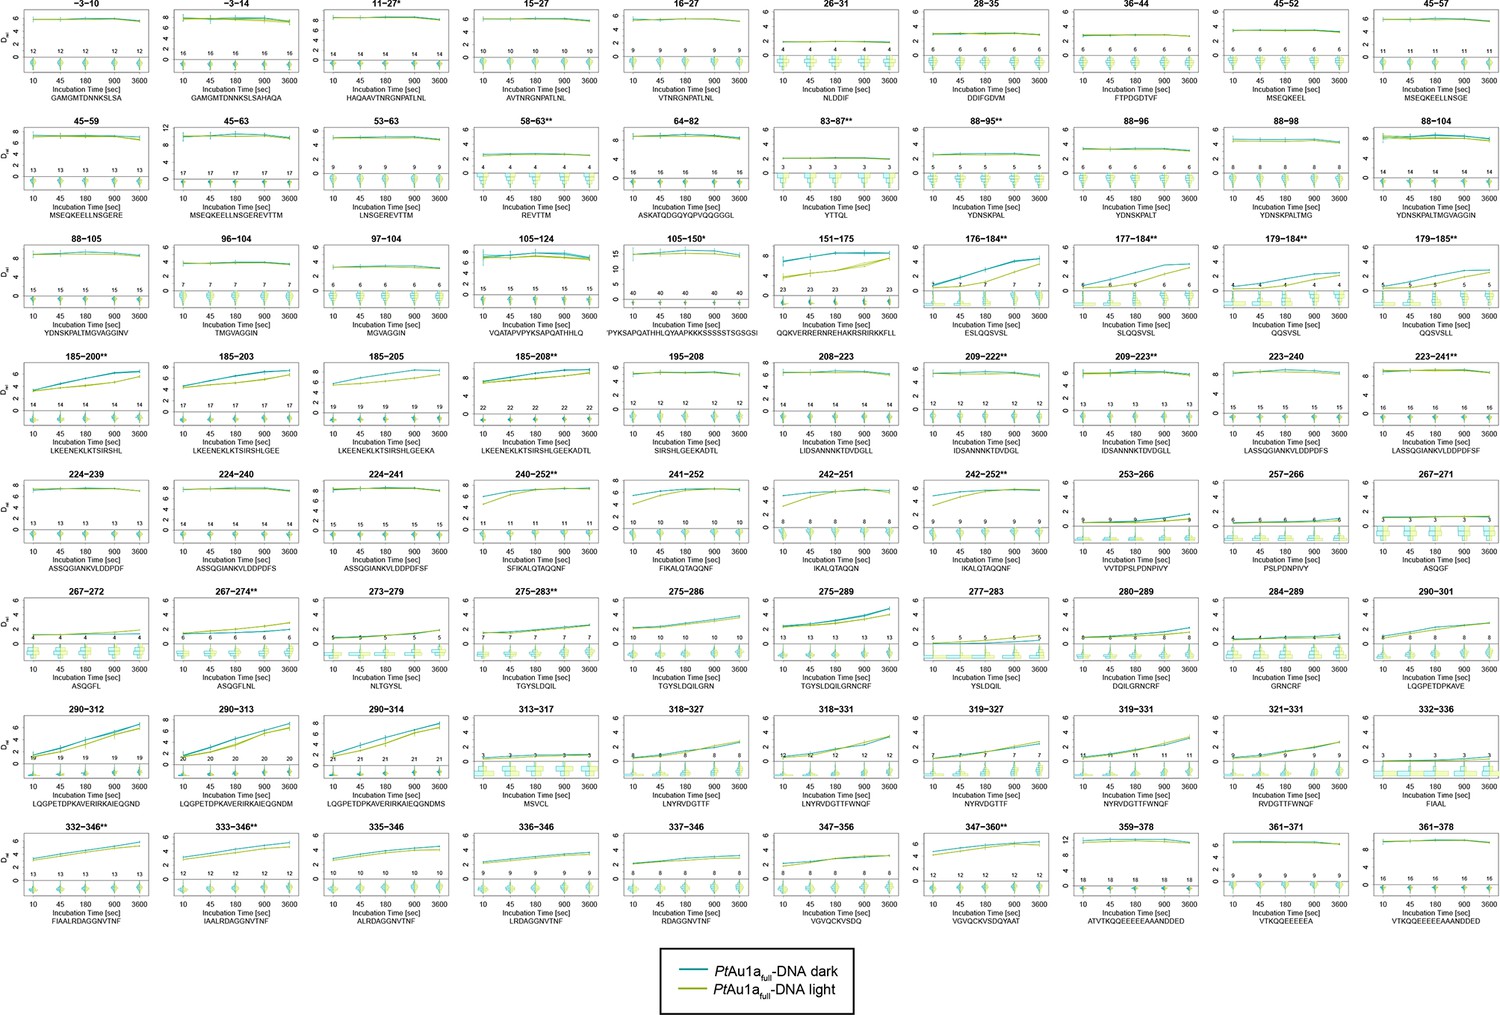
Figure 5—figure supplement 6

Overview of all 80 PtAu1afull peptides evaluated during HDX-MS analysis.
Please zoom in on the region of interest for full details. Individual plots show the time-dependent increase in deuterium incorporation. Drel values represent the mean of three independent measurements and error bars correspond to the standard deviation. A software-estimated abundance distribution of deuterated species is presented in the lower sub-panel on a scale from undeuterated to all exchangeable amides deuterated.
Figure 5—figure supplement 7
Overview of all 80 peptides evaluated during HDX-MS analysis of PtAu1afull in the presence of DNA.
Please zoom in on the region of interest for full details. Individual plots show the time-dependent increase in deuterium incorporation. Drel values represent the mean of three independent measurements and error bars correspond to the standard deviation. A software-estimated abundance distribution of deuterated species is presented in the lower sub-panel on a scale from undeuterated to all exchangeable amides deuterated.
Figure 6
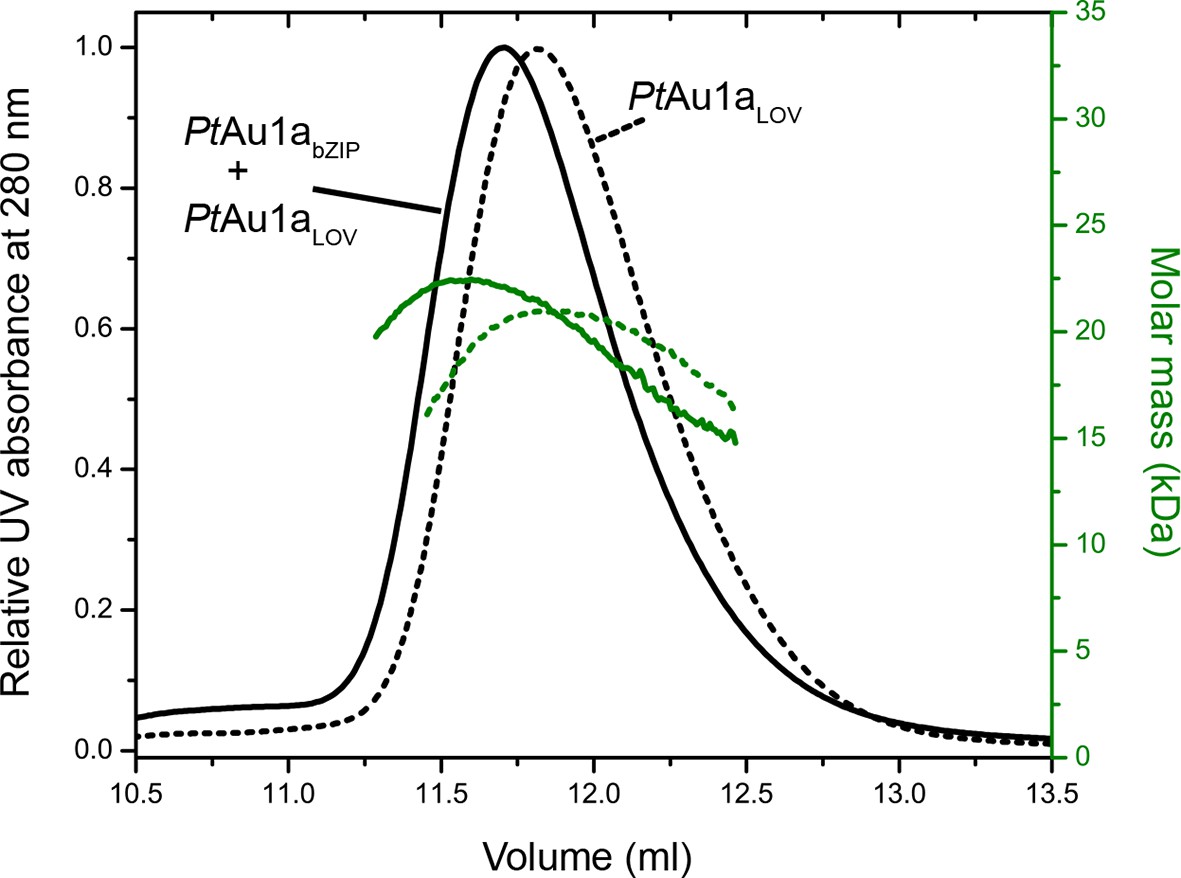
Normalized MALS detection of PtAu1aLOV (solid line) alone and PtAu1aLOV together with PtAu1abZIP (dashed line) fractionated by size-exclusion chromatography in the dark.
The MALS-derived molar-mass signals are shown in green. PtAu1aLOV and PtAu1abZIP interact in the dark, which is reflected by a slight decrease of the elution volume of PtAu1aLOV and an increase of the calculated molar mass signal. LOV, light-oxygen-voltage.
Figure 7 with 1 supplement
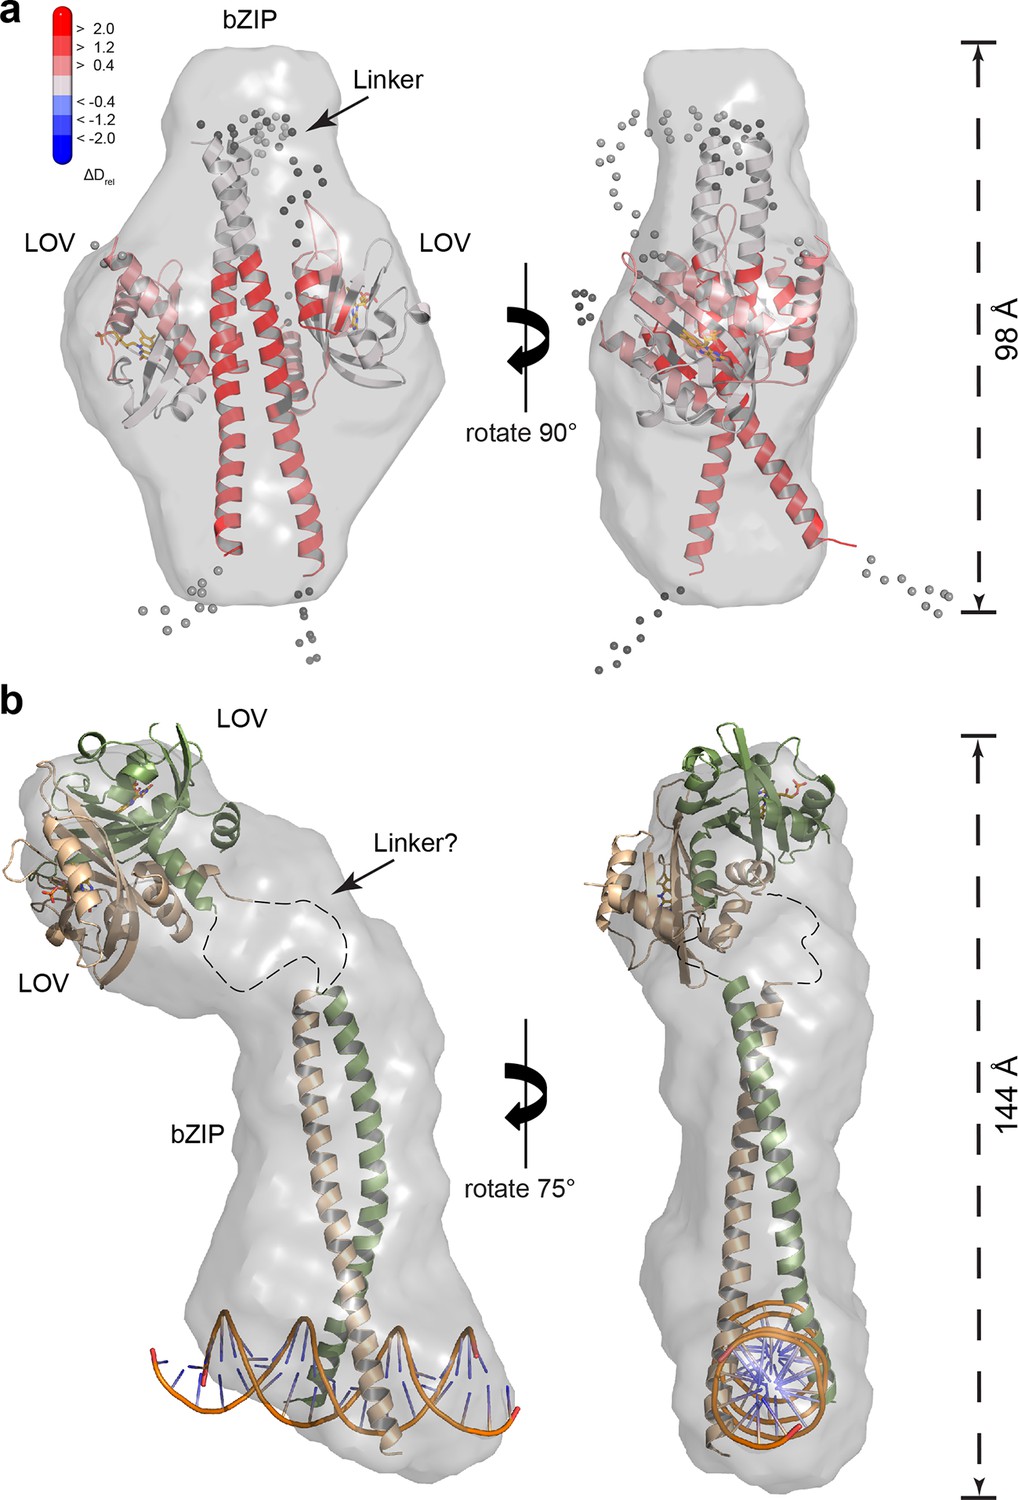
SAXS-derived shape reconstructions of PtAu1abZIP-LOV.
(a) DAMMIN low-resolution envelope calculated for PtAu1abZIP-LOV in the dark superimposed with an atomic PtAu1abZIP-LOV dark state model calculated by CORAL. Modelled loops are indicated as dots. The model is colored according to the HDX-MS data obtained for PtAu1afull in the absence of DNA and shows differences in deuterium incorporation in the dark and light state after 10 s of labeling. The results obtained from SAXS-based rigid body modeling, ab initio modeling and HDX-MS data agree perfectly and support an interaction between the LOV domain and the leucine zipper of the bZIP domain. (b) Shape reconstruction of the PtAu1abZIP-LOV-DNA complex calculated using DAMMIN. The PtAu1aLOV light state dimer and a model of the DNA bound bZIP domain was placed in the envelope by visual inspection. HDX-MS, hydrogen/deuterium-exchange coupled to mass spectrometry; LOV, light-oxygen-voltage; SAXS, small-angle X-ray scattering.
-
Figure 7—source data 1
Rg values calculated for PtAu1afull from SAXS data
- https://doi.org/10.7554/eLife.11860.026
-
Figure 7—source data 2
Structural parameters calculated for PtAu1abZIP-LOV from SAXS data
- https://doi.org/10.7554/eLife.11860.027
Figure 7—figure supplement 1
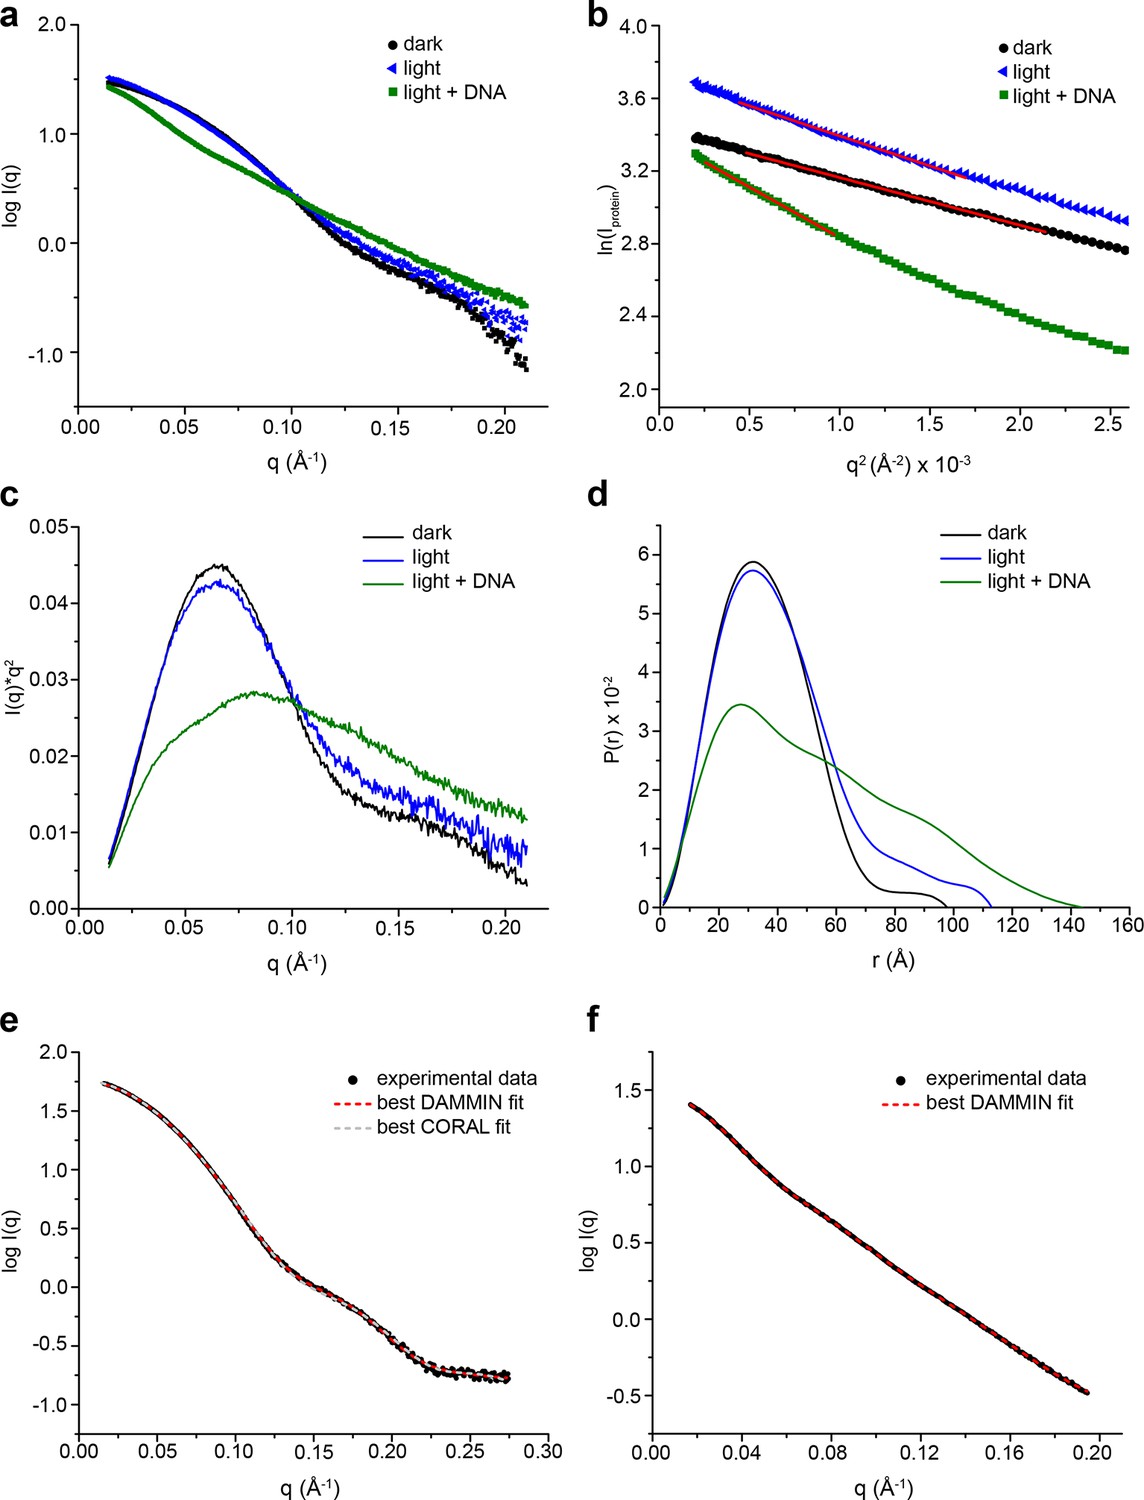
SAXS data for PtAu1abZIP-LOV.
(a) Scattering curves of dark-adapted PtAu1abZIP-LOV (c = 5 mg/ml, black dots) and PtAu1abZIP-LOV in the absence (c = 5 mg/ml, blue triangles) and presence of DNA (c = 6.2 mg/ml, green squares) pre-illuminated with blue light. (b) Guinier and (c) Kratky plots of the SAXS data obtained for the different PtAu1abZIP-LOV states. The red lines in the Guinier plot indicate regions of the fit. All linear fits fulfil the criteria of qmax•· Rg ≤ 1.3. (d) Plots of the pair distance distribution functions (p(r)) calculated using GNOM (Svergun, 1992). Blue light illumination alone and in combination with the presence of DNA results in PtAu1abZIP-LOV elongation. (e) Merged SAXS data of PtAu1abZIP-LOV used for ab initio and rigid body reconstructions of the PtAu1abZIP-LOV dark state conformation. For the low q region, data from the measurements performed at a protein concentration of 5 mg/ml was merged at q = 0.13 A-1 with the high q region of data collected at 9 mg/ml. The fits for the best DAMMIN (Svergun, 1999) and CORAL (Petoukhov et al., 2012) models are shown as red and gray dashed lines, respectively. (f) Merged SAXS data of PtAu1abZIP-LOV in the presence of DNA used for DAMMIN (Svergun, 1999) ab initio reconstructions. The fit for the best model is shown as red dashed line. LOV, light-oxygen-voltage; SAXS, small-angle X-ray scattering.
Figure 8
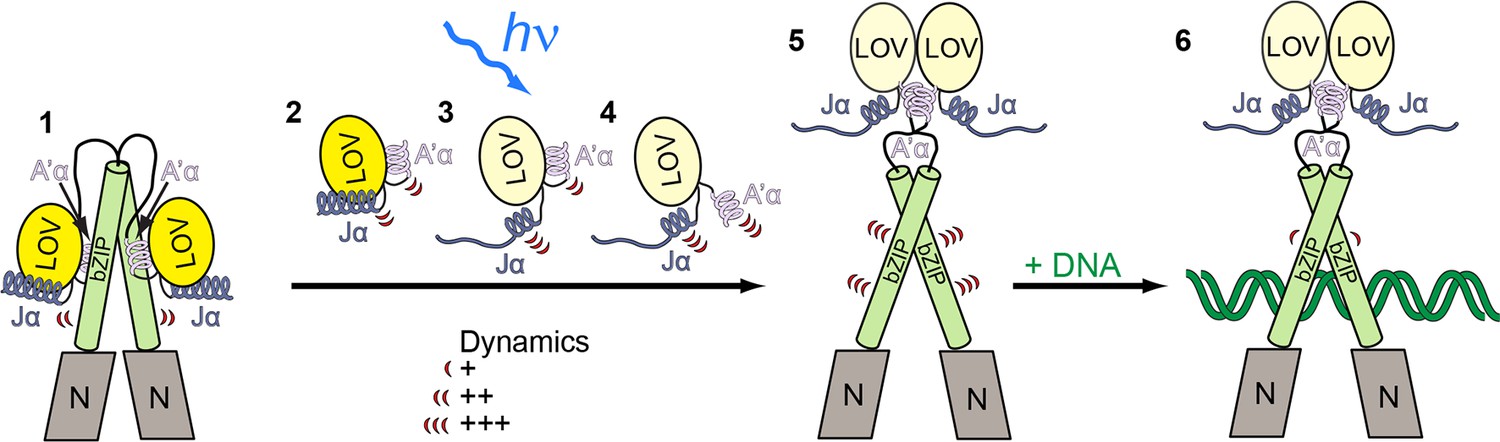
Model for light-regulated gene expression by PtAu1a.
(1) In the dark, PtAu1a is dimeric and the LOV and bZIP domains interact directly thus inhibiting DNA binding of PtAu1a. 2-4: close up of the LOV domain. (2) A'α and Jα are attached to the surface of the LOV β-sheet and are highly dynamic even in the dark. (3) Illumination with blue light causes Cys287–FMN adduct formation and results in undocking of Jα from the LOV core and increases its structural dynamics. (4) Structural changes within the LOV core together with the destabilization of Jα trigger the release of A'α from the dimerization site and also increase its flexibility. (5) The LOV domain dissociates from the leucine zipper of the bZIP domain and dimerizes, which results in an increased structural dynamics of the bZIP domain and (6) increases the affinity of PtAu1a for its target DNA sequence. The model depicted includes results from FT-IR experiments on PtAu1a-LOV that revealed Jα-dependent A'α release from the LOV core (Herman and Kottke, 2015). FT-IR, Fourier transform infrared; FMN, flavin mononucleotide; LOV, light-oxygen-voltage.
Tables
Table 1
Data collection and refinement statistics.
| PtAu1aLOV dark | PtAu1aLOV light | |
|---|---|---|
| Data collection | ||
| Space group | P212121 | P3221 |
| Cell dimensions | ||
| a, b, c (Å) | 64.4, 69.2, 74.6 | 108.6 108.6 104.7 |
| α, β, γ (°) | 90.0, 90.0, 90.0 | 90.0 90.0 120.0 |
| Resolution (Å) | 50–2.5 (2.5–2.6) * | 50–2.7 (2.7–3.2) |
| Rmeas | 13.2 (55.1) | 10.0 (63.7) |
| I / σI | 15.57 (4.50) | 13.01 (2.46) |
| Completeness (%) | 99.9 (100) | 98.9 (98.1) |
| Redundancy | 13.1 (13.5) | 5.0 (5.0) |
| Refinement | ||
| Resolution (Å) | 48.7-2.5 | 45.7-2.7 |
| No. reflections | 12,016 | 19,785 |
| Rwork / Rfree | 0.196/0.254 | 0.209/0.243 |
| No. atoms | 2237 | 2164 |
| Protein | 2108 | 2100 |
| Ligand/ion | 74 | 62 |
| Water | 55 | 2 |
| B factors | 33.3 | 74.7 |
| Protein | 33.4 | 74.9 |
| Ligand/ion | 32.6 | 69.1 |
| Water | 32.2 | 72.3 |
| r.m.s. deviations | ||
| Bond lengths (Å) | 0.007 | 0.009 |
| Bond angles (°) | 1.109 | 1.090 |
-
*Values in parentheses are for highest-resolution shell. One crystal was used for data measurements of PtAu1aLOV in its dark and light-adapted state, respectively.
Download links
A two-part list of links to download the article, or parts of the article, in various formats.
Downloads (link to download the article as PDF)
Open citations (links to open the citations from this article in various online reference manager services)
Cite this article (links to download the citations from this article in formats compatible with various reference manager tools)
Blue light-induced LOV domain dimerization enhances the affinity of Aureochrome 1a for its target DNA sequence
eLife 5:e11860.
https://doi.org/10.7554/eLife.11860


