Capturing the temporal evolution of choice across prefrontal cortex
- University College London, United Kingdom
- Oxford University, John Radcliffe Hospital, United Kingdom
- University of California, Berkeley, United States
- Tohoku University, Japan
Figures
Figure 1 with 3 supplements
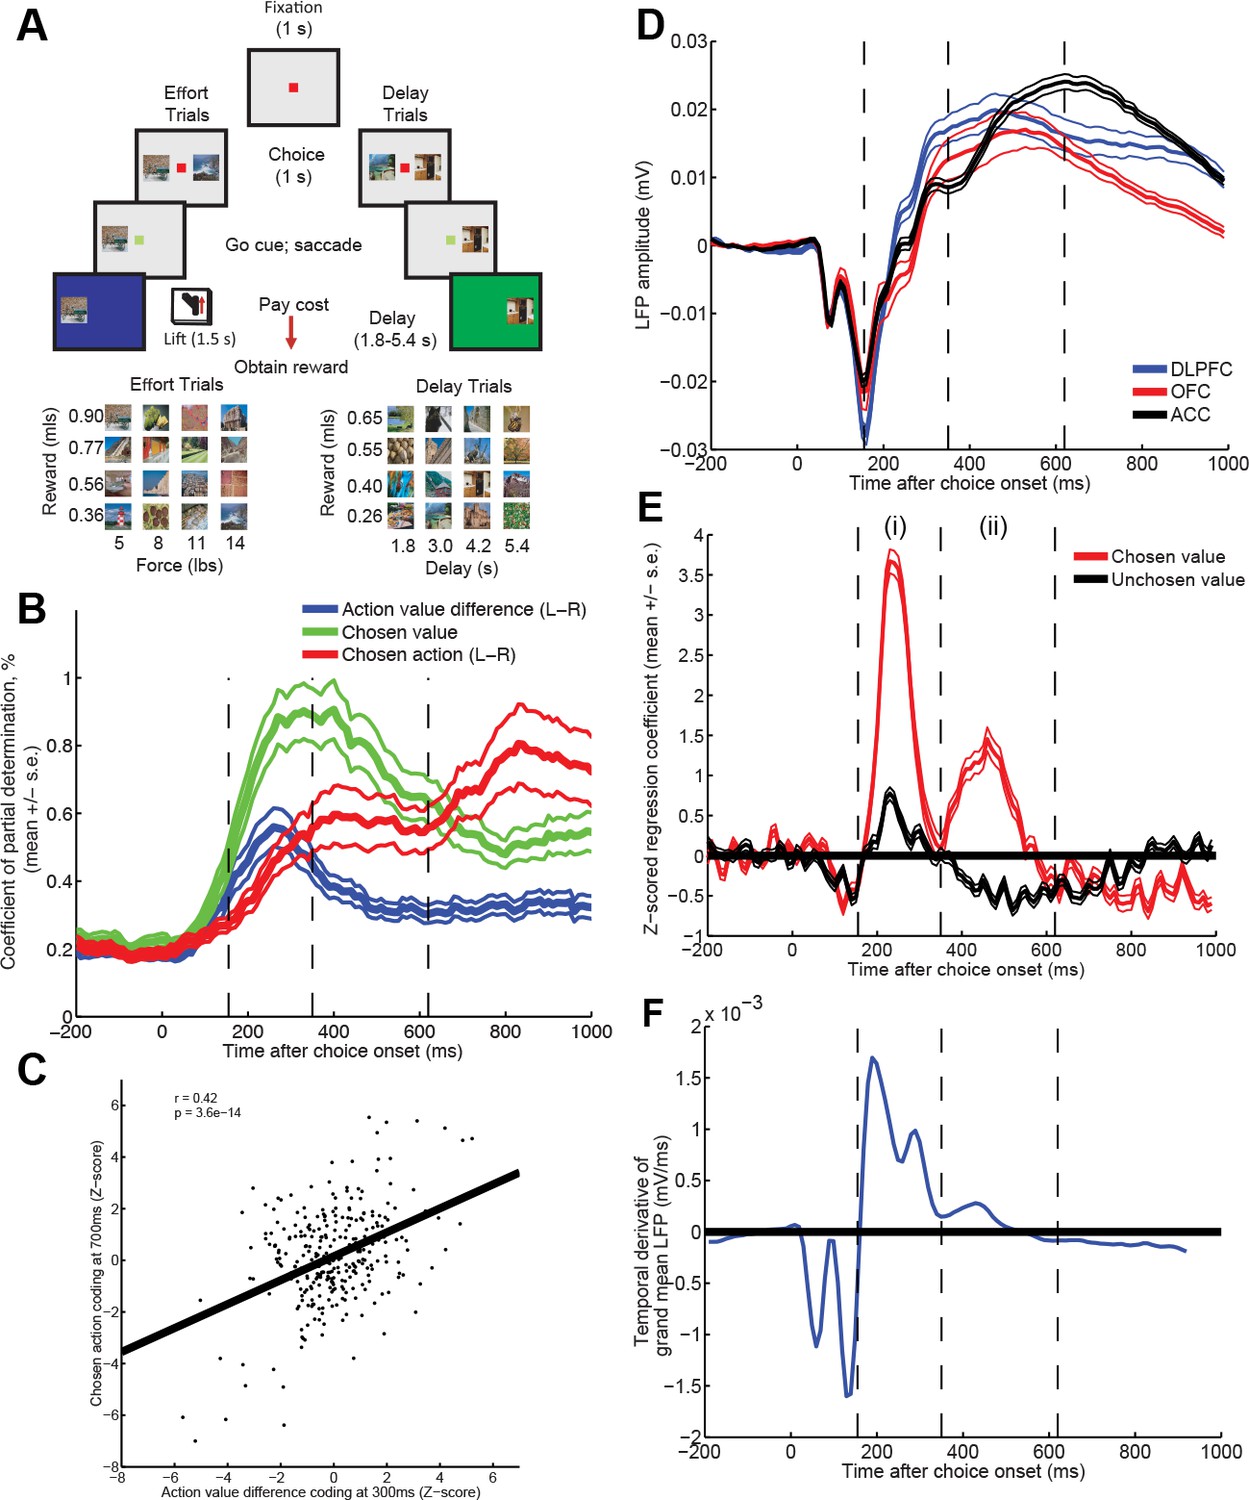
Time-varying value correlates in single units and LFP during choice.
(A) Subjects chose between two pictures of differing value (reward and cost (physical effort, or delay)) by saccade. Neural activity was examined during the 1s choice epoch, whilst monkeys held fixation. (B) Correlates of decision variables in DLPFC single units (n=303). Coefficient of partial determination for multiple regression of left minus right action value (blue), chosen value (green) and left minus right choice (red) onto single neuron activity. Lines show mean /- s.e. across all recorded neurons. See also Figure 1—figure supplement 1. (C) Early action value difference coding predicts late chosen action coding. Z-scored regression coefficients for left minus right action value at 300 ms (ordinate) are plotted against Z-scored regression coefficients for left minus right choice at 700 ms (abscissa), for each DLPFC neuron (R=0.42; p=3.6*10-14). (D) Baseline-corrected ERP during choice epoch, in example subject, split by region. Lines denote mean /- s.e. across n = 125 (DLPFC)/n = 43 (OFC)/n = 85 (ACC) electrodes. Other subjects plotted in Figure 1—figure supplement 2. Vertical dashed lines are added to allow latency comparison with (E) and (F). (E) Z-statistic of regression of LFP data from example subject onto chosen and unchosen value. Note that at timepoint (i), overall value =chosen+unchosen; at timepoint (ii), value difference = chosen-unchosen. Lines denote mean /- s.e. across electrodes. In Figure 1—figure supplement 3, figure is split into different brain regions and cost/benefit. (F) Temporal derivative of evoked potential in part (D) (averaged across regions). Comparing parts (D), (E) and (F) shows that value correlates at timepoints (i) and (ii) occur when the LFP is ramping (derivative is non-zero), rather than peaking (derivative is near or at zero).
Figure 1—figure supplement 1
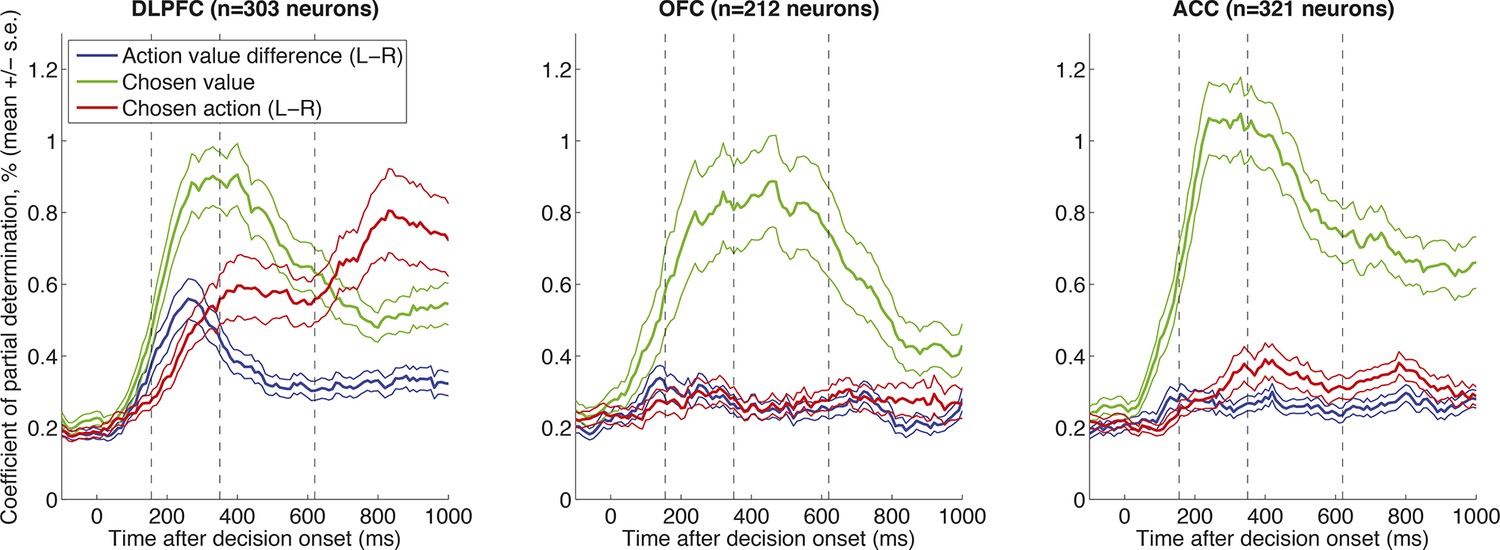
Correlates of decision variables in DLPFC, OFC and ACC single units, as in Figure 1B.
Coefficient of partial determination for multiple regression of left minus right action value (blue), chosen value (green) and left minus right choice (red) onto single neuron activity. Lines show mean /- s.e. across all recorded neurons. All three regions show correlates of chosen value, but the temporal evolution from action value difference to chosen action is selectively present in DLPFC.
Figure 1—figure supplement 2
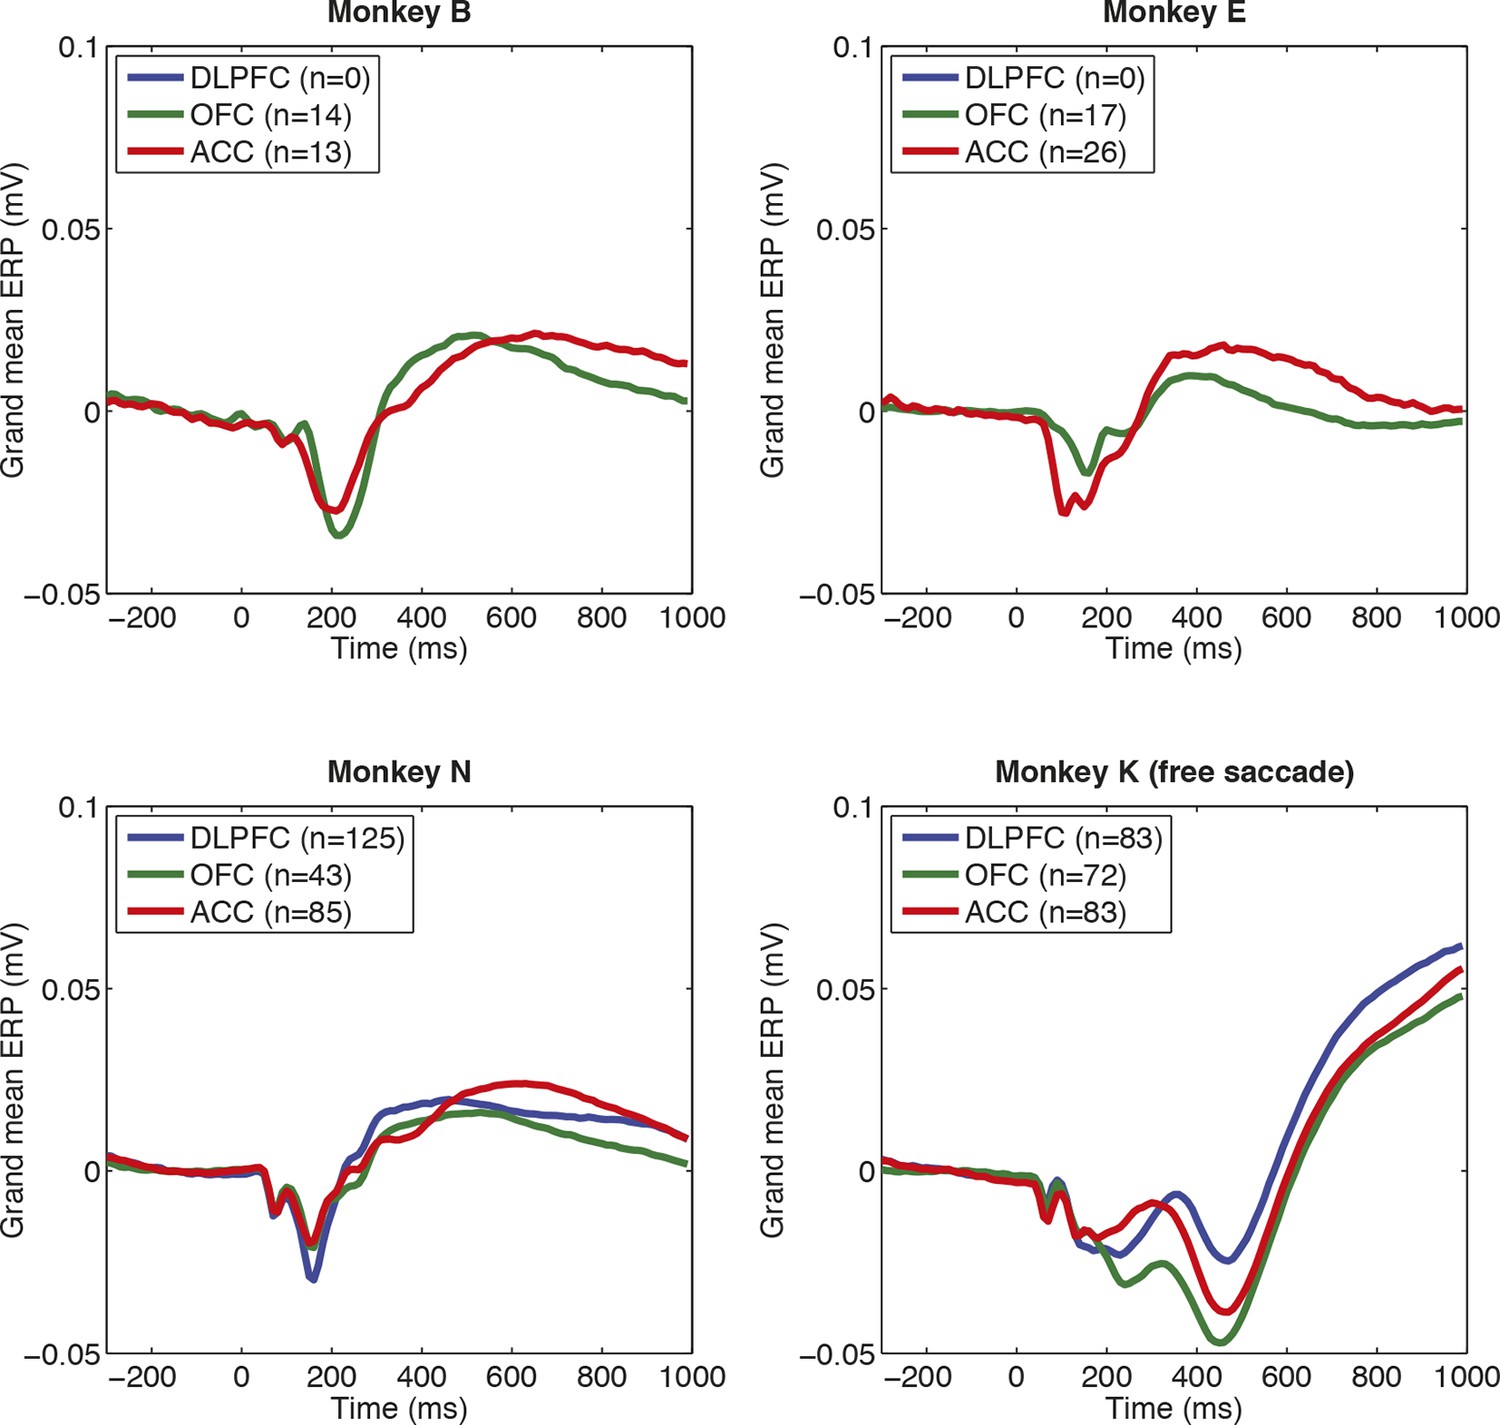
Consistency of evoked potentials across subjects, and brain regions, in macaque PFC.
Note that electrode count is smaller than total neuron count, as often multiple neurons are isolated from single electrodes, but we only included electrodes that were carried a well-isolated unit (and so in grey matter). Note also the different evoked potentials in monkey K relative to other subjects. This is likely a consequence of monkey K being unable to hold fixation; he was free to saccade during the choice epoch and selected using a joystick response after 1000 ms.
Figure 1—figure supplement 3
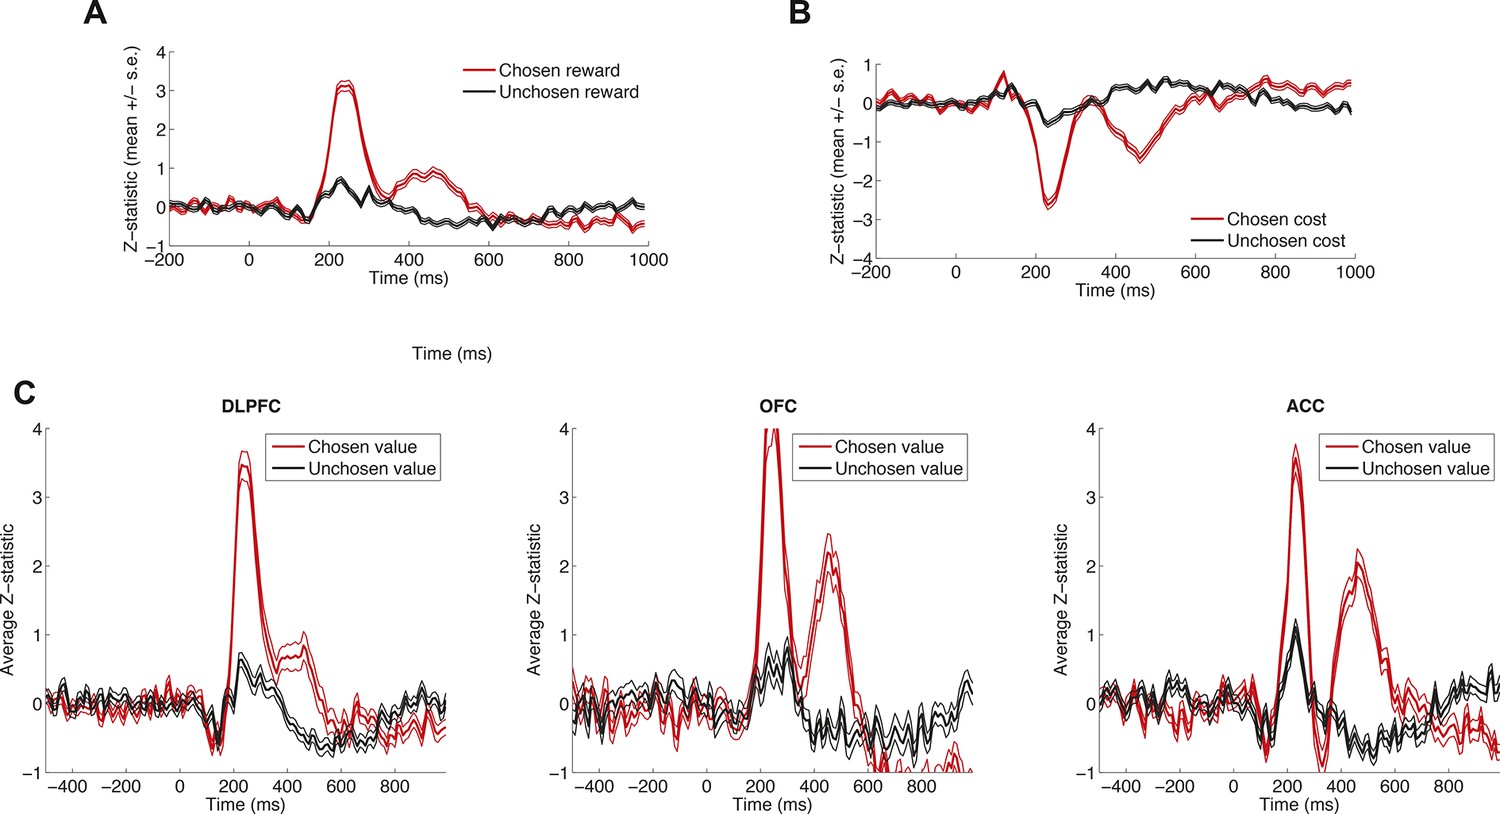
Effects of decision variables across different brain areas and reward vs. cost.
Data is plotted as in main Figure 1E, for example subject, but separated into (A) chosen and unchosen reward, (B) chosen and unchosen cost, and (C) DLPFC, OFC and ACC. Because of the similarity in dynamics, we collapsed across brain regions and across cost/reward (into value) for display purposes in main Figure 1E. Lines denote mean /- s.e. across n = 125 (DLPFC)/n = 43 (OFC)/n = 85 (ACC) electrodes.
Figure 2 with 5 supplements
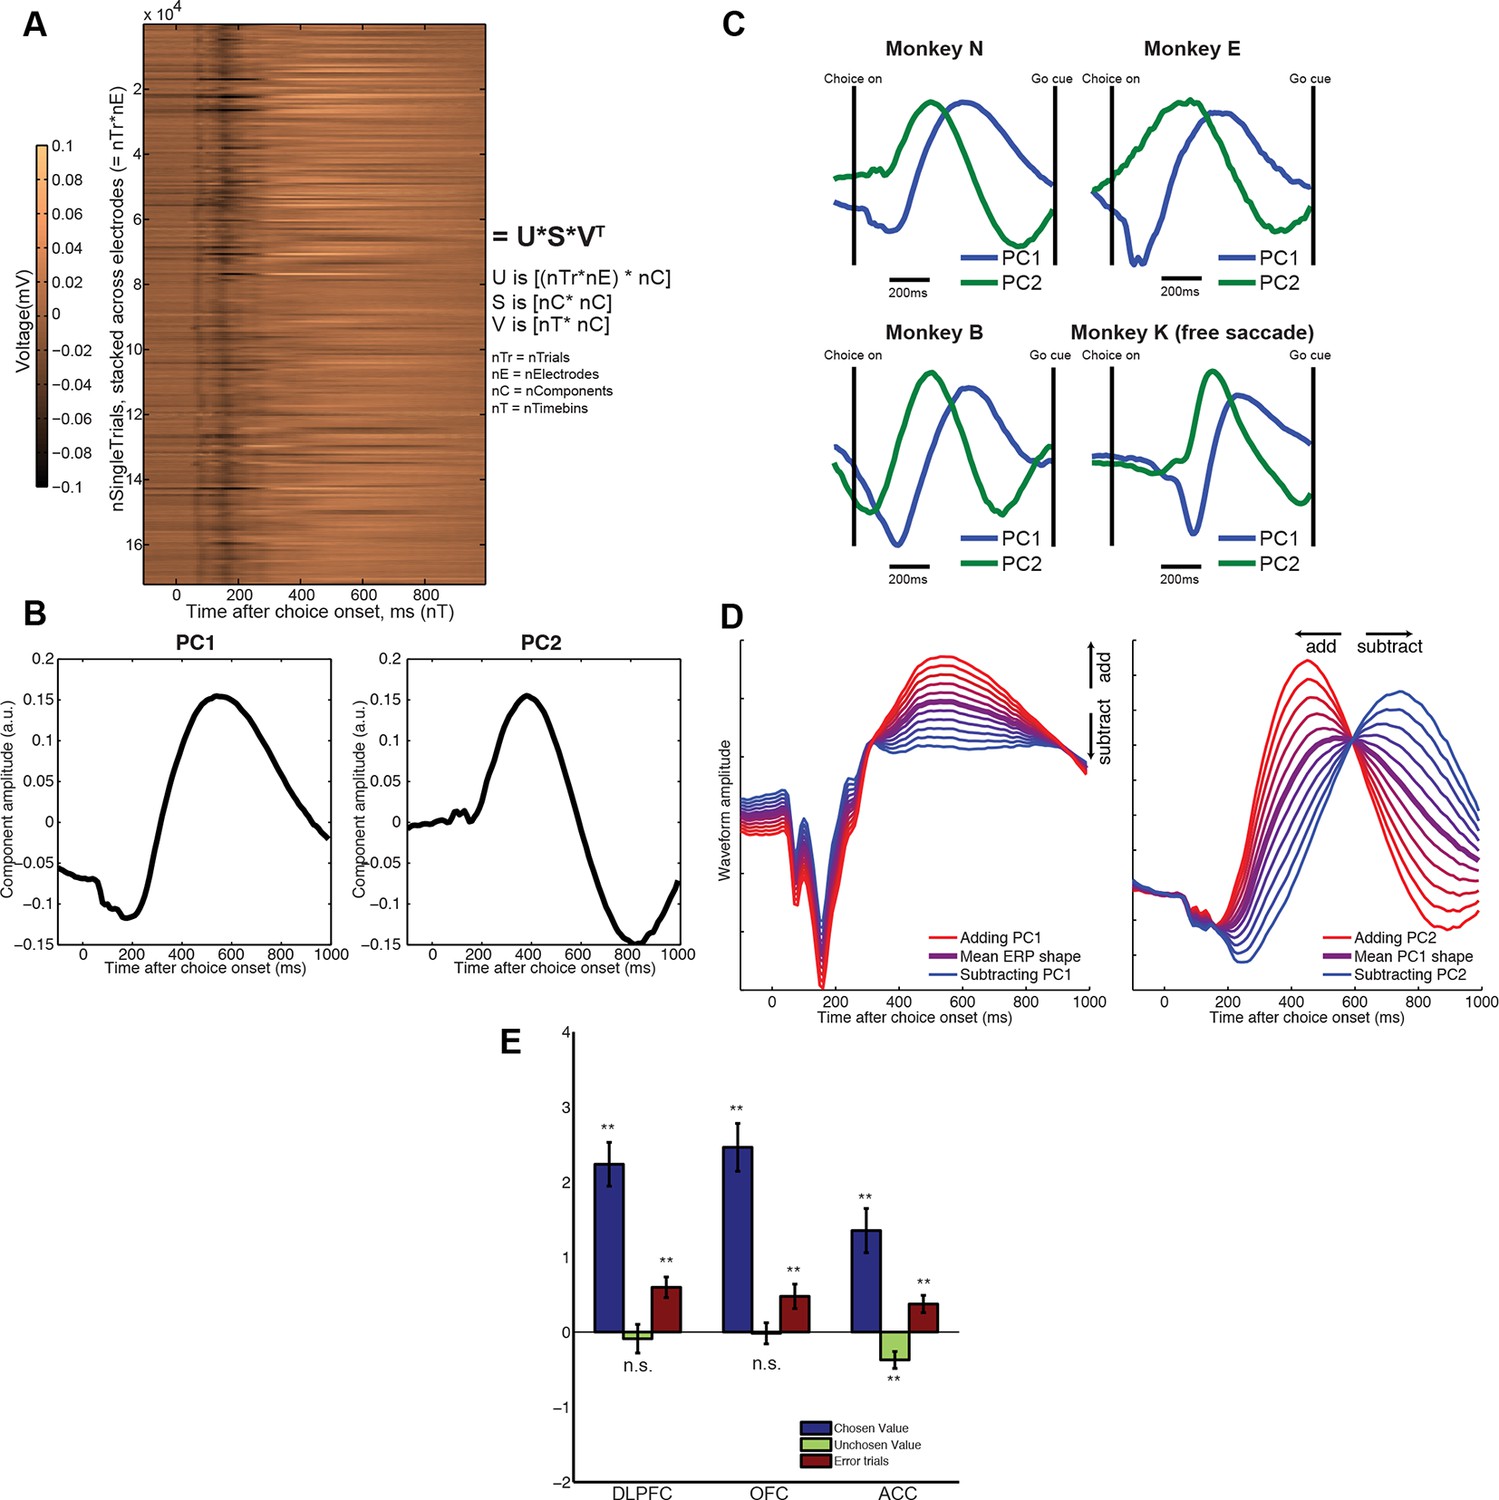
Extraction of internal dynamics from LFP data via principal components analysis (PCA).
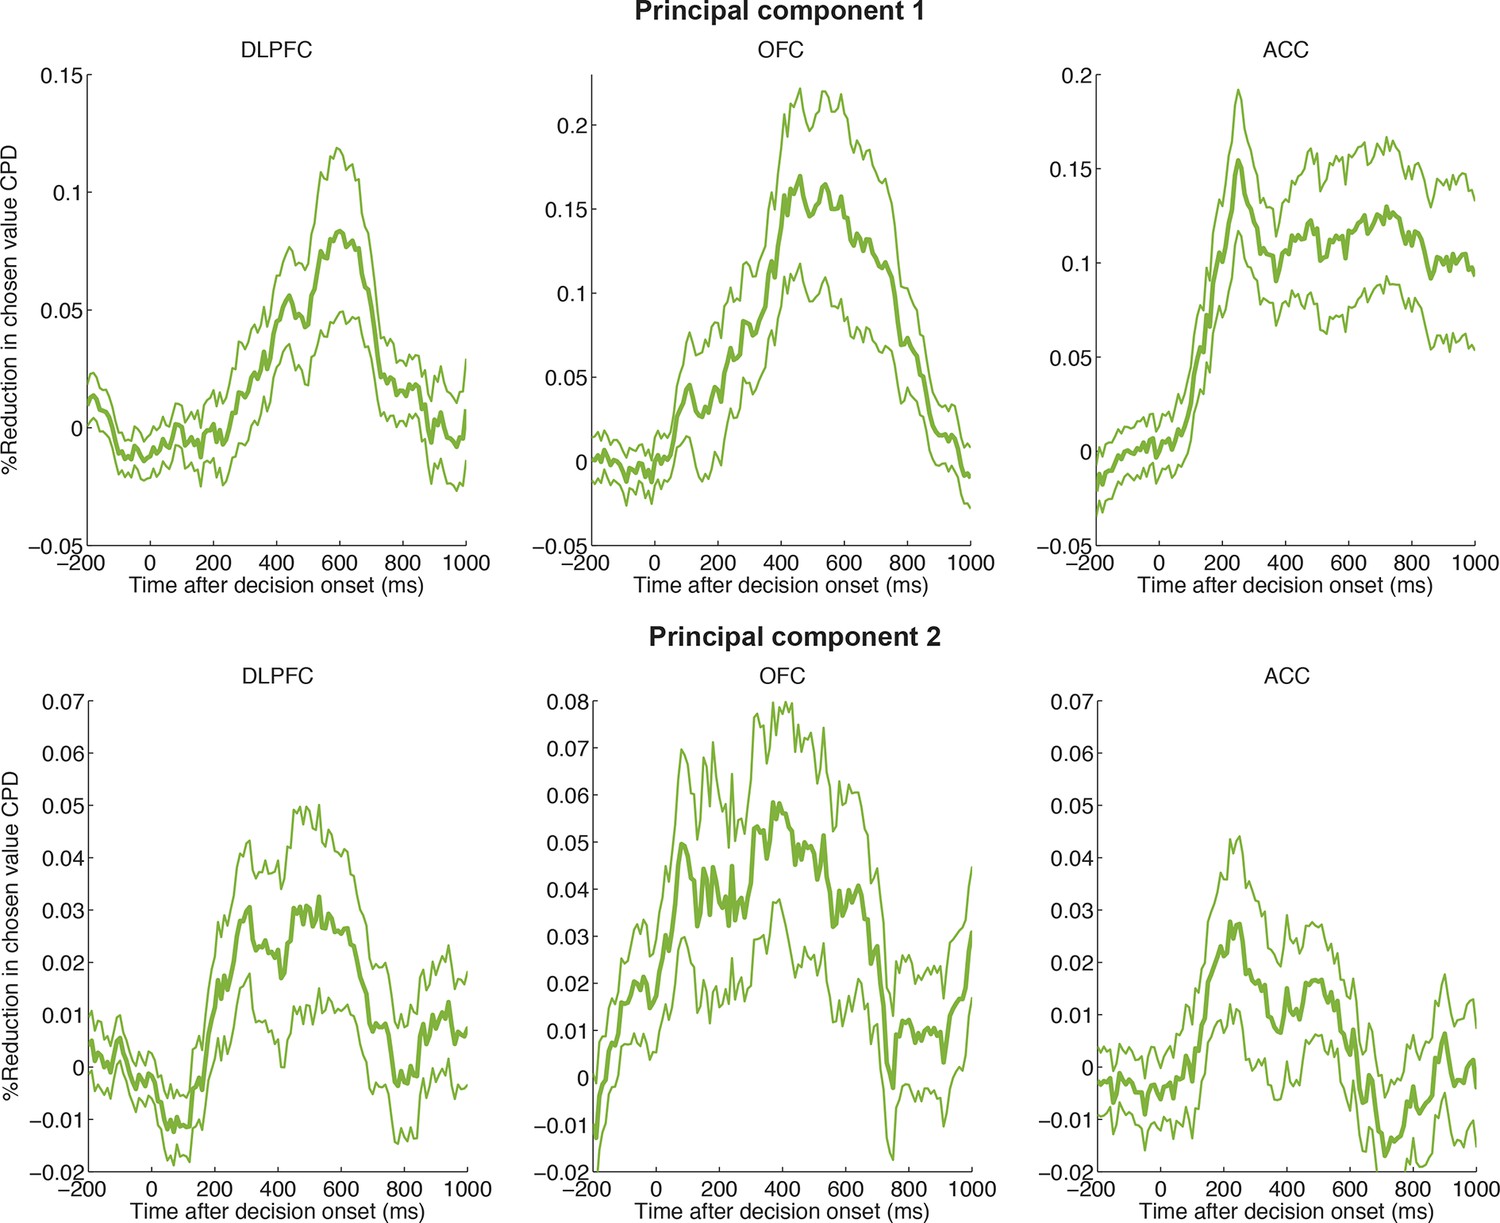
(A) A large matrix of single-trial data is formed by stacking data across all recordings. This was performed separately within each subject. Consistent evoked potentials were found across recording electrodes (Figure 2—figure supplement 1) and trials (Figure 2—figure supplement 2). The single trial-weights U are returned separately for each trial on each electrode, but their interpretation is determined by the shape of the components in V, and so is common to all electrodes. (B) The first and second principal components of this matrix, for example macaque subject N. (C) The shapes of PC1 and PC2 are consistent across subjects. (D) Left panel: the effect of adding/subtracting PC1 to the main ERP shape in example subject N, modulating its amplitude; right panel: the effect of adding/subtracting PC2 to PC1, modulating its latency. As shown in Figure 2—figure supplement 3, this shift in latency can also be related to changes in low-frequency oscillatory phase during the decision period. (E) The influence of chosen value, unchosen value and error trials on PC2 scores (i.e. the second column of matrix V), estimated via multiple regression. Bars show regression coefficients (a.u.), mean /- s.e. across electrodes (macaque). ** denotes p<0.01, one-sample T-test. Effects are shown separately for monkey K (who saccaded freely during choice epoch, and indicated response using joystick) in Figure 2—figure supplement 4. Influence of variables on PC1 scores shown in Figure 2—figure supplement 5.
Figure 2—figure supplement 1
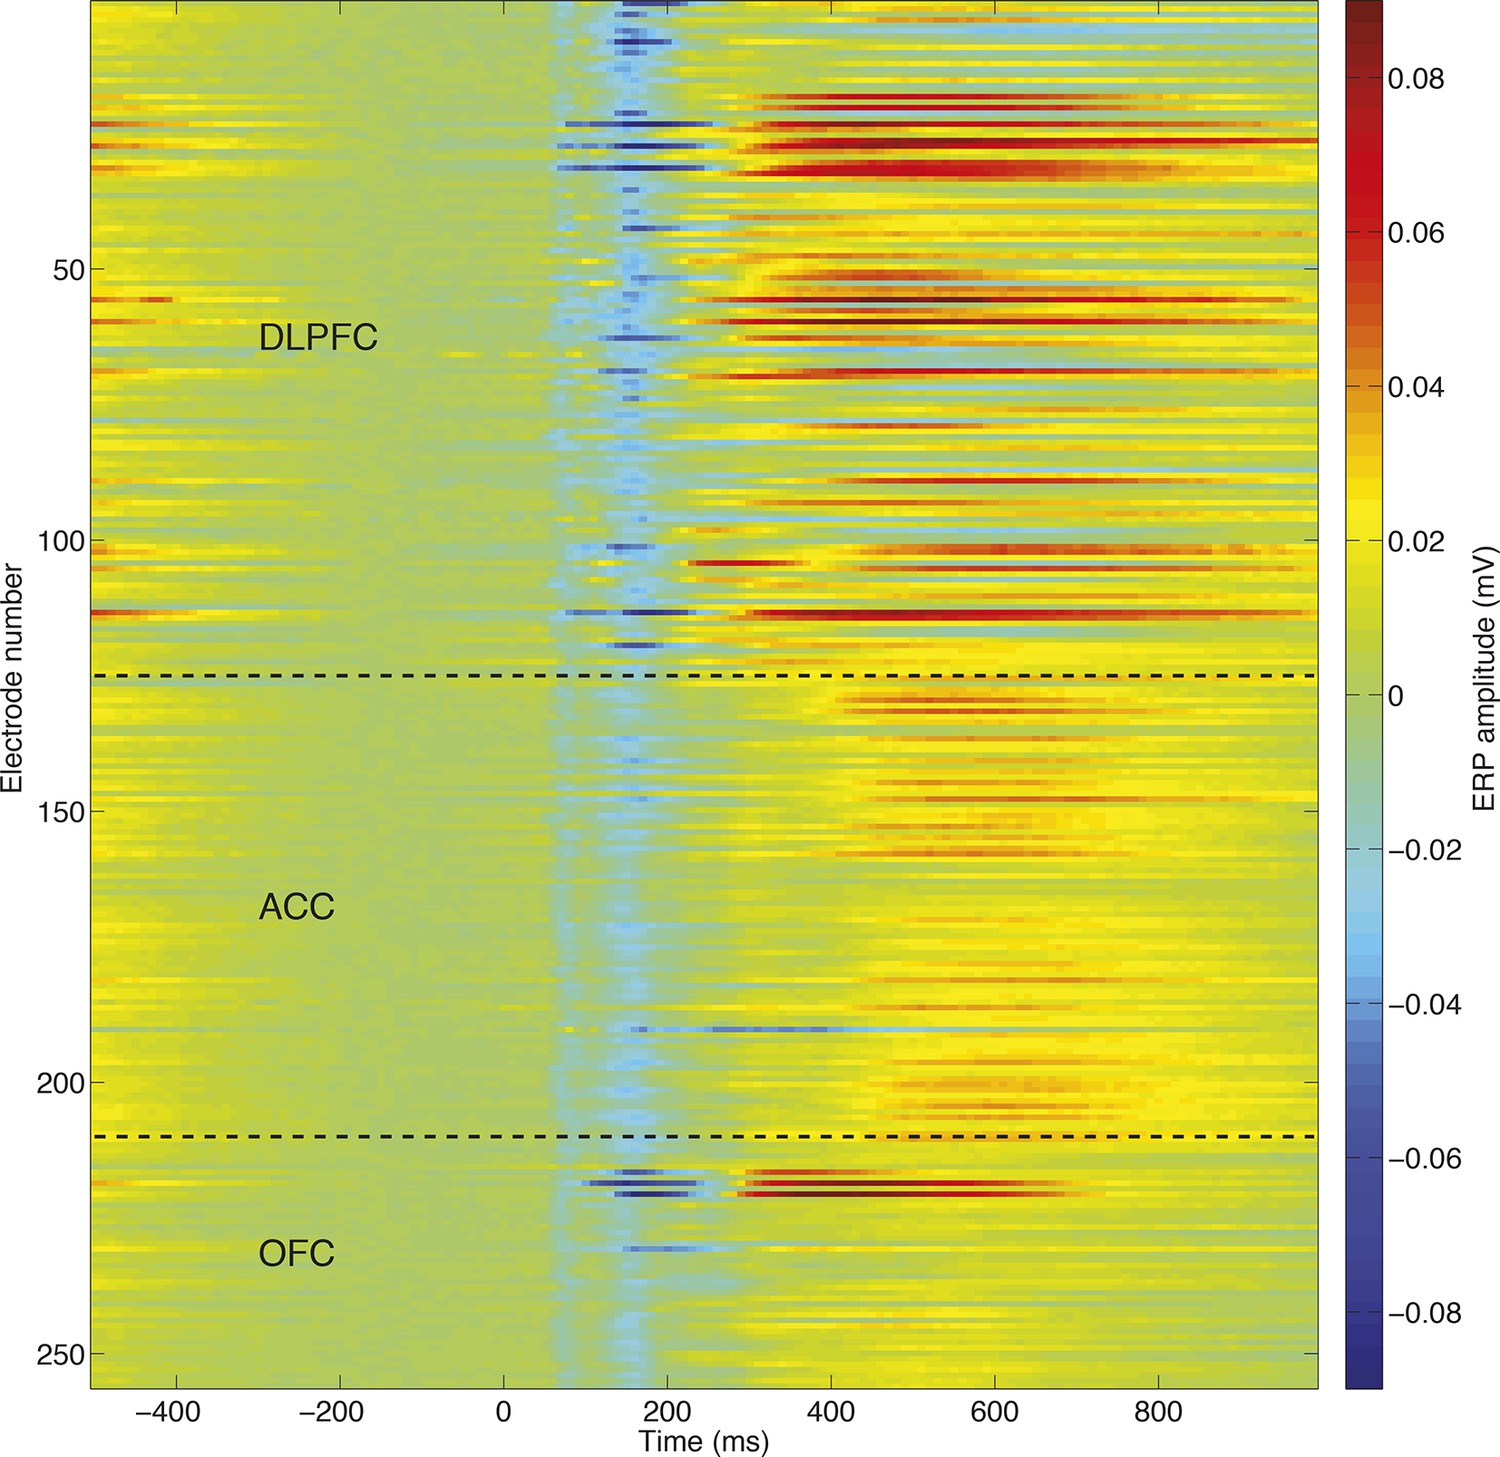
Consistency of evoked potentials across different recording electrodes/recording sessions, in an example subject (monkey N).
The similarity between evoked potentials allows a common dimensionality reduction to be applied across all recorded sessions, eliminating the problem of matching principal components across sessions.
Figure 2—figure supplement 2
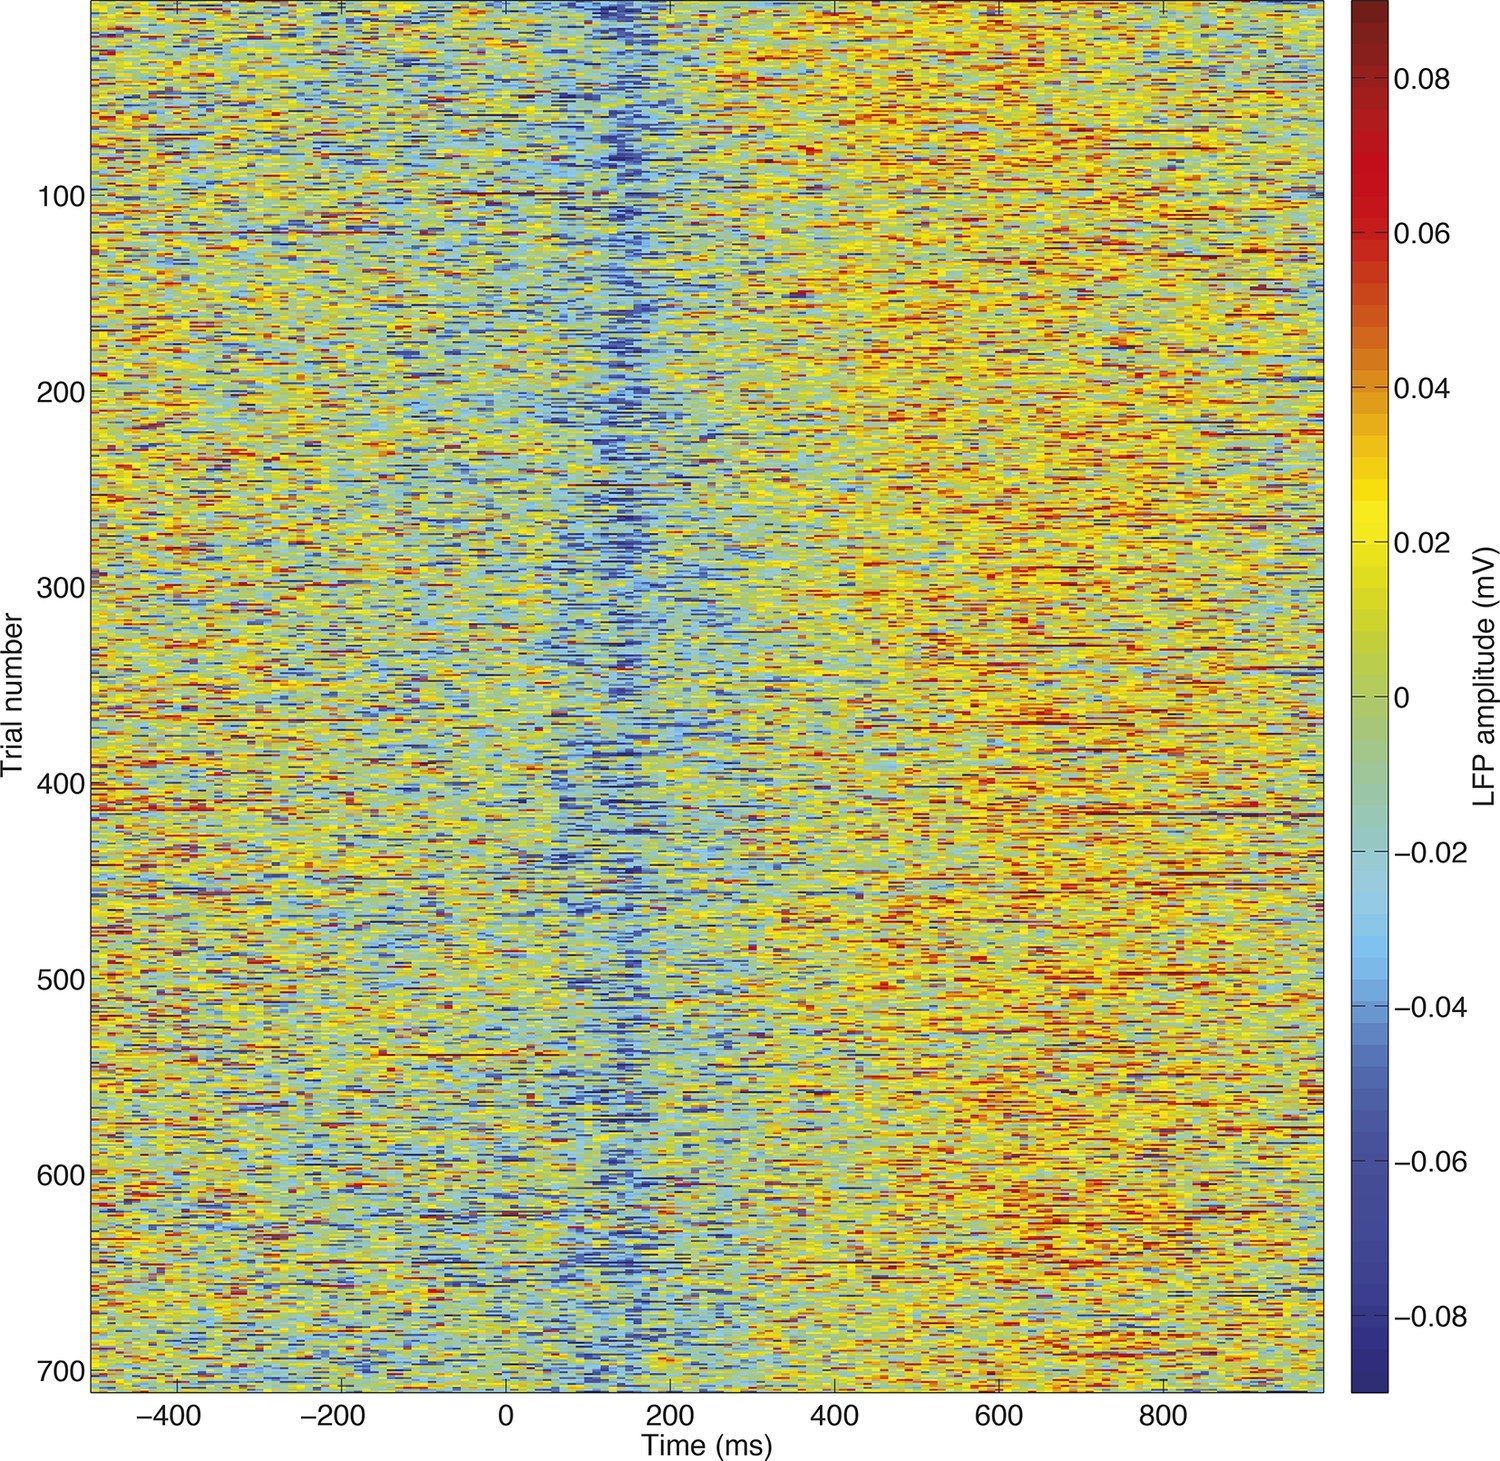
High signal to noise ratio in single-trial LFP responses.
All trials, unfiltered, from a single session are stacked for an example electrode. The evoked potentials plotted in (Figure 1—figure supplement 2) and (Figure 2—figure supplement 1) can clearly be seen at the single trial level, allowing single trial dynamics to be readily estimated.
Figure 2—figure supplement 3
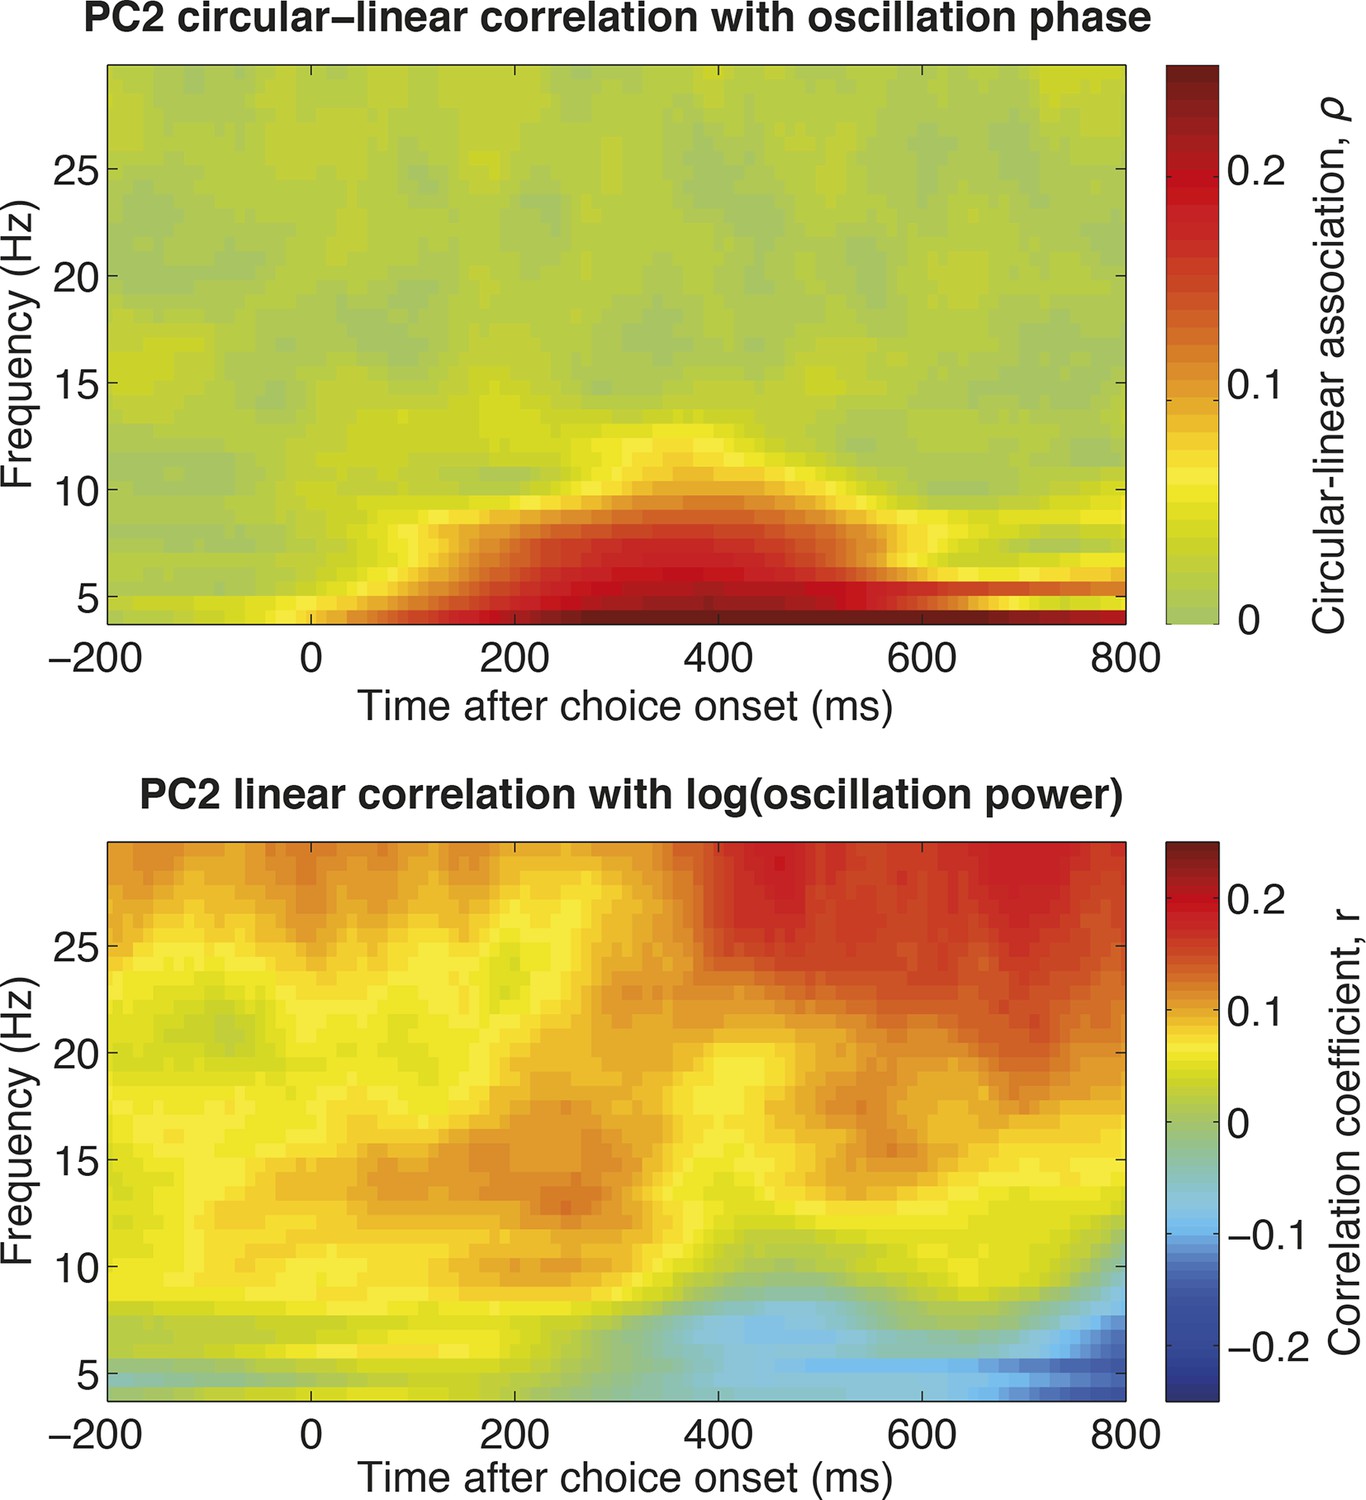
The relationship between single-trial PC2 weights and single-trial time-frequency decomposition (estimated across all electrodes in DLPFC).
The top panel shows the circular-linear correlation (Berens, 2009) between the phase of the LFP in each frequency band for each timebin, and the PC2 weight for the corresponding trial. Note that this measure is non-negative by definition. This indicates that,as expected if PC2 alters the latency of a slow evoked potential, single-trial PC2 weights correlate with the oscillation phase in the theta range. The bottom panel shows the correlation coefficient between the power in each frequency band for each timebin , and the PC2 weight for the corresponding trial. This suggests a positive relationship between single-trial PC2 weights and high beta/low gamma oscillations late in the decision period.
Figure 2—figure supplement 4
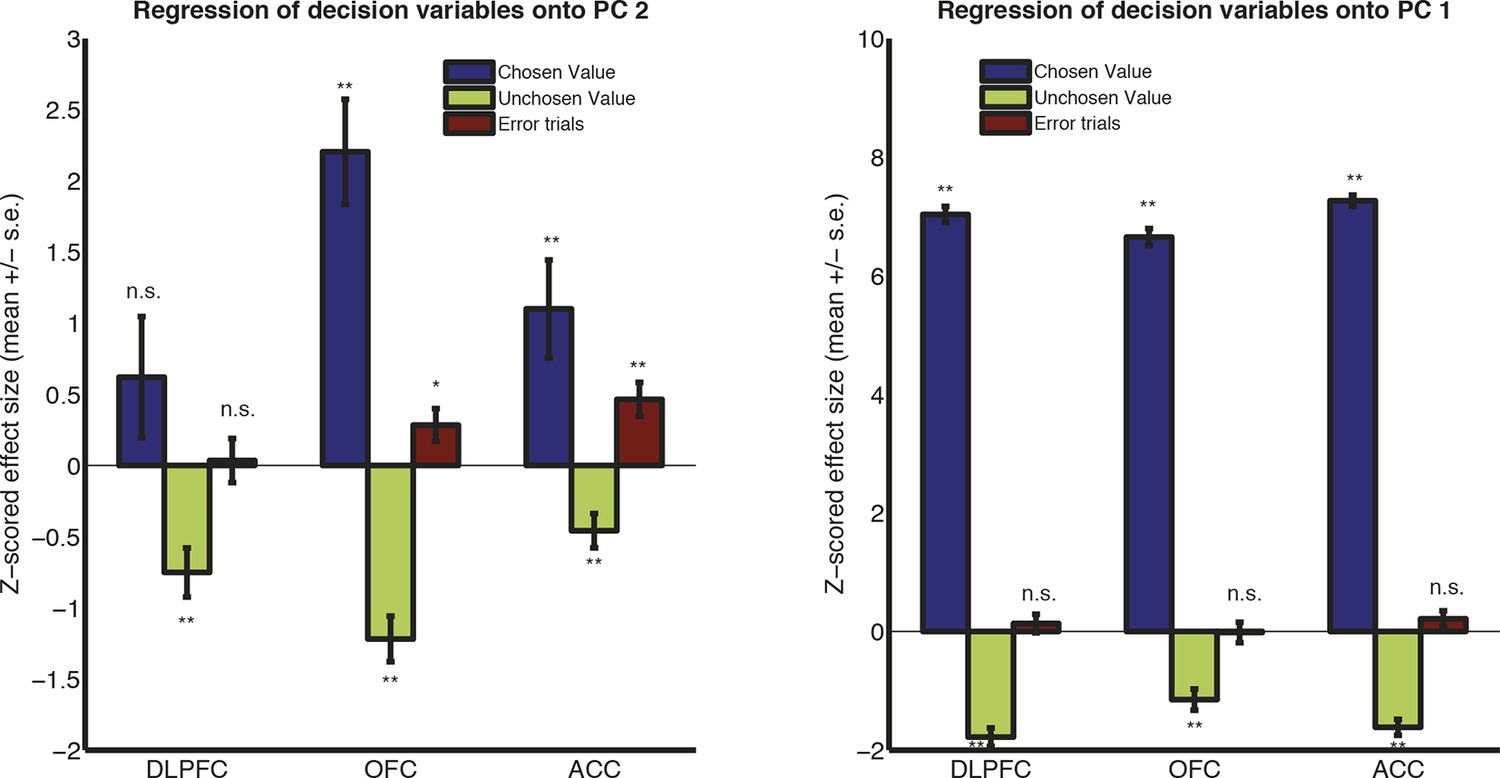
Regression of decision variables onto PC2 (left) and PC1 (right) in monkey K (free saccade).
Monkey K was free to saccade during the 1s choice period, and made a joystick response rather than a saccade response after 1s had elapsed. Because of the different shape of the evoked response in monkey K (Figure 1—figure supplement 2) and the differences in PC1/2 timecourses as a consequence (Figure 2C), we here plot the effects of decision variables on PC weights separately for monkey K. (Note that PC1 still controlled waveform amplitude, and PC2 still controlled waveform latency, in this subject.) The effects of chosen value and error trials are similar for PC2 (left panel) as for other subjects (Figure 2E), but only reach significance in OFC and ACC. There is also a negative effect of unchosen value on PC2 in all regions, which is not clearly seen in other subjects (Figure 2E). However, the effects of chosen and unchosen value on PC1 (right panel) are highly significant, but not in the same direction as for other subjects (Figure 2. – figure supplement 5). We hypothesise that this is because in monkey K, PC1 is near zero during the early phase of the decision, but strongly modulated during the later phase (Figure 2C), which might imply a modulation by value difference as opposed to overall value.
Figure 2—figure supplement 5
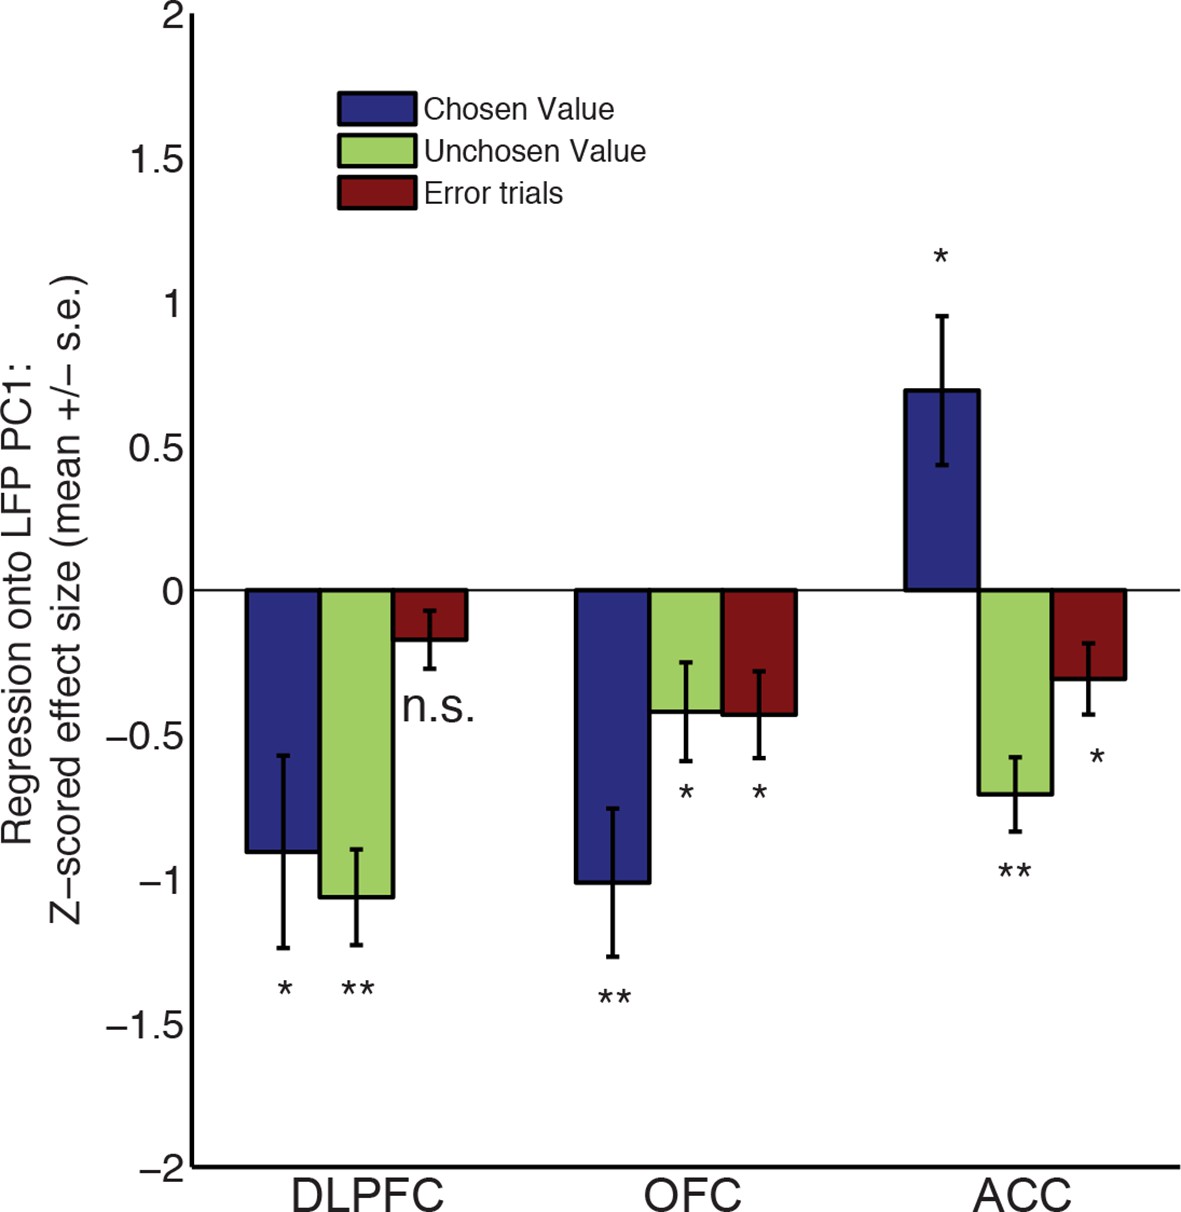
Regression of decision variables onto PC1.
The influence of chosen value, unchosen value and error trials on PC1 scores, estimated via multiple regression. Bars show mean /- s.e. across electrodes. ** denotes p<0.01; * denotes p<0.05, one sample T-test.
Figure 3
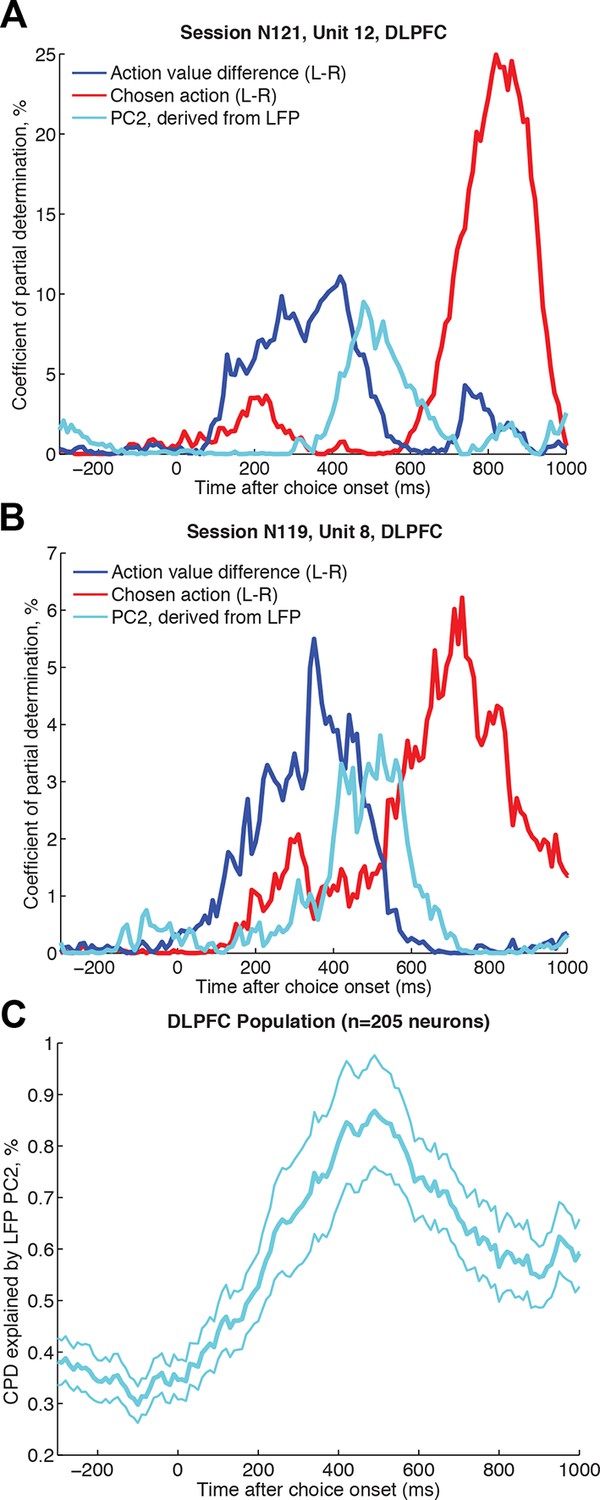
Single unit firing in DLPFC explained by simultaneously recorded LFP dynamics, over and above contribution from experimental variables.
(A)/(B) Two example neurons from DLPFC each showing a transition from encoding action value difference (blue) to later encoding the selected action (red), and influenced by the LFP-derived PC2 single trial weights (cyan) in the intervening period. The coefficient of partial determination (CPD) is plotted for all three factors (see Methods for full list of other task-related variables included in regression model). (C) Timecourse of population CPD explained by LFP-derived PC2 weights (for n=205 DLPFC neurons that had a simultaneously recorded LFP on a separate DLPFC electrode). Lines show mean /- s.e. across neurons.
Figure 4 with 3 supplements
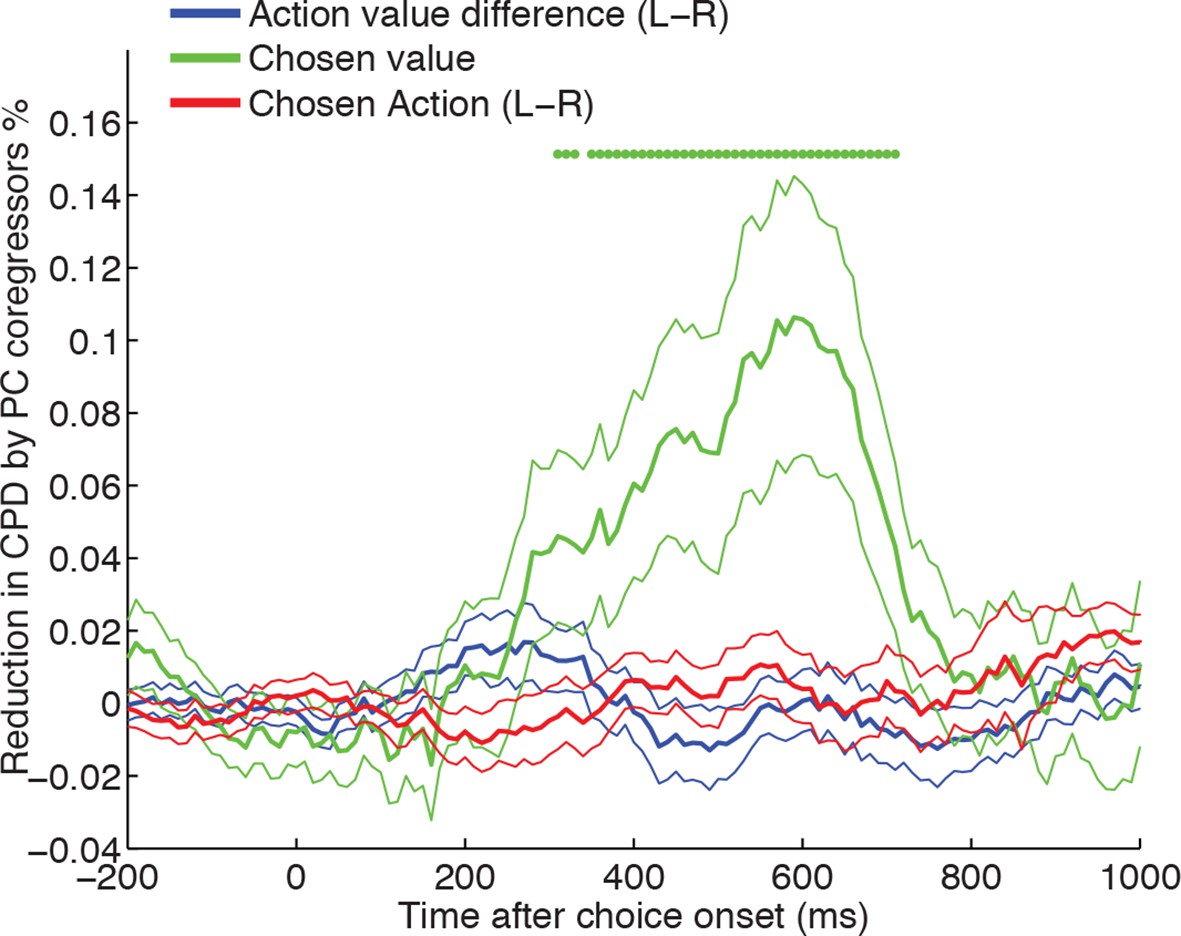
Chosen value, but not action value difference or chosen action, is explained away by neural dynamics.
CPD for chosen value (green) is reduced by including PC1/PC2 from the LFP decomposition as coregressors in the decision model. The reduction in CPD (n=205 DLPFC neurons) for each of the decision variables in Figure 1C as a consequence of including PC1/2 is shown, by subtracting it from a control model that included two noise components (PC101/102). Note that the maximal value that this reduction can take is determined by the CPD for each regressor at each point in time (shown in Figure 1B). Lines show mean /- s.e. across neurons. Dots denote timepoints with a significant (p<0.05, permutation test) change in CPD across the DLPFC population. See also Figure 4. – figure supplement 1 for OFC/ACC, and Figure 4—figure supplement 2 for the contribution of PC2 alone. Figure 4—figure supplement 3 compares the effect of local DLPFC PC weights with respect to those from a distal, simultaneously recorded brain region (i.e. either OFC or ACC).
Figure 4—figure supplement 1
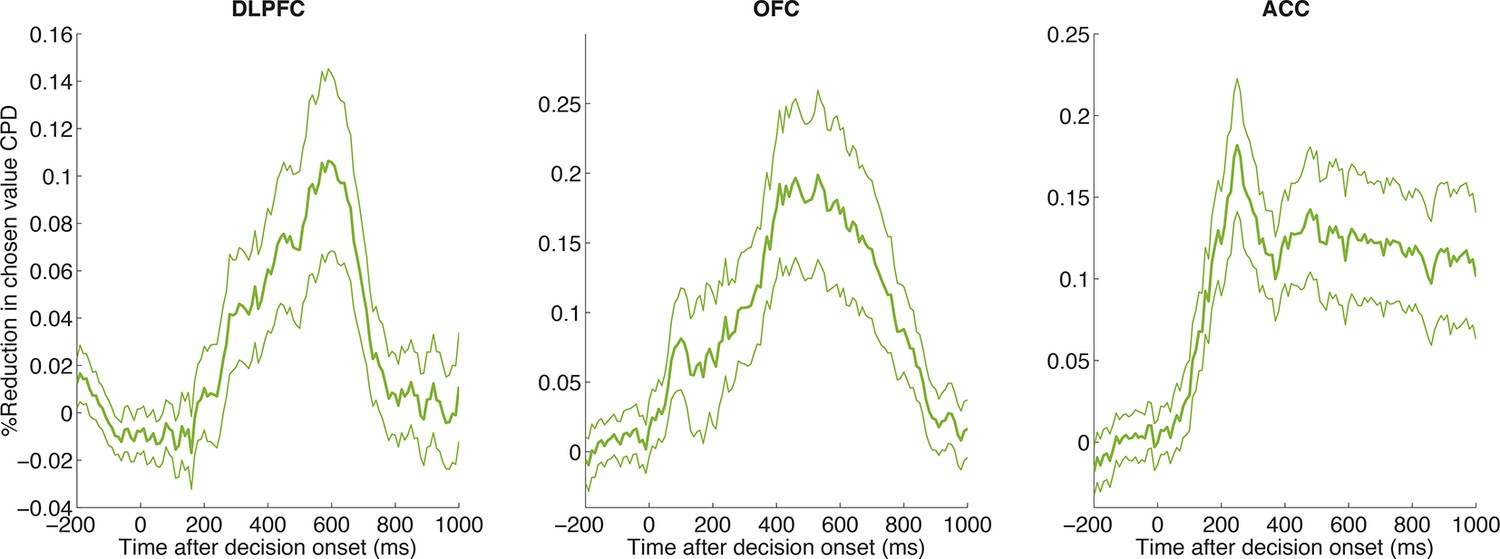
CPD for chosen value is reduced by including PC1/PC2 as coregressors in the decision model across all three regions.
The reduction in CPD for chosen value as a consequence of including PC1/2 is shown, relative to a control model that included two noise components (PC101/102). Lines show mean /- s.e. across all neurons with simultaneously recorded LFP on another electrode in the same brain region.
Figure 4—figure supplement 2
CPD for chosen value is reduced by including PC1/PC2 alone as coregressors.
Whilst the main figure shows the reduction in chosen value by the inclusion of both PC1 and PC2 as coregressors in the regression model, this figure shows the independent influence of adding/removing PC1 and PC2 alone on the coefficient of partial determination (CPD) for chosen value in neurons across all areas. Across all three regions, PC1 reduces chosen value CPD to a greater extent than PC2. This is particularly the case in ACC, where PC1 showed a different relationship to chosen value than in DLPFC/OFC (see Figure 2—figure supplement 5). Lines show mean /- s.e. across neurons.
Figure 4—figure supplement 3
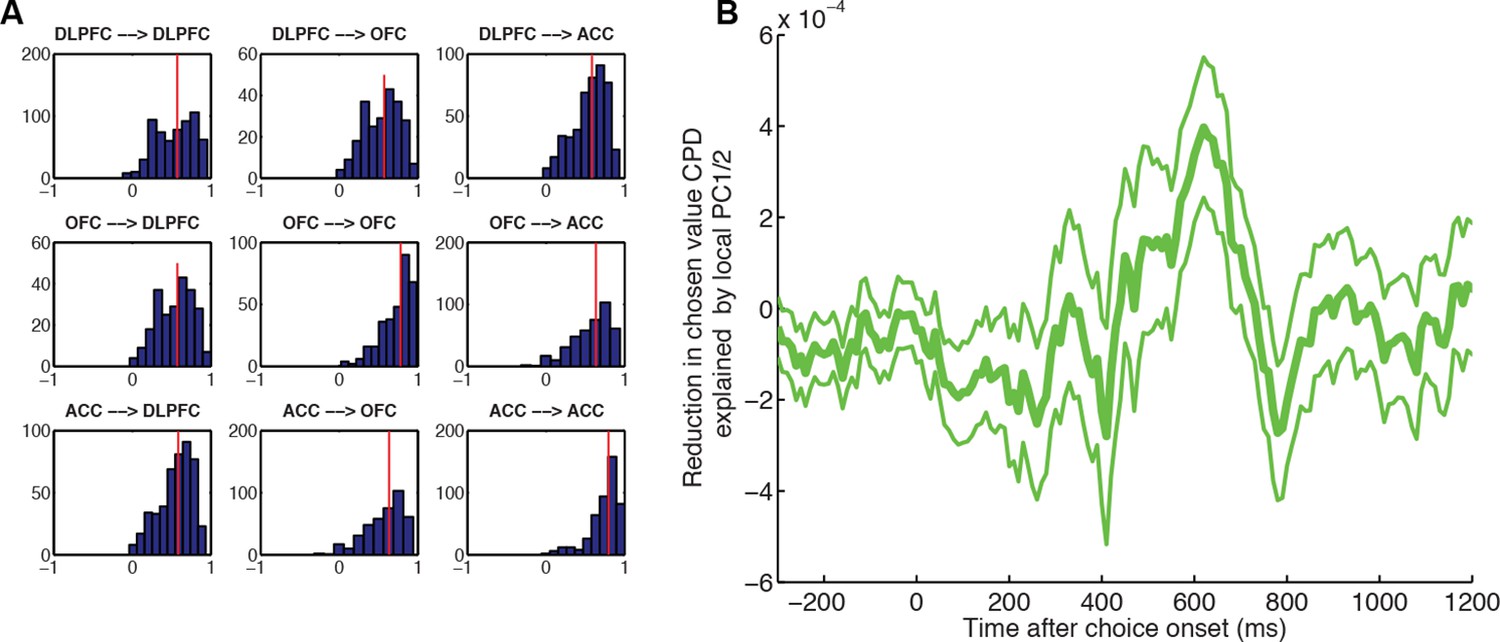
Local PC1/2 (controlling for larger-scale global influences) reduces chosen value CPD more than global PC1/2 (controlling for local influences).
(A) Underlying correlation structure in principal component weights (PC2) across simultaneously electrodes, both within region (on-diagonal) and across region (off-diagonal). Each histogram shows the distribution of correlation coefficients across PC2 weights from simultaneously recorded electrodes. As might be expected, PC2 weights are correlated within region but also across regions. However, the median correlation (vertical line) is generally lower across-regions than within-region. This suggests that PC2 weights reflect local dynamics. (B) Greater reduction in CPD of chosen value in DLPFC neurons by local, rather than distal, PC1/2. Local PC1/2 weights (another electrode in the same region) are first orthogonalised with respect to PC1/2 weights from simultaneously recorded electrodes in another distal brain region (either OFC or ACC). These are then included as a coregressor in the regression onto decision variables, as in Figure 4. The CPD for chosen value is then subtracted from that of a separate model, where the converse analysis has been performed: PC1/2 weights from the distal region are included, having orthogonalised those weights with respect to local PC1/2 weights. As a consequence, positive values indicate that local PC1/2 weights cause a greater reduction in chosen value coding than distal PC1/2 weights.
Figure 5 with 1 supplement
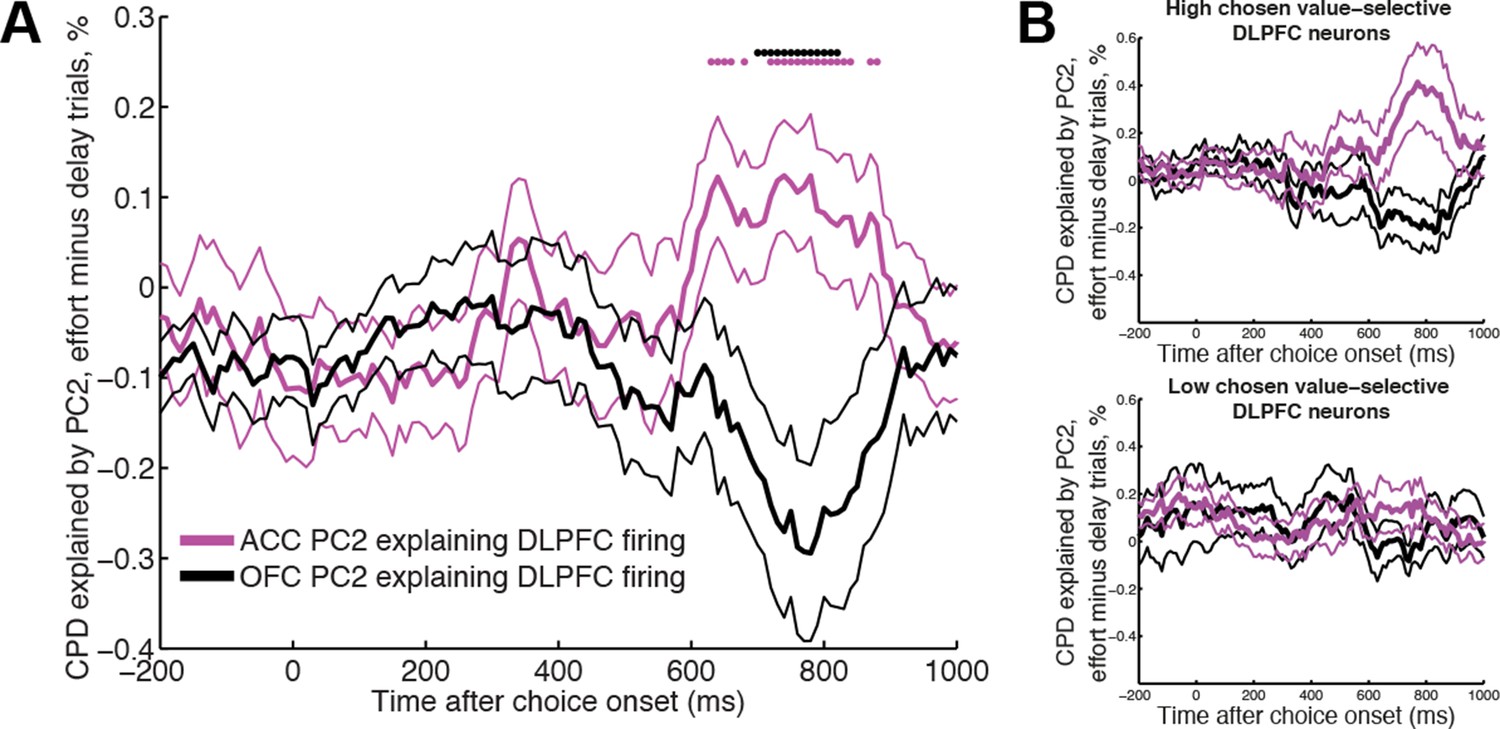
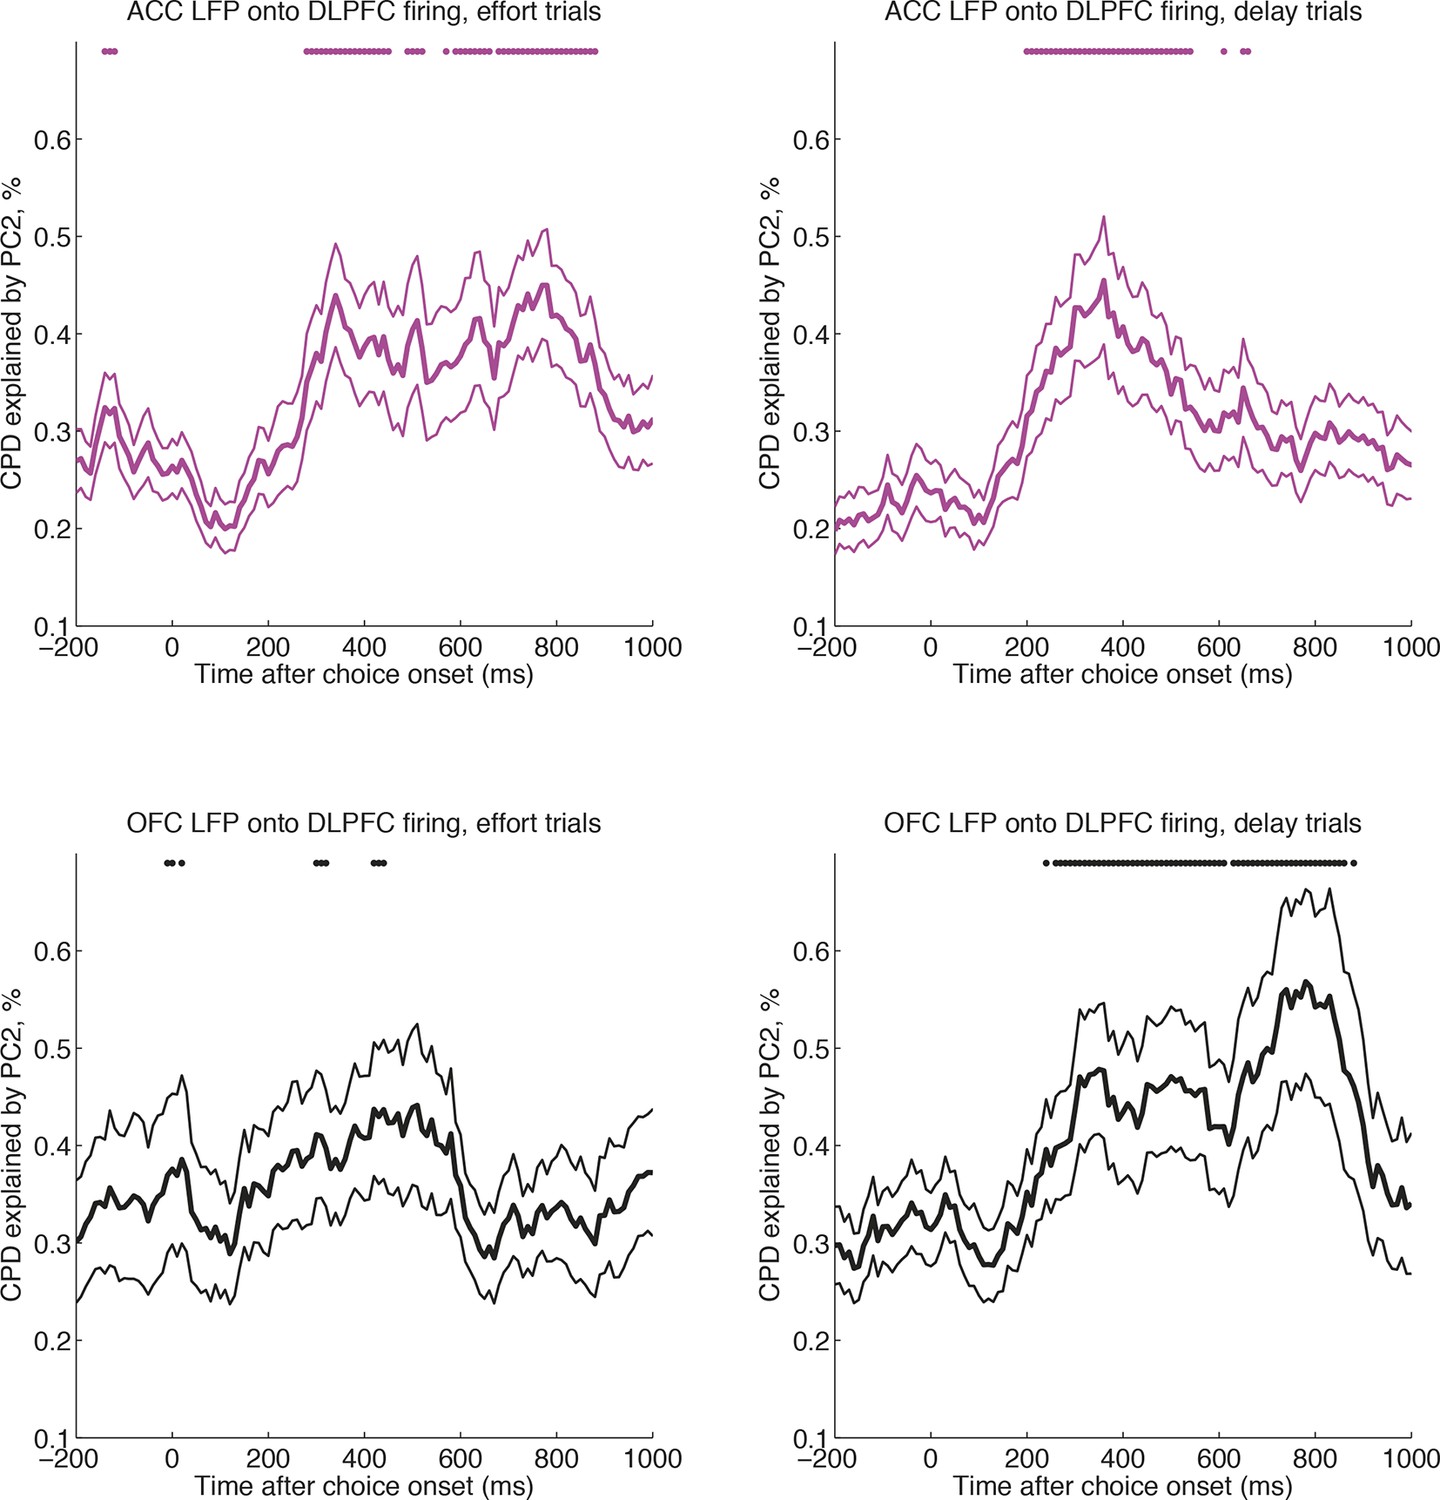
ACC and OFC local dynamics explain greater DLPFC neural firing on effort-based and delay-based decisions, respectively.
(A) The relative CPD for DLPFC firing explained by PC2 on effort trials minus delay trials, where PC2 is derived from simultaneously recorded ACC LFP (magenta) and OFC LFP (black) (n=124 DLPFC units which had simultaneous recordings in both OFC and ACC). ACC explains more variance on effort than delay trials (positive-going values), whereas the converse is true for OFC (negative-going values). See also Figure 5—figure supplement 1. Lines show mean /- s.e. across neurons. Dots denote timepoints with a significant (p<0.05, permutation test) change in CPD across the DLPFC population. (B) The same analysis as in Figure 5A, having first performed a median split for chosen value-selectivity. Neurons with high chosen value selectivity (top panel, n=62 DLPFC units) show the effect found in Figure 5A, whereas neurons with low chosen value selectivity (bottom panel, n= 62 DLPFC units) do not.
Figure 5—figure supplement 1
Cross-regional interactions, separately for delay versus effort trials.
CPD for DLPFC firing explained by PC2 on effort trials (left) and delay trials (right), where PC2 is derived from simultaneously recorded ACC LFP (magenta, top row) and OFC LFP (black, bottom row) (n=124 DLPFC units, which had simultaneous recordings in both OFC and ACC). OFC and ACC PC2 weights compete for variance to explain neural activity in the same regression model (see Methods). Lines show mean /- s.e. across neurons. Dots denote timepoints with a significant (p<0.05, permutation test) change in CPD across the DLPFC population.
Figure 6
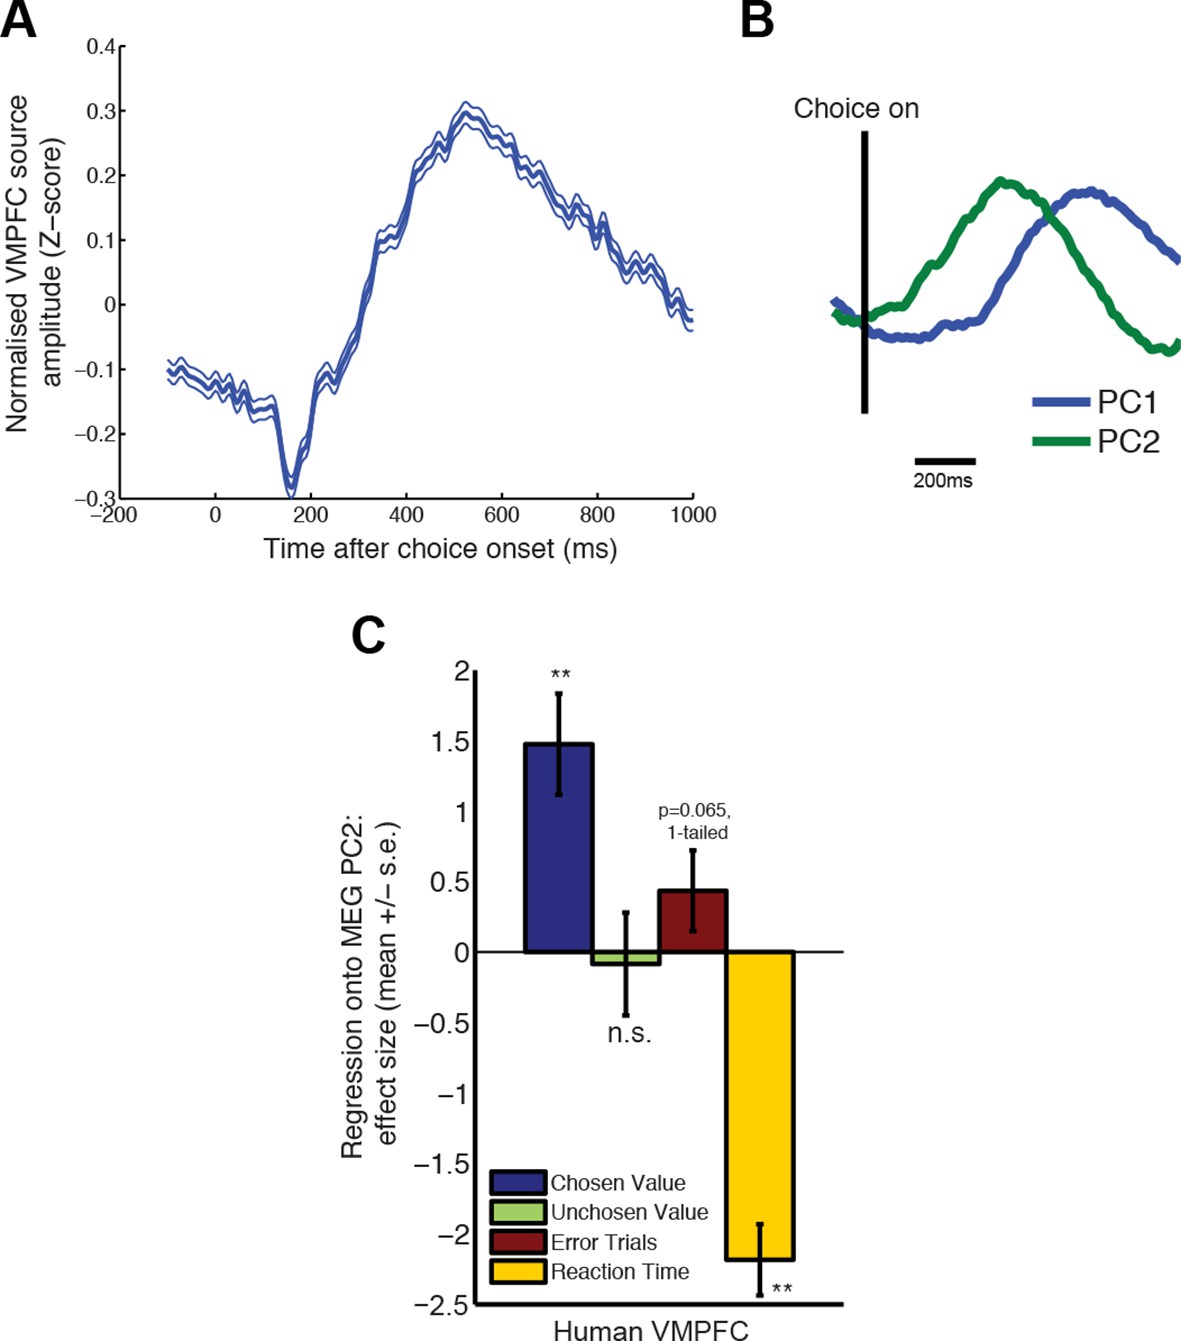
PCA decomposition of human MEG data shows similar characteristics to decomposition of monkey LFP data.
(A) Averaged evoked response from data beamformed to ventromedial prefrontal cortex (MNI coordinate (6, 28, -8mm)), from a previous study of value-guided decision making (Hunt et al., 2012; 2013). Lines show mean /- s.e. across trials. (B) PCA decomposition of human MEG data yields two principal components similar to those found in macaque LFP data (cf. Figure 2C). (C) The influence of chosen value, unchosen value and error trials on PC2 scores, estimated via multiple regression, in humans. Effects are similar to those found in macaque PFC (cf. Figure 2E). Also shown, in yellow, is the additional effect of reaction time (orthogonalised with respect to chosen value, unchosen value and error trials). Bars show mean /- s.e. across trials; ** denotes p<0.01, one-sample T-test.
Figure 7 with 1 supplement
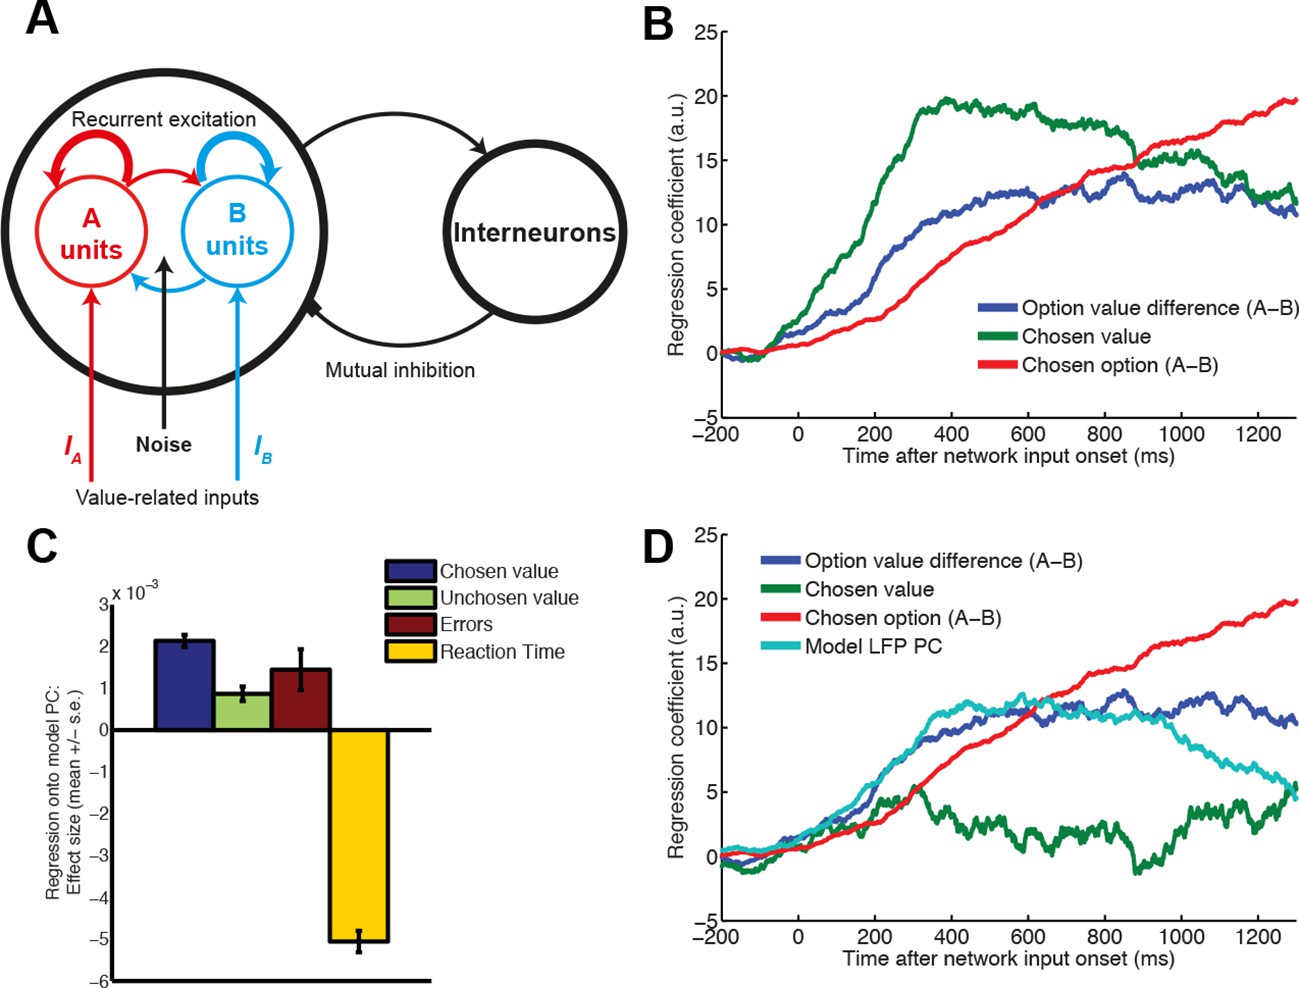
Relationship between value, LFP and single units explained by competition via mutual inhibition.
(A) Model schematic. A and B units receive value-related inputs, integrate these via recurrent excitation, and competition via mutual inhibition. See ‘Supplementary Details of Network Modelling’ for details. (B) Correlates of decision variables in attractor network model single unit activity. Regression coefficient for option value difference (blue line), chosen value (green line) and chosen option (red line) onto firing rates of ‘A’ selective units in the network model. Compare with Figure 1B: in DLPFC, ‘A’ selective units are hypothesised to correspond to left selective units, and ‘B’ units to right selective units. (C) Regression of decision variables onto PC1 from PCA-decomposed LFP model predictions, as in figure 2e/f. Note that in model, PC1 captures variability in decision latencies, not PC2 as in data (see Figure 7—figure supplement 1). (D) Correlates of decision variables when model LFP PC1 is included as coregressor. LFP PC1 from model explains firing rates with a similar timecourse to LFP PC2 from data (Figure 3C), but explains away much of the contribution of chosen value to single unit firing (Figure 4).
Figure 7—figure supplement 1
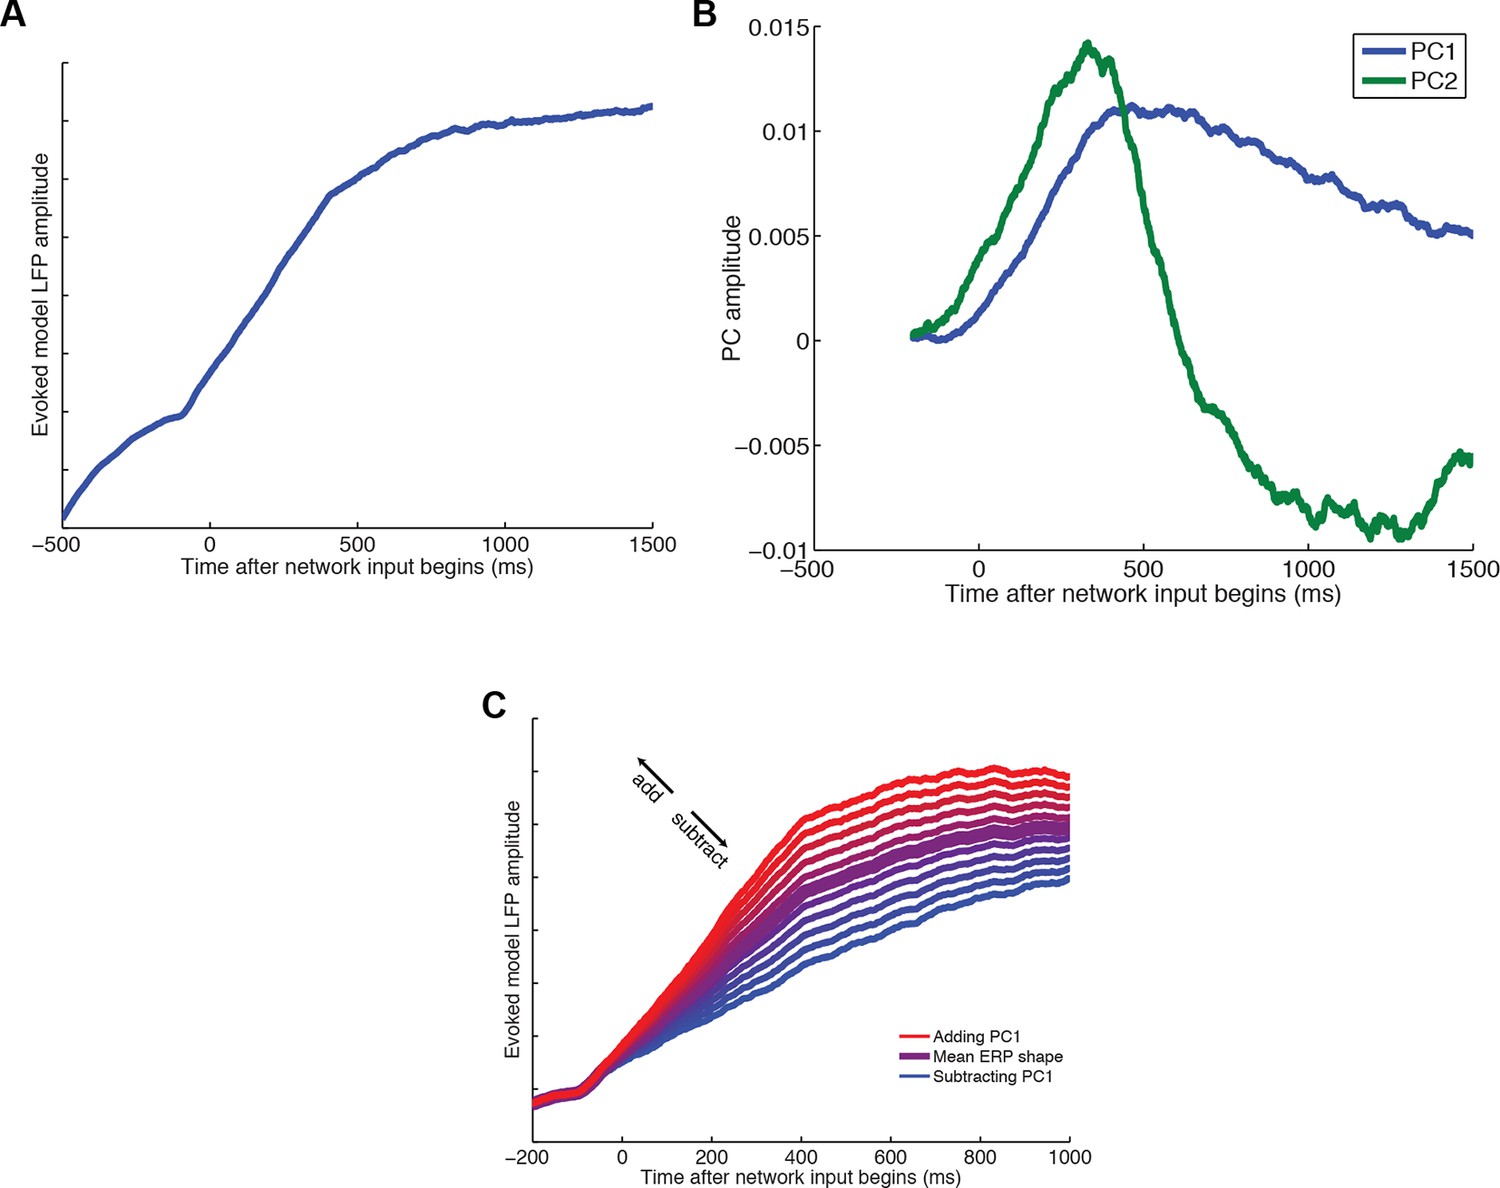
Dimensionality reduction of LFP predictions from attractor network model of competition via mutual inhibition.
(A) Averaged evoked LFP response from the model. (B) Model-derived PC1 and PC2, obtained via similar dimensionality reduction as applied to LFP and MEG data in main text. (C) PC1 captures variation in final attractor state, but also captures variation in rise time of model latency (see ‘Supplementary Details of Network Modelling’ for explanation). As such, PC1 captures the rate at which model reaches an attractor state, and is analogous to a PC2 in data. It is used for regression in Figure 7C.
Author response image 1
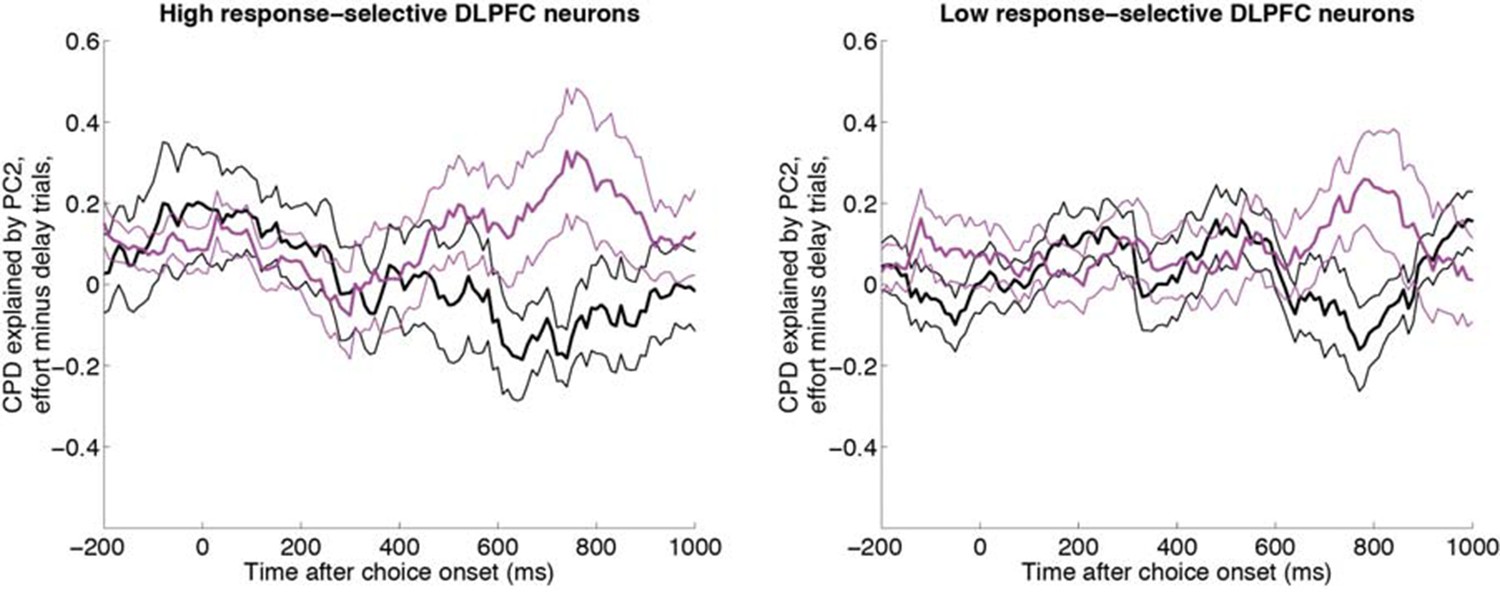
Same analysis as in Figure 5A, having first performed a median split for response-selectivity.
Both neurons with high response selectivity (left panel, n=62 DLPFC units) and neurons with low chosen value selectivity (right panel, n= 62 DLPFC units) show the effect found in Figure 5A.
Author response image 2
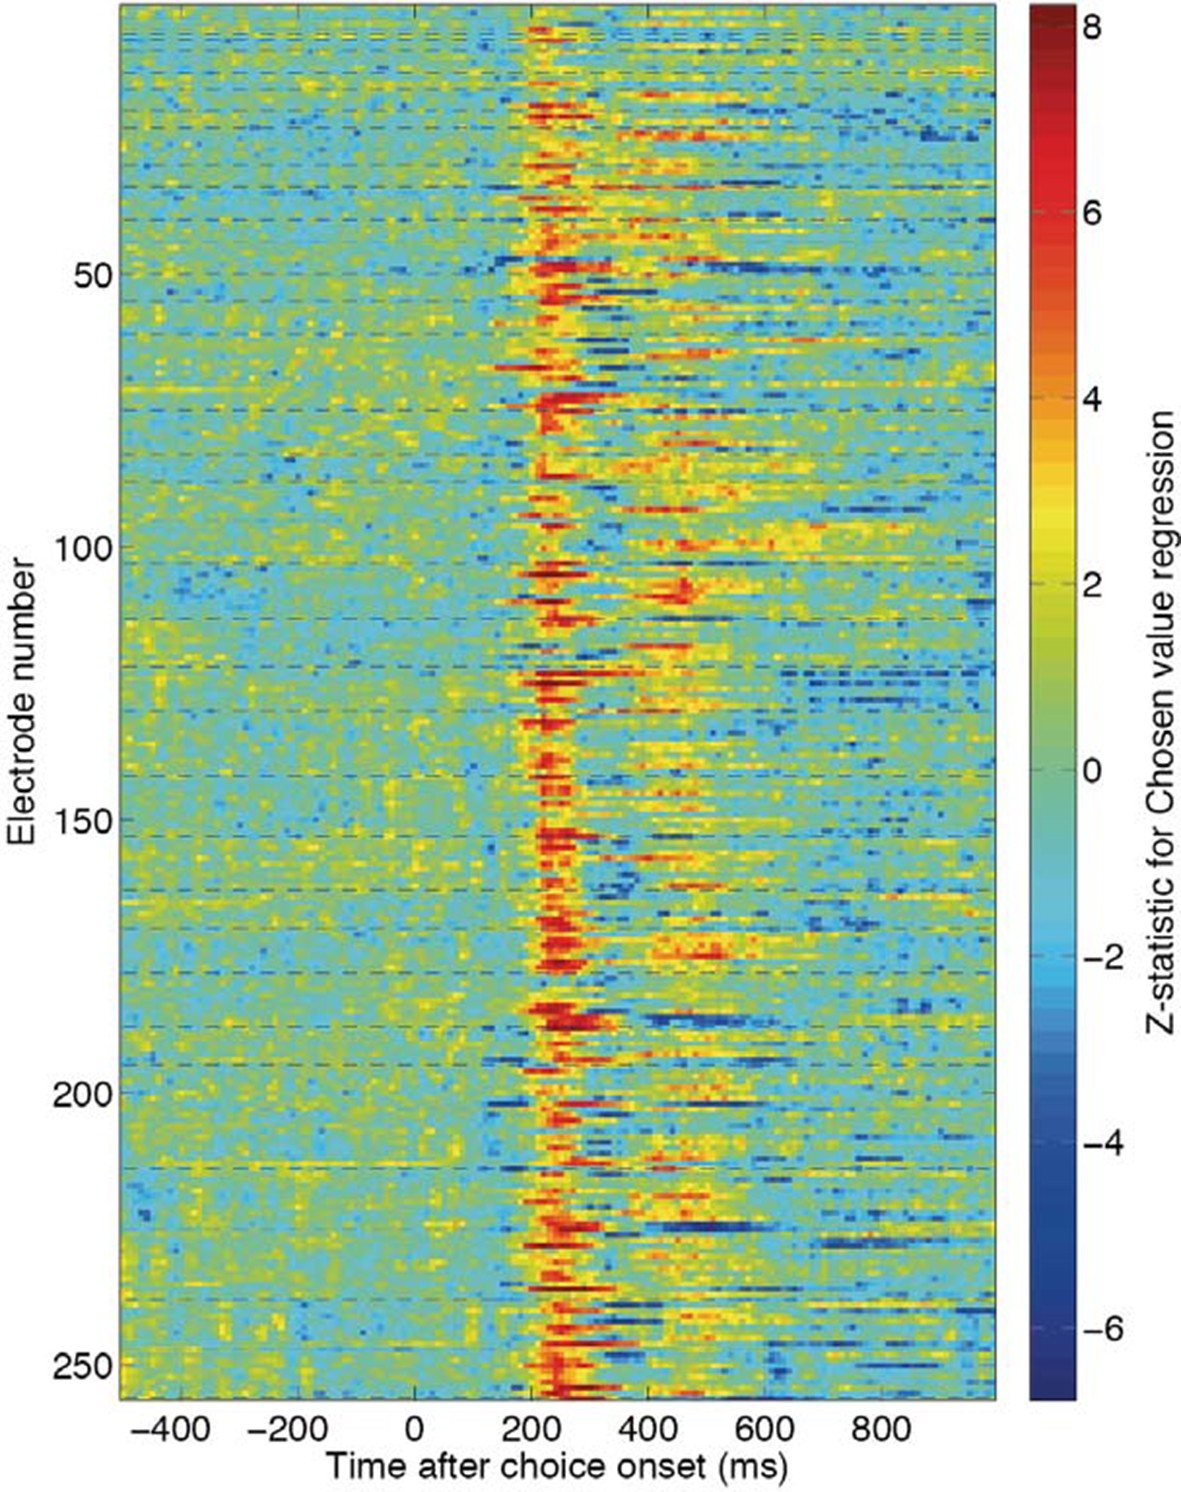
Chosen value Z-statistics for individual electrodes across the 40 recording sessions used to create Figure 1D and Figure 1—figure supplement 3.
Each dashed line reflects the beginning of a new recording session.
Author response image 3
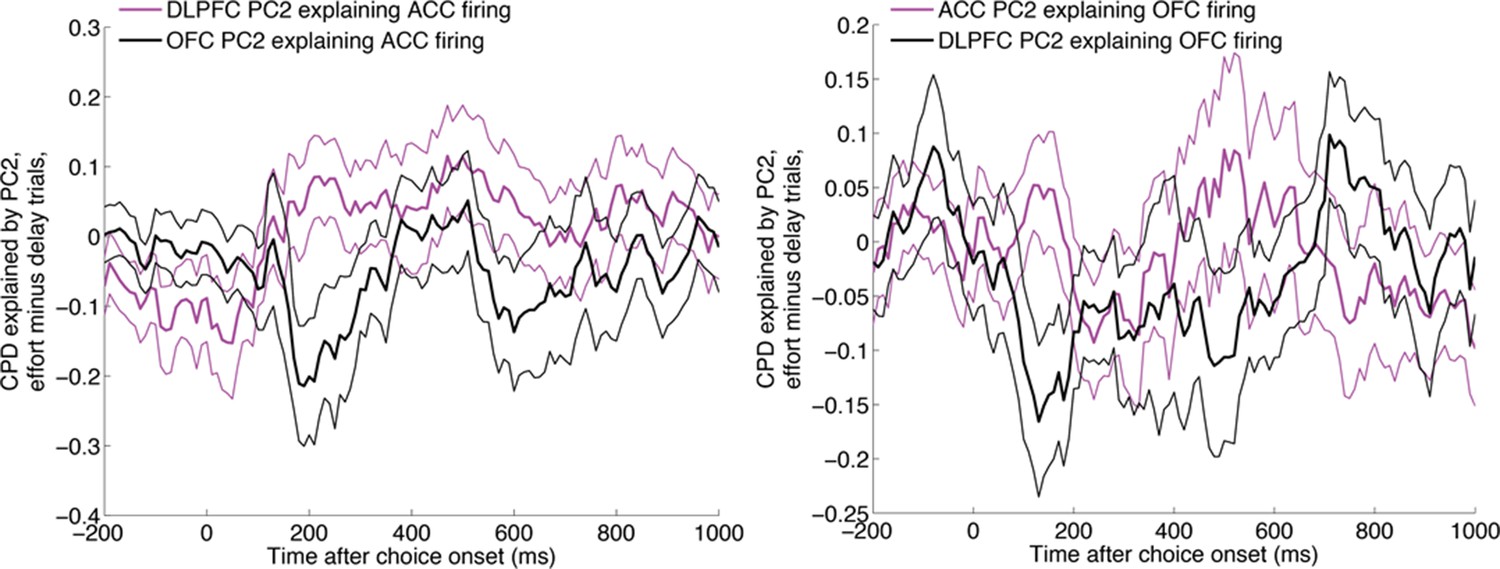
The same analysis as in main Figure 5, repeated with ACC firing being the dependent variable (left) and OFC firing being the dependent variable (right).
https://doi.org/10.7554/eLife.11945.026Additional files
-
Supplementary file 1
List of coregressors used when estimating contribution of LFP-derived PC2 to unit activity.
- https://doi.org/10.7554/eLife.11945.023
Download links
A two-part list of links to download the article, or parts of the article, in various formats.
Downloads (link to download the article as PDF)
Open citations (links to open the citations from this article in various online reference manager services)
Cite this article (links to download the citations from this article in formats compatible with various reference manager tools)
Capturing the temporal evolution of choice across prefrontal cortex
eLife 4:e11945.
https://doi.org/10.7554/eLife.11945


