TP53 copy number expansion is associated with the evolution of increased body size and an enhanced DNA damage response in elephants
- The University of Chicago, United States
- University of Nottingham, United Kingdom
- Weill Cornell Medical College, United States
- University of Nottingham UK, United Kingdom
Figures
Figure 1
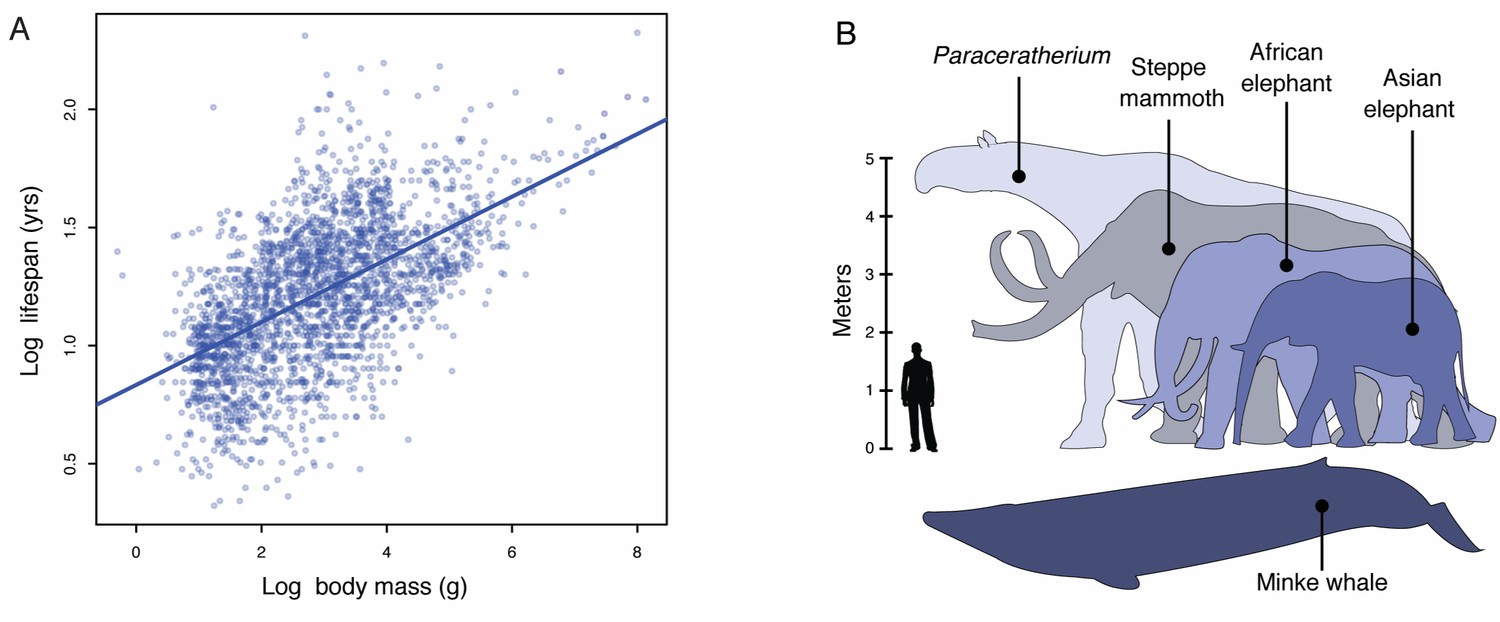
Body size evolution in vertebrates.
(A) Relationship between body mass (g) and lifespan (years) among 2556 vertebrates. Blue line shows the linear regression between log (body mass) and log (lifespan), R2 = 0.32. (B) Body size comparison between living (African and Asian elephants) and extinct (Steppe mammoth) Proboscideans, Cetaceans (Minke whale), and the extinct hornless rhinoceros Paraceratherium (‘Walter’), and humans.
Figure 2 with 1 supplement

Expansion of the TP53RTG gene repertoire in Proboscideans.
(A) TP53 copy number in 61 Sarcopterygian (Lobe-finned fish) genomes. Clade names are shown for lineages in which the genome encodes more than one TP53 gene or pseudogene. (B) Estimated TP53/TP53RTG copy number inferred from complete genome sequencing data (WGS, purple), 1:1 orthology (green), gene tree reconciliation (blue), and normalized read depth from genome sequencing data (red). Whiskers on normalized read depth copy number estimates show the 95% confidence interval of the estimate.
Figure 2—figure supplement 1

Reconciled TP53/TP53RTG gene trees.
Reconciled TP53RTG gene trees for Columbian mammoth, woolly mammoth, Asian elephant, and American mastodon.
Figure 3
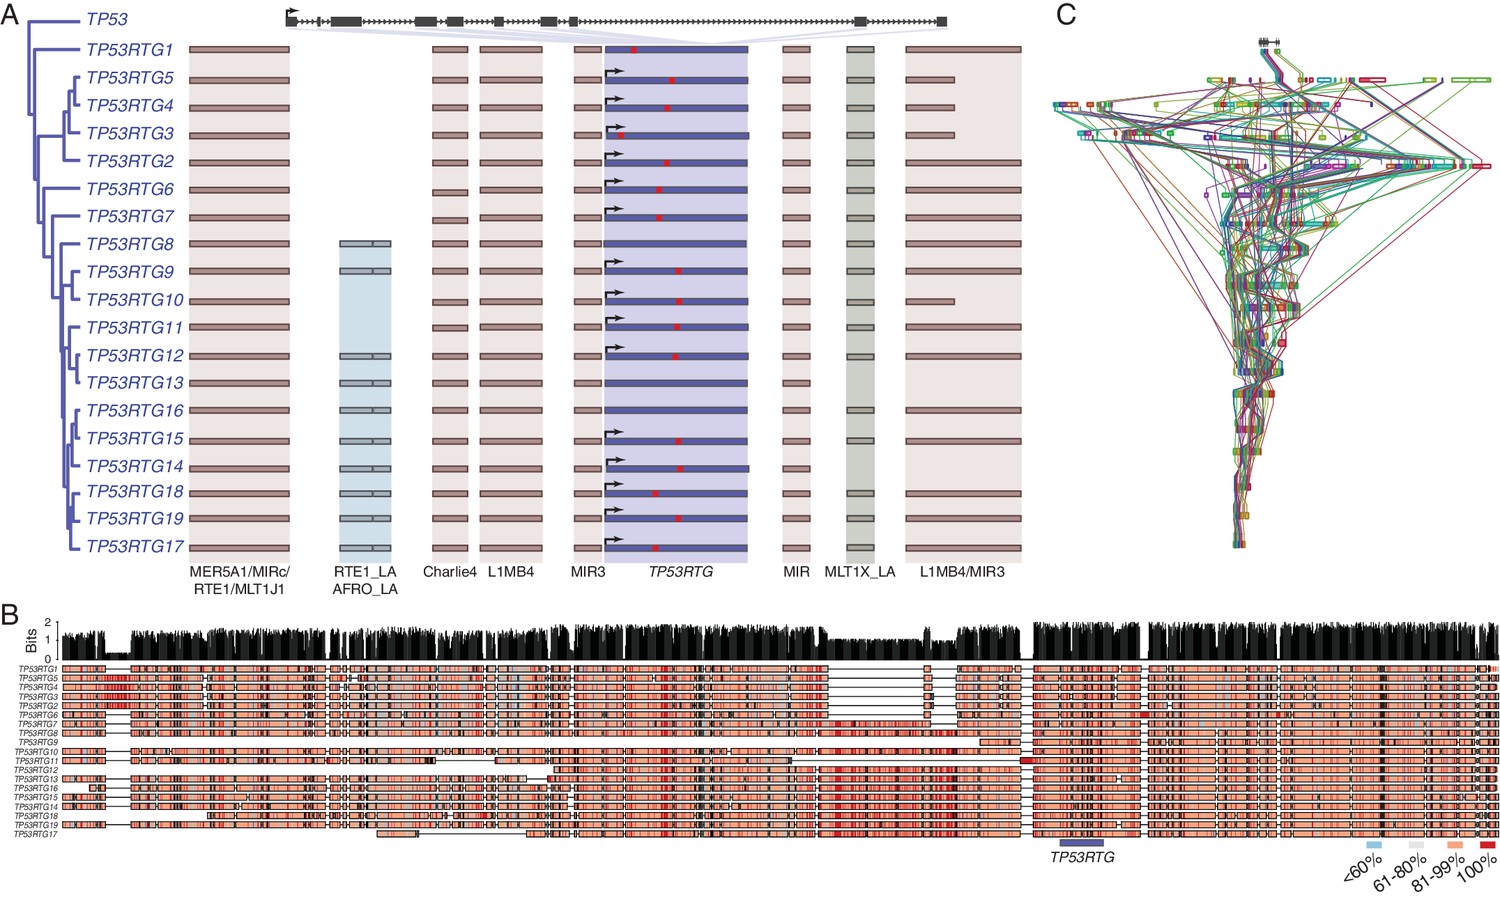
TP53RTG copy number increased through segmental duplications.
(A) Organization of the TP53 and TP53RTG loci in African elephant. The TP53/TP53RTG gene tree is shown at the left. The location of homologous transposable elements that flank the TP53RTG genes are shown and l Abegglen ed. TP53RTG genes with intact start codons are labeled with arrows, stop codons are shown in red. (B) Multiple sequence alignment (MUSCLE) of elephant TP53RTG containing contigs. The location of the TP53RTG genes is shown with a blue bar. Sites are color coded according to their conservation (see inset key). (C) ProgressiveMAUVE alignment of elephant TP53RTG containing contigs. Colored boxes shown the location of collinear blocks, lines connect homologous collinear blocks on different contigs.
Figure 4 with 1 supplement
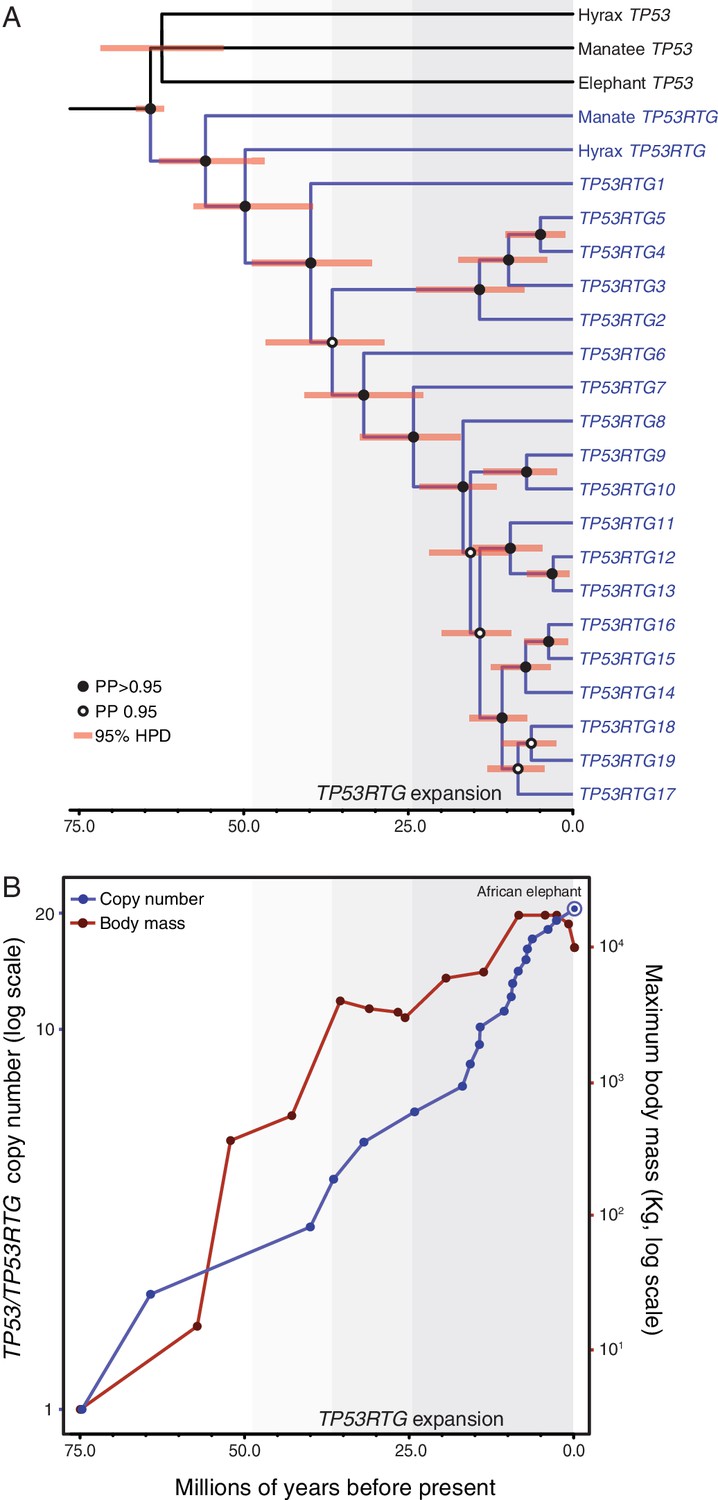
TP53RTG copy number is correlated with body size evolution in Proboscideans.
(A) Time calibrated Bayesian phylogeny of TP53/TP53RTG genes. TP53RTG genes are shown in blue, the 95% highest posterior density (HPD) of estimated divergence dates are shown as red bars, nodes with a posterior probability (PP)(PP) > 0.95 are labeled with closed circles whereas nodes with a PP ≤ 0.95.95 are labeled with open circles. The period corresponding to the expansion of the TP53RTG gene repertoire is shown in a grey. (B) TP53/TP53RTG copy number (blue) and Proboscidean body size (red) increases through time are correlated.
Figure 4—figure supplement 1
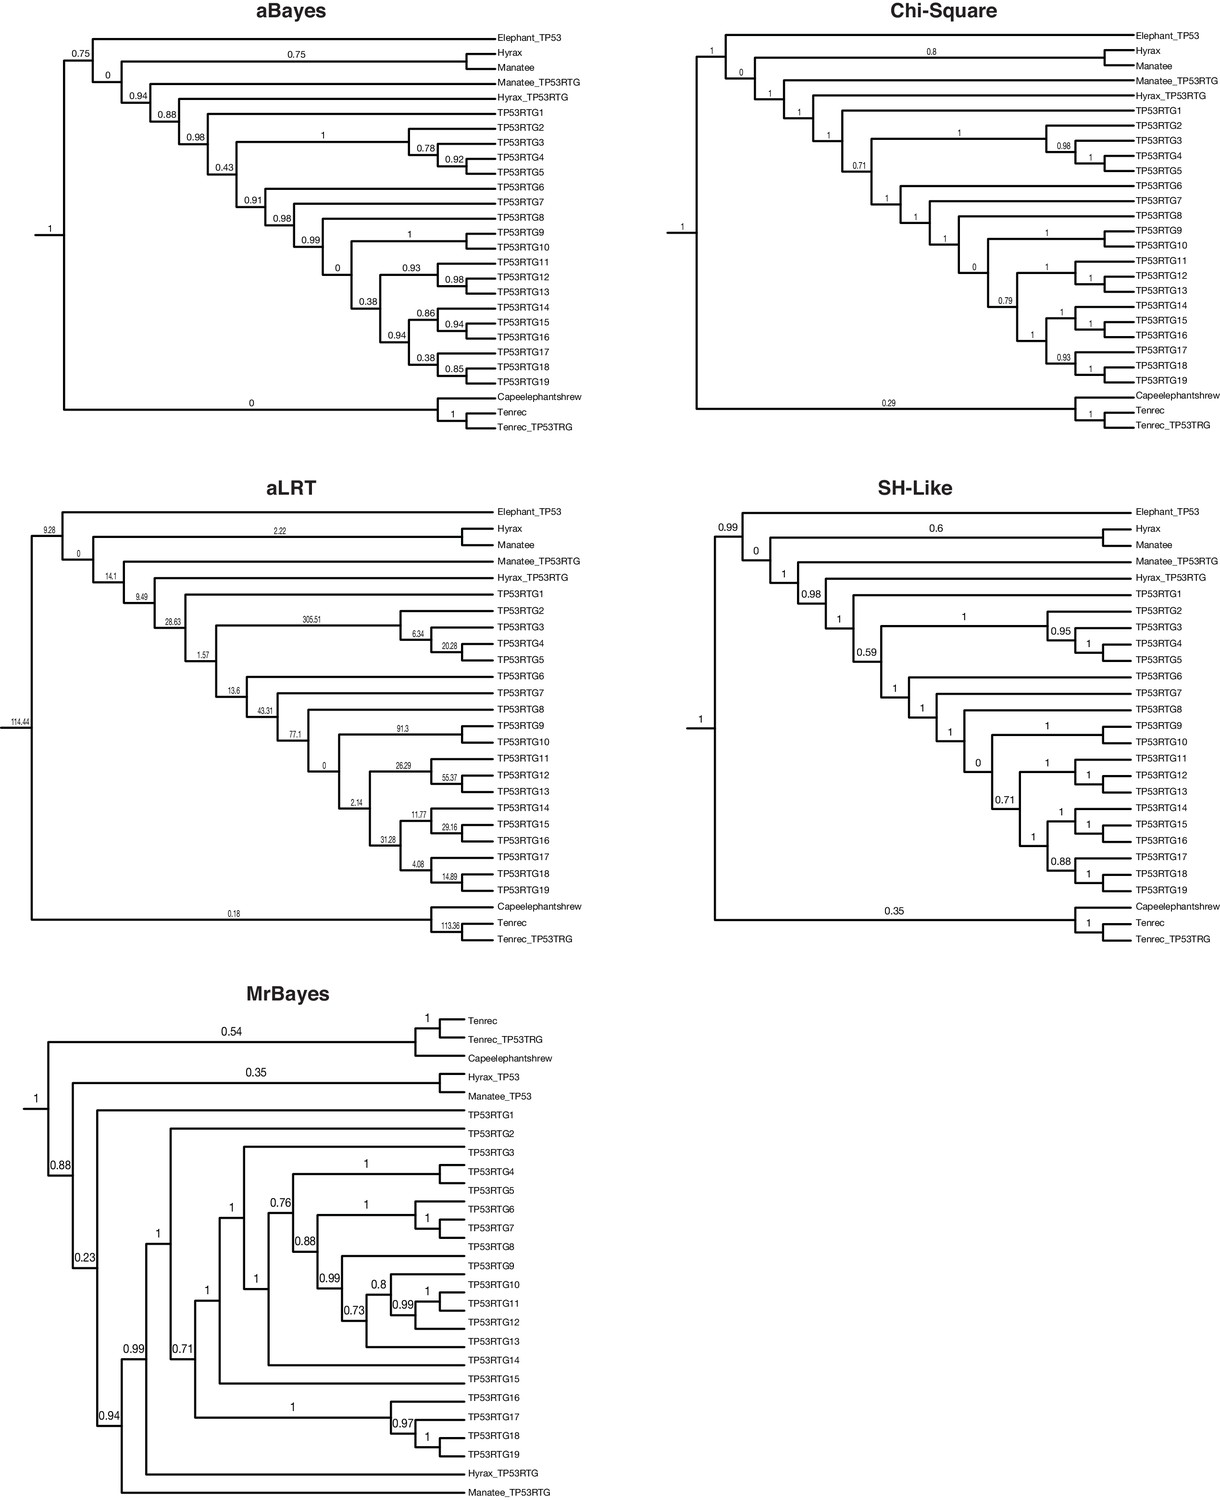
TP53/TP53RTG gene trees.
Maximum likelihood gene trees with aBayes, Chi-Square, aLRT, and SH-like branch supports. Bayesian tree inferred by MrBayes. Numbers along branches indicate node supports from each method. Note that the full dataset included 65 diverse species and only the Paeunngulate clade is shown. TP53 gene trees were inferred using a general time reversible model (GTR), empirical nucleotide frequencies (+F), a proportion of invariable sites estimated from the data (+I), four gamma distributed rate categories (+G), and using the best of NNI and SPR branch moves during the topology search (for the maximum likelihood tree).
Figure 5 with 2 supplements
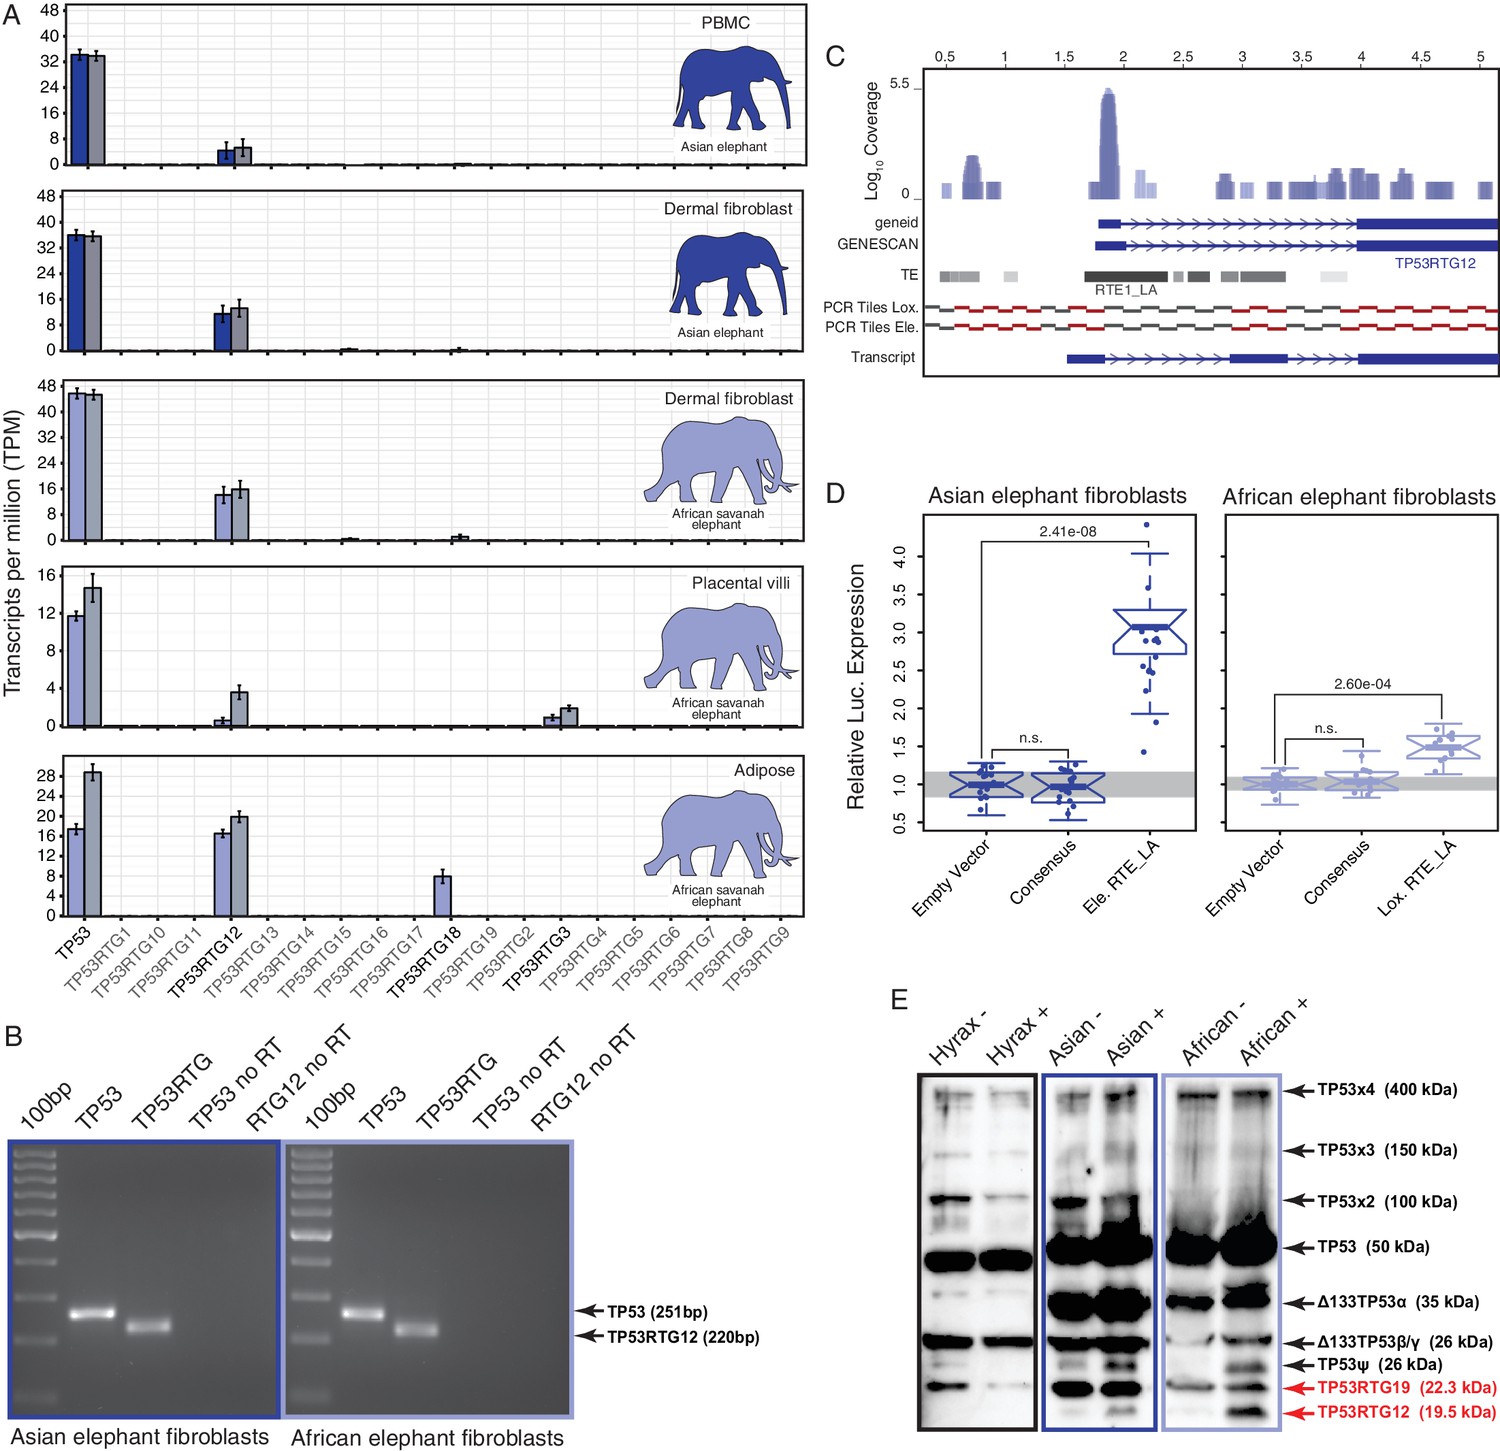
TP53RTG12 is transcribed and translated.
(A) Transcription of elephant TP53 and TP53RTG genes in dermal fibroblasts, white adipose, and placental villi. RNA-Seq data are shown as mean transcripts per million (TPM) with 95% confidence intervals of TPM value. Blue bars show TPM estimates from ‘end-to-end’ read mapping and gray bars shown ‘local’ read mapping. (B) qRT-PCR products generated Asian (left, blue sqaure) and African (right, light blue square) elephant fibroblast cDNA using primers specific to TP53 and TP53RTG12. cDNA was generated from DNaseI-treated RNA. No reverse transcriptase (no RT) controls for each qPCR reaction are shown, end point PCR products are shown. (C) Coverage of mapped reads from Asian (dark blue) and African (light blue) elephant fibroblast RNA-Seq data across the region of scaffold_885 encoding the TP53RTG12 gene. The location of TP53RTG12 exons predicted from geneid and GENESCAN are shown in blue introns are shown as lines with arrows indicating the direction of transcription. Gray bars show the location of transposable elements around the TP53RTG12 gene, darker gray indicates high sequence similarity to the consensus of each element. PCR tiles across this region are shown for African (Lox.) and Asian (Ele.) elephants, PCR primers generating amplicons are shown in red. The inferred TP53RTG12 transcript is shown below. one kb scale shown from position one of African elephant (Broad/loxAfr3) scaffold_825. (D) Relative luciferase (Luc.) expression in Asian and African fibroblasts transfected with either the promoterless pGL4.10[luc2] luciferase reporter vector (empty vector), pGL4.10 containing the RTE_LA consensus sequences (Consensus), pGL4.10 containing the RTE_LA from Asian elephant (Ele. RTE_LA), or pGL4.10 containing the RTE_LA from African elephant (Lox. RTE_LA). Results are shown as fold difference in Luc. expression standardized to empty vector and Renilla controls. n = 16, Wilcoxon P-values. (E) Western blot of total cell protein isolated from South African Rock hyrax, Asian elephant (Elephas), and African elephant (Loxodona) dermal fibroblasts. −, control cells. +, cells treated with 50 J/m2UV-C and the proteasome inhibitor MG-132. The name and predicted molecular weights of TP53 isoforms are shown.
Figure 5—figure supplement 1
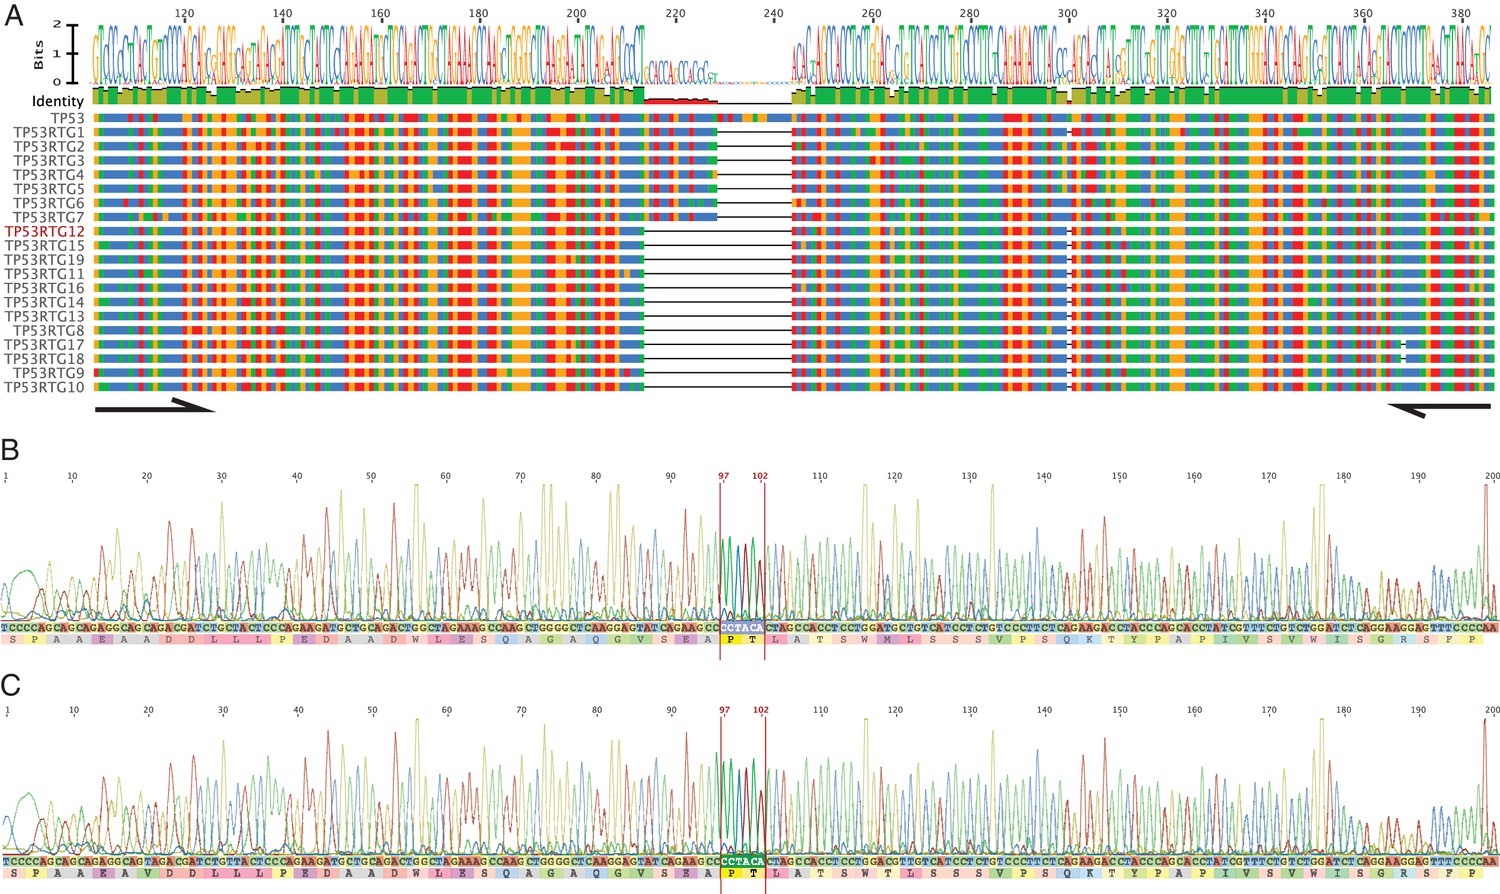
PCR and Sanger sequencing confirm TP53RTG12 is transcribed in elephant fibroblasts.
(A) Multiple sequence alignment (MSA) of African elephant TP53 and TP53RTG1-TP53RTG19. Numbering (shown at top) is relative to the canonical TP53 transcript in African elephant (ENSLAFT00000007484), sequence conservation in this region is shown in Bits, as a logo, and percent identity (green, 100% identity of paralogs; yellow, < 100% identity of paralogs). Bases in each gene are color-coded (blue, C; red, A; yellow, G; and T, green). The TP53RTG-specific deletion is shown as a black line, and the location of the PCR primers than span the deletion are shown as arrows. (B) Chromatogram from Sanger sequencing of the TP53RTG12 qRT-PCR amplicon confirm the TP53RTG12 is transcribed in African elephant fibroblasts. Bases that flank the TP53RTG-specific deletion are highlighted in red. (C) Chromatogram from Sanger sequencing of the TP53RTG12 qRT-PCR amplicon confirm the TP53RTG12 is transcribed in Asian elephant fibroblasts. Bases that flank the TP53RTG-specific deletion are highlighted in red.
Figure 5—figure supplement 2
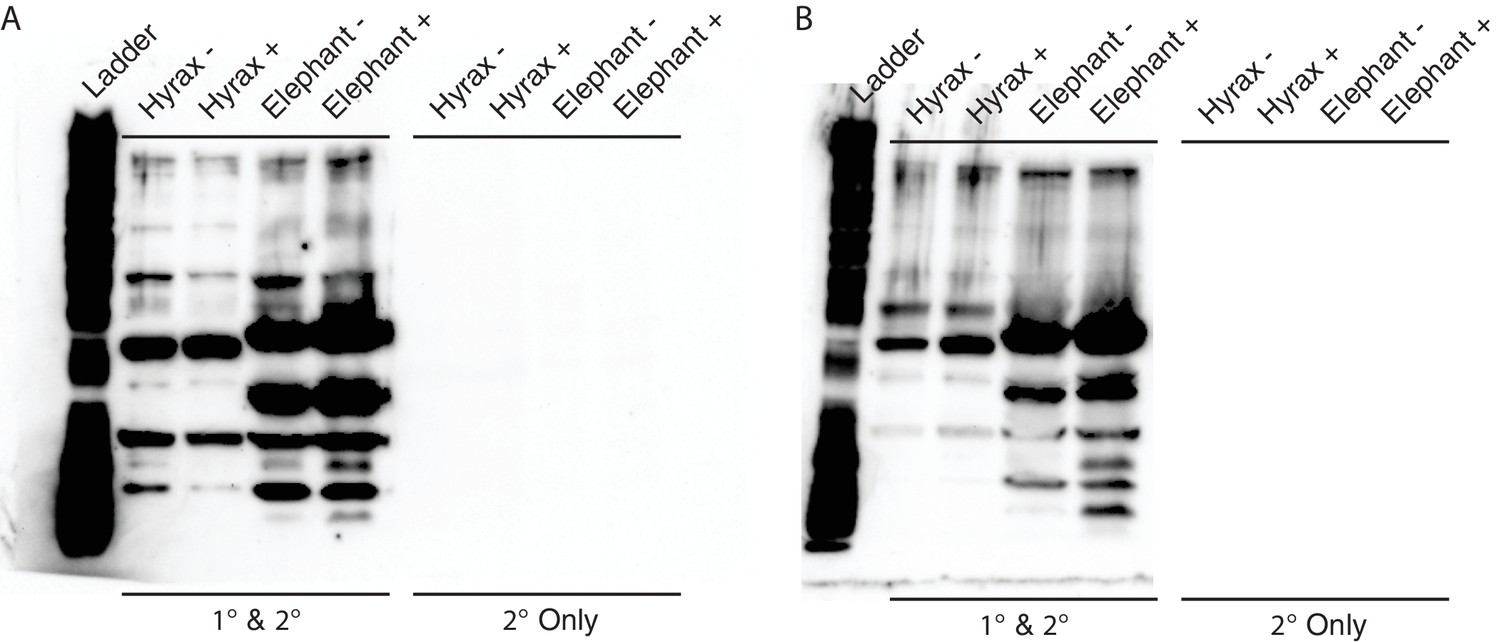
Unedited Western blots shown in Figure 5E.
(A) Western blot of total cell protein isolated from African elephant and hyrax fibroblasts. −, control cells. +, cells treated with 50 J/m2UV-C and MG-132. 1° and 2°, probed with primary antibody against TP53 and secondary HRP conjugated antibody. 2° only, probed only with secondary HRP conjugated antibody (B) Western blot of total cell protein isolated from Asian elephant and hyrax fibroblasts. −, control cells. +, cells treated with 50 J/m2UV-C and MG-132. 1° and 2°, probed with primary antibody against TP53 and secondary HRP conjugated antibody. 2° only, probed only with secondary HRP conjugated antibody
Figure 6
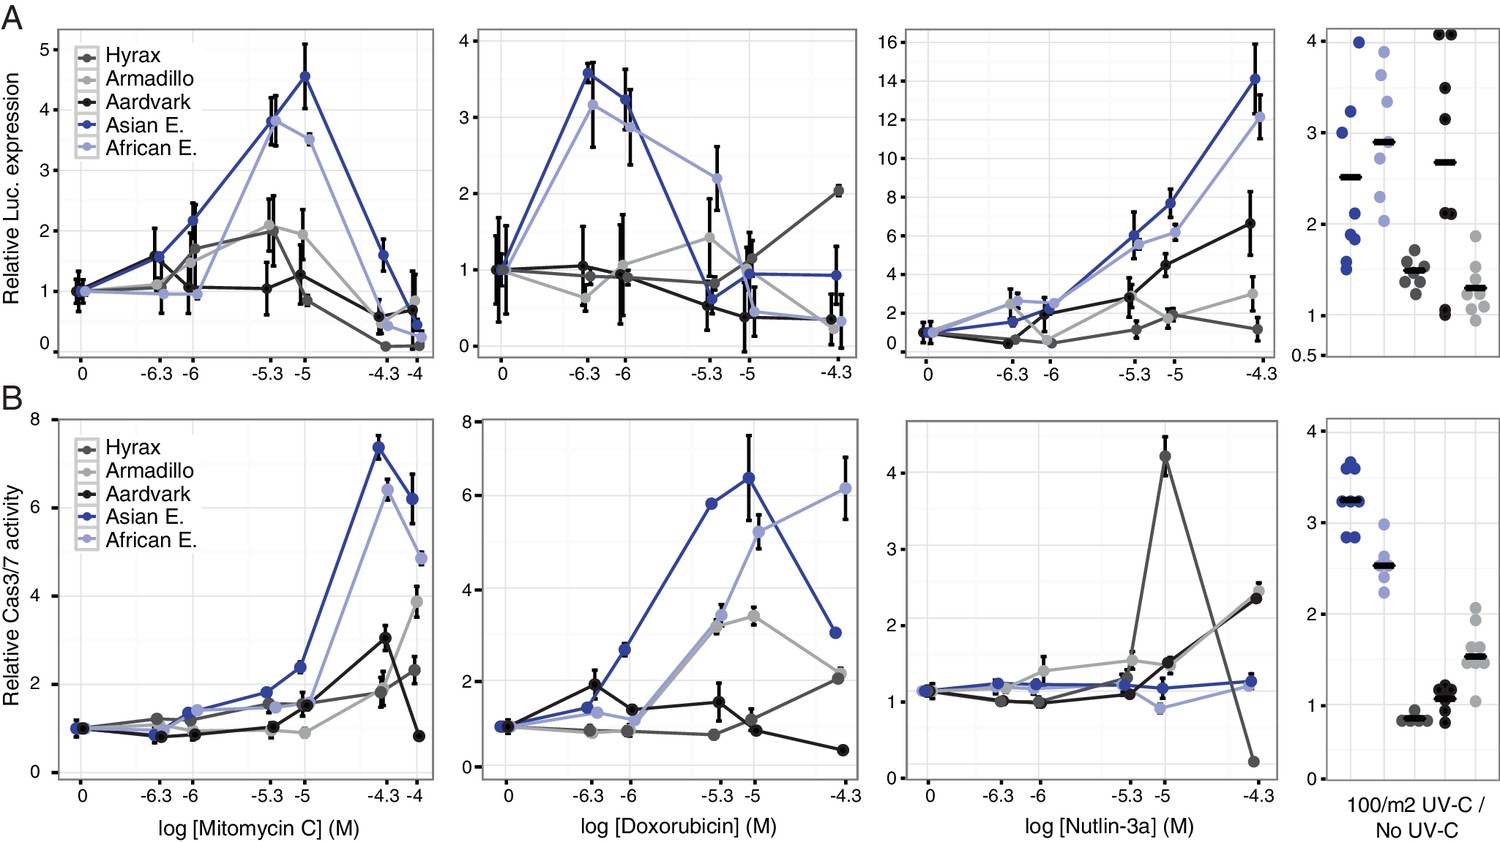
Elephant cells have enhanced TP53 signaling and are hyper-responsive to DNA damage.
(A) Relative luciferase (Luc.) expression in African elephant, Asian elephant, hyrax, aardvark, and armadillo fibroblasts transfected with the pGL4.38[luc2p/p53 RE/Hygro] reporter vector and treated with either mitomycin c, doxorubicin, nutlin-3a, or UV-C. Data are shown as fold difference in Luc. expression 18 hr after treatment standardized to species paired empty vector and Renilla controls. n = 12, mean±SD. (B) Relative capsase-3/7 (Cas3/7) activity in African elephant, Asian elephant, hyrax, aardvark, and armadillo treated with either mitomycin c, doxorubicin, nutlin-3a, or UV-C. Data are shown as fold difference in Cas3/7 activity 18 hr after treatment standardized to species paired untreated controls. n = 12, mean±SD.
Figure 7
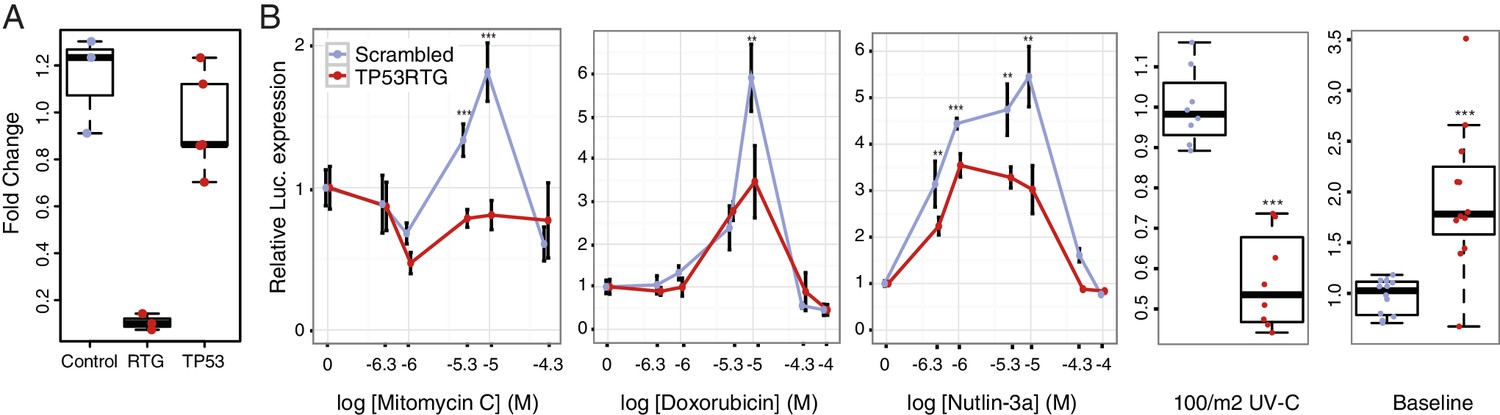
TP53RTG genes are required for enhanced TP53 signaling and DNA-damage responses.
(A) Expression of TP53RTG and TP53 transcripts in African elephant fibroblasts treated with an siRNA to knockdown the expression of TP53RTG genes (red) or a scrambled (Control) siRNA (blue). Results are shown as fold-change in TP53RTG and TP53 transcript abundance relative to transcript abundance in scrambled siRNA control cells. The TP53RTG siRNA efficiently reduces the expression of TP53RTG transcripts, but does not reduce the expression of TP53 transcripts. (B) Relative luciferase (Luc.) expression in African elephant fibroblasts transfected with the pGL4.38[luc2p/p53 RE/Hygro] reporter vector and treated with an siRNA to knockdown the expression of TP53RTG genes (red) or a scrambled (negative control) siRNA (blue), and treated with either mitomycin c, doxorubicin, nutlin-3a, or UV-C. Data is shown as fold difference in Luc. expression 18 hr after treatment standardized to Renilla controls and no treatment. n > 4, mean±SD. **, Wilcoxon p>0.01. ***, Wilcoxon p>0.001.
Figure 8
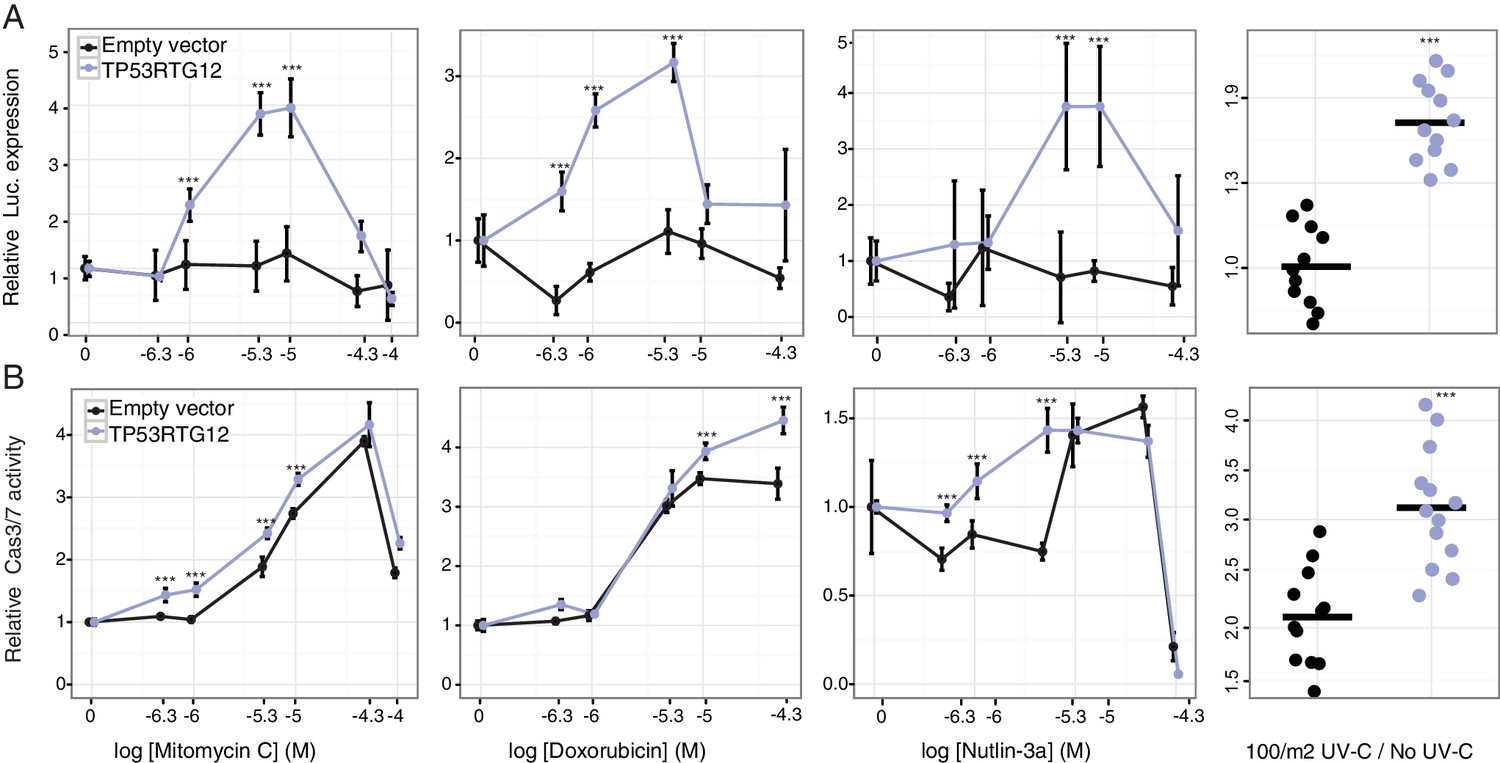
TP53RTG12 enhances TP53 signaling and DNA-damage responses.
(A) Relative luciferase (Luc.) expression in mouse 3T3-L1 cells co-transfected with either the pGL4.38[luc2P/p53 RE/Hygro] Luc. reporter vector, TP53RTG12 pcDNA3.1(+)/myc-His expression vector, or empty pcDNA3.1(+)/myc-His and treated with either mitomycin c, doxorubicin, nutlin-3a, or UV-C. Data is shown as fold difference in Luc. expression 18 hr after treatment standardized to cells transfected with only pGL4.38[luc2P/p53 RE/Hygro] and Renilla controls. n = 12, mean±SD. ***, Wilcoxon p>0.001. (B) Relative capsase-3/7 (Cas3/7) activity in mouse 3T3-L1 cells transfected with either the TP53RTG12 pcDNA3.1(+)/myc-His expression vector or empty pcDNA3.1(+)/myc-His and treated with either mitomycin c, doxorubicin, nutlin-3a, or UV-C. Data is shown as fold difference in Cas3/7 activity 18 hr after treatment standardized to mock transfected. n = 12, mean±SD. ***, Wilcoxon p>0.001.
Figure 9
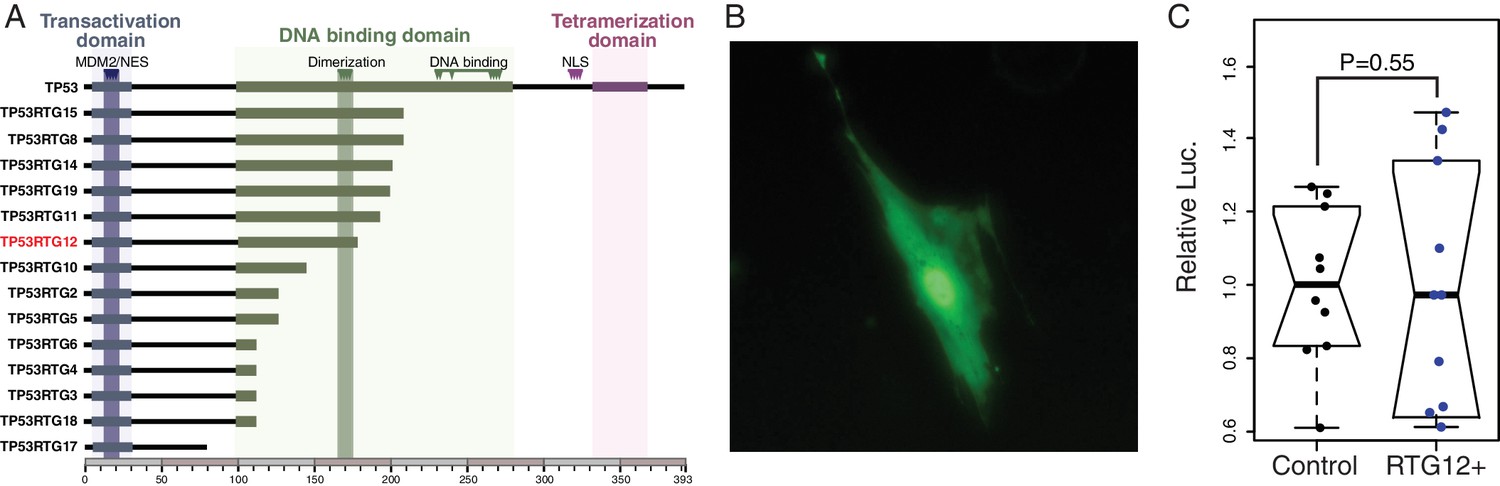
TP53RTG proteins are unlikely to directly regulate TP53 target genes.
(A) Domain structure of TP53 and TP53RTG proteins. (B) Localization of TP53RTG12-GFP in African elephant fibroblasts. (C) Relative luciferase (Luc.) expression in African elephant fibroblasts transfected with co-transfected with either the TP53RTG12 pcDNA3.1(+)/myc-His expression vector and the pGL4.38[luc2P/p53 RE/Hygro] luciferase reporter vector, or empty pcDNA3.1(+)/myc-His and the pGL4.38[luc2P/p53 RE/Hygro] luciferase reporter vector. Data are shown as fold difference in Luc. expression 48 hr after transfection standardized to Renilla and cells transfected with pcDNA3.1(+)/myc-His and pGL4.38[luc2P/p53 RE/Hygro]. n = 10.
Figure 10 with 1 supplement
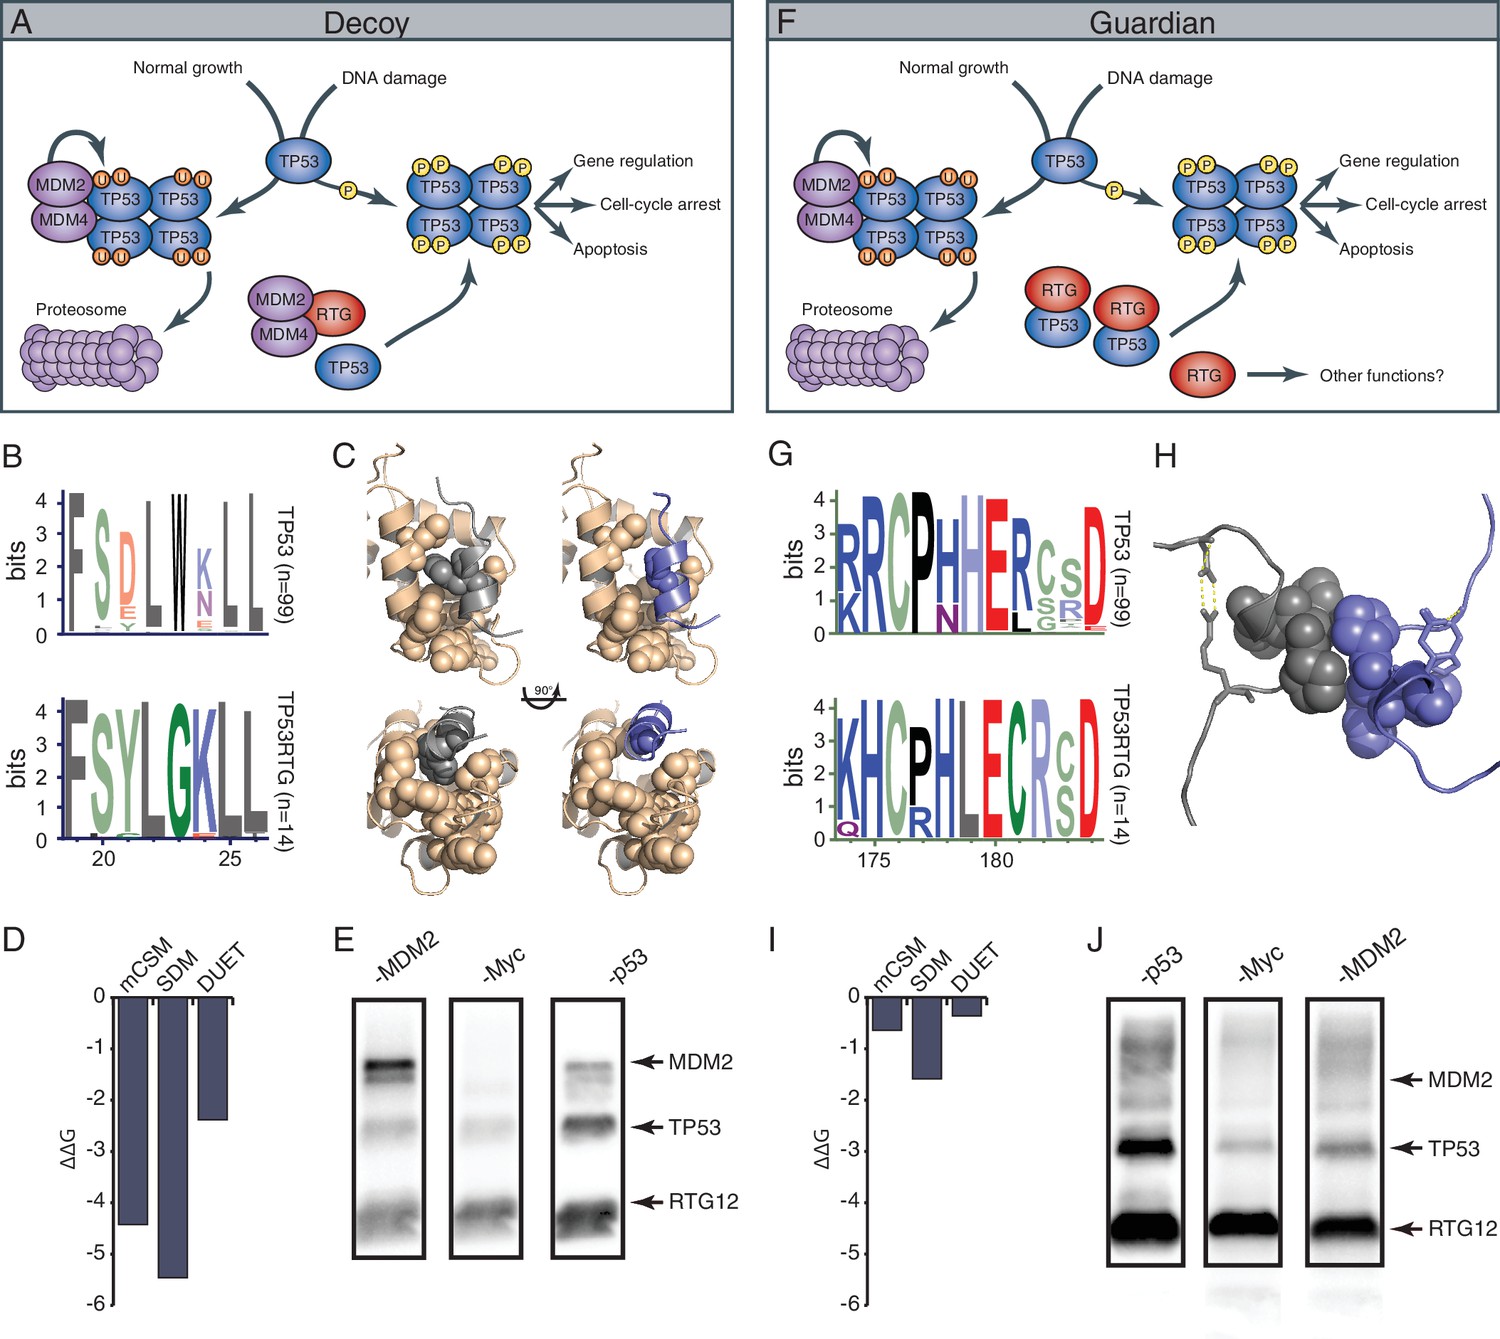
TP53RTG12 interacts with TP53 but not MDM2.
(A) Decoy model of TP53RTG12 function. Under normal conditions TP53 is negatively regulated by the MDM complex which ubiquitinates TP53 tetramers leading to proteosomal degradation. Upon DNA damage TP53 is phosphorylated, preventing interaction with the MDM complex and activating downstream TP53 signaling. In elephant cells TP53RTG12 may dimerize with the MDM2 complex, allowing TP53 to escape negative regulation. (B) Logo of the MDM2 interaction motif from 99 mammalian TP53 proteins (upper) and TP53RTG proteins (lower). (C) Structure model of the MDM2/TP53 (left) and MDM2/TP53RTG12 (right) interaction. MDM2 is shown in tan with hydrophobic residues that mediate the interaction with TP53 as spheres, TP53 in gray with W23 as a sphere, and TP53RTG12 shown in blue with G23 as a sphere. (D) Predicted effects of the W23G substitution (ΔΔG) on the stability of the MDM2/TP53RTG12 interaction estimated with mCSM, SDM, and DUET. (E) HEK-293 cells were transiently transfected with the TP53RTG12 pcDNA3.1(+)/myc-His expression vector and total cell protein immunoprecipitated with an α-MDM2 antibody. Co-immunoprecipitation of Myc-tagged TP53RTG12 and TP53 were assayed by Western blotting with α-Myc, α-TP53, and α-MDM2 antibodies after chemically stripping the blot, respectively. Although TP53 was co-immunoprecipitated, Myc-tagged TP53RTG12 was not. (F) Rather than interfering with the interaction between the MDM complex and TP53 as in the ‘Decoy” model, TP53RTG12 may dimerize with canonical TP53 and block formation of TP53 tetramers. These TP53RTG12/TP53 dimers cannot be ubiquitinated generating a pool of TP53 proteins to rapidly respond to lower levels or DNA damage and stress than other species. (G) Logo of the dimerization domain of TP53 from 99 mammals (upper) and TP53RTG proteins (lower). (H) Model of the TP53/TP53RTG12 interaction. Residues critical for dimerization are shown as spheres, note sites involved in dimerization are conserved in TP53RTG proteins. (I) Predicted effects of the W23G substitution (ΔΔG) on the stability of the MDM2/TP53RTG12 interaction estimated with mCSM, SDM, and DUET. (J) HEK-293 cells were transiently transfected with the TP53RTG12 pcDNA3.1(+)/myc-His expression vector and total cell protein immunoprecipitated with an α-Myc antibody. Co-immunoprecipitation of TP53 and MDM2 were assayed by serial Western blotting with α-Myc, α-TP53, and α-MDM2 antibodies after chemically stripping the blot, respectively.
Figure 10—figure supplement 1
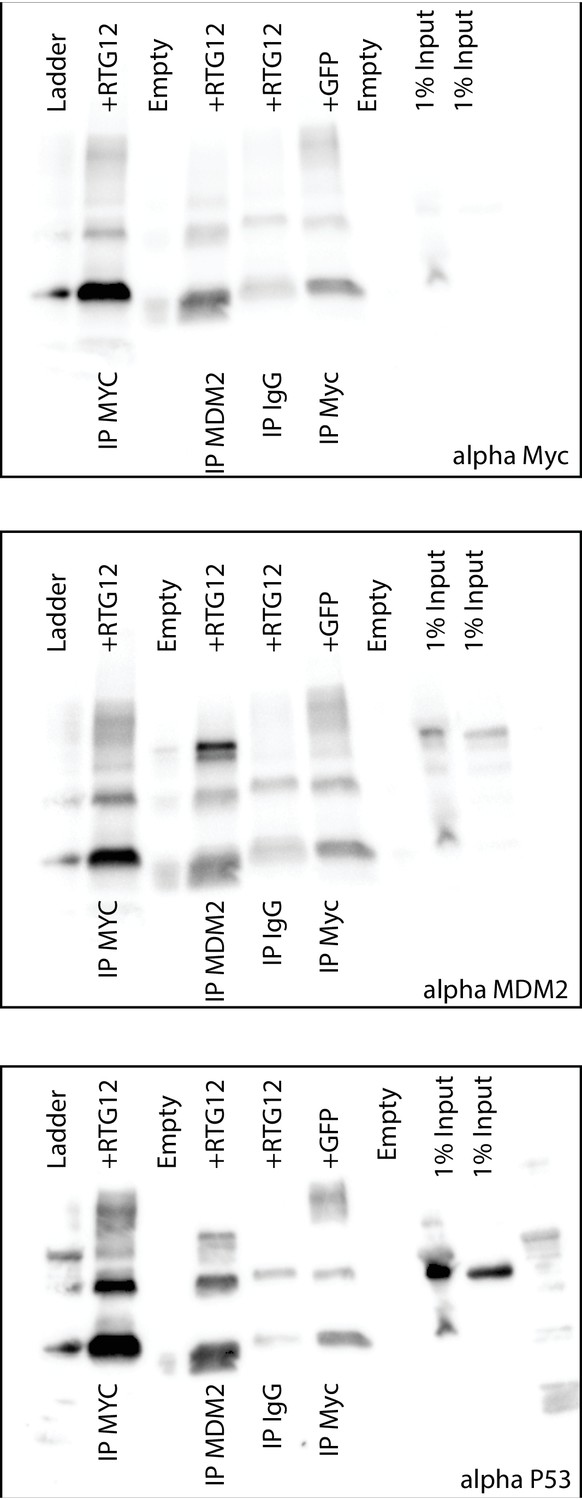
Uncropped Western blots shown in Figure 8B.
HEK-293 cells were transiently transfected with the TP53RTG12 pcDNA3.1(+)/myc-His expression vector and total cell protein immunoprecipitated with either an α-Myc (IP: RTG12-Myc) or α-MDM2 (IP: MDM2) antibody. Co-immunoprecipitation of Myc-tagged TP53RTG12, TP53, or MDM2 were assayed by Western blotting with α-Myc, α-TP53, and α-MDM2 antibodies respectively.
Tables
Table 1
Summary information for African elephant TP53/TP53RTG genes.
Gene Id | ENSEMBL Id | Scaffold (loxAfr3) | Chromosome (loxAfr4) | Coding potential | ORF size |
|---|---|---|---|---|---|
TP53 | ENSLAFG00000007483 | 47 | Chr 11 | Yes | 392aa |
TP53RTG1 | ENSLAFG00000025553 | 175 | Unmapped | No | N/A |
TP53RTG2 | N/A | 217 | Unmapped | Yes | 134aa |
TP53RTG3 | ENSLAFG00000027474 | 406 | Unmapped | Yes | 79aa |
TP53RTG4 | N/A | 627 | Unmapped | Yes | 134aa |
TP53RTG5 | ENSLAFG00000027348 | 221 | Unmapped | Yes | 162aa |
TP53RTG6 | N/A | 76 | Chr 27 | Yes | 123aa |
TP53RTG7 | N/A | 208 | Unmapped | No | N/A |
TP53RTG8 | ENSLAFG00000027820 | 294 | Unmapped | Yes | 210aa |
TP53RTG9 | ENSLAFG00000027669 | 786 | Unmapped | No | N/A |
TP53RTG10 | ENSLAFG00000030555 | 221 | Unmapped | Yes | 210aa |
TP53RTG11 | N/A | 281 | Yes | 203aa | |
TP53RTG12 | ENSLAFG00000028299 | 825 | Unmapped | Yes | 180aa |
TP53RTG13 | ENSLAFG00000032042 | 458 | Unmapped | No | N/A |
TP53RTG14 | ENSLAFG00000026238 | 928 | Unmapped | Yes | 210aa |
TP53RTG15 | ENSLAFG00000027365 | 656 | Unmapped | Yes | 210aa |
TP53RTG16 | ENSLAFG00000030880 | 378 | Unmapped | No | N/A |
TP53RTG17 | ENSLAFG00000028692 | 552 | Unmapped | Yes | 111aa |
TP53RTG18 | N/A | 498 | Unmapped | Yes | 111aa |
TP53RTG19 | ENSLAFG00000032258 | 342 | Unmapped | Yes | 210aa |
Download links
A two-part list of links to download the article, or parts of the article, in various formats.
Downloads (link to download the article as PDF)
Open citations (links to open the citations from this article in various online reference manager services)
Cite this article (links to download the citations from this article in formats compatible with various reference manager tools)
TP53 copy number expansion is associated with the evolution of increased body size and an enhanced DNA damage response in elephants
eLife 5:e11994.
https://doi.org/10.7554/eLife.11994


