Regulatory polymorphisms modulate the expression of HLA class II molecules and promote autoimmunity
- University of Texas Southwestern Medical Center, United States
- Shri Mata Vaishno Devi University, India
- Yale School of Medicine, United States
- Oklahoma Medical Research Foundation, United States
- Université catholique de Louvain, Belgium
- Penn State Medical School, United States
- Texas Scottish Rite Hospital for Children, United States
- Cincinnati VA Medical Center, United States
- Cincinnati Children's Hospital Medical Center, United States
- University of Southern California, United States
- University of California, Los Angeles, United States
Figures
Figure 1
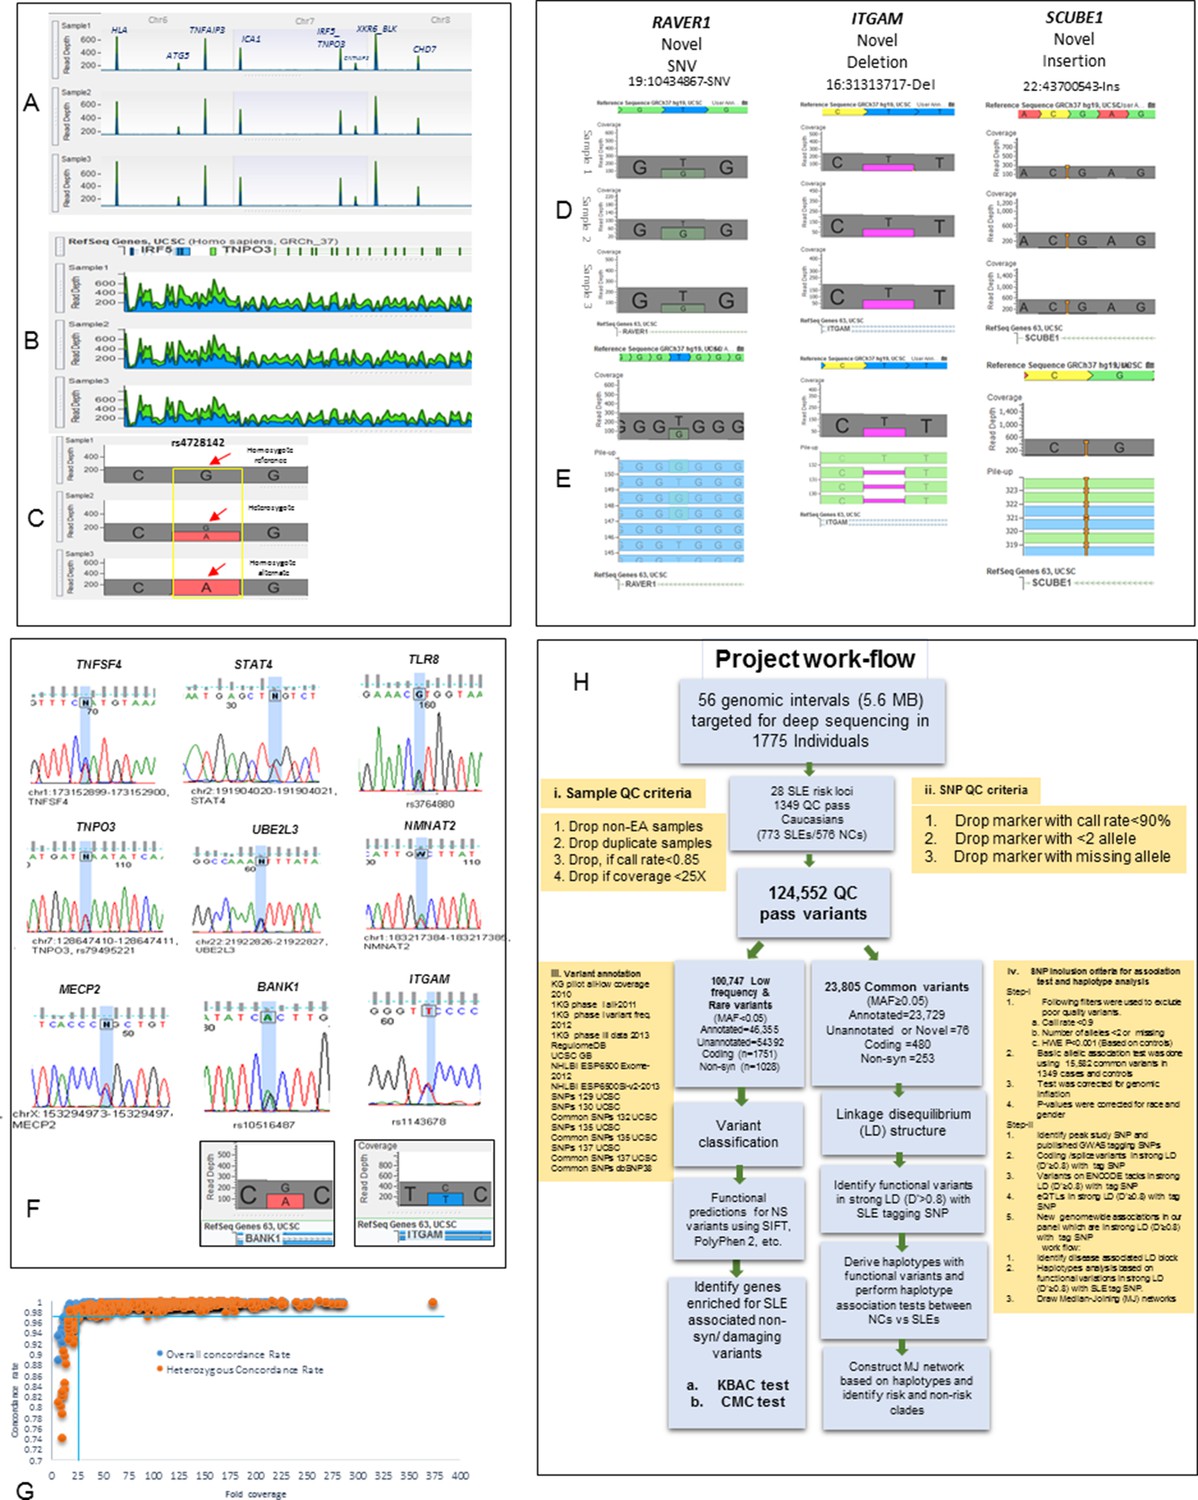
Sequencing quality metrics and work flow pipeline.
(A) Depth of sequence reads across chromosomes 6, 7 and 8 for three samples, illustrating enrichment efficiency for targeted regions. (B) Zoom in read depth analysis of IRF5-TNPO3 gene region (~228 Kb) for three different samples. (C) Genotype calls for a SNP in IRF5 illustrating read depth across a typical variant position. (D) Examples of data used to genotype a novel SNV in RAVER1, a novel deletion in ITGAM and a novel insertion in SCUBE1 gene. (E) The distribution of variant calls in forward and reverse sequencing reads. (F) About 35 SNPs from various targeted genes were confirmed by Sanger sequencing. Sanger sequencing results were further validated by calculating read depths for reference and alternate alleles in heterozygous samples, as shown for ITGAM and BANK1. (G) This figure compares fold coverage versus SNP concordance rate for a subset of samples that were both sequenced and genotyped with the Immunochip.v1 SNP array. (H) A diagram of the work flow pipeline for bioinformatics analysis of the sequencing data including quantitative information for the number of variants passing filters at each step.
Figure 2

Principal component analysis (PCA) and variant summary.
(A) Principal component analysis (PCA), showing clustering of study cohort (orange points) with the CEU (blue points) HAPMAP reference group for Caucasians. (B) (i) Pie chart showing percentages of annotated and unannotated variants in common (MAF≥0.05) and low frequency (MAF<0.05) categories. (B) (ii) Pie chart showing percentages of potentially functional single nucleotide variants (SNVs) and structural variants (InDels) defined by ENCODE and eQTL data. (B) (iii) Pie chart showing the distribution of variants in various genomic regions and percentage of potential functional variants in each. (B) (iv) Pie chart showing classification of coding variants into various sub-categories. (C) (i) Pie chart showing classification of common frequency coding/splice variants. (C) (ii) Pie chart showing percentages of ENCODE and/or eQTL defined potentially functional common regulatory variants. (C) (iii) Pie chart showing the percentages of un-annotated or novel SNVs and InDels with potentially functional annotations.
Figure 3
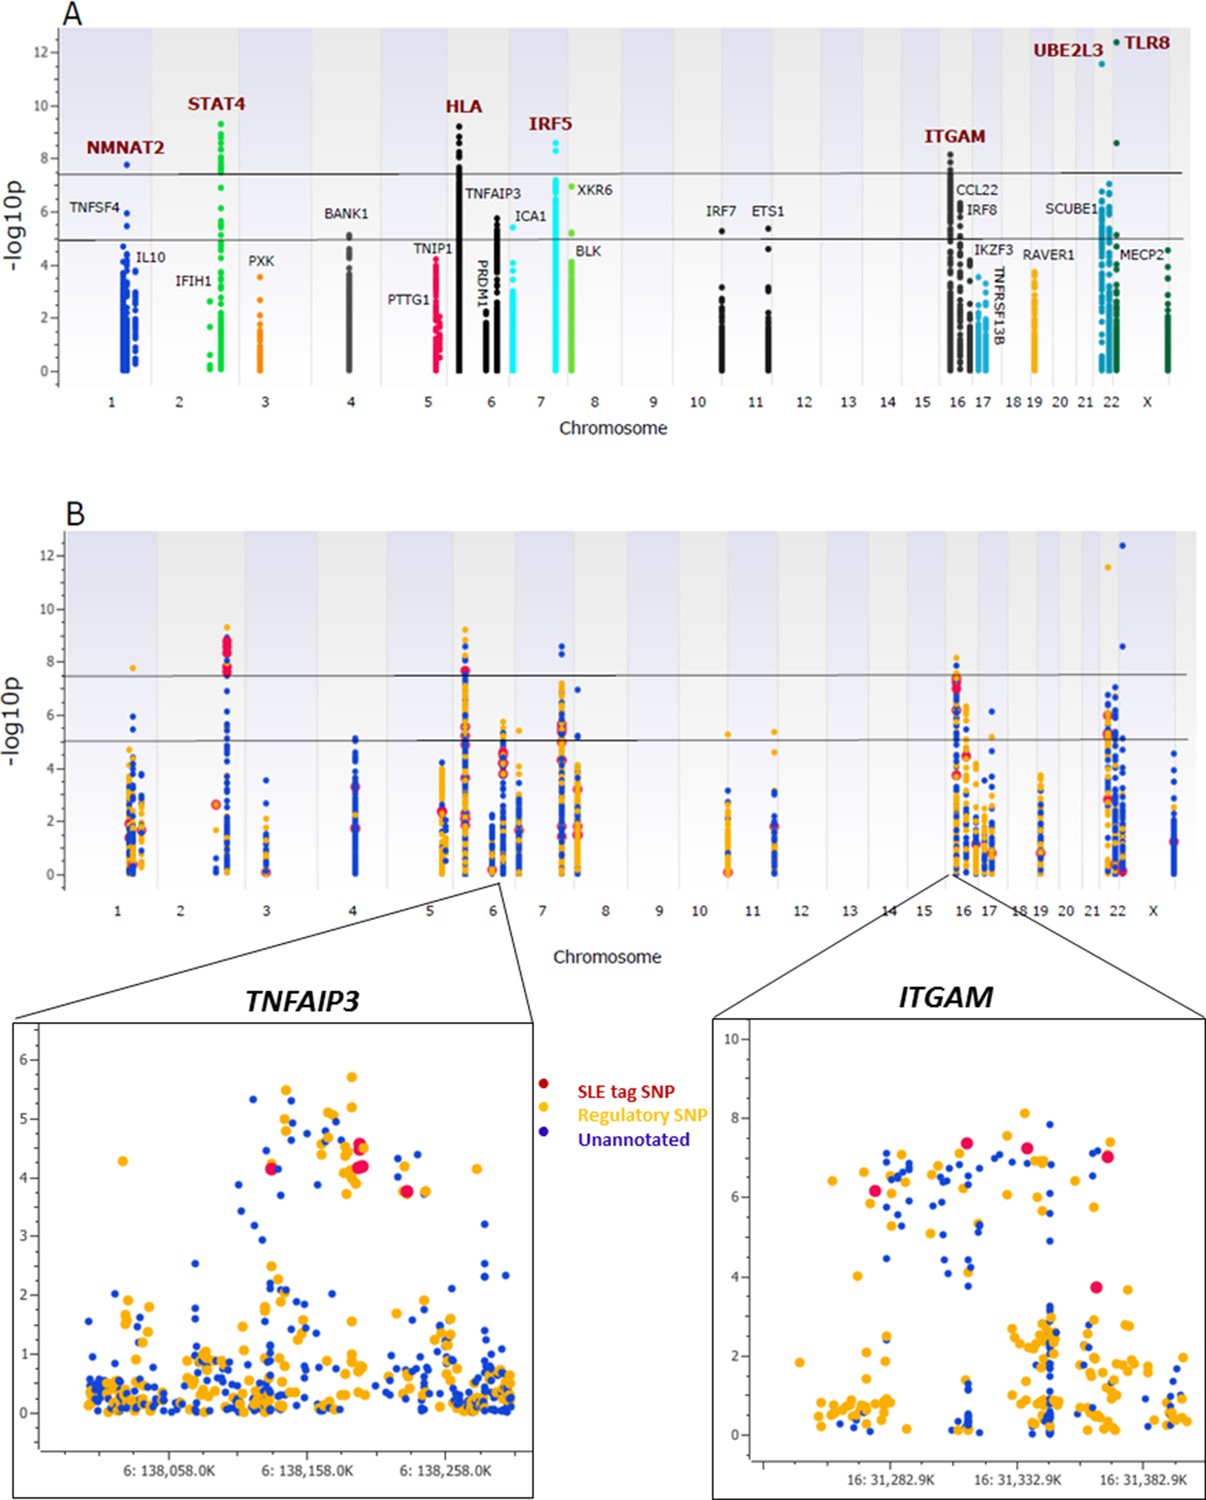
Association analysis of sequencing variants from 28 SLE risk loci.
(A) Manhattan plot of 15582 common variants (MAF>0.05) plotting –log10 p-value of SLE association (y-axis) versus chromosomal location (x-axis). Horizontal lines mark threshold of significant (p=10-8) and suggestive (p=10-5) genome-wide significance threshold. (B) Same Manhattan plot using color coding to identify functional variants (yellow), variants with no current functional annotation (blue), and previously identified SLE GWAS tagging SNPs (red). Zoom in picture of Manhattan plot for TNFAIP3 and ITGAM gene is shown.
Figure 4
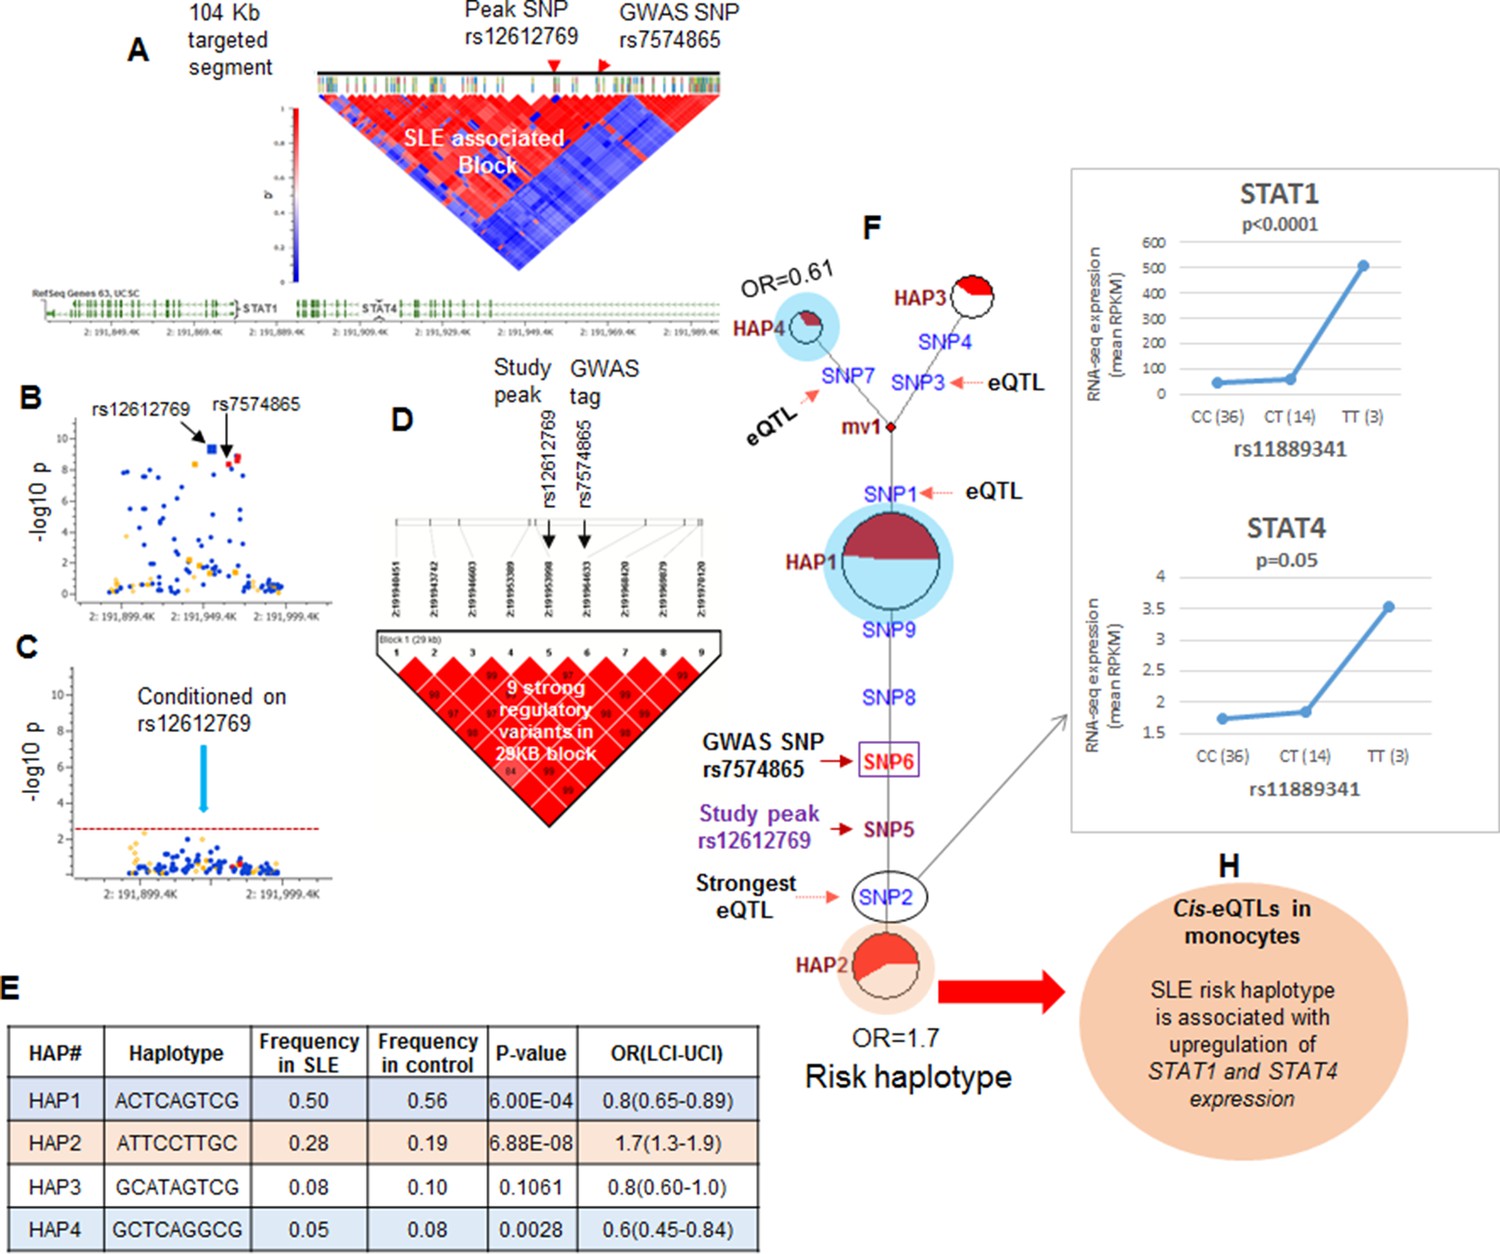
LD structure, haplotypes and MJ networks analysis at STAT4 locus.
(A) LD structure of STAT4 sequenced segment is shown above molecular map of the genomic segment showing STAT1 and STAT4 exon structure. The locations of GWAS tagging SNPs are shown above LD plot, which was produced with 104 markers (MAF≥10%) in 1349 Caucasians. (B) Zoom in Manhattan plot showing SLE association levels of individual sequence variants in STAT4 LD block containing STAT4 tagging SNPs. Yellow points indicate functional variants, blue points indicate un-annotated variants and red points identify GWAS and study peak tagging SNPs. (C) Conditional analysis on peak SNP rs12612769 removes all significant associations with SLE within the LD block. (D) LD block based on nine potentially functional SLE associated variants used for haplotype analysis. (E) Derived haplotypes with SLE association results. (F) Median-joining (MJ) network analysis of STAT4 haplotypes. Spheres (termed nodes) represent the locations of each haplotype (from table in E) within the network and the size of the node is proportional to the overall frequency of that haplotype in the dataset. Each node is overlaid with a pie chart that reflects the frequency of that haplotype in cases (red) versus controls (white). The lines connecting the nodes are labeled with the variants that distinguish the connected nodes and the length is proportional to the number of variants. Haplotypes with significant (p<0.05) association with SLE are highlighted with red (risk) and blue (non-risk). Study peak SNP, SLE GWAS tag SNP and eQTLs are indicated with arrows, boxes and circles within their locations within the network. (G) Presents cis-eQTL effects observed with SNP2 on STAT1 and STAT4 in macrophage RNAseq analysis. (H) Similar eQTL effects observed in published eQTL databases in literature.
Figure 5
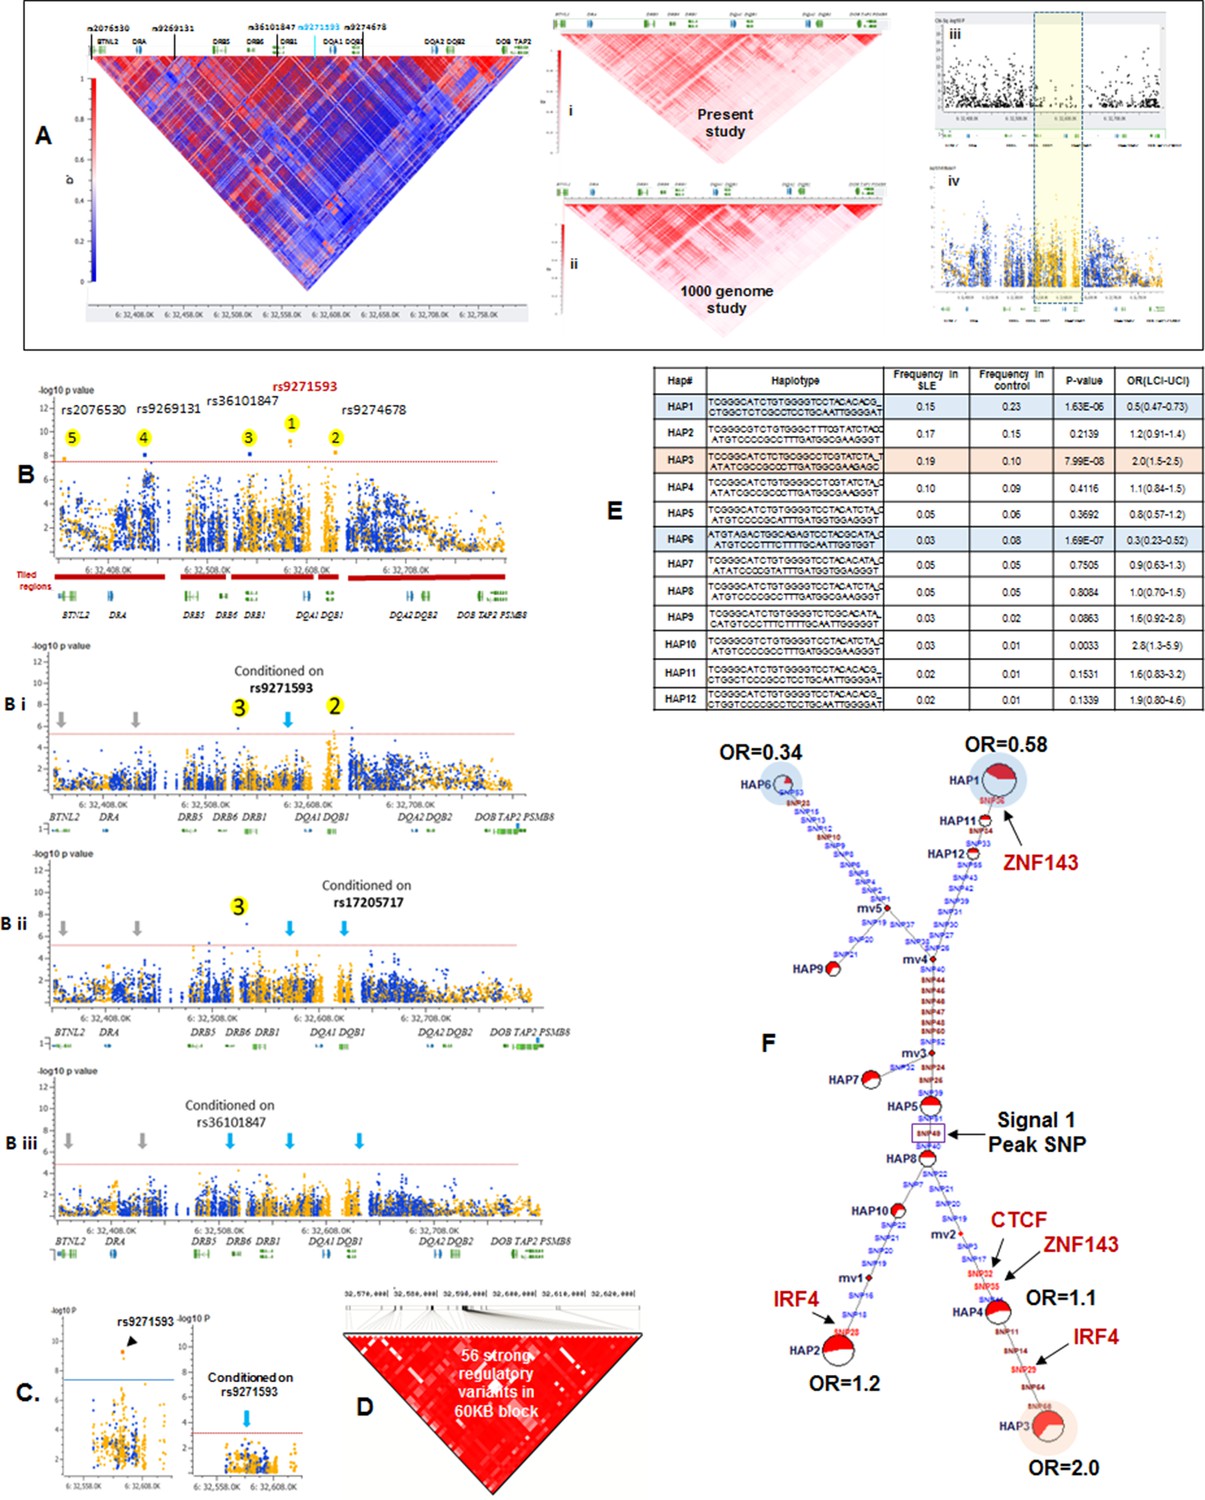
LD structure, haplotypes and MJ Network analysis of XL9 region.
(A) The LD structure of HLA-D region is shown below a molecular map of the region. The locations of the genes and five genome-wide SLE association signals are marked. Peak association signal is coded blue. (A) (i) The HLA-D LD structure in 1349 Caucasians from present study assayed with -8062 common (MAF>0.15) variants. (A) (ii) The HLA-D LD structure in 2504 samples representing twenty-six cohorts from the world population. Data obtained by analysis of the1000 Genome project datasets using the same -8062 variants analyzed in A (i). (A) (iii) SNP content of Immunochip v.1 across HLA-D region. (A) (iv) High quality common variant calls in this region from targeted sequencing in this study. Highlighted area boxes the XL9 through DQB1 5’ segment regulatory region. Yellow points indicate potentially functional variants and blue points indicate un-annotated sequencing variants. (B) Zoom Manhattan plot of all common (MAF>0.05) variants using color coding to identify functional (yellow) and non-annotated (blue) variants. The locations of peak association signals are marked. A molecular map of the region and the tiled regions for targeted sequencing are identified at the bottom. Gaps reflect the locations of long stretches of highly repetitive regions that cannot be assembled. (B) (i) The residual association level after conditioning on peak signal 1 in XL9. (B) (ii) Residual association level after conditioning on both signal 1 (XL9) and signal 2 (DQB1 5’ segment). (B) (iii) No significant associations remain after conditioning on signal 1 (XL9), signal 2 (DQB1 5’ segment), & signal 3 (DRB1). Yellow points identify potentially functional variants and blue points indicate un-annotated variants. (C) Conditional analysis on peak SNP rs9271593 (XL9 signal) showing that all significantly associated variants are in tight LD. (D) A 60KB LD block generated with 56 variants from XL9 region with strong regulatory scores and association with SLE. (E) Twelve haplotypes generated with HAPLOVIEW using the 56 regulatory variants. Frequencies in cases and controls, association statistics, and odds ratios are provided. Protective (blue) and risk (red) haplotypes are highlighted. (F) Median neighbor-joining (MJ) network produced as described in the text. Annotation is the same as presented in legend for Figure 2. Variants that disrupt binding sites of CTCF, ZNF143, and IRF4 are labeled.
Figure 6

Chromatin architecture and transcriptional regulation at SLE associated XL9 region.
(A) A snap shot of the ~140 Kb DRB1-DQB1 segment that contains three genome-wide association signals for SLE. The locations of HLA class II genes and the peak signals are marked. The locations of some of the more than 750 eQTLs variants mapped into this region are overlaid onto ENCODE defined regulatory elements (Histone marks and DNA hyper sensitivity clusters). (B) A snap shot of a ~1 Kb segment in the center of the XL9 that contains 13 of the 56 strong regulatory variants that constitutes the XL9 haplotype. The positions of the canonical protein binding motifs of CTCF, IRF4 and ZNF143 highlighted in yellow and the peak XL9 SNP highlighted in blue. The locations of about 30 binding sites for transcription factor that are located within this same region and are also impacted genetic variation are also listed. (C) The consensus sequence for IRF4 binding in XL9 is shown with the locations of the two nucleotide variants boxed and marked. The consensus sequence for IRF4 binding (GA) are the alleles present in XL9 risk haplotypes. The alternative alleles for these two nucleotides, which are much less frequent in IRF4 binding motifs, are in protective haplotypes. The red and blue highlighted paths describe the predicted effects of these variations on IRF4-mediated transcription of HLA-DR and HLA-DQ, with risk haplotypes highlighted in red and protective haplotypes highlighted in blue. (D) shows cis eQTL effects observed with SLE associated XL9 region regulatory variants. SNPs were found to impact the expression level of HLA-DRB1, HLA-DQA1 and HLA-DQB1 gene in monocyte derived macrophages (MDMs). In each plot, x-axis shows three genotypes of a given eQTL SNP and y-axis shows RNAseq expression values in RPKM. SNP numbers correspond to XL9 variants in Figure 5F. (E) Part i shows LD between peak regulatory SNP and a coding SNP in HLA-DRB1, DQA1 and DQB1. Part ii highlights the SLE associated coding allele sequence and shows the association statistics on peak regulatory and coding SNP haplotype for above three genes. Part iii shows the allelic bias in transcription in DRB1, DQA1 and DQB1 gene in human macrophages, demonstrated in terms of significantly different number of RNA sequencing reads for SLE risk and non-risk allele. Part iv shows the transcriptional bias between risk and protective alleles for HLA class II genes in four heterozygous human donors for these IRF4 variants.
Figure 7

Cell surface expression of HLA-CLASS II genes.
(A.1) Monocyte-derived dendritic cell (MDDC) surface expression of HLA-DR in a culture produced from a homozygote for protective (blue) and homozygote for risk (red) HLA-D haplotypes. This experiment was repeated in same donors. (A.1) shows flow data. (A.2) shows the MFIs from repeated experiments. p-value shown in (A.2) was calculated on mean MFIs from two experiments. (B) shows normalized RNAseq expression on HLA-class II genes in dendritic cells on same donors presented in (A). (C.1–C.8) shows HLA-DQ surface expression on MDDC cultures from a homozygote for protective (blue) and heterozygote for risk (red) HLA-D haplotype. Flow data and respective MFIs are shown on MDDCs at steady state (C.1 and C.2), at 4 hr (C.3 and C.4), 8 hr (C.5 and C.6) and 18 hr (C.7 and C.8) after stimulation with TLR7/8 ligands. (D) heatmap on RNAseq data on lymphoblastoid cell line (LCL) from 1000 genome project compare expression level of HLA-class II genes between individuals homozygous for HLA-D protective and risk haplotype.
Figure 8
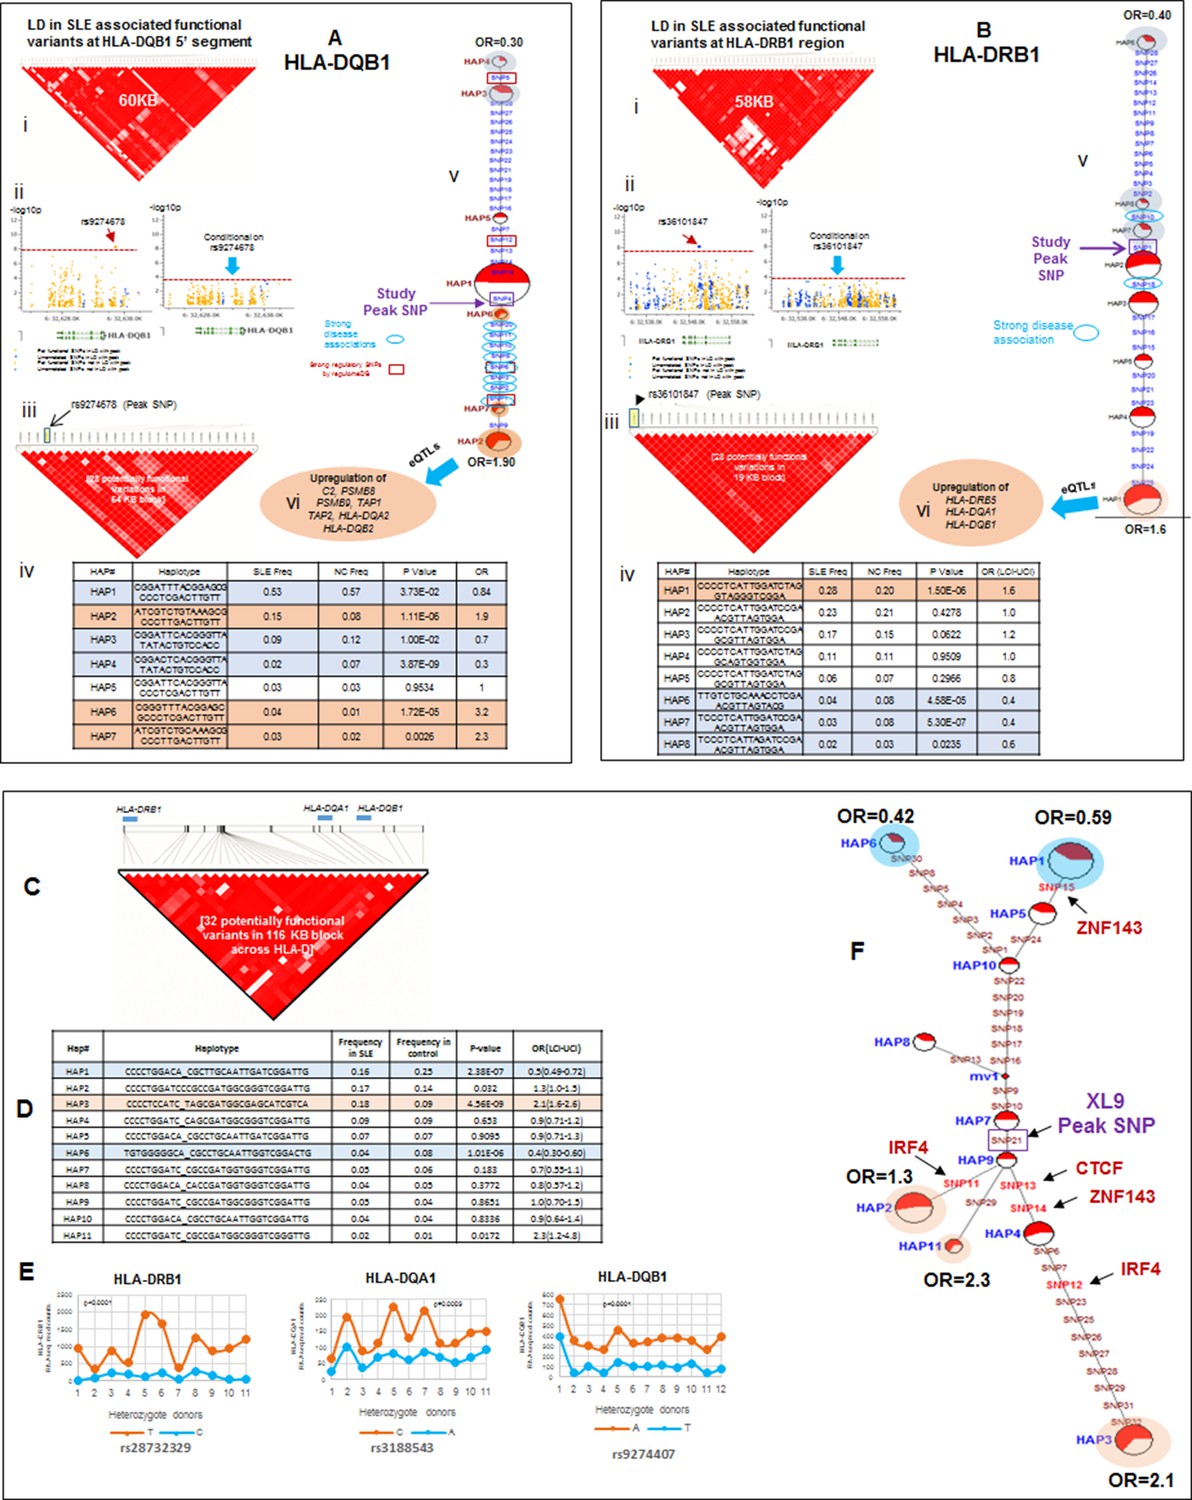
LD structure, haplotypes and MJ network analysis in HLA-DQB1 and HLA-DRB1 region.
(A) (i) LD structure at HLA-DQB1 5’ region generated with 68 common (MAF≥10%) potentially functional variants in 1349 samples. (A) (ii) Zoom Manhattan plot showing SLE variant association levels and conditional analysis on peak SNP rs9274678. (A) (iii) LD block structure of 28 potentially functional SLE associated SNPs which are used for downstream haplotype analysis. (A) (iv) Haploview generated seven haplotypes from these 28 functional variants. Frequencies in cases and controls and association statistics are provided. Risk (red) and protective (blue) haplotypes are color highlighted. (A) (v) MJ networks analysis to illustrate divergence of risk and protective regulatory haplotypes. (A) (vi) eQTL variations from public databases for variants in strongest risk haplotype. (B) (i) LD structure at HLA-DRB1 region generated with 66 common (MAF≥10%) potentially functional variants in 1349 samples. (B) (ii) Zoom Manhattan plot showing SLE variant association levels and conditional analysis on peak SNP rs36101847. (B) (iii) LD block structure of 28 potentially functional SLE associated SNPs which are used for downstream haplotype analysis. (B) (iv) Haploview generated eight haplotypes from these 28 functional variants. Frequencies in cases and controls and association statistics are provided. Risk (red) and protective (blue) haplotypes are color highlighted. (B) (v) MJ networks analysis to illustrate divergence of risk and protective regulatory haplotypes. (B) (vi) eQTL variations from public databases for variants in strongest risk haplotype. Panel (C) 116 kb LD block generated with 32 SLE associated potentially functional variations from the three independent association signals in HLA-D region. (D) Haplotype association statistics in cases and controls with risk (red) and protective (blue) haplotypes highlighted. (E) Allelic bias in level of transcription for HLA-class II genes between SLE risk and non-risk alleles in 11 independent heterozygous donors (measured as shown in Figure 6). Number of RNA sequencing reads were compared between chromosome carrying risk (orange line) verses non-risk (blue line) allele for each class II gene. (F) MJ network analysis illustrating the relationships of risk and non-risk haplotypes based on 32 functional variations. SLE associated variants sitting exactly within specific protein binding motifs i.e. IRF4, CTCF and ZNF143 are highlighted with arrows.
Figure 9
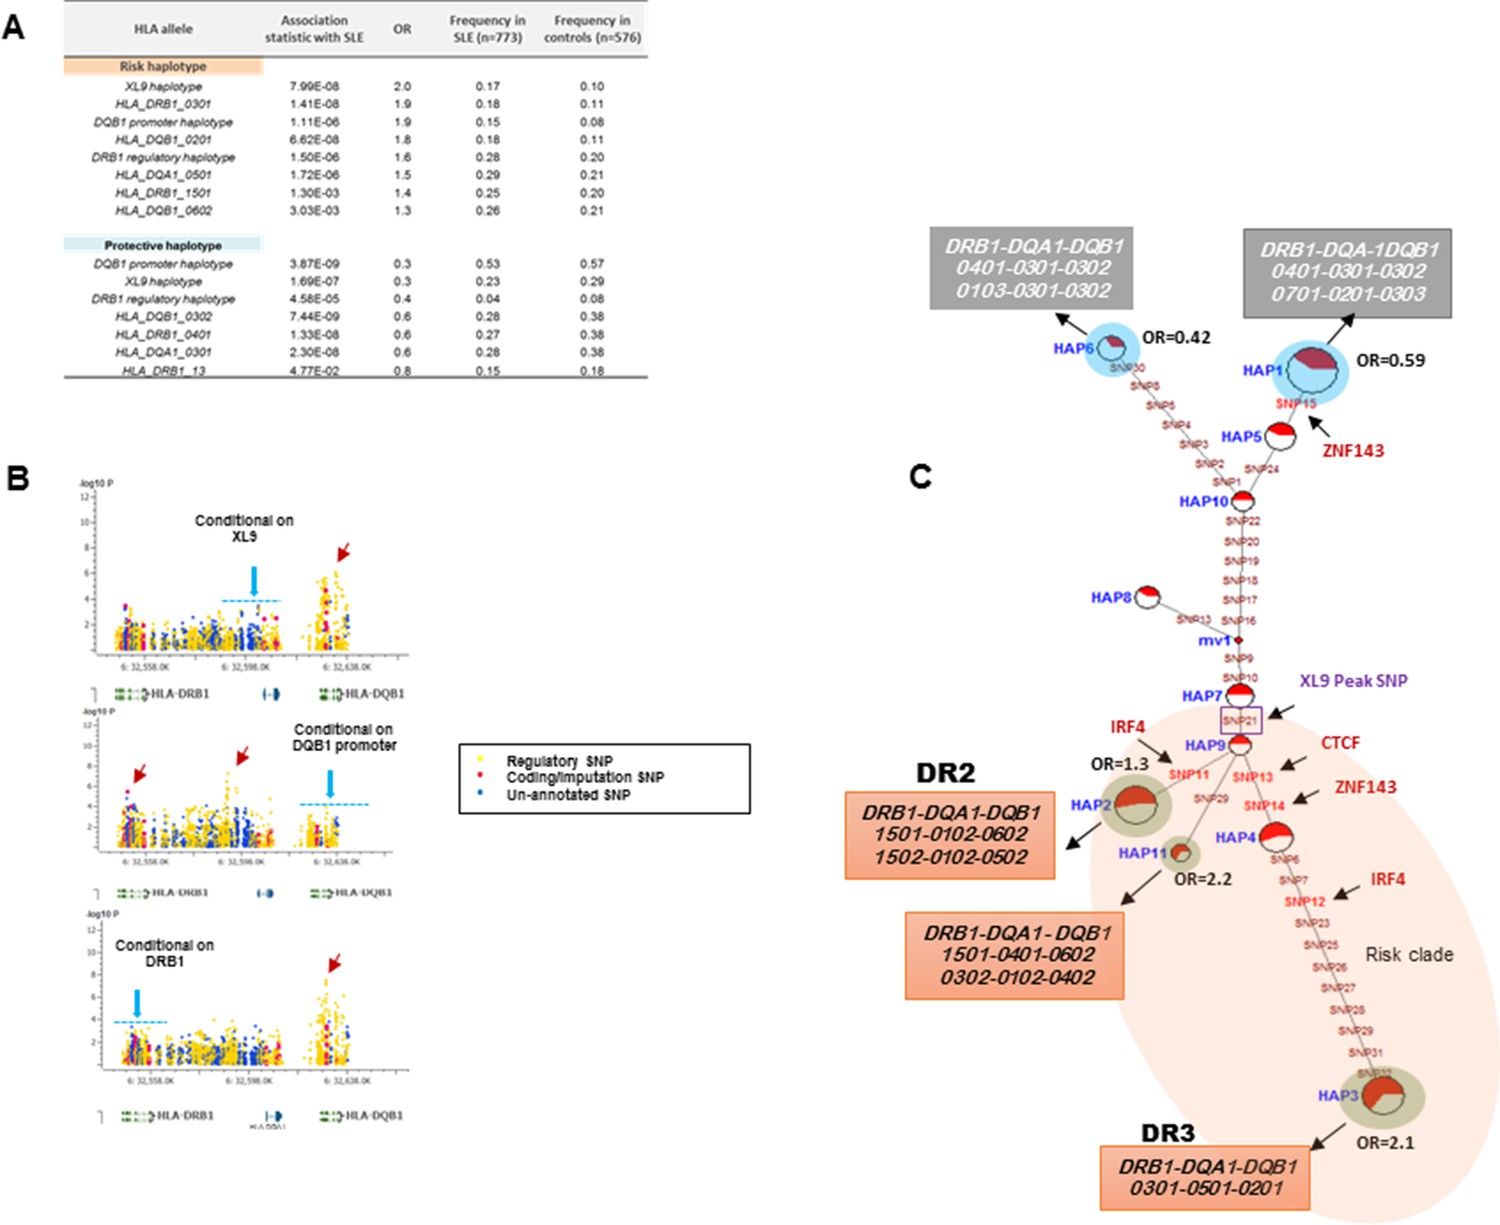
HLA-D regulatory haplotypes and classical HLA alleles.
(A) SLE association statistics of regulatory and classical HLA alleles in this study. (B) Conditional analysis on peak regulatory signals in XL9, DQB1 and DRB1 regions. (C) Median-joining (MJ) network analysis of 32 regulatory variants spanning HLA-DRB1 to DQB1 region. SLE associated variants sitting directly on canonical binding motif of CTCF, IRF4 and ZNF143 transcription factor are indicated with arrows. The HLA DRB1-DQA1-DQB1 haplotypes associated with each of the risk and protective regulatory haplotypes are presented.
Figure 10

LD structure, haplotypes and MJ network analysis of ITGAM, IRF5, UBE2L3 and BANK1.
Panel 10 (i) shows ITGAM, Panel 10 (ii) shows IRF5, Panel 10 (iii) shows UBE2L3 and Panel 10 (iv) shows BANK1 genetic association analysis. (A) LD structure of studied intervals generated with common (MAF≥10%) variants in 1349 samples, 221 in case of ITGAM, 400 in case of IRF5, 84 in case of UBE2L3 and 430 variants in case of BANK1. (B) Zoom Manhattan plot of all common variants in studied region showing SLE association levels and conditional analysis on peak SNP/s. (C) LD block based on potentially functional SLE associated SNPs which are used for downstream haplotype analysis. (D) Haploview generated haplotypes from functional variants. Frequencies in cases and controls and association statistics are provided. Risk (red) and protective (blue) haplotypes are color highlighted. (E) MJ networks analysis to illustrate divergence of risk and protective regulatory haplotypes. Haplotype with significant p value (p<0.05) are highlighted with red (risk) and blue (non-risk) color. Study peak SNP, previously known SLE GWAS tag SNP and eQTLs are indicated with arrows. (F) eQTL variations from public databases for variants in strongest risk haplotype.
Figure 11
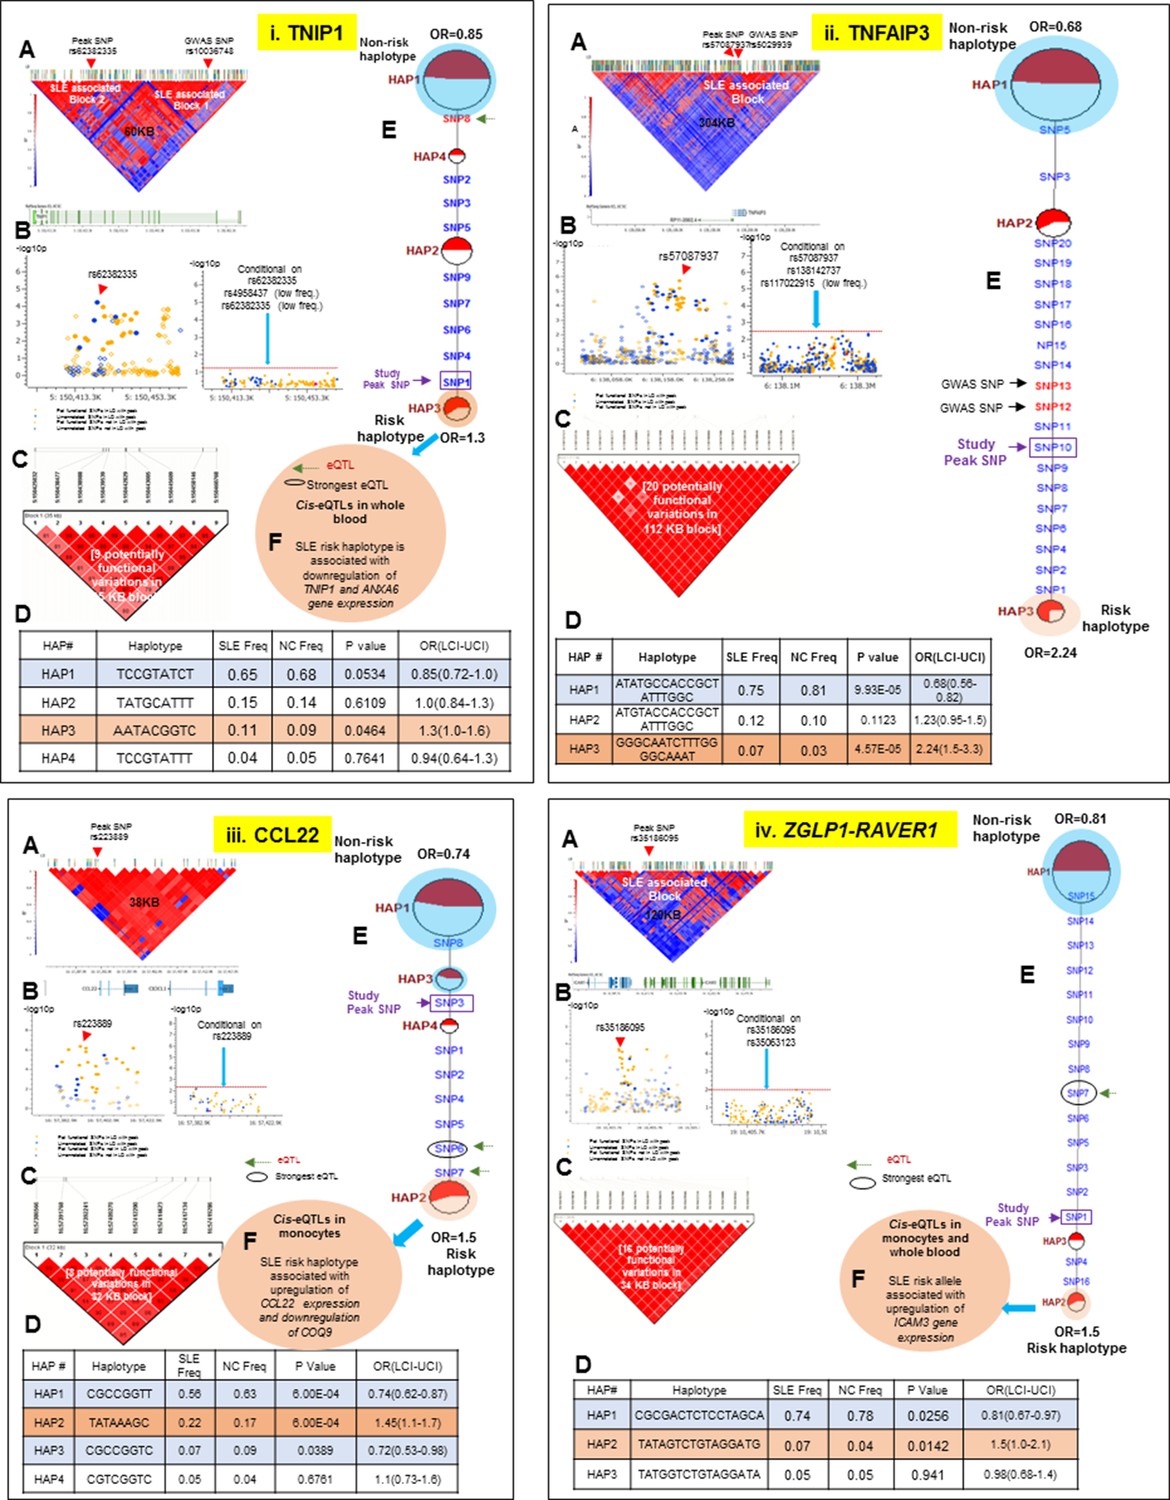
LD structure, haplotypes and MJ network analysis of TNIP1, TNFAIP3, CCL22 and ZGLP1-RAVER1.
Panel 11 (i) shows TNIP1, Panel 11 (ii) shows TNFAIP3, Panel 11 (iii) shows CCL22 and Panel 11 (iv) shows ZGLP1-RAVER1 genetic association analysis. (A) LD structure of studied intervals generated with common (MAF≥10%) variants in 1349 samples, 140 in case of TNIP1, 356 in case of TNFAIP3, 30 in case of CCL22 and 126 variants in case of ZGLP1-RAVER1. (B) Zoom Manhattan plot of all common variants in studied region showing SLE association levels and conditional analysis on peak SNP/s. (C) LD block based on potentially functional SLE associated SNPs which are used for downstream haplotype analysis. (D) Haploview generated haplotypes from functional variants. Frequencies in cases and controls and association statistics are provided. Risk (red) and protective (blue) haplotypes are color highlighted. (E) MJ networks analysis to illustrate divergence of risk and protective regulatory haplotypes. Haplotype with significant p value (p<0.05) are highlighted with red (risk) and blue (non-risk) color. Study peak SNP, previously known SLE GWAS tag SNP and eQTLs are indicated with arrows. (F) eQTL variations from public databases for variants in strongest risk haplotype.
Figure 12

LD structure, haplotypes and MJ network analysis of ICA1, BLK and ETS1.
Panel 12 (i) shows ICA1, Panel 12 (ii) shows BLK and Panel 12 (iii) shows ETS1 genetic association analysis. (A) LD structure of studied intervals generated with common (MAF≥10%) variants in 1349 samples, 370 in case of ICA1, 258 in case of BLK and 209 variants in case of ETS1 (B) Zoom Manhattan plot of all common variants in studied region showing SLE association levels and conditional analysis on peak SNP/s. (C) LD block based on potentially functional SLE associated SNPs which are used for downstream haplotype analysis. (D) Haploview generated haplotypes from functional variants. Frequencies in cases and controls and association statistics are provided. Risk (red) and protective (blue) haplotypes are color highlighted. (E) MJ networks analysis to illustrate divergence of risk and protective regulatory haplotypes. Haplotype with significant p value (p<0.05) are highlighted with red (risk) and blue (non-risk) color. Study peak SNP, previously known SLE GWAS tag SNP and eQTLs are indicated with arrows. (F) eQTL variations from public databases for variants in strongest risk haplotype.
Figure 13
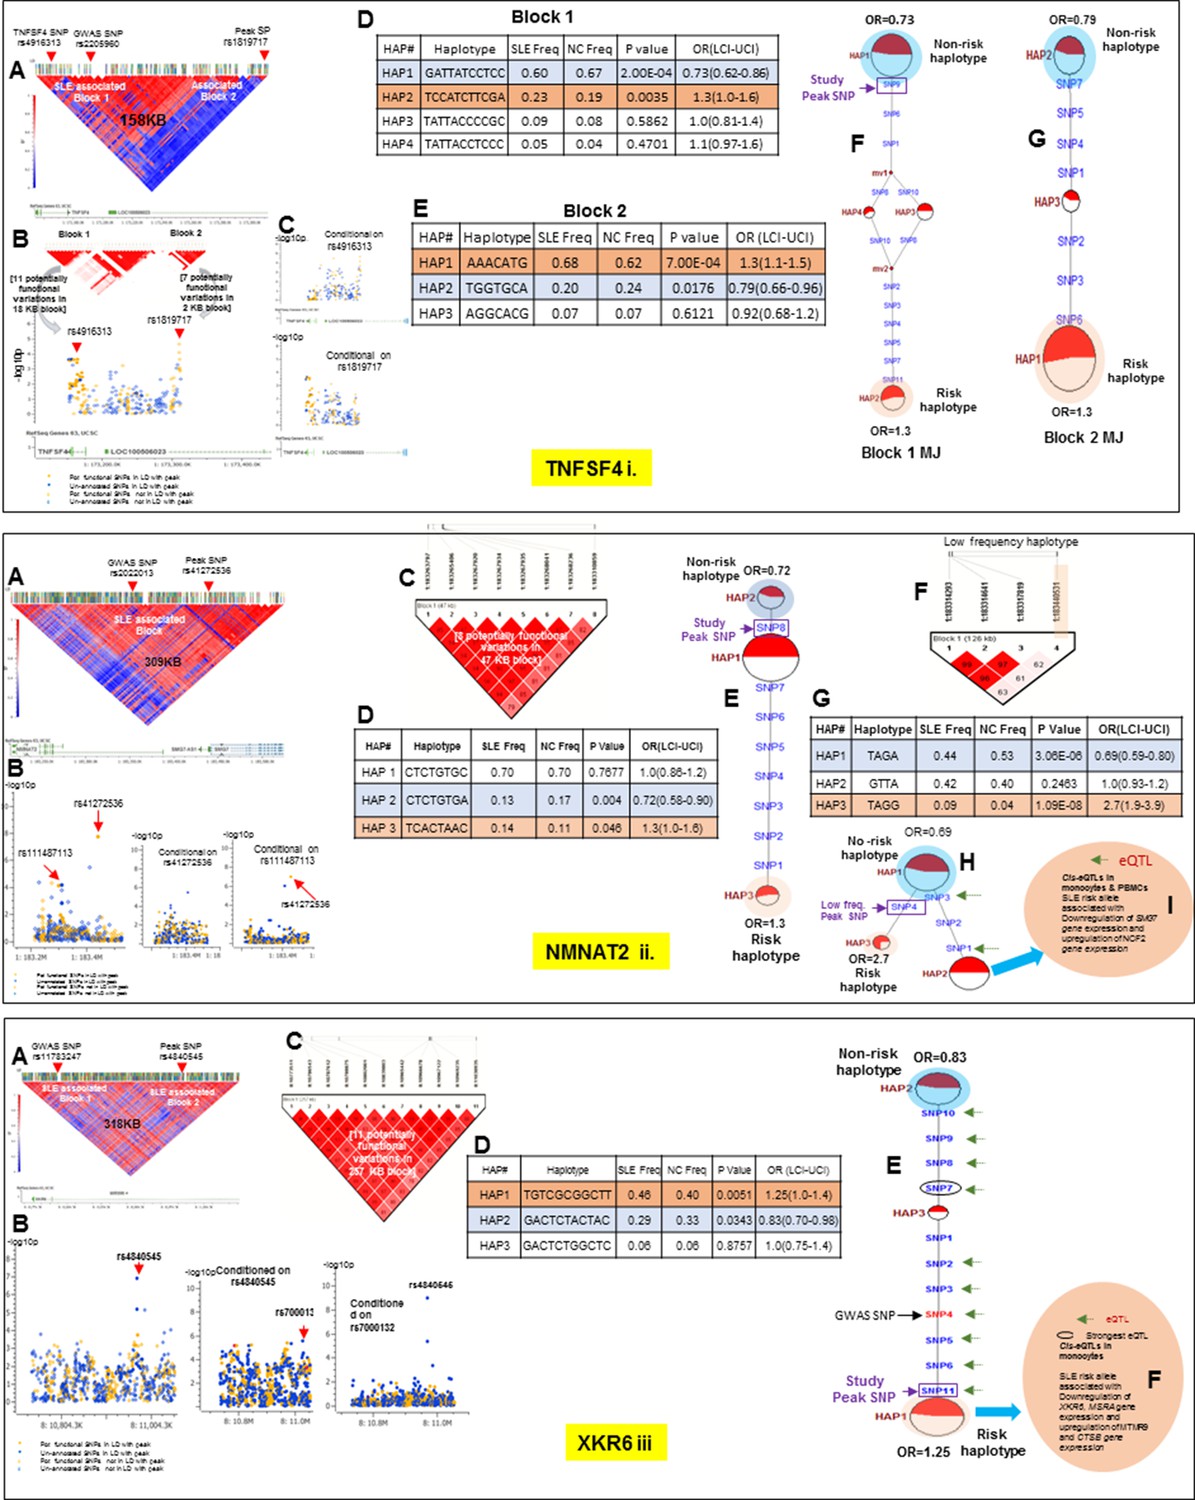
LD structure, haplotypes and MJ network analysis of TNFSF4, NMNAT2 and XKR6.
Panel 13 (i) shows TNFSF4, Panel 13 (ii) shows NMNAT2 and Panel 13 (iii) shows XKR6 genetic association analysis. These three interval showed more than one independent LD block associated with SLE in our analysis. (A) LD structure of studied intervals generated with common (MAF≥10%) variants in 1349 samples, 152 in case of TNFSF4, 411 in case of NMNAT2 and 643 variants in case of XKR6. In case of TNFSF4, (B) shows two SLE associated LD blocks and zoom Manhattan plot of all common variants in studied region. (C) showing SLE association levels and conditional analysis on peak SNP/s. (D and E) Haploview generated haplotypes from functional variants in block 1 and block2, respectively. Frequencies in cases and controls and association statistics are provided. Risk (red) and protective (blue) haplotypes are color highlighted. Similarly, (F and G) shows MJ networks analysis to illustrate divergence of risk and protective regulatory haplotypes from block1 and block2, respectively. Haplotype with significant p value (p<0.05) are highlighted with red (risk) and blue (non-risk) color. Study peak SNP, previously known SLE GWAS tag SNP and eQTLs are indicated with arrows. In case of NMNAT2 (13.ii), (B) shows zoom Manhattan plot of all common variants in studied region showing SLE association levels and conditional analysis on peak SNP/s. Panel C: LD block based on potentially functional SLE associated SNPs which are used for downstream haplotype analysis. (D) Haploview generated haplotypes from functional variants. Frequencies in cases and controls and association statistics are provided. Risk (red) and protective (blue) haplotypes are color highlighted. (E) MJ networks analysis to illustrate divergence of risk and protective regulatory haplotypes. (F) LD block based on a low frequency SLE associated variant (G) Low frequency haplotype association analysis (H) MJ networks analysis with low frequency haplotype and (I) eQTL variations from public databases for variants in risk haplotype. In case of XKR6 (13.iii), (B) shows zoom Manhattan plot of all common variants in studied region showing SLE association levels and conditional analysis on peak SNP/s. (C) LD block based on potentially functional SLE associated SNPs which are used for downstream haplotype analysis. (D) Haploview generated haplotypes from functional variants. Frequencies in cases and controls and association statistics are provided. Risk (red) and protective (blue) haplotypes are color highlighted. (E) MJ networks analysis to illustrate divergence of risk and protective regulatory haplotypes. Haplotype with significant p value (p<0.05) are highlighted with red (risk) and blue (non-risk) color. Study peak SNP, previously known SLE GWAS tag SNP and eQTLs are indicated with arrows. (F) eQTL variations from public databases for variants in strongest risk haplotype.
Figure 14
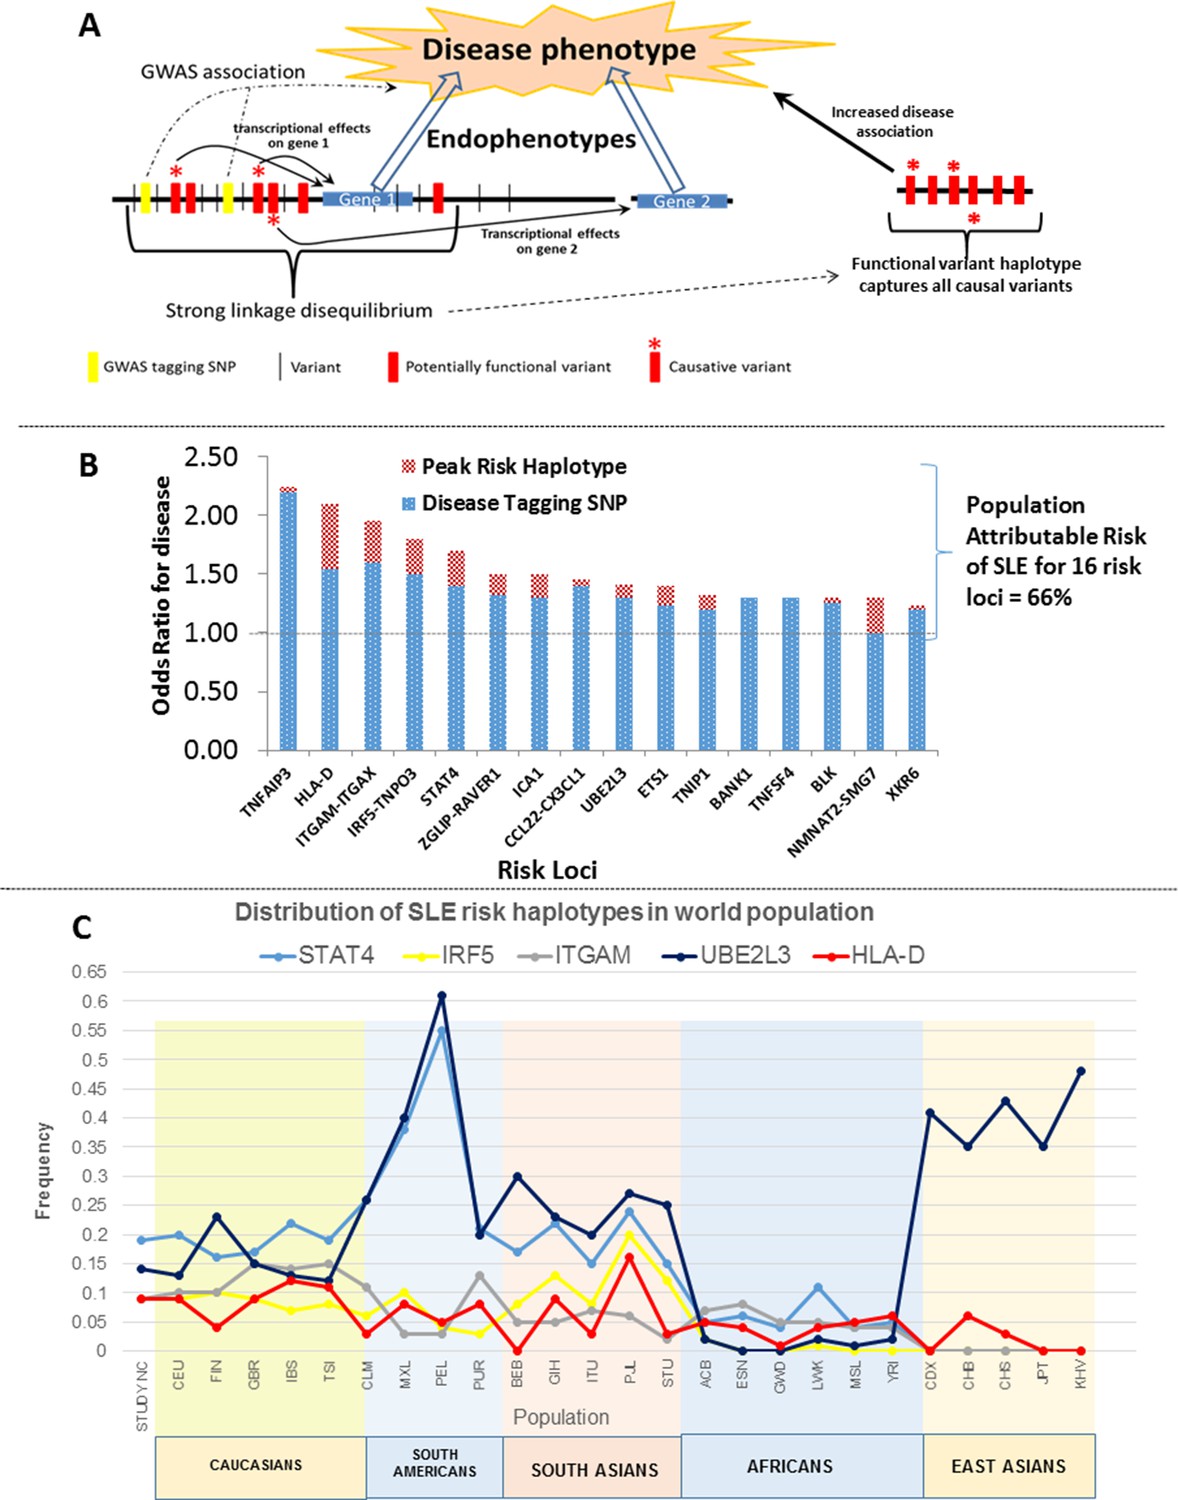
Model of allelic architecture for functional variations in common disease risk loci.
(A) A working model of the architecture of the variations within common disease risk loci. Disease associated tagging SNPs associate an LD block with a disease phenotype. Within this LD block, multiple variations are in tight LD, including nonfunctional, functional, and causal variants. Causal variants potentiate the disease phenotype by modulating endophenotypes. In this model, causal variants impact two adjacent genes, one of which is not located within the LD block, both of which contribute endophenotypes towards disease. Haplotype and MJ analysis using functional variants in tight LD with original tagging SNP define haplotypes that contain all of the causal variants. The peak risk haplotype defines a disease allele with increased disease association in comparison to the original GWAS tagging SNP. (B) A plot of all of the odds ratios attributable to the GWAS tagging SNP (blue bars) versus the peak risk haplotype (additional red bar) for each of the sixteen risk loci analyzed in detail. A consistent gain in odds ratio for SLE was obtained with regulatory haplotypes that averaged 17% in the present study. (C) Frequency of STAT4, IRF5-TNPO3, ITGAM-ITGAX, UBE2L3 and HLA-D SLE risk haplotypes among our own study and 26 ethnic populations characterized in the 1000 Genomes project. The x-axis of the graph shows population groups and y axis show frequency of haplotypes.
Figure 15
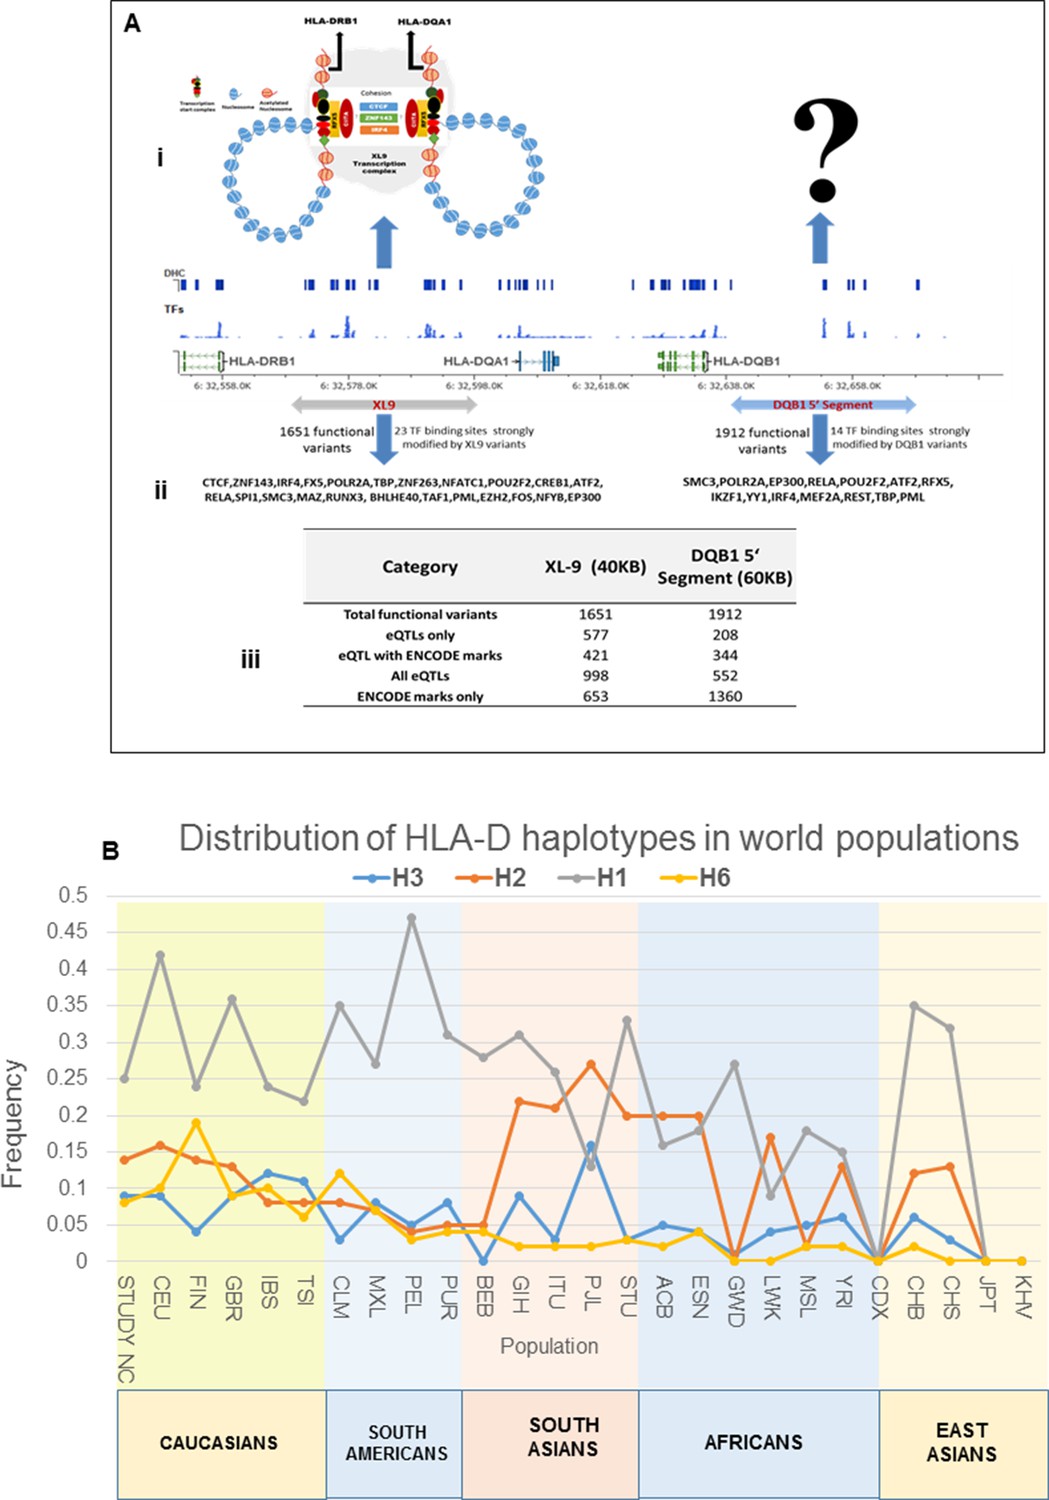
Model of chromatin architecture and transcription regulatory elements in XL9 and DQB1 segments.
(A) (i-ii) A model showing the XL9 transcription complex and three important proteins (CTCF, IRF4 and ZNF143) which may be impacted by SLE associated genetic variants hitting canonical motifs in XL9 region (Adapted from Majumdar et al., 2008). The chromatin structure of the regulatory complex produced in the DQB1 5’ segment is hypothetical and currently unknown. A chromosomal map of HLA-DRB1 through HLA-DQB1 region showing ENCODE defined regulatory marks, eQTLs and most strongly impacted transcription factors by XL9 and the DQB1 5’segment is shown below these models. The transcription factor binding sites impacted by functional variations within these regions are shown below the molecular map. (A) (iii) A table listing the numbers of and characteristics of functional variants in these two regulatory regions of HLA-D. (B): Global distribution of the major risk and protective haplotypes from the composite HLA-D region analysis.
Figure 16
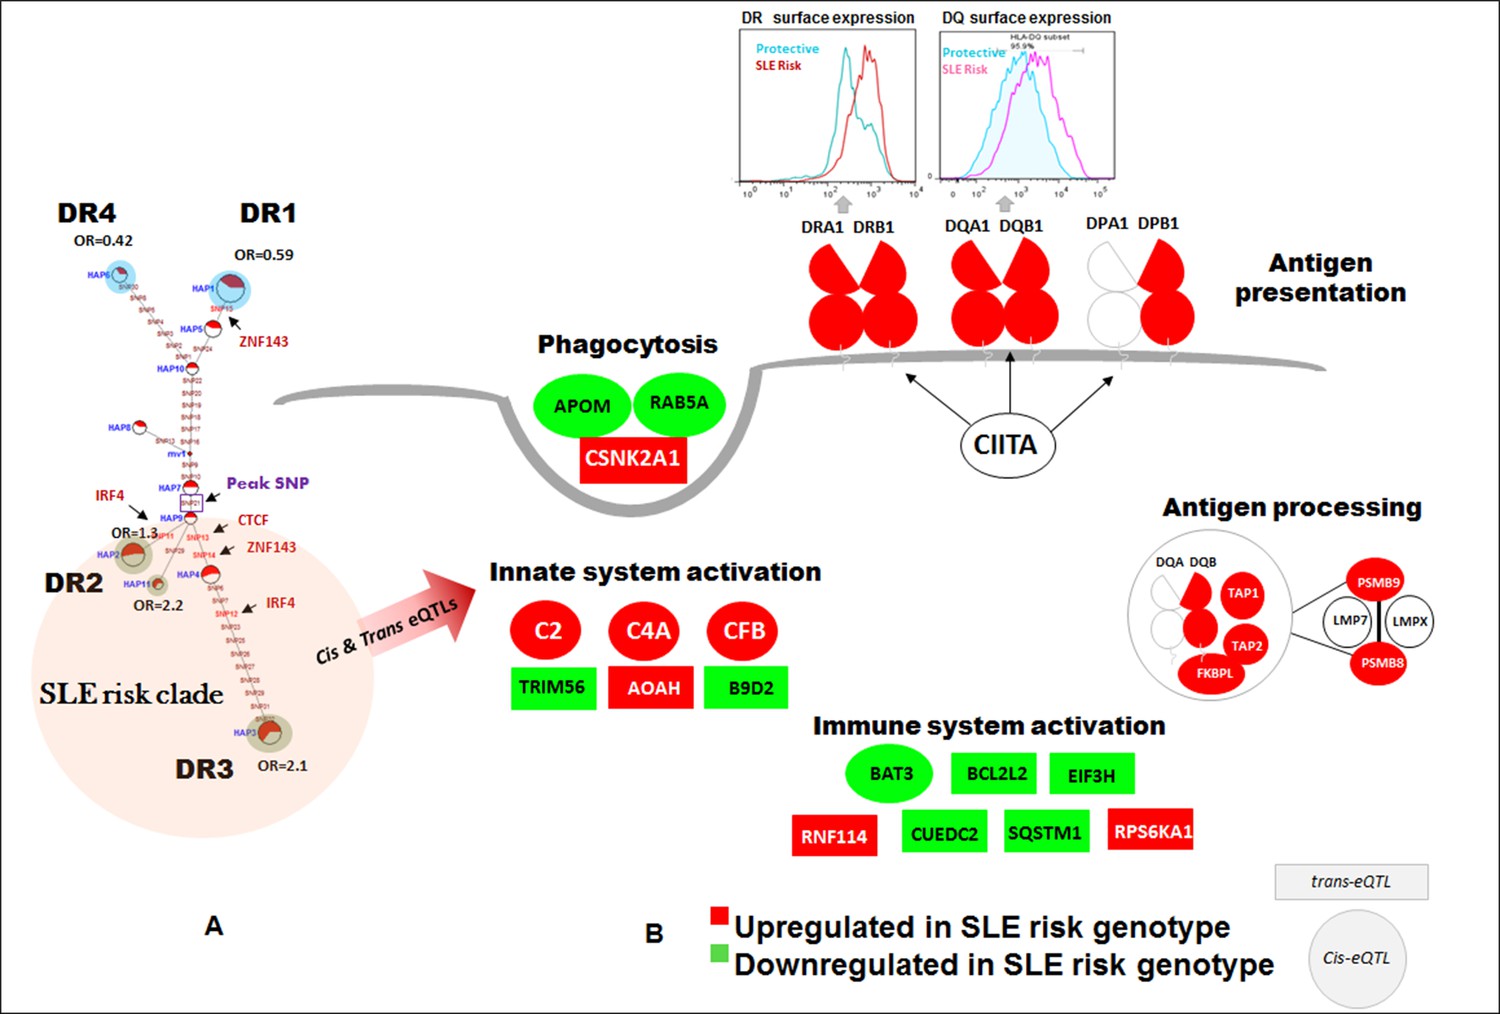
SLE risk haplotype upregulates the antigen presentation pathway (APP).
All of the composite HLA-D haplotypes within the risk clade (highlighted in red) contain eQTL variants reported to impact 72 genes in the publicly available eQTL datasets utilized in this study. The patterns of increased or decreased transcription associated with all of these haplotypes is modeled on the left, with red indicating increased expression and green indicating decreased expression relative to the protective haplotypes shaded in blue. All of the HLA-DR, HLA-DQ, and HLA-DP class II molecules, along with a variety of gene products involved in the APP pathway are upregulated in all SLE risk haplotypes. A variety of other genes in the immune system, including some with known associations with SLE susceptibility (C2, C4A) are also modulated.
Author response image 1
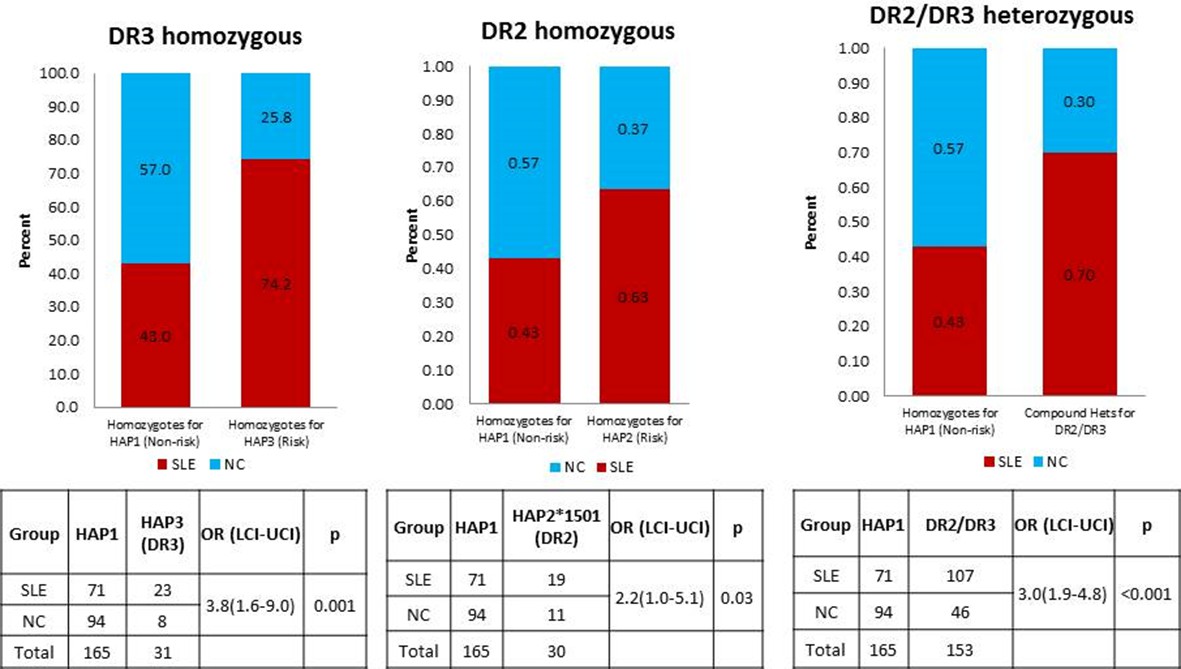
A comparison of OR for individuals homozygous for XL9 HAP3 (DR3), XL9 HAP2 (DR2), and HAP2/HAP3 heterozygotes.
https://doi.org/10.7554/eLife.12089.024
Author response image 2
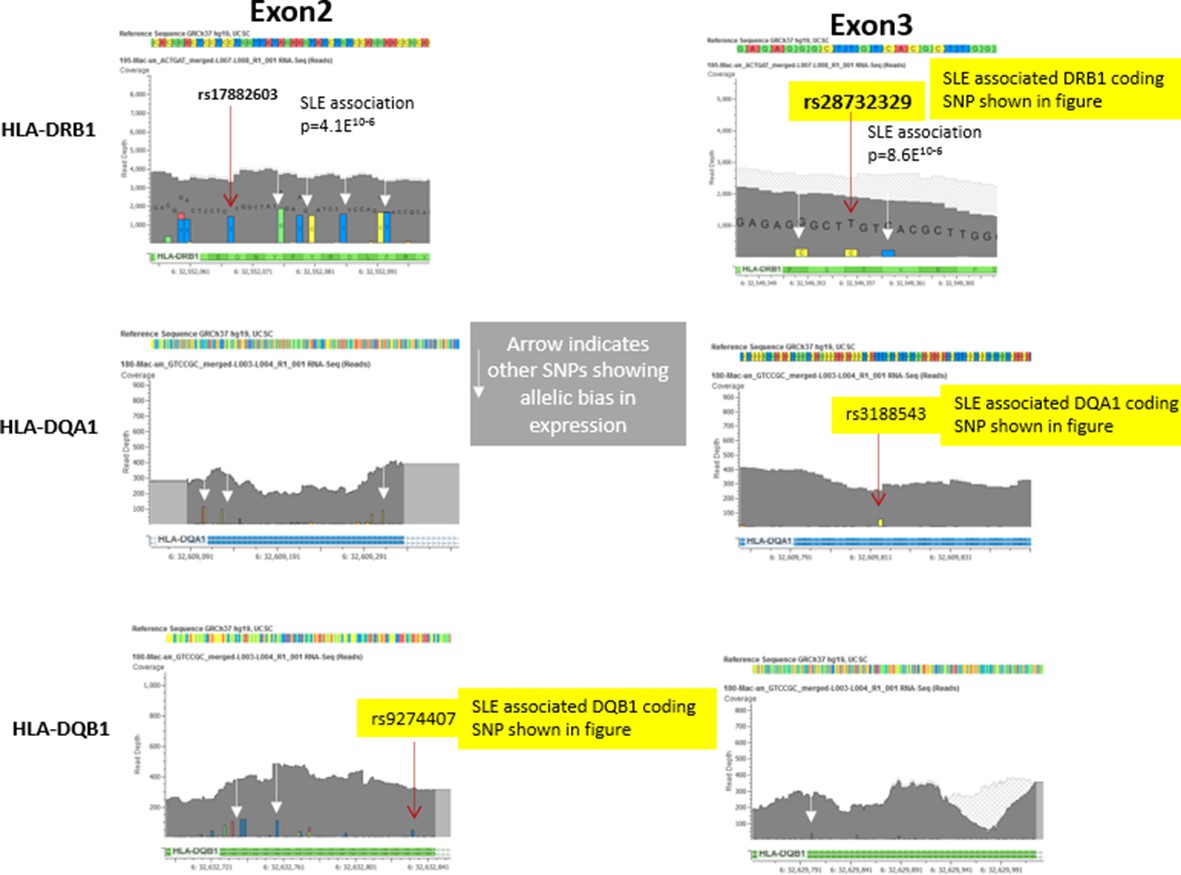
Representative data from heterozygote samples used for analysis of allelic expression bias in Figure 6 iii and iv.
Note that multiple variants in exon 2 and exon 3 showed allelic bias in the same direction, although the magnitude of the effect varied between SNPs, presumably due to variations in read depth at specific locations in the exons.In this regard, variations in the less polymorphic exon 3 showed a stronger allelic bias than those in exon 2, although all of these SNPs showed significant allelic bias in frequency within the RNA-seq data favouring the variants associated with the risk allele..
Tables
Table 1
Characteristics of disease associated variants at sixteen SLE risk loci.
| Risk locus | Signal | Peak SNP | Minor allele | Odds ratio (Minor allele) | Allele Freq. (Cases) | Allele Freq. (Controls) | SLE association P-value | SLE associated Annotated variants | Variants in LD with peak SNP (D' >0.8) | ||
|---|---|---|---|---|---|---|---|---|---|---|---|
| Total variants | Total potentially functional variants | Total coding variants | |||||||||
| STAT4 | 1 | rs12612769 | C | 1.7 | 0.29 | 0.19 | 5E-10 | 52 | 49 | 9 | 0 |
| HLA-D | 1 | rs9271593 (XL9) | C | 1.7 | 0.55 | 0.42 | 7E-10 | 835 | 530 | 398 | 0 |
| 2 | rs9274678 (DQB1) | G | 2.1 | 0.24 | 0.13 | 6E-09 | 736 | 216 | 69 | 0 | |
| 3 | rs36101847 (DRB1) | T | 0.5 | 0.13 | 0.23 | 8E-09 | 760 | 296 | 126 | 0 | |
| ITGAM-ITGAX | 1 | rs41476751 | C | 1.9 | 0.25 | 0.15 | 8E-09 | 153 | 121 | 62 | 3 |
| IRF5_TNPO3 | 1 | rs34350562 | G | 1.8 | 0.23 | 0.14 | 3E-09 | 245 | 189 | 124 | 0 |
| UBE2L3 | 1 | rs181366 | T | 1.5 | 0.27 | 0.20 | 2E-07 | 82 | 79 | 55 | 1 |
| BANK1 | 1 | rs4699260 | T | 0.7 | 0.20 | 0.28 | 9E-06 | 267 | 143 | 29 | 2 |
| TNIP1 | 1 | rs62382335 | A | 1.4 | 0.14 | 0.10 | 6E-05 | 46 | 22 | 16 | 0 |
| TNFAIP3 | 1 | rs57087937 | T | 1.9 | 0.10 | 0.06 | 2E-06 | 69 | 63 | 40 | 1 |
| CCL22-CX3CL1 | 1 | rs223889 | T | 1.5 | 0.34 | 0.27 | 5E-07 | 32 | 25 | 20 | 0 |
| RAVER1-ZGLP1 | 1 | rs35186095 | T | 1.3 | 0.21 | 0.17 | 2E-04 | 43 | 24 | 19 | 0 |
| ICA1 | 1 | rs74787882 | A | 0.7 | 0.06 | 0.09 | 2E-03 | 34 | 10 | 6 | 0 |
| TNFSF4 | 1 | rs1819717 | G | 0.7 | 0.29 | 0.36 | 2E-05 | 73 | 30 | 14 | 0 |
| 2 | rs4916313 | C | 1.3 | 0.39 | 0.32 | 2E-04 | 30 | 21 | 0 | ||
| BLK | 1 | rs7822109 | C | 0.8 | 0.46 | 0.52 | 9E-05 | 97 | 61 | 38 | 0 |
| XKR6 | 1 | rs4840545 | A | 2.0 | 0.13 | 0.07 | 1E-07 | 335 | 51 | 23 | 0 |
| 2 | rs7000132 | C | 0.9 | 0.42 | 0.46 | 5E-04 | 178 | 118 | 0 | ||
| NMNAT2-SMG7 | 1 | rs41272536 | G | 2.9 | 0.11 | 0.05 | 2E-08 | 33 | 8 | 8 | 0 |
| 2 | rs111487113 | A | 0.6 | 0.13 | 0.18 | 5E-04 | 17 | 5 | 0 | ||
| ETS1 | 1 | rs34516251 | A | 0.8 | 0.18 | 0.21 | 7E-03 | 18 | 10 | 6 | 0 |
Table 2
Summary of SLE association and functional characteristics of peak variants and functional haplotypes for 16 SLE risk loci.
| Gene | Known GWAS (tag) SNP | GWAS reference | GWAS (tag) SNP OR | Study peak SNP | Study peak SNP OR | Peak risk- associated functional haplotype | Risk haplotype OR | Increase in OR of haplotype versus GWAS SNP | Increase in OR of haplotype versus study peak SNP | Related Figure in the manuscript | Strongest ENCODE effect cell line/ tissue | eQTL data cell type/tissue |
|---|---|---|---|---|---|---|---|---|---|---|---|---|
| STAT4 | rs7574865 | Lee et al., 2012 | 1.4 | rs12612769 | 1.7 | ATTCCTTGC | 1.7 | 0.3 | 0 | Figure 4 | Mammary gland, Epithelial | Monocyte, macrophage |
| HLA-D | rs1150754 | Taylor et al., 2011 | 1.54 | rs9271593 (XL9) | 1.6910364 | CCCCTCCATC_TAGCGATGGCG AGCATCGTCA | 2.1 | 0.56 | 0.4089636 | Figure 8C-F | B-lymphocyte, lymphoblastoid | Monocyte |
| ITGAM-ITGAX | rs9888739 | Harley et al., 2008 | 1.6 | rs41476751 | 1.8696398 | AAGCATC TAGTCTT GTCTACAA TAGTCTCTC | 1.95 | 0.35 | 0.0803602 | Figure 10.i | B-lymphocyte, lymphoblastoid | Monocyte, Peripheral blood |
| IRF5-TNPO3 | rs12531711 | Chung et al., 2011 | 1.5 | rs34350562 | 1.7593583 | GAGTT TTCAGTCTA AGCAGT GGTCAGAAC | 1.8 | 0.3 | 0.0406417 | Figure 10.ii | Epithelial cell (Lung), B-lymphocyte | Monocyte, macrophage |
| UBE2L3 | rs5754217 | Chung et al., 2011 | 1.3 | rs181366 | 1.5217361 | TCAGTTCAC TCCTCTG | 1.4 | 0.10 | -0.1140361 | Figure 10.iii | Epithelial cell (Lung), B-lymphocyte | Monocyte |
| BANK1 | rs10516487 | Kozyrev et al., 2008 | 1.3 | rs4699260 | 1.25 | ATCTCGACGCA TGCGGA TTGGAAC | 1.3 | 0 | 0.05 | Figure 10.iv | Hela-S3, Epithelial, Fibroblast | Monocyte |
| TNIP1 | rs10036748 | Han et al., 2009; Galimberti et al., 2008 | 1.2 | rs62382335 | 1.37 | AATACGGTC | 1.3 | 0.12 | -0.05 | Figure 11.i | B-lymphocyte, lymphoblastoid | Peripheral blood |
| TNFAIP3 | rs5029939 | Graham et al., 2008 | 2.2 | rs57087937 | 1.9092441 | GGGCAATCT TTGGGGCAAAT | 2.2 | 0.04 | 0.3307559 | Figure 11.ii | B-lymphocyte, lymphoblastoid, hepatocyte | no data |
| CCL22-CX3CL1 | rs223889 | Galimberti et al., 2008 | 1.4 | rs223889 | 1.45 | TATAAAGC | 1.5 | 0.05 | 0 | Figure 11.iii | B-lymphocyte, lymphoblastoid | Monocyte |
| ZGLIP-RAVER1 | rs35186095 | Present study | 1.3 | rs35186095 | 1.3173789 | TATAGTCT GTAGGATG | 1.5 | 0.2 | 0.1826211 | Figure 11.iv | Fibroblast, K-562, HeLa-S3, B-lymphocyte | Monocyte |
| ICA1 | rs10156091 | Harley et al., 2008 | 1.3 | rs74787882 | 1.5 | GGGT | 1.5 | 0.2 | 0 | Figure 12.i | B-lymphocyte, lymphoblastoid | no data |
| BLK | rs13277113 | Hom et al., 2008 | 1.3 | rs7822109 | 1.26 | ATTTGCCCCA | 1.3 | 0 | 0.04 | Figure 12.ii | B-lymphocyte, lymphoblastoid | Monocyte, Peripheral blood |
| ETS1 | rs7932088 | Yang et al., 2010 | 1.2 | rs34516251 | 1.23 | GGGCGA | 1.4 | 0.2 | 0.17 | Figure 12.iii | B-lymphocyte, lymphoblastoid, Epithelial | Monocyte |
| TNFSF4 | rs2205960 | Han et al., 2009 | 1.3 | rs4916313 | 1.3 | TCCATCTTCGA | 1.3 | 0 | 0 | Figure 13.i | Epithelial cell (Lung), Fibroblast, HeLa-S3 | no data |
| NMNAT2-SMG7 | rs2022013 | Cunninghame Graham et al., 2011 | 1 | rs111487113 | 1.3 | TCACTAAC | 1.3 | 0.3 | 0 | Figure 13.ii | Primary Th1 T cells | no data |
| XKR6 | rs11783247 | Harley et al., 2008 | 1.2 | rs7000132 | 1.2 | TGTCGCGGCTT | 1.2 | 0.03 | 0.03 | Figure 13.iii | Neuroblastoma, Mammary gland, Fibroblast | Monocyte |
Additional files
-
Supplementary file 1
(A) SLE patients and controls analyzed in this study (B) Genomic intervals of SLE risk loci targeted for sequencing (C) Characteristics of unannotated/novel common variants (MAF≥0.05) detected in this study (D) Peak association signal detected for each of the 28 SLE risk loci (E) Association status of previously published GWAS tagging SNPs (F) Sequencing variants that are strongly associated with SLE.
- https://doi.org/10.7554/eLife.12089.021
-
Supplementary file 2
Summary of functional properties of all variants in tight LD with disease tagging SNPs used for haplotype analysis.
- https://doi.org/10.7554/eLife.12089.022
-
Supplementary file 3
(A) Conditional analysis on SLE associated 16 peak SNPs.(B) Calculation of joint PAR on 16 SLE risk loci.
- https://doi.org/10.7554/eLife.12089.023
Download links
A two-part list of links to download the article, or parts of the article, in various formats.
Downloads (link to download the article as PDF)
Open citations (links to open the citations from this article in various online reference manager services)
Cite this article (links to download the citations from this article in formats compatible with various reference manager tools)
Regulatory polymorphisms modulate the expression of HLA class II molecules and promote autoimmunity
eLife 5:e12089.
https://doi.org/10.7554/eLife.12089


